Hispanic Fact Pack 2008
31
Annual Guide to Hispanic Marketing and Media 2008 Edition Published July 28, 2008 © Copyright 2008 Crain Communications Inc. H I S P A N I C FACT PACK
-
Upload
laura-flores -
Category
Documents
-
view
221 -
download
0
Transcript of Hispanic Fact Pack 2008
7/31/2019 Hispanic Fact Pack 2008
http://slidepdf.com/reader/full/hispanic-fact-pack-2008 1/31
Annual Guideto HispanicMarketingand Media
2008 Edition
Published July 28, 2008© Copyright 2008 Crain Communications Inc.H
I S P A N I C
FACT
PACK

7/31/2019 Hispanic Fact Pack 2008
http://slidepdf.com/reader/full/hispanic-fact-pack-2008 2/31

7/31/2019 Hispanic Fact Pack 2008
http://slidepdf.com/reader/full/hispanic-fact-pack-2008 3/31

7/31/2019 Hispanic Fact Pack 2008
http://slidepdf.com/reader/full/hispanic-fact-pack-2008 4/31
6 | Advertising Age | 2008 Hispanic Fact Pack
ADVERTISING
& MARKETINGHISPANIC MEDIA AD SPENDING GROWTH RATESVersus all U.S. measured media ad spending growth, 2003 to 2007
Hispanic media data from HispanTelligence, research arm of Hispanic Business, based on input from TNS Media Intelligence, media industryexperts, advertising agencies and public records. All U.S. media data from TNS Media Intelligence.
AD SPENDING BY CATEGORY IN HISPANIC MEDIAU.S. GROSS MEASURED ADVERTISING SPENDING
RANK CATEGORY 2007 2006 % CHG
1 Automotive $725,276 $717,583 1.1
2 Retail 584,427 601,538 -2.8
3 Telecommunications, internet services and ISP 549,622 513,760 7.0
4 Food, beverages & candy 285,507 327,377 -12.8
5 Restaurants 280,936 250,340 12.2
6 Movies, recorded video & music 274,236 359,035 -23.6
7 General services 246,315 218,157 12.9
8 Personal care 227,560 237,304 -4.1
9 Medicine & remedies 203,281 170,456 19.3
10 Financial services 167,420 139,233 20.2
Dollars in thousands. Media from TNS Media Intelligence represents combined totals for TV from broadcast TV networks, Galavision (cable)and Spanish-language spot TV stations; print from Spanish-language magazines (including four PIB-monitored Spanish-languagemagazines) and Spanish-language newspapers and Hispanic web sites. Categories aggregated by Ad Age. Only the top 10 are shown.
2003
2004
2005
2006
2007
U.S. Hispanic media
All U.S. media
0 3.75 7.5 11.25 15%
PERCENT CHANGE
6.1%
13.3%
10.8%
9.8%
10.8%
6.8%
3.0%
3.8%
4.2%
0.2%

7/31/2019 Hispanic Fact Pack 2008
http://slidepdf.com/reader/full/hispanic-fact-pack-2008 5/31
8 | Advertising Age | 2008 Hispanic Fact Pack
HISPANIC MEDIA AD SPENDINGU.S. measured media ad spending
ADVERTISING SPENDINGMEDIUM 2007 2006 % CHG
Network/national TV $1,789.4 $1,733.9 3.2
Local TV 707.0 690.1 2.5
National radio 221.3 214.3 3.3
Local radio 524.1 511.7 2.4
National newspapers (excl. classified) 123.8 120.7 2.5
Local newspapers (excl. classified) 185.8 182.0 2.0
Internet 179.9 132.0 36.3
Magazines 110.6 100.2 10.4
Out-of-home 86.2 83.9 2.8
Total 3,928.0 3,768.7 4.2
GROSS PRINT MEDIA AD REVENUEU.S. advertising revenue for Hispanic print media, including classified
GROSS ADVERTISING SPENDING PUBLICATIONS COUNTED AUDITED
MEDIUM 2007 2006 % CHG 2007 2006 2007
Newspapers 1 $1,117 $1,124 -0.6 827 768 160
Magazines 391 360 8.6 521 513 46
Other 2 60 55 9.1 576 570 5
Total 1,568 1,539 1.9 1,924 1,851 211
OUT-OF-HOME: $86 MILLION; 2.2%
MAGAZINE: $111 MILLION; 2.8%TV: $2.50 BILLION; 63.6%
RADIO: $745 MILLION; 19.0%
NEWSPAPER: $310 MILLION; 7.9%
INTERNET: $180 MILLION; 4.6%
Dollars in millions. Data from HispanTelligence, the research arm of Hispanic Business. National totals based on input from TNS MediaIntelligence, media industry experts, advertising agencies and public records. Figures are net (media-retained) ad expenditures.
Dollars in millions. Data from Latino Print Network. 1) Includes classified advertising. 2) Other includes annuals, catalogs, journals,newsletters and Yellow Pages.

7/31/2019 Hispanic Fact Pack 2008
http://slidepdf.com/reader/full/hispanic-fact-pack-2008 6/31
10 | Advertising Age | 2008 Hispanic Fact Pack
RANK MARKETER 2007 AD SPENDING % CHG
1 Lexicon Marketing Corp. $218,108.2 24.4
2 Procter & Gamble Co. 163,078.1 -4.3
3 AT&T 119,320.6 -10.0
4 General Motors Corp. 100,848.6 -2.7
5 Broadcasting Media Partners (Univision) 91,273.3 -14.8
6 McDonald’s Corp. 89,676.7 6.6
7 Toyota Motor Corp. 80,687.6 16.9
8 Sears Holdings Corp. 79,568.9 -4.5
9 Verizon Communications 79,277.8 -12.8
10 Johnson & Johnson 76,791.4 -3.6
11 Ford Motor Co. 73,406.0 -0.3
12 Walt Disney Co. 67,025.2 3.8
13 Cerberus Capital Management (incl. Chrysler) 66,109.7 1.9
14 Nissan Motor Co. 61,314.9 82.7
15 Wal-Mart Stores 59,890.3 -10.3
16 TVAtlas.com 55,071.6 14.8
17 Hyundai Corp. 53,945.2 -12.8
18 America Directo 52,466.3 14.2
19 Sprint Nextel Corp. 51,752.2 98.3
20 Deutsche Telekom 50,085.0 15.4
21 Allstate Corp. 46,979.9 26.4
22 Olympia 43,158.0 NA
23 Unilever 42,791.4 -4.6
24 SABMiller 41,957.2 -8.7
25 L’Oreal 41,713.3 -10.5
TOP ADVERTISERS IN HISPANIC MEDIA: 1 TO 25By measured U.S. media spending
Dollars in thousands. Media from TNS Media Intelligence and represent the sum of broadcast TV networks, Galavision (cable), Spanish-language magazines (including four PIB-monitored Spanish-language magazines), Spanish-language newspapers and Spanish-languagespot TV and Spanish-language web sites. Ranking continues on Page 12. Percent change is computed from 2006 data.
7/31/2019 Hispanic Fact Pack 2008
http://slidepdf.com/reader/full/hispanic-fact-pack-2008 7/31
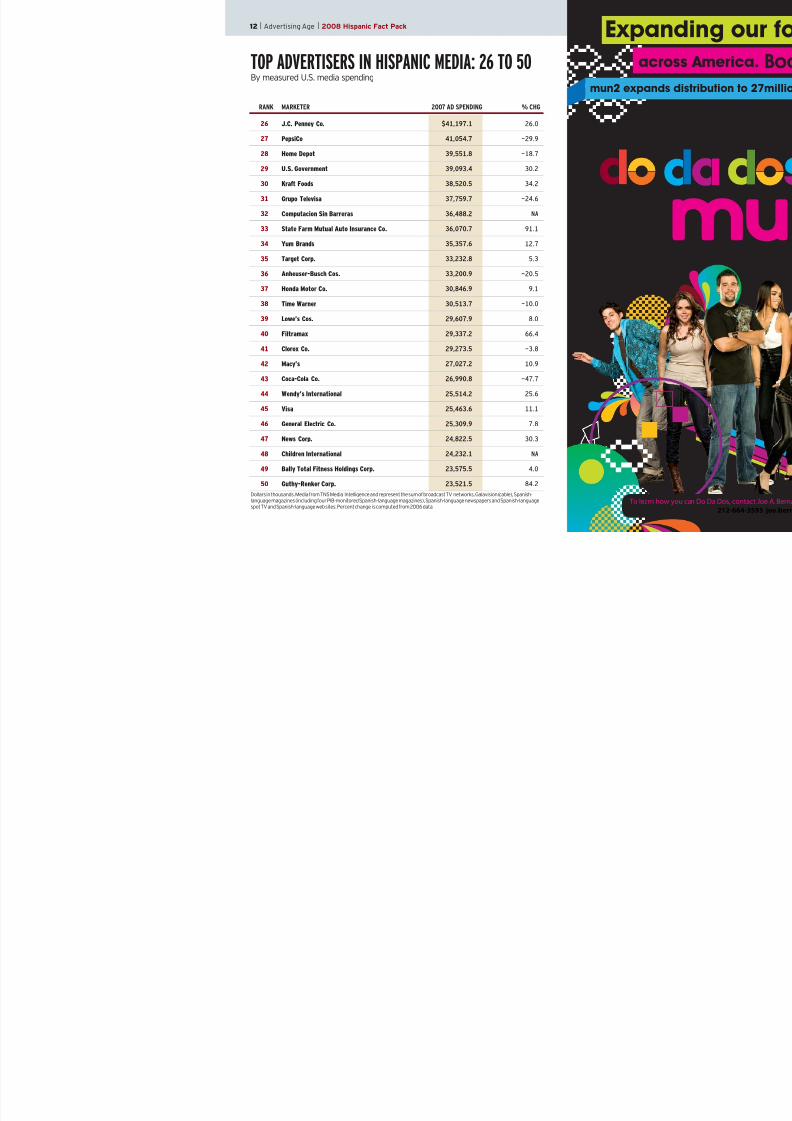
12 | Advertising Age | 2008 Hispanic Fact Pack
RANK MARKETER 2007 AD SPENDING % CHG
26 J.C. Penney Co. $41,197.1 26.0
27 PepsiCo 41,054.7 -29.9
28 Home Depot 39,551.8 -18.7
29 U.S. Government 39,093.4 30.2
30 Kraft Foods 38,520.5 34.2
31 Grupo Televisa 37,759.7 -24.6
32 Computacion Sin Barreras 36,488.2 NA
33 State Farm Mutual Auto Insurance Co. 36,070.7 91.1
34 Yum Brands 35,357.6 12.7
35 Target Corp. 33,232.8 5.3
36 Anheuser-Busch Cos. 33,200.9 -20.5
37 Honda Motor Co. 30,846.9 9.1
38 Time Warner 30,513.7 -10.0
39 Lowe’s Cos. 29,607.9 8.0
40 Filtramax 29,337.2 66.4
41 Clorox Co. 29,273.5 -3.8
42 Macy’s 27,027.2 10.9
43 Coca-Cola Co. 26,990.8 -47.7
44 Wendy’s International 25,514.2 25.6
45 Visa 25,463.6 11.1
46 General Electric Co. 25,309.9 7.8
47 News Corp. 24,822.5 30.3
48 Children International 24,232.1 NA
49 Bally Total Fitness Holdings Corp. 23,575.5 4.0
50 Guthy-Renker Corp. 23,521.5 84.2
TOP ADVERTISERS IN HISPANIC MEDIA: 26 TO 50By measured U.S. media spending
Dollars in thousands. Media from TNS Media Intelligence and represent the sum of broadcast TV networks, Galavision (cable), Spanish-language magazines (including four PIB-monitored Spanish-language magazines), Spanish-language newspapers and Spanish-languagespot TV and Spanish-language web sites. Percent change is computed from 2006 data.

7/31/2019 Hispanic Fact Pack 2008
http://slidepdf.com/reader/full/hispanic-fact-pack-2008 8/31
14 | Advertising Age | 2008 Hispanic Fact Pack
TOP 25 ADVERTISERS IN HISPANIC NEWSPAPERSBy measured U.S. newspaper ad spending
RANK MARKETER 2007 AD SPENDING % CHG
1 Interbond Corp. of America $5,289.0 258.6
2 Gobierno Del Estado/Chihuahua 3,224.4 63.0
3 Macy’s 3,211.9 -5.6
4 Sears Holdings Corp. 3,018.7 -27.2
5 Verizon Communications 2,888.8 -32.1
6 Rooms To Go 2,833.1 -9.8
7 Best Buy Co. 2,572.9 -23.7
8 Bank of America Corp. 2,447.6 3.1
9 Home Depot 2,360.7 -2.8
10 Target Corp. 2,280.1 -28.0
11 Broadcasting Media Partners (Univision) 2,194.3 -18.0
12 AT&T 2,037.1 -66.3
13 Sprint Nextel Corp. 1,958.7 -37.7
14 Washington Mutual 1,795.3 -29.3
15 Humana 1,680.4 50.7
16 Lowe’s Cos. 1,640.7 37.3
17 U.S. Century Bank 1,460.8 137.9
18 General Motors Corp. 1,434.9 5.1
19 Bankrate 1,430.2 54.6
20 General Electric Co. 1,374.4 -20.0
21 Walt Disney Co. 1,299.0 -40.1
22 Cerberus Capital Management (incl. Chrysler) 1,242.6 -15.4
23 Publix Supermarkets 1,234.0 8.4
24 State Farm Mutual Auto Insurance Co. 1,167.1 61.5
25 City of Miami 1,015.1 -31.5
Dollars in thousands. Measured newspaper ad spending from TNS Media Intelligence. Percent change is computed from 2006 data.Automotive dealers and associations are excluded.

7/31/2019 Hispanic Fact Pack 2008
http://slidepdf.com/reader/full/hispanic-fact-pack-2008 9/31
16 | Advertising Age | 2008 Hispanic Fact Pack
TOP 25 ADVERTISERS INSPANISH-LANGUAGE SPOT TVBy measured U.S. spot TV ad spending
RANK MARKETER 2007 AD SPENDING % CHG
1 AT&T $50,116.2 8.1
2 Ford Motor Co. 26,921.6 0.9
3 Nissan Motor Co. 25,921.8 103.8
4 Broadcasting Media Partners (Univision) 25,078.6 -20.0
5 Cerberus Capital Management (incl. Chrysler) 23,842.6 18.7
6 Ventura Entertainment Enterprises 20,856.9 -43.6
7 Yum Brands 18,475.1 18.5
8 Verizon Communications 17,548.1 -36.7
9 Guthy-Renker Corp. 16,275.6 162.2
10 Toyota Motor Corp. 15,639.5 22.4
11 General Motors Corp. 14,851.9 -26.2
12 McDonald’s Corp. 14,594.9 20.5
13 DirecTV Group 11,384.3 NA
14 Rooms To Go 11,298.7 0.4
15 Jack in the Box 9,898.9 -18.6
16 Famsa 9,755.3 8.2
17 Honda Motor Co. 9,101.4 29.8
18 Buenavida Enterprises 9,049.6 -34.5
19 Dish Network Corp. 8,551.4 104.3
20 Cablevision Systems Corp. 8,405.3 19.2
21 Hyundai Corp. 8,216.9 27.5
22 Washington Mutual 7,916.3 37.6
23 Time Warner 7,691.6 37.2
24 La Curacao Store 7,303.0 16.2
25 Empire Today 6,856.6 43.9
Dollars are in thousands. Measured spot TV ad spending from TNS Media Intelligence. Percent change is computed from 2006 data.Automotive dealers and associations and political advertising are excluded.

7/31/2019 Hispanic Fact Pack 2008
http://slidepdf.com/reader/full/hispanic-fact-pack-2008 10/31
18 | Advertising Age | 2008 Hispanic Fact Pack
TOP 25 ADVERTISERSIN NATIONAL SPANISH-LANGUAGE TVBy measured U.S. ad spending on broadcast and cable networks in 2007
RANK MARKETER 2007 AD SPENDING % CHG
1 Lexicon Marketing Corp. $214,316.8 23.5
2 Procter & Gamble Co. 144,198.2 -6.6
3 Sears Holdings Corp. 75,523.5 -2.0
4 McDonald’s Corp. 69,483.6 2.2
5 General Motors Corp. 68,153.7 -1.9
6 Johnson & Johnson 67,415.1 -5.0
7 AT&T 62,897.7 -17.9
8 Broadcasting Media Partners (Univision) 62,832.4 -13.9
9 Toyota Motor Corp. 58,521.2 18.4
10 Walt Disney Co. 57,246.3 7.9
11 Wal-Mart Stores 55,862.6 -7.5
12 TVAtlas.com 54,772.9 14.7
13 Verizon Communications 53,416.2 -4.1
14 America Directo 52,098.0 16.1
15 Deutsche Telekom 46,778.3 9.6
16 Olympia 42,773.4 NA
17 Hyundai Corp. 42,653.3 -19.1
18 Allstate Corp. 42,430.3 24.4
19 Sprint Nextel Corp. 41,682.0 126.5
20 Unilever 40,385.0 2.5
21 Ford Motor Co. 37,602.7 -7.5
22 PepsiCo 37,361.0 -26.6
23 J.C. Penney Co. 37,276.7 25.4
24 Home Depot 36,135.4 -20.8
25 SABMiller 35,878.4 -18.0
Dollars in thousands. Measured ad spending from TNS Media Intelligence for Univision, Telemundo and TeleFutura TV networks andGalavision cable TV network. Percent change computed from 2006 data.

7/31/2019 Hispanic Fact Pack 2008
http://slidepdf.com/reader/full/hispanic-fact-pack-2008 11/31
20 | Advertising Age | 2008 Hispanic Fact Pack
TOP 10 ADVERTISERS IN HISPANIC SPOT RADIOBy measured U.S. Spanish-language ad spending
RANK MARKETER 2007 AD SPENDING % CHG
1 Broadcasting Media Partners (Univision) $20,091.2 -35.1
2 Verizon Communications 9,915.8 0.2
3 Sprint Nextel Corp. 9,760.5 109.9
4 McDonald’s Corp. 8,965.5 -10.7
5 AT&T 8,306.8 -12.2
6 General Electric Co. 7,627.5 -30.4
7 Toyota Motor Corp. 7,000.2 -22.8
8 J.C. Penney Co. 6,258.0 -15.4
9 Radio Shack Corp. 6,104.4 82.7
10 General Motors Corp. 5,899.5 -18.0
Dollars in thousands. Measured radio ad spending from Nielsen Monitor-Plus. Percent change is computed from 2006 data.

7/31/2019 Hispanic Fact Pack 2008
http://slidepdf.com/reader/full/hispanic-fact-pack-2008 12/31
22 | Advertising Age | 2008 Hispanic Fact Pack
TOP 25 ADVERTISERS IN HISPANIC MAGAZINESBy measured U.S. magazine ad spending
RANK MARKETER 2007 AD SPENDING % CHG
1 Procter & Gamble Co. $14,453.1 7.0
2 L’Oreal 11,193.8 -3.6
3 Johnson & Johnson 8,854.7 39.1
4 General Motors Corp. 8,389.3 29.0
5 Cerberus Capital Management (incl. Chrysler) 3,979.7 33.5
6 Berkshire Hathaway (incl. Geico) 3,877.8 77.1
7 McDonald’s Corp. 3,826.9 6.0
8 Time Warner 3,592.4 19.8
9 Kraft Foods 3,537.1 197.3
10 Toyota Motor Corp. 3,292.5 -5.1
11 U.S. Government 3,179.4 9.6
12 Clorox Co. 3,131.9 8.4
13 GlaxoSmithKline 3,062.5 245.1
14 Hyundai Corp. 2,836.0 55.4
15 Coty (JAB Investments) 2,767.4 11.3
16 AstraZeneca 2,720.6 -1.7
17 Ford Motor Co. 2,607.8 -13.1
18 Mosaico 2,603.9 18.1
19 Visa 2,549.0 22.0
20 Kimberly-Clark Corp. 2,437.9 50.6
21 Estee Lauder Cos. 2,303.5 -14.9
22 State Farm Mutual Auto Insurance Co. 2,224.4 310.6
23 Bayer 2,183.3 53.9
24 Target Corp. 2,123.3 139.1
25 Intima 2,021.1 -10.8
Dollars in thousands. Magazine ad spending from TNS Media Intelligence includes two media classifications: Spanish-language magazinesand four PIB-monitored Spanish-language magazines. They are People en Español, Nexos, RD Selecciones, Latina. Percent change iscomputed from 2006 data.
7/31/2019 Hispanic Fact Pack 2008
http://slidepdf.com/reader/full/hispanic-fact-pack-2008 13/31
24 | Advertising Age | 2008 Hispanic Fact Pack
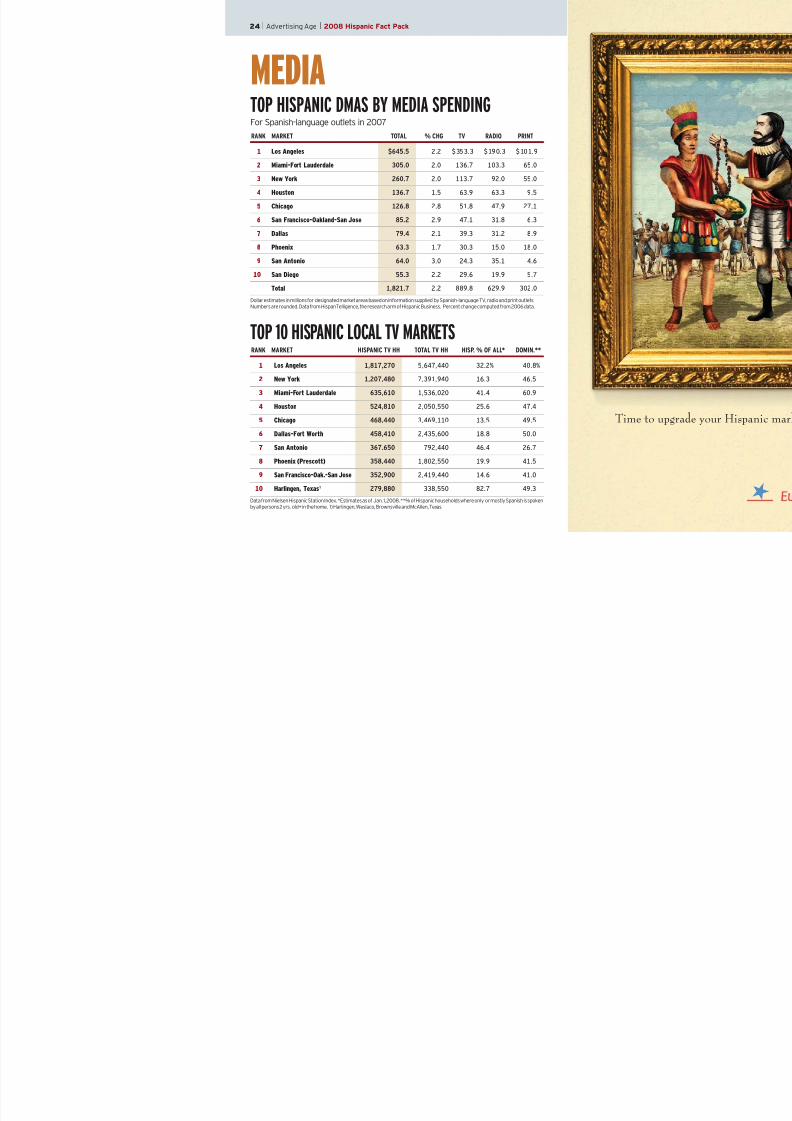
MEDIATOP HISPANIC DMAS BY MEDIA SPENDINGFor Spanish-language outlets in 2007
RANK MARKET TOTAL % CHG TV RADIO PRINT
1 Los Angeles $645.5 2.2 $353.3 $190.3 $101.9
2 Miami-Fort Lauderdale 305.0 2.0 136.7 103.3 65.0
3 New York 260.7 2.0 113.7 92.0 55.0
4 Houston 136.7 1.5 63.9 63.3 9.5
5 Chicago 126.8 2.8 51.8 47.9 27.1
6 San Francisco-Oakland-San Jose 85.2 2.9 47.1 31.8 6.3
7 Dallas 79.4 2.1 39.3 31.2 8.9
8 Phoenix 63.3 1.7 30.3 15.0 18.0
9 San Antonio 64.0 3.0 24.3 35.1 4.6
10 San Diego 55.3 2.2 29.6 19.9 5.7
Total 1,821.7 2.2 889.8 629.9 302.0
Dollar estimates in millions for designated market areas based on information supplied by Spanish-language TV, radio and print outlets.Numbers are rounded. Data from HispanTelligence, the research arm of Hispanic Business. Percent change computed from 2006 data.
TOP 10 HISPANIC LOCAL TV MARKETSRANK MARKET HISPANIC TV HH TOTAL TV HH HISP. % OF ALL* DOMIN.**
1 Los Angeles 1,817,270 5,647,440 32.2% 40.8%
2 New York 1,207,480 7,391,940 16.3 46.5
3 Miami-Fort Lauderdale 635,610 1,536,020 41.4 60.9
4 Houston 524,810 2,050,550 25.6 47.4
5 Chicago 468,440 3,469,110 13.5 49.5
6 Dallas-Fort Worth 458,410 2,435,600 18.8 50.0
7 San Antonio 367,650 792,440 46.4 26.7
8 Phoenix (Prescott) 358,440 1,802,550 19.9 41.5
9 San Francisco-Oak.-San Jose 352,900 2,419,440 14.6 41.0
10 Harlingen, Texas1 279,880 338,550 82.7 49.3
Data from Nielsen Hispanic Station Index. *Estimates as of Jan. 1, 2008. **% of Hispanic households where only or mostly Spanish is spokenby all persons 2 yrs. old+ in the home. 1) Harlingen, Weslaco, Brownsville and McAllen, Texas.

7/31/2019 Hispanic Fact Pack 2008
http://slidepdf.com/reader/full/hispanic-fact-pack-2008 14/31
26 | Advertising Age | 2008 Hispanic Fact Pack
TOP 25 HISPANIC NEWSPAPERSBy measured advertising revenue, excluding classified
RANK NEWSPAPER GROSS 2007 AD REVENUE % CHG
1 El Nuevo Herald (Miami) $90,450.6 8.6
2 La Opinion (Los Angeles) 45,910.3 -12.5
3 El Diario (Juarez, Mexico) 33,712.8 6.9
4 El Diario La Prensa (New York) 25,710.3 0.6
5 Hoy (Chicago) 20,088.6 41.0
6 Hoy (Los Angeles) 12,929.6 -0.1
7 La Raza (Chicago) 11,649.5 11.4
8 El Norte (El Paso, Texas/Juarez, Mexico) 10,754.1 17.5
9 Hoy (New York) 10,625.4 -16.3
10 Washington Hispanic 10,393.2 -13.9
11 TV y Mas (Phoenix) 6,821.0 -5.9
12 Al Dia (Dallas) 6,427.5 -16.2
13 La Voz de Phoenix 6,311.3 -5.3
14 El Sentinel (Miami-Fort Lauderdale) 6,148.1 -25.8
15 Diario Las Americas (Miami) 5,969.2 -6.1
16 Prensa Hispana (Phoenix) 3,871.3 -14.5
17 Lawndale News (Chicago) 3,862.9 -14.2
18 La Voz de Houston 3,828.1 -15.1
19 Vida en El Valle (Fresno, Calif.) 3,785.4 -46.1
20 Al Dia (Philadelphia) 3,213.4 -25.0
21 El Latino (San Diego) 3,153.0 -15.7
22 El Especial (New York) 2,837.7 -0.1
23 El Mensajero (San Francisco) 2,406.5 -15.8
24Excelsior (Orange County, Calif.) 2,257.0 -17.6
25 Reflejos (Chicago) 2,210.9 47.4
Dollars are in thousands. Measured newspaper ad spending from TNS Media Intelligence. Figures exclude classified advertising, select localretail categories, internet advertising and circulation revenue. Not all advertising editions are monitored. Percent change is computed fromfigures for 2006.

7/31/2019 Hispanic Fact Pack 2008
http://slidepdf.com/reader/full/hispanic-fact-pack-2008 15/31
28 | Advertising Age | 2008 Hispanic Fact Pack
TOP 25 HISPANIC MAGAZINESBy measured advertising revenue
RANK MAGAZINE 2007 AD REVENUE % CHG
1 People en Español $49,692.5 1.7
2 Latina 36,042.1 11.4
3 TV y Novelas 16,152.8 30.2
4 Selecciones (Reader’s Digest) 15,330.4 0.7
5 Siempre Mujer 12,890.5 39.5
6 Vanidades 12,607.8 5.0
7 Ser Padres 9,699.4 41.6
8 Hispanic Business 8,055.2 0.0
9 Mira 7,942.2 13.1
10 Sports Illustrated Latino 6,670.3 16.2
11 Hispanic Magazine 6,576.0 20.0
12 Fox Sports en Español Magazine 6,352.7 83.6
13 TV Notas 6,263.8 24.2
14 Healthy Kids en Español 5,624.5 -2.9
15 Fútbol Mundial 5,550.0 -13.5
16 Vista 5,131.9 4.4
17 Tu Ciudad Los Angeles* 4,959.9 68.1
18 Cosmopolitan en Español 4,896.4 -12.2
19 Espera 3,359.8 11.6
20 Selecta 3,316.6 11.2
21 Ocean Drive en Español 3,098.8 4.1
22 Sobre Ruedas 2,802.4 44.2
23 Casa y Hogar 2,729.2 -10.8
24 Alma Magazine 2,468.4 5.8
25 ESPN Deportes - La Revista 1,993.6 16.2
Dollars in thousands. Measured magazine ad spending from Media Economics Group’s HispanicMagazineMonitor through TelevisaPublishing. Percent change computed from 2006 data. *Emmis Publishing suspended publication of Tu Ciudad in June 2008.

7/31/2019 Hispanic Fact Pack 2008
http://slidepdf.com/reader/full/hispanic-fact-pack-2008 16/31
30 | Advertising Age | 2008 Hispanic Fact Pack
TOP 10 WEB PROPERTIES AMONG HISPANIC USERSBy language preference and number of unique visitors
SPANISH-LANGUAGE PREFERREDUNIQUE VISITORS
RANK PROPERTY IN THOUSANDS % REACH
1 Google sites 3,536 82.1
2 Microsoft sites 3,419 79.4
3 Yahoo sites 3,361 78.0
4AOL 2,399 55.7
5 Fox Interactive Media 2,397 55.6
6 Univision.com 1,886 43.8
7 eBay 1,803 41.8
8 Ask network 1,553 36.0
9 Apple 1,456 33.8
10 Amazon sites 1,229 28.5
ENGLISH-LANGUAGE PREFERREDUNIQUE VISITORS
RANK PROPERTY IN THOUSANDS % REACH
1 Yahoo sites 7,510 72.4
2 Google sites 7,265 70.1
3 Microsoft sites 6,032 58.2
4 AOL 5,673 54.7
5 Fox Interactive Media 5,456 52.6
6 eBay 3,461 33.4
7 Ask network 2,826 27.3
8 Amazon sites 2,534 24.4
9 Viacom Digital 2,468 23.8
10 Wikipedia sites 2,455 23.7
Data from comScore Media Metrix. Unique visitors are in thousands. Percent reach is the percent of all Hispanic internet users who preferSpanish (4.3 million in the top table) or English (10.4 million in the bottom table) who visited the property for the month of May 2008.

7/31/2019 Hispanic Fact Pack 2008
http://slidepdf.com/reader/full/hispanic-fact-pack-2008 17/31
32 | Advertising Age | 2008 Hispanic Fact Pack
TOP 10 HISPANIC WEB SITESBy measured U.S. web ad spending
RANK WEB SITE [URL, IF DIFFERENT] 2007 AD SPENDING % CHG
1 YahooTelemundo.com [telemundo.yahoo.com] $18,011.3 46.1
2 Univision.com 16,717.0 -45.7
3 StarMedia.com 13,531.0 10.1
4 Batanga.com 11,695.1 69.7
5 MSNLatino.com 9,465.1 27.6
6 LatinoAOL.com [latino.aol.com] 5,825.8 NA
7
La Opinion Digital.com [laopinion.com]5,332.5 130.2
8 ElHispanoNews.com 2,237.7 NA
9 ElNuevoHerald.com 1,803.7 77.4
10 ElDiarioNY.com 1,742.8 NA
Dollars are in thousands. Measured web ad spending from TNS Media Intelligence. Percent change is computed from 2006 data. TNSmonitors 44 Hispanic sites. Excludes paid search and broadband video.
7/31/2019 Hispanic Fact Pack 2008
http://slidepdf.com/reader/full/hispanic-fact-pack-2008 18/31
34 | Advertising Age | 2008 Hispanic Fact Pack
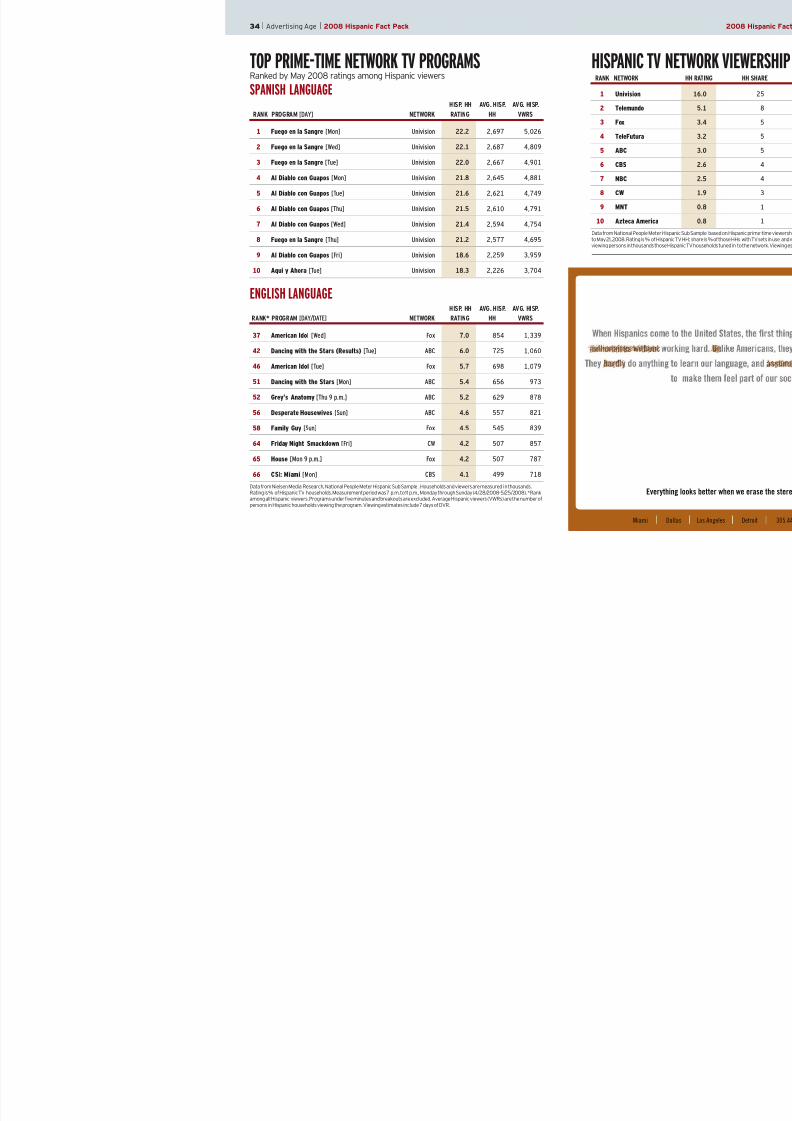
TOP PRIME-TIME NETWORK TV PROGRAMSRanked by May 2008 ratings among Hispanic viewers
SPANISH LANGUAGE HISP. HH AVG. HISP. AVG. HISP.
RANK PROGRAM [DAY] NETWORK RATING HH VWRS
1 Fuego en la Sangre [Mon] Univision 22.2 2,697 5,026
2 Fuego en la Sangre [Wed] Univision 22.1 2,687 4,809
3 Fuego en la Sangre [Tue] Univision 22.0 2,667 4,901
4 Al Diablo con Guapos [Mon] Univision 21.8 2,645 4,881
5 Al Diablo con Guapos [Tue] Univision 21.6 2,621 4,749
6 Al Diablo con Guapos [Thu] Univision 21.5 2,610 4,791
7 Al Diablo con Guapos [Wed] Univision 21.4 2,594 4,754
8 Fuego en la Sangre [Thu] Univision 21.2 2,577 4,695
9 Al Diablo con Guapos [Fri] Univision 18.6 2,259 3,959
10 Aqui y Ahora [Tue] Univision 18.3 2,226 3,704
ENGLISH LANGUAGEHISP. HH AVG. HISP. AVG. HISP.
RANK* PROGRAM [DAY/DATE] NETWORK RATING HH VWRS
37 American Idol [Wed] Fox 7.0 854 1,339
42 Dancing with the Stars (Results) [Tue] ABC 6.0 725 1,060
46 American Idol [Tue] Fox 5.7 698 1,079
51 Dancing with the Stars [Mon] ABC 5.4 656 973
52 Grey’s Anatomy [Thu 9 p.m.] ABC 5.2 629 878
56 Desperate Housewives [Sun] ABC 4.6 557 821
58 Family Guy [Sun] Fox 4.5 545 839
64 Friday Night Smackdown [Fri] CW 4.2 507 857
65 House [Mon 9 p.m.] Fox 4.2 507 787
66 CSI: Miami [Mon] CBS 4.1 499 718
Data from Nielsen Media Research, National People Meter Hispanic Sub Sample . Households and viewers are measured in thousands.Rating is % of Hispanic TV households. Measurement period was 7 p.m. to 11 p.m., Monday through Sunday (4/28/2008-5/25/2008). *Rankamong all Hispanic viewers. Programs under five minutes and breakouts are excluded. Average Hispanic viewers (VWRs) are the number ofpersons in Hispanic households viewing the program. Viewing estimates include 7 days of DVR.
| |

7/31/2019 Hispanic Fact Pack 2008
http://slidepdf.com/reader/full/hispanic-fact-pack-2008 19/31
36 | Advertising Age | 2008 Hispanic Fact Pack
TOP CABLE TV PROGRAMSAmong Hispanic viewers
SPANISH LANGUAGE HISP. HH AVG. HISP. AVG. HISP.
RANK PROGRAM [DATE] NETWORK RATING HH VWRS
1 Copa Libertadores Qtr Rd, Gm8 (2) [5/22]Fox Sports en Español 3.7 447 799
2 Fútbol Liga Mexicana [5/15] Galavision 2.8 343 475
3 Copa Libertadores Rd 16 - Gm13 (2) [5/7] Fox Sports en Español 2.6 313 469
4 Copa Libertadores Qtr Rd, Gm4 (2) [5/15] Fox Sports en Español 2.6 311 506
5 Copa Libertadores Rd 16 - Gm11 (2) [5/6] Fox Sports en Español 2.1 250 381
6 Fútbol Liga Mexicana [5/8] Galavision 1.9 225 382
7 Previa Qtr Final (2) [5/22] Fox Sports en Español 1.8 213 333
8 Vida Salvaje [5/13] Galavision 1.7 211 326
9 Fútbol Liga Mexicana [5/15] Galavision 1.7 208 338
10 Copa Campeone Final 2 (2) [4/30] Fox Sports en Español 1.7 202 296
ENGLISH LANGUAGEHISP. HH AVG. HISP. AVG. HISP.
RANK PROGRAM [DATE] NETWORK RATING HH VWRS
1 Zoey Movie - Chasing Zoey [5/2] Nickelodeon 6.1 742 1,138
2 Zoey 101 [5/2] Nickelodeon 6.1 737 1,095
3 NBA Playoffs [5/21] TNT 5.2 635 998
4 iCarly [5/2] Nickelodeon 4.7 567 882
5 NBA Playoffs [5/23] TNT 4.5 543 788
6 NBA Playoffs [5/25] TNT 4.4 537 845
7 Drake & Josh [4/28] Nickelodeon 4.4 536 651
8 SpongeBob [5/9] Nickelodeon 4.4 534 781
9 iCarly [5/12] Nickelodeon 4.2 514 612
10 NBA Playoffs [5/19] TNT 4.2 507 663
Data from Nielsen Media Research, National People Meter Hispanic Sub Sample . Households and viewers are measured in thousands.Rating is % of Hispanic TV households. Measurement period was 24 hours, Monday through Sunday (4/28/08-05/25/08). Programs underfive minutes and breakouts are excluded. Average Hispanic viewers (VWRs) are the number of persons in Hispanic households viewing theprogram. Viewing estimates include 7 days of DVR.
38 | Ad ti i A | 2008 Hi i F t P k

7/31/2019 Hispanic Fact Pack 2008
http://slidepdf.com/reader/full/hispanic-fact-pack-2008 20/31
38 | Advertising Age | 2008 Hispanic Fact Pack
TOP U.S. RADIO FORMATS BY AGE GROUPWith top Spanish-language formats breakout
SHARE % BY AGE GROUPRANK FORMAT 12+ 12-17 18-24 25-34 35-44
ALL FORMATS1 News, talk, info 19.1% 2.9% 4.8% 10.7% 16.1%
2 Adult contemporary 13.7% 10.0% 11.3% 13.9% 16.2%
3 Spanish-language 10.2% 7.6% 14.0% 17.2% 11.3%
4
Contemporary hits9.6% 37.4% 24.6% 13.9% 7.4%
5 Rock 6.9% 5.8% 9.0% 8.8% 9.5%
6 Urban 8.7% 14.6% 12.2% 10.1% 9.6%
SPANISH-LANGUAGE FORMATS*1 Mexican regional 4.1% 2.6% 7.2% 8.9% 4.4%
2 Spanish contemporary 1.9% 1.8% 7.2% 2.7% 2.2%
3 Spanish adult 1.1% 0.4% 2.4% 1.8% 1.5%
4 Spanish tropical 1.1% 0.8% 1.2% 1.5% 1.4%
5 Spanish news, talk 0.7% 0.1% 1.3% 0.4% 0.5%
6 Latino urban 0.5% 1.5% 0.1% 0.7% 0.4%
7 Spanish variety 0.4% 0.2% 1.3% 0.6% 0.4%
TOP 5 SPANISH-FORMATTED RADIO STATIONSBy cumulative listeners
RANK STATION (MARKET) OWNER LISTENERS
1 KLVE-FM (Los Angeles) Univision Communications 1,477,300
2 WSKQ-FM (New York) Spanish Broadcasting System 1,332,800
3 KSCA-FM (Los Angeles) Univision Communications 1,204,900
4 WPAT-FM (New York) Spanish Broadcasting System 1,161,400
5 KLAX-FM (Los Angeles) Spanish Broadcasting System 965,800
Source: Arbitron. Exported from Maximi$er, Fall 2007 National Regional Database, Top 100 Arbitron-rated markets, Monday-Sunday, 6 a.m.to midnight. *Spanish-language formats are a subset of Line 3 “Spanish-language” in the ALL FORMATS table.
40 | Advertising Age | 2008 Hispanic Fact Pack

7/31/2019 Hispanic Fact Pack 2008
http://slidepdf.com/reader/full/hispanic-fact-pack-2008 21/31
40 | Advertising Age | 2008 Hispanic Fact Pack
DIGITAL MEDIA USAGEINTERNET ACTIVITIES IN THE LAST 30 DAYSU.S. Hispanics versus non-Hispanics
SITE HISPANIC NON-HISPANIC
Visited a chat room 7.38% 4.14%
Used e-mail 46.84 63.62
Used Instant Messenger 25.87 24.53
Made a purchase for personal use 18.83 31.62
Made a purchase for business use 5.78 9.83
Made personal or business travel plans 11.70 18.06
Played games online 18.20 20.36
Obtained financial information 15.47 23.55
Tracked investments/traded stocks, bonds or mutual funds 4.40 10.98
Paid bills online 24.98 31.92
Obtained the latest news/current events 24.69 38.19
Obtained sports news/information 17.17 23.17
Obtained information for new or used car purchase 8.59 9.05
Obtained information about real estate 7.38 10.94
Obtained medical information 12.10 16.67
Obtained childcare or parenting information 5.24 4.01
Looked for employment 12.52 11.26
Looked for recipes 12.22 19.68
Visited a TV network or TV show’s website 12.11 14.96
Looked at TV listings online 5.23 6.12
Looked up movie listings or show times 12.46 15.64Listened to radio on the internet 11.38 10.18
Downloaded music 19.62 17.08
Downloaded podcasts/podcasting 2.09 2.87
Watched a live TV program 1.71 2.07
Visited online blogs 5.35 9.27
Wrote an online blog 2.30 3.72
Made a phone call 2.10 2.92
Watched online video 15.11 16.74
Shared photos through internet website 7.81 10.87
Sent an electronic greeting card 2.72 4.15
Source: Spring 2008 MRI Survey of the American Consumer. Survey dates were March of 2007 through April of 2008. Approximately26,000 adults were surveyed.
42 | Advertising Age | 2008 Hispanic Fact Pack

7/31/2019 Hispanic Fact Pack 2008
http://slidepdf.com/reader/full/hispanic-fact-pack-2008 22/31
42 | Advertising Age | 2008 Hispanic Fact Pack
TOP ONLINE MEMBER COMMUNITIESFor people of Hispanic origin ranked by unique audience
UNIQUE UNIQUE AUDIENCE
SITE AUDIENCE (000) COMPOSITION (%)
MySpace.com 7,112 11.7%
Blogger 3,388 8.6
Facebook 1,941 7.5
WordPress.com 1,786 10.4
Windows Live Spaces 1,033 13.5
Six Apart TypePad 855 7.7
MSN Groups 803 10.0
Classmates Online 706 4.9
Unique audience includes anyone of Hispanic origin who visited the site at least once during May 2008, and anyone who visited the sitemore than once was not counted again. Data include a combined, home and work panel of approximately 30,000 people 2 years old andover. For example, in May 2008 7.1 million unique visitors to Myspace.com were of Hispanic origin. Source: Nielsen NetRatings via MRI.

7/31/2019 Hispanic Fact Pack 2008
http://slidepdf.com/reader/full/hispanic-fact-pack-2008 23/31
46 | Advertising Age | 2008 Hispanic Fact Pack
7/31/2019 Hispanic Fact Pack 2008
http://slidepdf.com/reader/full/hispanic-fact-pack-2008 24/31
g g p
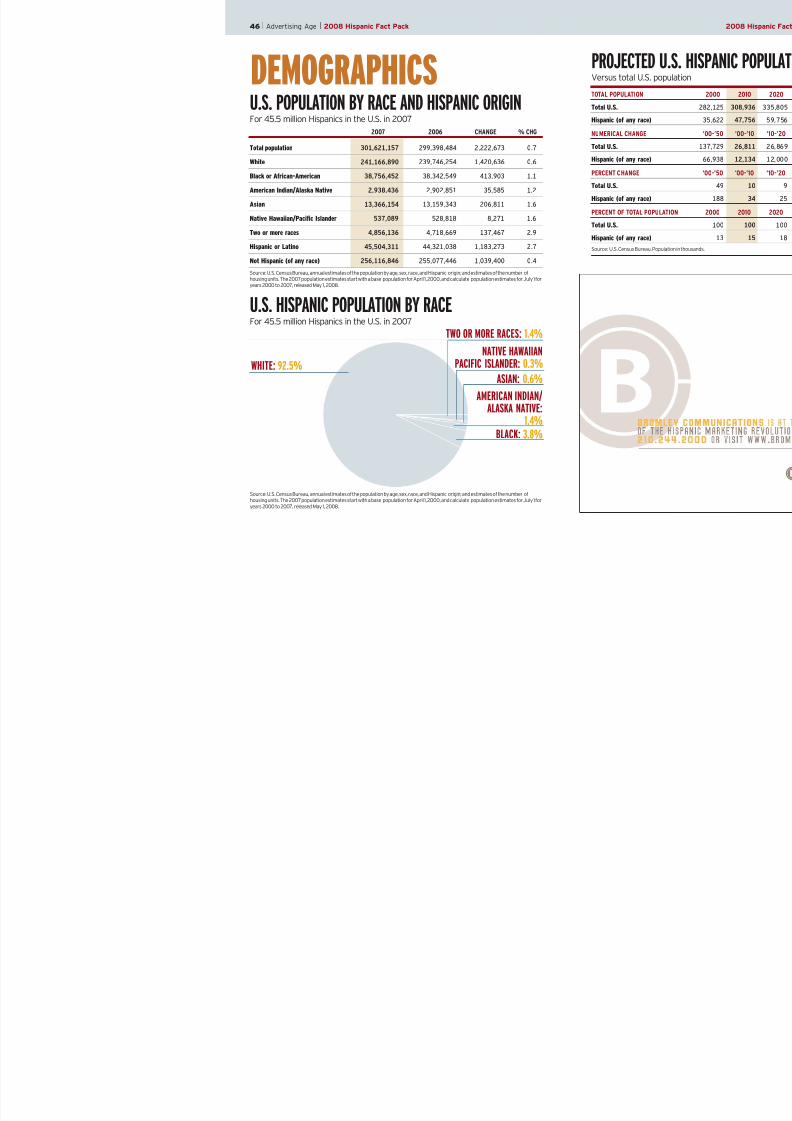
DEMOGRAPHICSU.S. POPULATION BY RACE AND HISPANIC ORIGINFor 45.5 million Hispanics in the U.S. in 2007
2007 2006 CHANGE % CHG
Total population 301,621,157 299,398,484 2,222,673 0.7
White 241,166,890 239,746,254 1,420,636 0.6
Black or African-American 38,756,452 38,342,549 413,903 1.1
American Indian/Alaska Native 2,938,436 2,902,851 35,585 1.2
Asian 13,366,154 13,159,343 206,811 1.6
Native Hawaiian/Pacific Islander 537,089 528,818 8,271 1.6
Two or more races 4,856,136 4,718,669 137,467 2.9
Hispanic or Latino 45,504,311 44,321,038 1,183,273 2.7
Not Hispanic (of any race) 256,116,846 255,077,446 1,039,400 0.4
Source: U.S. Census Bureau, annual estimates of the population by age, sex, race, and Hispanic origin; and estimates of the number ofhousing units. The 2007 population estimates start with a base population for April 1, 2000, and calculate population estimates for July 1 for
years 2000 to 2007, released May 1, 2008.
U.S. HISPANIC POPULATION BY RACEFor 45.5 million Hispanics in the U.S. in 2007
Source: U.S. Census Bureau, annual estimates of the population by age, sex, race, and Hispanic origin; and estimates of the number ofhousing units. The 2007 population estimates start with a base population for April 1, 2000, and calculate population estimates for July 1 foryears 2000 to 2007, released May 1, 2008.
TWO OR MORE RACES: 1.4%
NATIVE HAWAIIANPACIFIC ISLANDER: 0.3%
ASIAN: 0.6%AMERICAN INDIAN/
ALASKA NATIVE:1.4%
BLACK: 3.8%
WHITE: 92.5%
48 | Advertising Age | 2008 Hispanic Fact Pack

7/31/2019 Hispanic Fact Pack 2008
http://slidepdf.com/reader/full/hispanic-fact-pack-2008 25/31
TOP 25 U.S. HISPANIC MARKETSBy estimated 2008 population
HISPANIC HISPANICRANK MARKET AREA POPULATION % OF TOTAL
1 Los Angeles 8,507,000 48.1
2 New York 4,434,700 21.1
3 Miami 2,152,300 49.2
4 Houston 2,064,300 34.5
5 Chicago 1,972,700 20.3
6 Dallas-Fort Worth 1,757,500 25.9
7 San Francisco 1,712,300 23.7
8 Phoenix 1,378,200 27.4
9 San Antonio, Texas 1,259,400 54.6
10 McAllen, Texas 1,153,200 96.5
11 San Diego 998,200 33.1
12 Fresno-Visalia, Calif. 982,300 51.3
13 Sacramento 886,100 23.4
14 El Paso, Texas 817,200 85.9
15 Denver 791,000 20.8
16 Alburquerque, N.M. 767,600 45.0
17 Washington 688,600 11.1
18 Philadelphia 626,500 7.9
19 Atlanta 623,500 10.1
20 Las Vegas 532,500 28.5
21 Orlando, Fla. 529,600 14.8
22 Tampa, Fla. 521,200 12.0
23 Austin, Texas 496,600 29.6
24 Boston 465,100 7.3
25 Tucson, Ariz. (Nogales) 442,500 38.3
Data from Synovate's 2008 U.S. Diversity Markets Report. Figures are 2008 estimates.
50 | Advertising Age | 2007 Hispanic Fact Pack

7/31/2019 Hispanic Fact Pack 2008
http://slidepdf.com/reader/full/hispanic-fact-pack-2008 26/31
AGENCIES & WORK
BEST OF SHOW, HISPANIC CREATIVE AD AWARDS: GRUPO GALLEGOS, LONG BEACH, CALIF.The top spot promotes a package of cable TV, internet and voice services. “Ketchup”pitches Comcast’s Triple Play with an anthropomorphized wallet, forever showing grat-itude for a good deal on combined telecom. Here it shields its owner from a stain.
52 | Advertising Age | 2008 Hispanic Fact Pack

7/31/2019 Hispanic Fact Pack 2008
http://slidepdf.com/reader/full/hispanic-fact-pack-2008 27/31
HISPANIC CREATIVE AD AWARDSAGENCIES WON awards chosen from 717 entries, competing for Gold, Silver and Bronze inAdvertising Age’s 9th annual Hispanic Creative Advertising Awards contest in 2007. Thecontest was held in cooperation with the Association of Hispanic Advertising Agencies.The 2007 winners were honored at an awards show Nov. 2 in New York.
Awards were reported in the Hispanic Creative Advertising Awards SpecialReport (AA, Nov. 5, 2007). The full report with playable video of winning spots canbe found on AdAge.com.
A record 760 agency entries will compete for the 10th annual Hispanic CreativeAdvertising Awards. Winners will be announced at an awards ceremony Friday,Sept. 12, 2008, in Los Angeles, and in a Special Report in AdAge and AdAge.com on
Sept. 15, 2008.
BEST OF SHOW AND GOLD AWARD WINNERS
BEST OF SHOW BRAND CAMPAIGN
Grupo Gallegos, Long Beach, Calif. Comcast Triple Play “Ketchup”
GOLD/TV
Grupo Gallegos, Long Beach, Calif. Energizer E2 Lithium “Immortal”Grupo Gallegos, Long Beach, Calif. Calif. Milk Processor Board “Ley de Gravedad”
Grupo Gallegos, Long Beach, Calif. Calif. Milk Processor Board “Sueños,” “Risas,” “Ley de
Gravedad”
GOLD/NONTRADITIONAL, GUERRILLA MARKETING
JWT, San Juan Amnistía Internacional “La Casa del Horror”
GOLD/NEWSPAPERS
Conill, New York Procter & G amble’s Tide “Stains Attack: French Fry, Jam, Soup”
GOLD/OUT-OF-HOME
Badillo Nazca Saatchi & Saatchi, San Juan Verizon Wireless “Llamadas Interrumpidas: Mucho, Busca, Conmigo”
GOLD/BEYOND HISPANIC
LatinWorks, Austin, Texas Anheuser Busch’s Bud Light “Class”
GOLD/INTERACTIVE
Alma DDB, Miami McDonald’s Corp. “LoMcximo”
GOLD/DIRECT MARKETING
La Agencia de Orci & Asociados, Los Angeles Verizon FiOS campaign

7/31/2019 Hispanic Fact Pack 2008
http://slidepdf.com/reader/full/hispanic-fact-pack-2008 28/31
56 | Advertising Age | 2008 Hispanic Fact Pack

7/31/2019 Hispanic Fact Pack 2008
http://slidepdf.com/reader/full/hispanic-fact-pack-2008 29/31
HISPANIC AGENCIES RANKED 1 TO 25By U.S. revenue in 2007
RANK AGENCY [HOLDING COMPANY AFFILIATION] HEADQUARTERS REVENUE % CHG
1 Dieste Harmel & Partners* [Omnicom] Dallas $40,400 4.9
2 Bravo Group* [WPP] Miami 37,800 7.1
3 Vidal Partnership New York 31,000 19.2
4 Lopez Negrete Communications Houston 23,775 12.2
5 Bromley Communications* [Publicis] San Antonio 22,620 -3.3
6 Conill* [Publicis] Miami 20,900 20.1
7 GlobalHue*1 Southfield, Mich. 20,544 23.7
8 Zubi Advertising Services Coral Gables, Fla. 19,600 3.2
9 LatinWorks* [Omnicom] Austin, Texas 17,272 9.3
10 Casanova Pendrill* [Interpublic] Costa Mesa, Calif. 15,000 11.1
11 Accentmarketing* [Interpublic] Coral Gables, Fla. 14,278 -20.8
12 Hispanic Group Corp. Miami 13,172 -7.3
13 Alma DDB* [Omnicom] Coral Gables, Fla. 13,100 0.0
14 De la Cruz Group Guaynabo, Puerto Rico 13,038 3.5
15 La Agencia de Orci & Asociados Los Angeles 12,072 -24.7
16 Arvizu Advertising & Promotions Phoenix 11,800 15.1
17 Winglatino* [WPP] New York 10,000 0.0
18 Grupo Gallegos Long Beach, Calif. 9,520 12.0
19 Euro RSCG Latino* [Havas] New York 9,500 102.1
20 Machado/Garcia-Serra Coral Gables, Fla. 9,269 28.8
21 Vox Collective New York 8,986 37.4
22 Lopito Ileana & Howie Guaynabo, P.R. 8,157 17.1
23 Moroch Partners1 Dallas 7,898 5.1
24 Al Punto Tustin, Calif. 7,800 13.0
25 Acento Los Angeles 7,520 15.5
Dollars are in thousands. *Figures are Ad Age estimates. Data are from the 63rd Agency Report (AA, May 5, 2008). Agencies are ranked by100% of U.S. revenue unless Hispanic activities are less than 75% of revenue, in which case they are ranked at that percent of revenue.Holding companies may own only a minority stake. Notes continue on Page 58.
58 | Advertising Age | 2008 Hispanic Fact Pack

7/31/2019 Hispanic Fact Pack 2008
http://slidepdf.com/reader/full/hispanic-fact-pack-2008 30/31
HISPANIC AGENCIES RANKED 26 TO 50By U.S. revenue in 2007
RANK AGENCY [HOLDING COMPANY AFFILIATION] HEADQUARTERS REVENUE % CHG
26 Reynardus & Moya Advertising New York $7,433 -19.4
27 La Comunidad Miami Beach, Fla. $7,000 16.7
28 Tapestry* [Publicis] Chicago $6,831 10.0
29 San Jose Group Chicago $6,790 3.2
30 Hawkeye1 [Hawkeye Group] Dallas $6,365 7.1
31 LatinMedios.com Aventura, Fla. $6,297 108.2
32 Images USA1* Atlanta $6,255 84.2
33 Elevation2 Washington $6,150 69.1
34 Castells & Asociados Los Angeles $6,132 -0.8
35 Lapiz Hispanic Marketing* [Publicis] Chicago $5,800 -17.1
36 Siboney USA* [Interpublic] Coral Gables, Fla. $5,800 0.0
37 HeadQuarters Advertising San Francisco $5,250 12.9
38 MARCA Hispanic2 Coconut Grove, Fla. $5,235 14.9
39 Richards Group1 Dallas $4,980 3.8
40 Revolucion New York $4,948 49.0
41 Cruz/Kravetz:Ideas Los Angeles $4,791 -3.8
42 Cartel Group* San Antonio $4,786 0.0
43 Marketing Store1 Lombard, Ill. $4,540 -9.8
44 Creative Civilization* San Antonio $4,368 -6.7
45 Anderson Advertising* San Antonio $4,100 NA
46 CreativeOnDemand* Coconut Grove, Fla. $3,900 -15.2
47 McCann Healthcare Worldwide* [Interpublic] Parsippany, N.J. $3,738 4.6
48 RLR Advertising & Marketing* Pasadena, Calif. $3,653 0.0
49 Planit1 Baltimore $3,360 1.8
50 Viva Partnership Miami $3,360 11.0
Notes continued from Page 56. 1) Ad Age estimates total GlobalHue multicultural revenue at $42.8 million (Hispanic represents 48% of thetotal), up 23.7%. Hispanic activities represent 25% at Moroch Partners; 10% at Hawkeye; 45% at Images USA; 3% at Richards Group; 10%at Marketing Store; 3% at McCann Healthcare Worldwide; and 20% at Planit. 2) Added to the ranking after publication of the AgencyReport, May 5. This ranking was revised in August 2008. MARCA Hispanic, No. 38, was omitted from the original ranking. Mass HispanicMarketing, which was previously ranked No. 50, is now ranked No. 51 and does not appear on this revised chart.

7/31/2019 Hispanic Fact Pack 2008
http://slidepdf.com/reader/full/hispanic-fact-pack-2008 31/31