Hirotaka KAMAHORI (JMA)
27
1 2006.9.14 APEC Climate Center Symposium Hirotaka KAMAHORI (JMA)
Transcript of Hirotaka KAMAHORI (JMA)
1
2006.9.14 APEC Climate Center Symposium
Hirotaka KAMAHORI (JMA)
2
Contents
• JRA-25 overview
• Performance of JRA-25
• Plan of use and policy of JRA-25 data
• Announcement
3
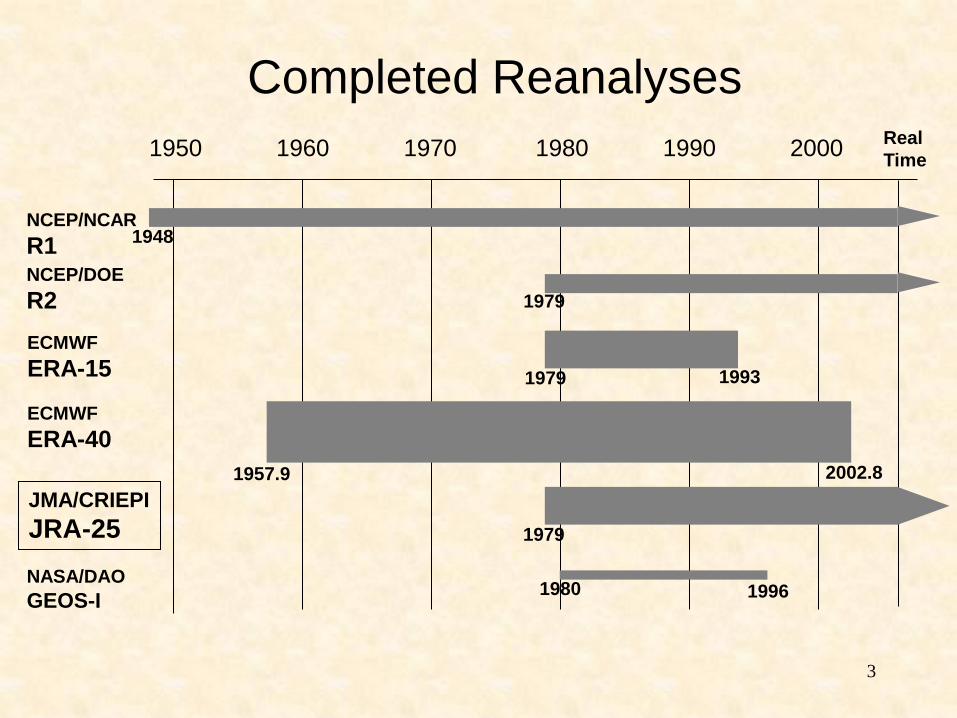
Completed Reanalyses
1960 1970 1980 1990 2000 1950
NCEP/NCAR
R1 NCEP/DOE
R2
ECMWF
ERA-15
ECMWF
ERA-40
JMA/CRIEPI
JRA-25
Real
Time
1948
1979
1979
1979
1993
1957.9 2002.8
NASA/DAO
GEOS-I 1980 1996
4
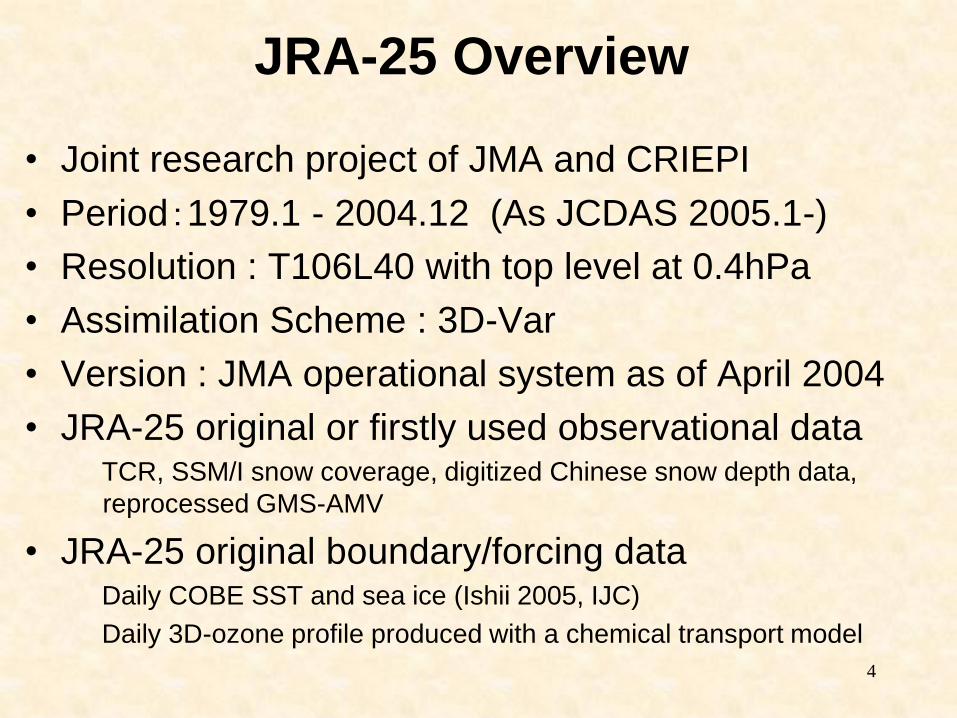
JRA-25 Overview
• Joint research project of JMA and CRIEPI
• Period:1979.1 - 2004.12 (As JCDAS 2005.1-)
• Resolution : T106L40 with top level at 0.4hPa
• Assimilation Scheme : 3D-Var
• Version : JMA operational system as of April 2004
• JRA-25 original or firstly used observational data TCR, SSM/I snow coverage, digitized Chinese snow depth data,
reprocessed GMS-AMV
• JRA-25 original boundary/forcing data Daily COBE SST and sea ice (Ishii 2005, IJC)
Daily 3D-ozone profile produced with a chemical transport model
5
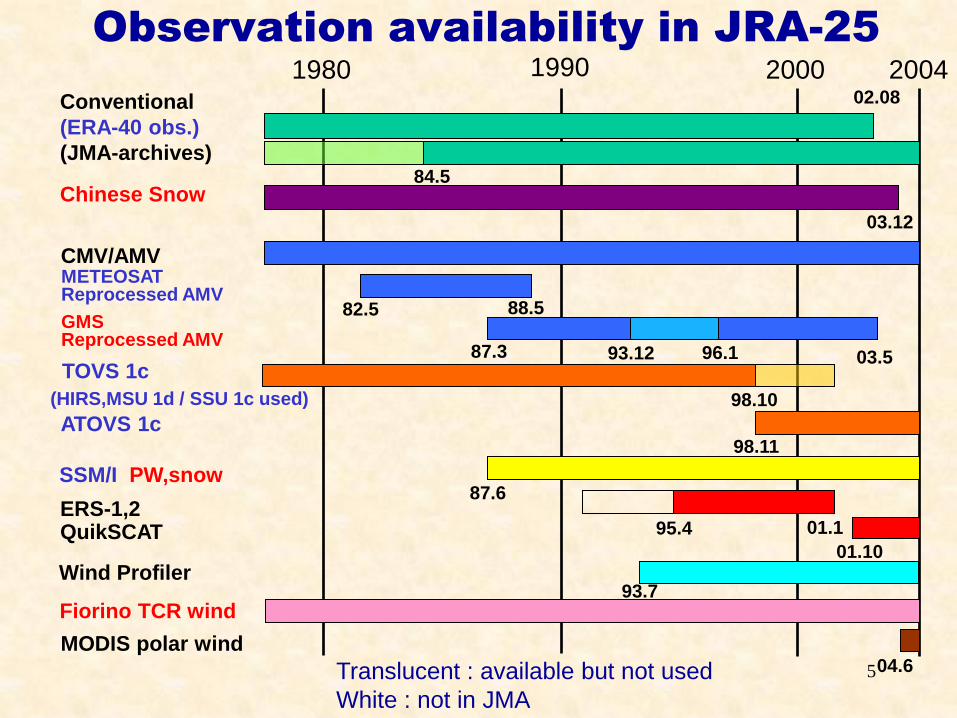
Observation availability in JRA-25
1980 1990 2000 2004
Translucent : available but not used
White : not in JMA
95.4 01.1
01.10
82.5
87.3
88.5
03.12
98.11
98.10
87.6
84.5
03.5
04.6
(HIRS,MSU 1d / SSU 1c used)
93.7
93.12 96.1
Conventional
(ERA-40 obs.)
(JMA-archives)
CMV/AMV METEOSAT Reprocessed AMV
GMS Reprocessed AMV
TOVS 1c
ATOVS 1c
ERS-1,2 QuikSCAT
Chinese Snow
SSM/I PW,snow
MODIS polar wind
Wind Profiler
Fiorino TCR wind
02.08
6
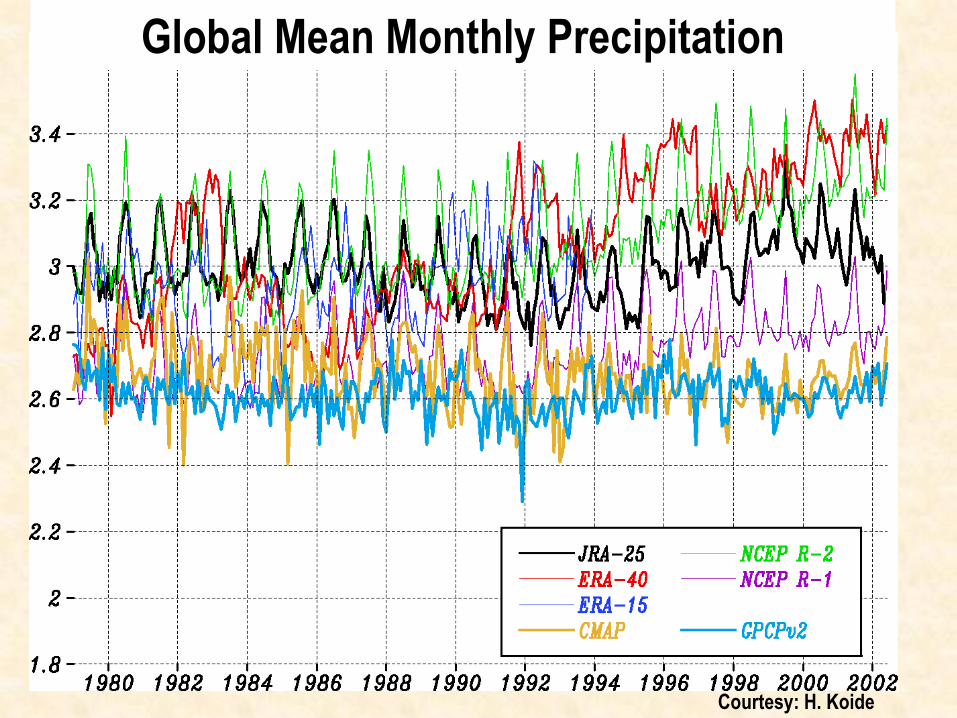
Courtesy: H. Koide
Global Mean Monthly Precipitation
7
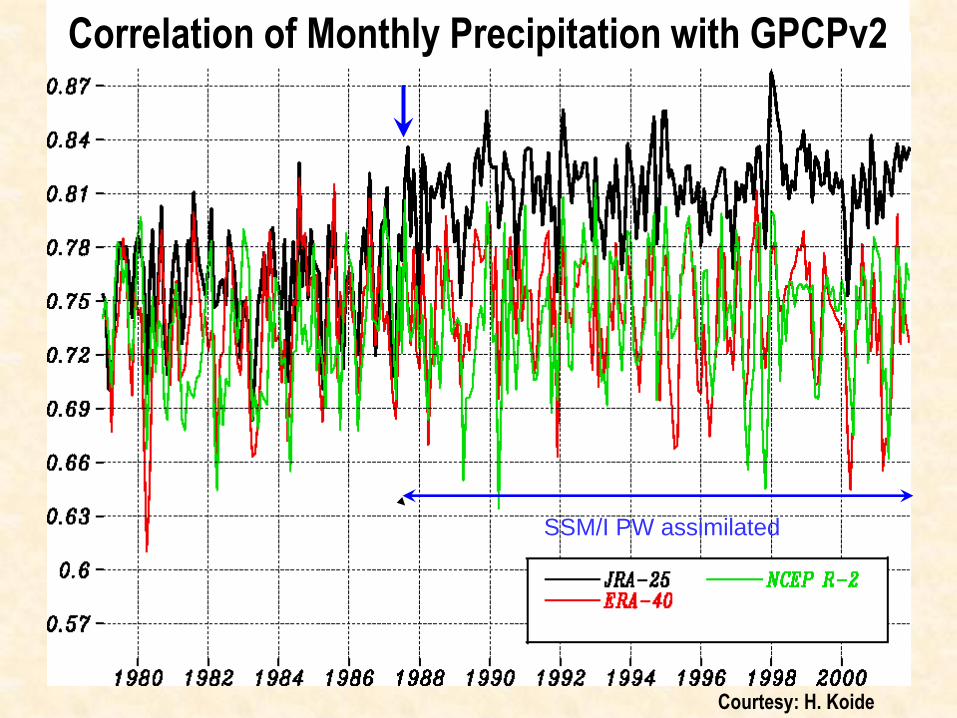
Courtesy: H. Koide
SSM/I PW assimilated
Correlation of Monthly Precipitation with GPCPv2
8
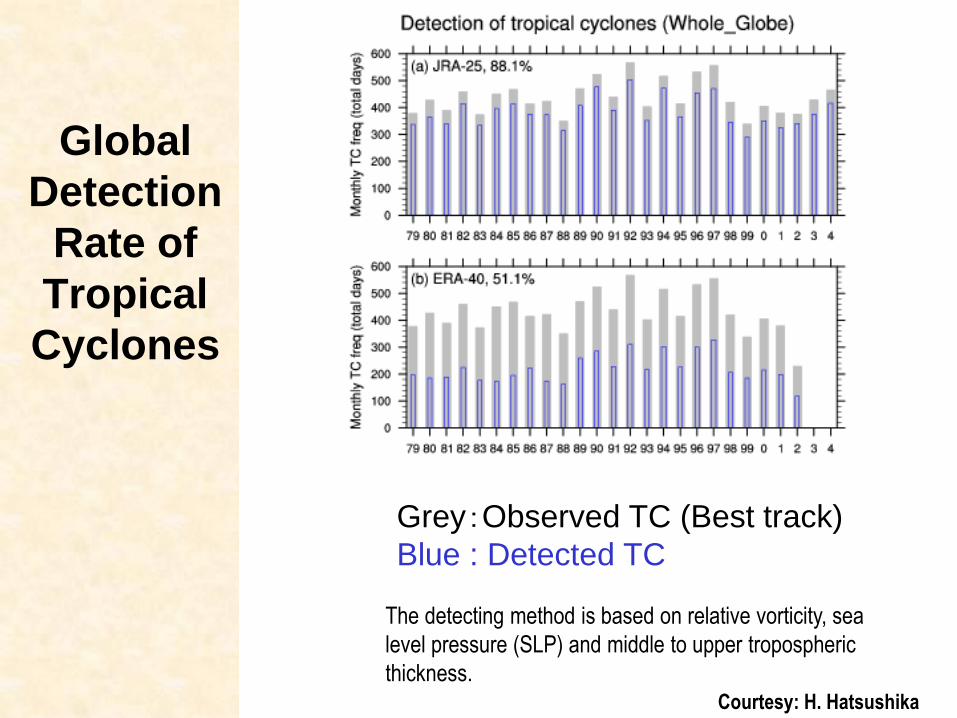
Global
Detection
Rate of
Tropical
Cyclones
Grey:Observed TC (Best track)
Blue : Detected TC
Courtesy: H. Hatsushika
The detecting method is based on relative vorticity, sea
level pressure (SLP) and middle to upper tropospheric
thickness.
9
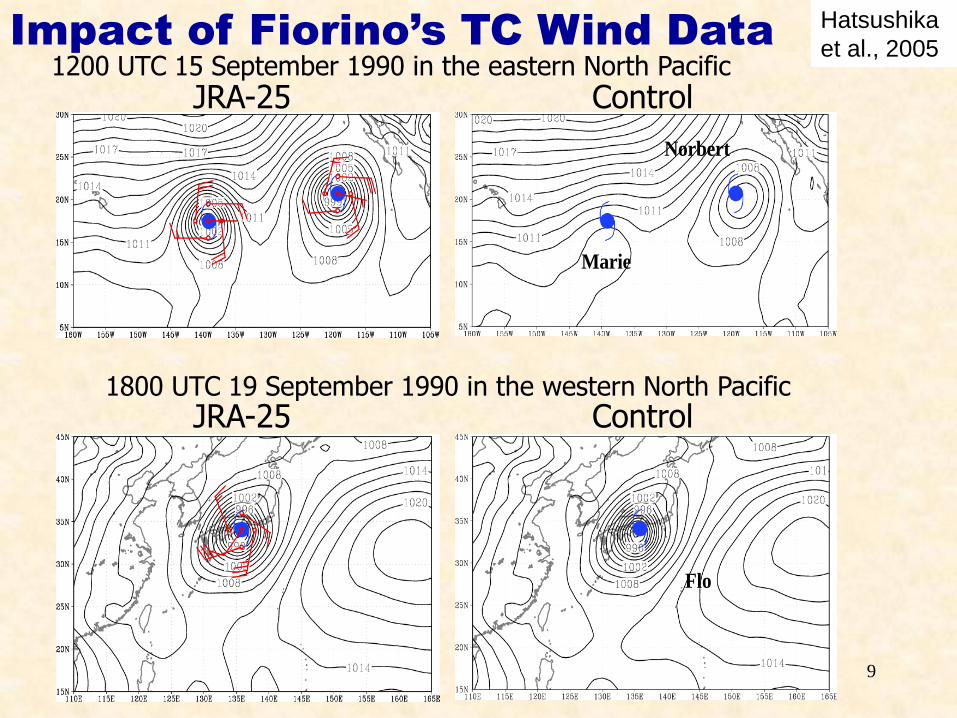
Impact of
TC Wind
Data
Norbert
Marie
Flo
1200 UTC 15 September 1990 in the eastern North Pacific
1800 UTC 19 September 1990 in the western North Pacific
JRA-25 Control
JRA-25 Control
Impact of Fiorino’s TC Wind Data Hatsushika
et al., 2005
10
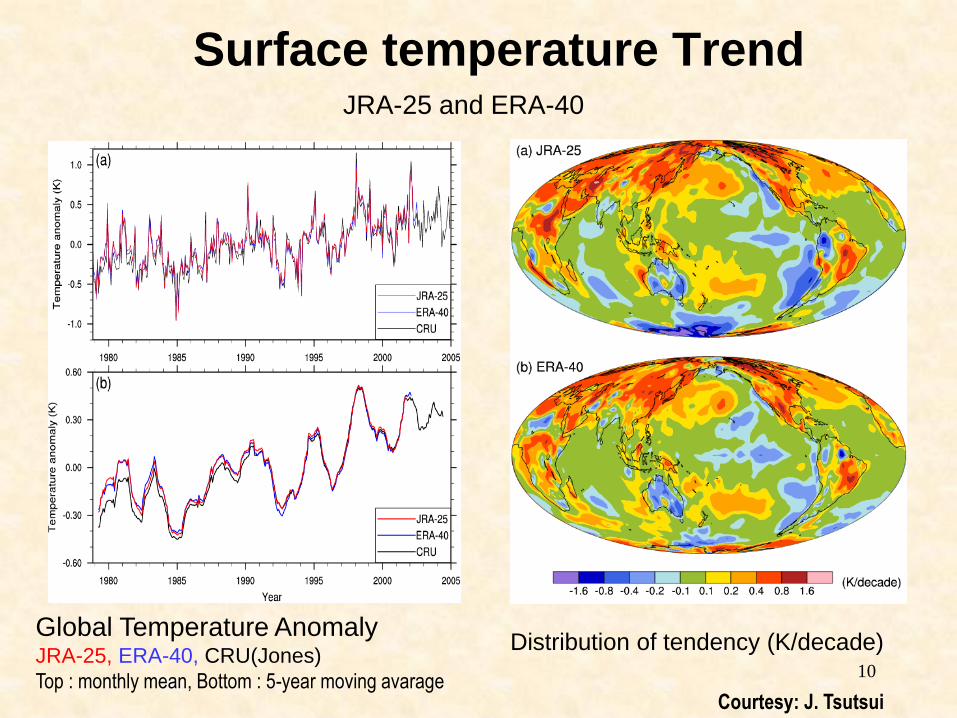
Surface temperature Trend
Global Temperature Anomaly JRA-25, ERA-40, CRU(Jones)
Top : monthly mean, Bottom : 5-year moving avarage
Distribution of tendency (K/decade)
JRA-25 and ERA-40
Courtesy: J. Tsutsui
11
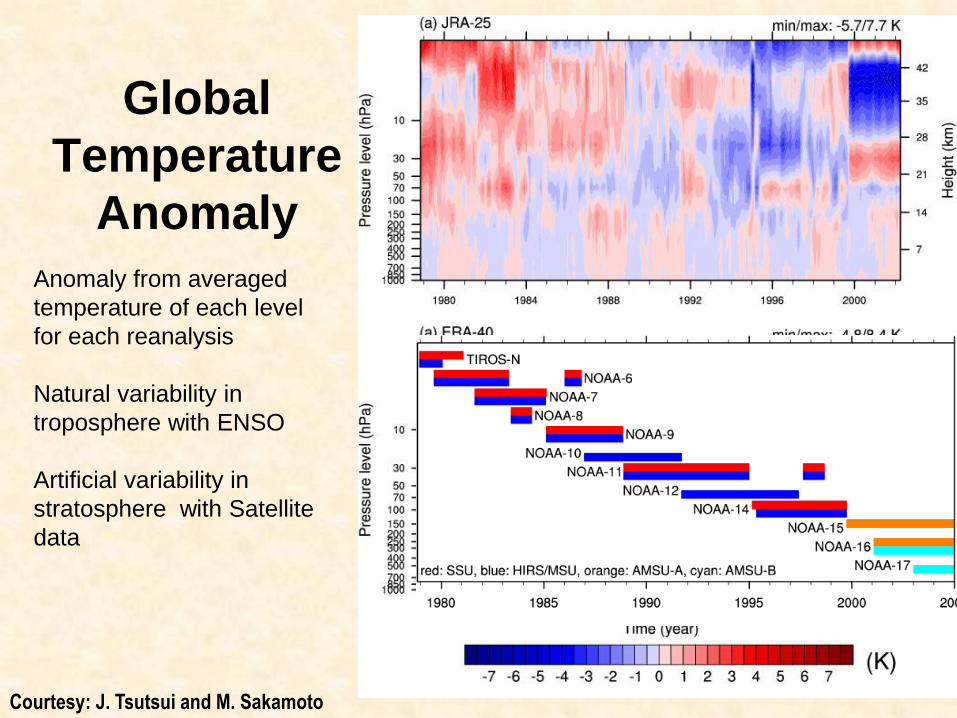
Global
Temperature
Anomaly
Anomaly from averaged
temperature of each level
for each reanalysis
Natural variability in
troposphere with ENSO
Artificial variability in
stratosphere with Satellite
data
Courtesy: J. Tsutsui and M. Sakamoto
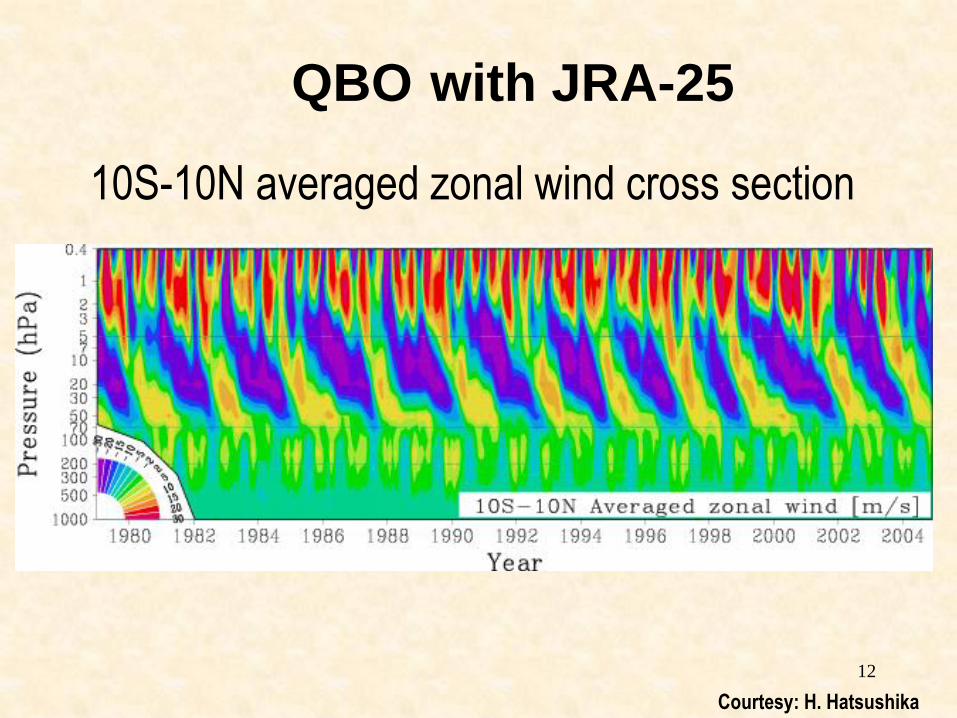
12
10S-10N averaged zonal wind cross section
QBO with JRA-25
Courtesy: H. Hatsushika
13
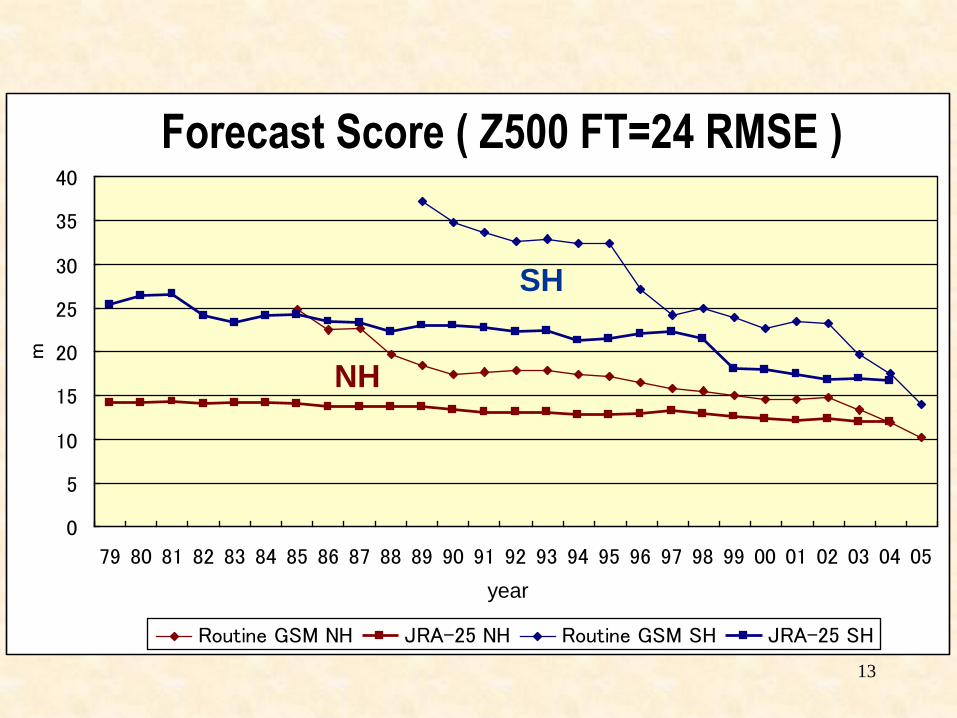
JRA-25を初期値とする予報のスコア(500hPa高度の24時間予報のRMSE)
0
5
10
15
20
25
30
35
40
79 80 81 82 83 84 85 86 87 88 89 90 91 92 93 94 95 96 97 98 99 00 01 02 03 04 05
年
m
Routine GSM NH JRA-25 NH Routine GSM SH JRA-25 SH
year
SH
NH
Forecast Score ( Z500 FT=24 RMSE )
14
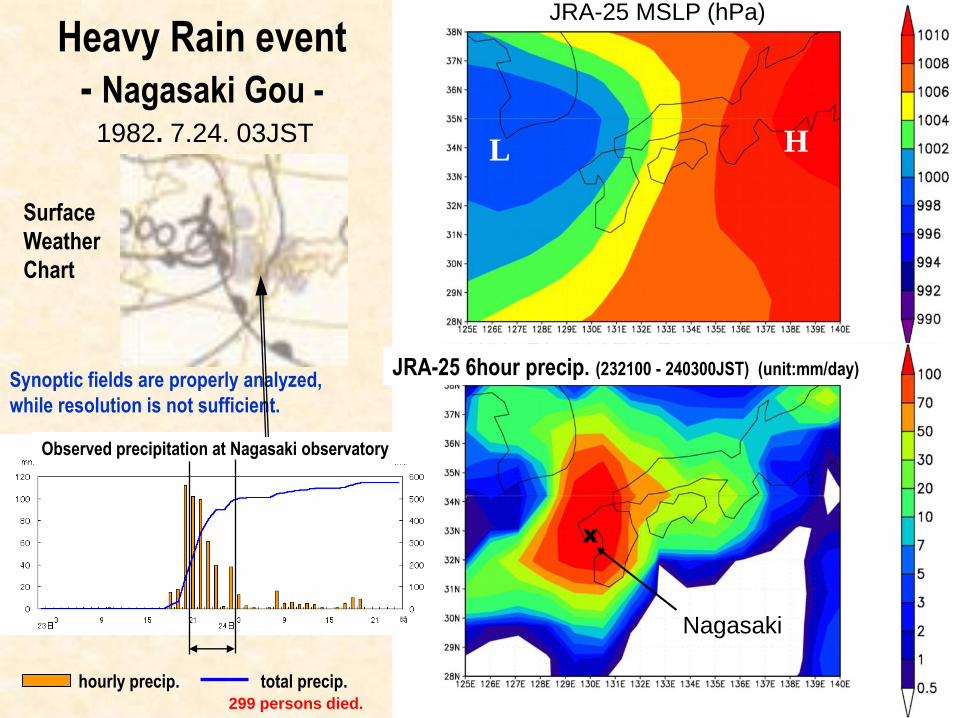
Heavy Rain event
- Nagasaki Gou -
Synoptic fields are properly analyzed,
while resolution is not sufficient.
1982. 7.24. 03JST
Surface
Weather
Chart
JRA-25 MSLP (hPa)
L H
JRA-25 6hour precip. (232100 - 240300JST) (unit:mm/day)
X
Nagasaki
hourly precip. total precip.
Observed precipitation at Nagasaki observatory
299 persons died.
15
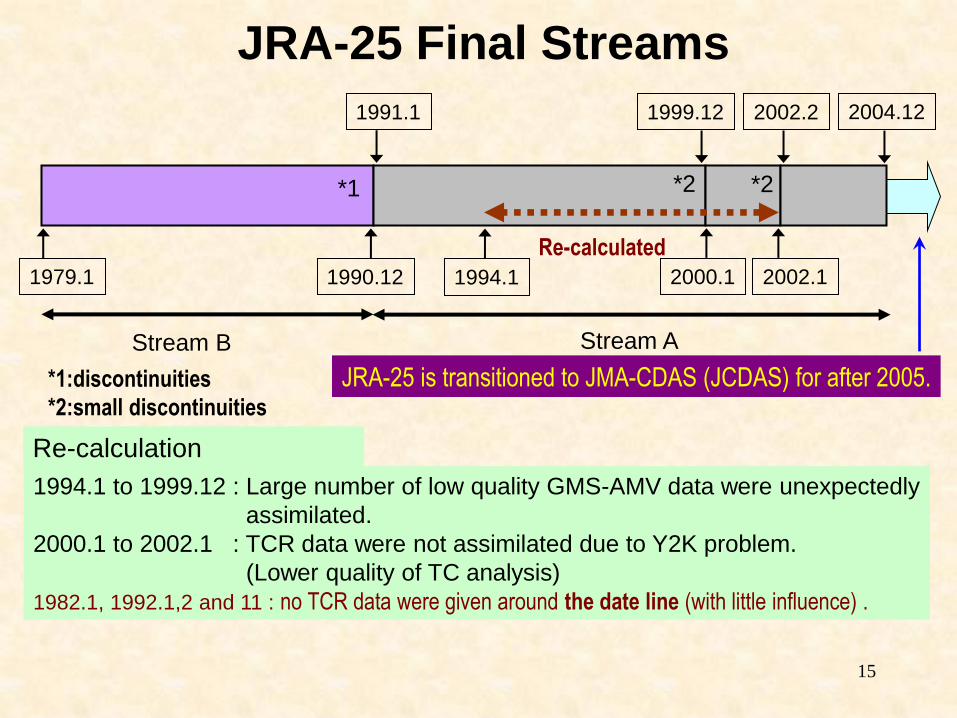
Re-calculation
1994.1 to 1999.12 : Large number of low quality GMS-AMV data were unexpectedly
assimilated.
2000.1 to 2002.1 : TCR data were not assimilated due to Y2K problem.
(Lower quality of TC analysis)
1982.1, 1992.1,2 and 11 : no TCR data were given around the date line (with little influence) .
JRA-25 is transitioned to JMA-CDAS (JCDAS) for after 2005. *1:discontinuities
*2:small discontinuities
Stream B Stream A
1991.1 1999.12 2002.2 2004.12
1979.1 1990.12 2000.1 2002.1 1994.1
Re-calculated
*1 *2 *2
JRA-25 Final Streams
16
JRA-25 official data
• Data from 1979 to 2004
• Released on 18th July 2006
• Data for the re-calculated period are replaced.
• The official data is supplied from a JMA data server.
http://jra.kishou.go.jp
17
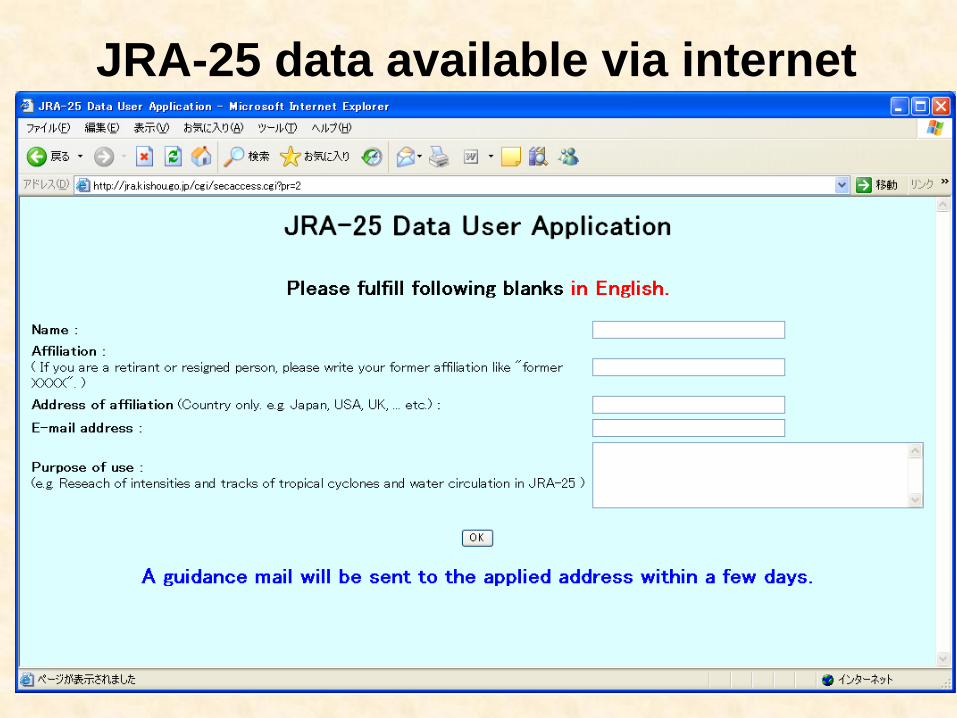
JRA-25 data available via internet
18
JRA-25 paper / report
• The JRA-25 Reanalysis
Submitted to JMSJ (Journal of
Meteorological Society of Japan) K. Onogi, J. Tsusui, H. Koide, M. Sakamoto, S. Kobayashi, H. Hatsushika,
T. Matsumoto, N. Yamazaki, H. Kamahori, K. Takahashi, S. Kadokura,
K. Wada, K. Kato, R. Oyama, T. Ose, N. Mannoji and R. Taira
• JRA-25 : Japanese 25-year Reanalysis
– progress and status –
Onogi et al., QJRMS special issue of the WMO 4th DA
workshop (April 2005), Vol.131, 3259-3268.
19
The 3rd Reanalysis Conference Co-hosting Organizations: JMA,CRIEPI, WCRP
To be held in Tokyo in January 2008
Announcement
International Programming Committee
Dr. Phillip Arkin (MD Univ.) Dr. Adrian Simmons (ECMWF)
Dr. Michael Fiorino (NHC) Dr. Detlef Stammer(Univ.Hamburg)
Dr. Eugenia Kalnay (MD Univ.) Dr. Masato Sugi (MRI/JMA)
Dr. Masao Kanamitsu (Scripps lab.) Dr. Kevin Trenberth (NCAR)
Dr. Toshio Koike (Univ. of Tokyo) Dr. Tadashi Tsuyuki (JMA)
Dr. Michael Manton (Monash Univ.) Dr. Tetsuzo Yasunari (Nagoya Univ.)
Dr. Siegfried Shubert (GMAO/NASA) Dr. Glenn White (NCEP)
Dr. Andrew Lorenc (UKMO)

20
The 3rd Reanalysis Conference
Tentative schedule
Dec. 2006 -- : call for paper
1st Jun. to 15th Jul. 2007 : registration period
16th Jul. to 20th Sep. 2007 : refereeing period
30th Sep. 2008 : program fixed

21
Thank you very much !
JMA

22
23
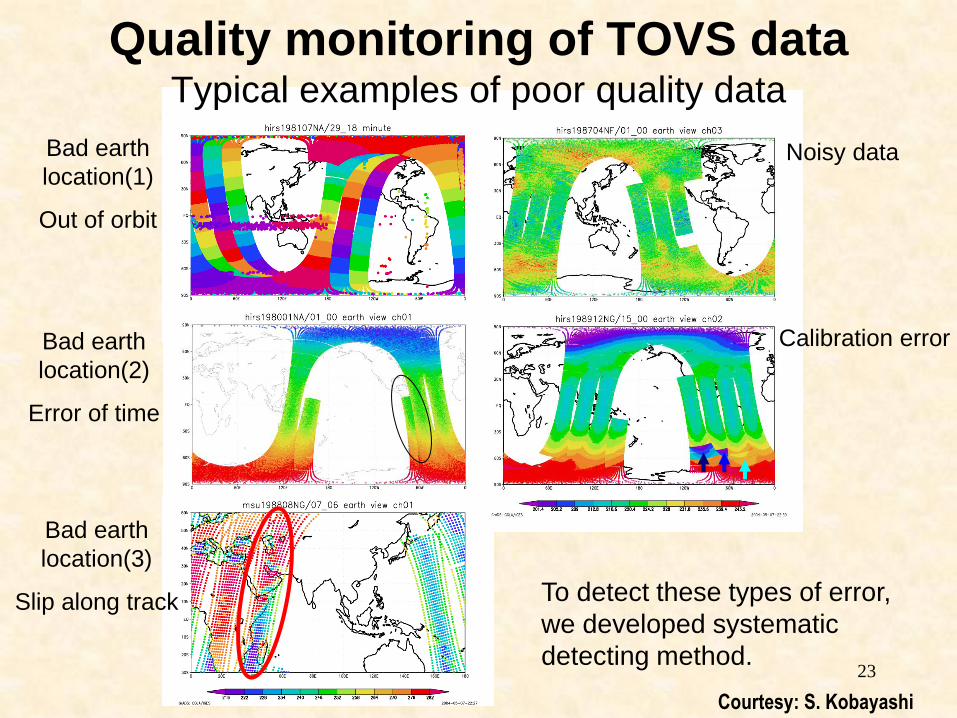
Quality monitoring of TOVS data Typical examples of poor quality data
Bad earth
location(1)
Out of orbit
Noisy data
Bad earth
location(2)
Error of time
Bad earth
location(3)
Slip along track
Calibration error
To detect these types of error,
we developed systematic
detecting method.
Courtesy: S. Kobayashi
24
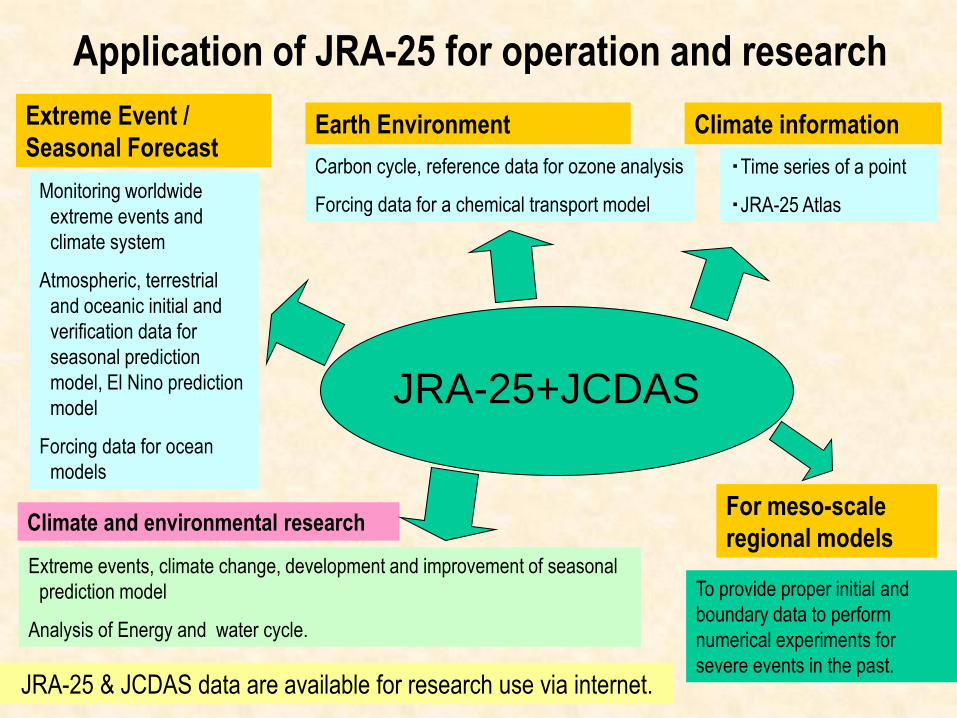
Application of JRA-25 for operation and research
Extreme Event /
Seasonal Forecast
Monitoring worldwide
extreme events and
climate system
Atmospheric, terrestrial
and oceanic initial and
verification data for
seasonal prediction
model, El Nino prediction
model
Forcing data for ocean
models
Earth Environment
Carbon cycle, reference data for ozone analysis
Forcing data for a chemical transport model
Climate and environmental research
Extreme events, climate change, development and improvement of seasonal
prediction model
Analysis of Energy and water cycle.
JRA-25+JCDAS
Climate information
・Time series of a point
・JRA-25 Atlas
JRA-25 & JCDAS data are available for research use via internet.
To provide proper initial and
boundary data to perform
numerical experiments for
severe events in the past.
For meso-scale
regional models
25
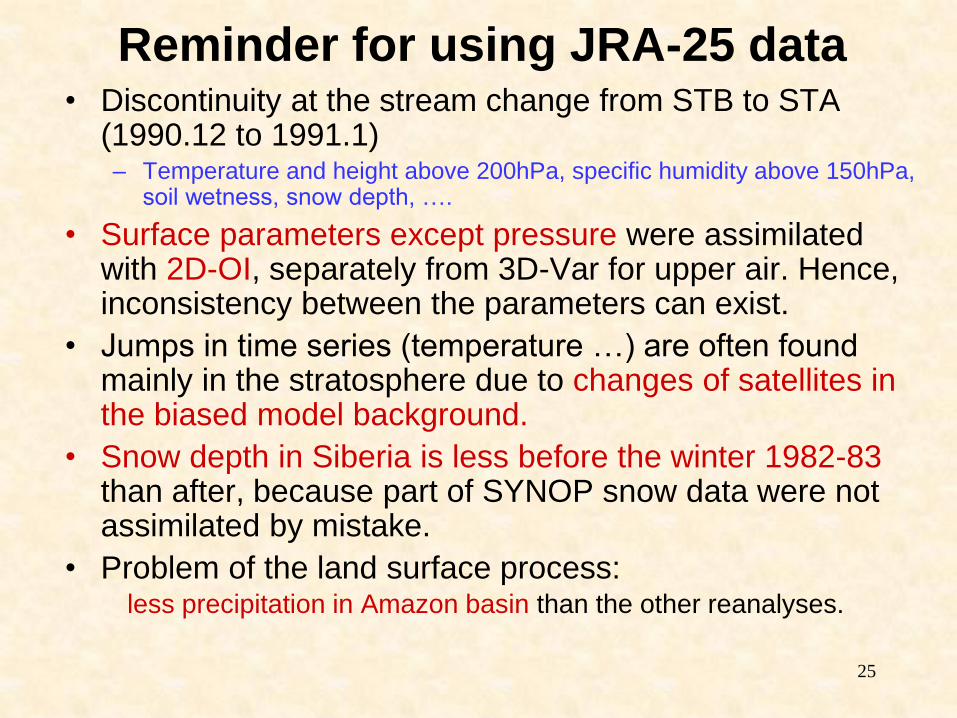
Reminder for using JRA-25 data • Discontinuity at the stream change from STB to STA
(1990.12 to 1991.1) – Temperature and height above 200hPa, specific humidity above 150hPa,
soil wetness, snow depth, ….
• Surface parameters except pressure were assimilated with 2D-OI, separately from 3D-Var for upper air. Hence, inconsistency between the parameters can exist.
• Jumps in time series (temperature …) are often found mainly in the stratosphere due to changes of satellites in the biased model background.
• Snow depth in Siberia is less before the winter 1982-83 than after, because part of SYNOP snow data were not assimilated by mistake.
• Problem of the land surface process: less precipitation in Amazon basin than the other reanalyses.
26
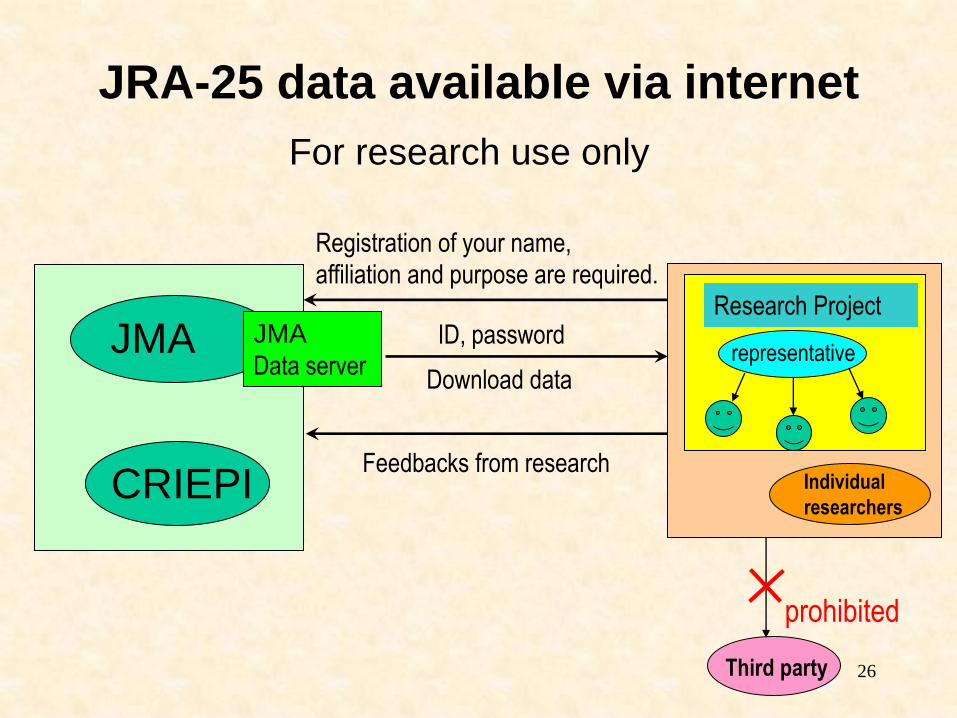
JRA-25 data available via internet
JMA
CRIEPI
For research use only
Registration of your name,
affiliation and purpose are required.
Third party
JMA
Data server Download data
Feedbacks from research
prohibited
Individual
researchers
Research Project
representative ID, password
27
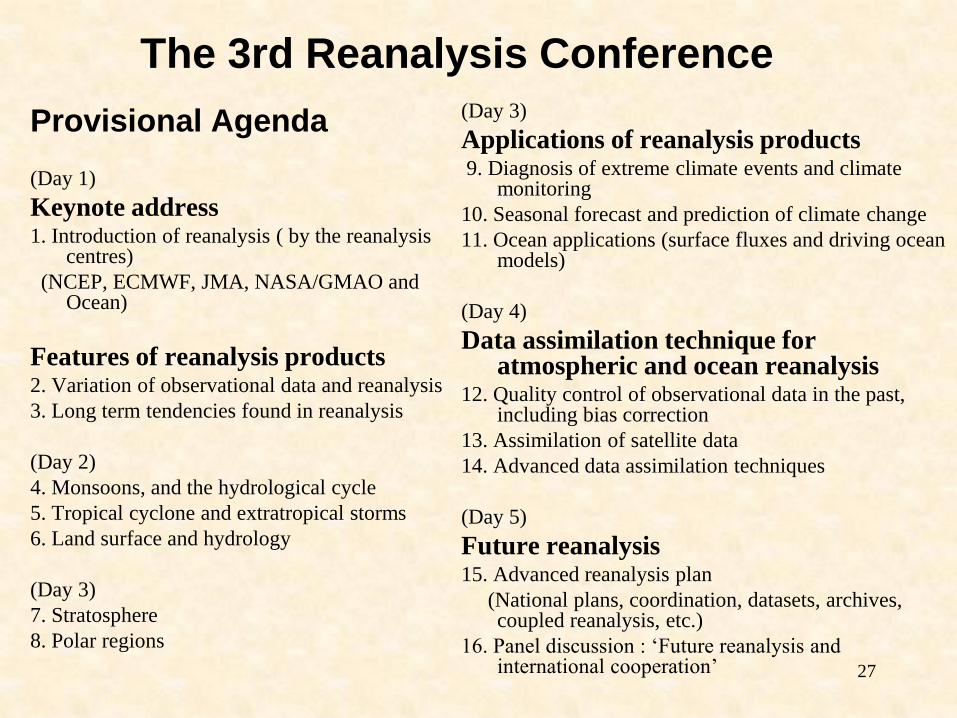
The 3rd Reanalysis Conference
Provisional Agenda
(Day 1)
Keynote address 1. Introduction of reanalysis ( by the reanalysis
centres)
(NCEP, ECMWF, JMA, NASA/GMAO and Ocean)
Features of reanalysis products 2. Variation of observational data and reanalysis
3. Long term tendencies found in reanalysis
(Day 2)
4. Monsoons, and the hydrological cycle
5. Tropical cyclone and extratropical storms
6. Land surface and hydrology
(Day 3)
7. Stratosphere
8. Polar regions
(Day 3)
Applications of reanalysis products 9. Diagnosis of extreme climate events and climate
monitoring
10. Seasonal forecast and prediction of climate change
11. Ocean applications (surface fluxes and driving ocean models)
(Day 4)
Data assimilation technique for atmospheric and ocean reanalysis
12. Quality control of observational data in the past, including bias correction
13. Assimilation of satellite data
14. Advanced data assimilation techniques
(Day 5)
Future reanalysis 15. Advanced reanalysis plan
(National plans, coordination, datasets, archives, coupled reanalysis, etc.)
16. Panel discussion : ‘Future reanalysis and international cooperation’