Hillsborough County Water Ferry Feasibility · PDF file · 2013-04-25Hillsborough...
71
February 2011 www.camsys.com Hillsborough County Water Ferry Feasibility Study prepared for Hillsborough County Metropolitan Planning Organization (MPO) prepared by Cambridge Systematics, Inc. Jacobs Engineering final report
-
Upload
vuongthien -
Category
Documents
-
view
222 -
download
3
Transcript of Hillsborough County Water Ferry Feasibility · PDF file · 2013-04-25Hillsborough...

February 2011 www.camsys.com
Hillsborough County Water Ferry Feasibility Study
prepared for
Hillsborough County Metropolitan Planning Organization (MPO)
prepared by
Cambridge Systematics, Inc.
Jacobs Engineering
final report


report
Hillsborough County Water Ferry Feasibility Study
prepared for
Hillsborough County Metropolitan Planning Organization (MPO)
prepared by
Cambridge Systematics, Inc. 500 East Broward Boulevard, Suite 1160 Fort Lauderdale, FL 33394
In association with
Jacobs Engineering
date
February 2011


Hillsborough County Water Ferry Feasibility Study
Hillsborough County MPO i
Table of Contents
Executive Summary ........................................................................................................ 1
1.0 Introduction ......................................................................................................... 1-1 1.1 Background .................................................................................................. 1-1 1.2 Study Purpose ............................................................................................. 1-1 1.3 Project Approach ........................................................................................ 1-3 1.4 Organization ................................................................................................ 1-3
2.0 Outreach ............................................................................................................... 2-1 2.1 Definition of Stakeholders ......................................................................... 2-1 2.2 Use of On-Line Survey ............................................................................... 2-4
Preliminary Findings .................................................................................. 2-4 MacDill AFB Findings ................................................................................ 2-5
3.0 Potential Station Locations, Routes, and Key System Characteristics ..... 3-1 3.1 study area ..................................................................................................... 3-1 3.2 Potential ferry station Locations ............................................................... 3-1 3.3 Preliminary ferry routes ............................................................................ 3-6
4.0 Travel Demand Estimation and Transportation Analysis .......................... 4-1 4.1 Methodology ............................................................................................... 4-2
Definition of Market Area ......................................................................... 4-2 Major Variables Considered in Ridership Estimate ............................... 4-3
Travel Time Savings .............................................................................. 4-3 Travel Cost Savings ............................................................................... 4-9 Frequency of service (Headway) ....................................................... 4-12 Community transit acceptance .......................................................... 4-12
Scoring System and Ridership Estimation ............................................ 4-12 4.2 Preliminary Screening of Ferry Routes .................................................. 4-13 4.3 Revised Ridership Estimate Based on MacDill AFB Survey .............. 4-19 4.4 Estimate of Costs and Revenues For Service To MacDill AFB ........... 4-21
5.0 Recommendations .............................................................................................. 5-1 5.1 Key Considerations for Next Steps Raised by Stakeholders ................ 5-1 5.2 Development of MacDill AFB Service ..................................................... 5-2

Table of Contents, continued
ii Cambridge Systematics, Inc. 7791.290
5.3 Other Opportunities ................................................................................... 5-3 5.4 Phase 2 Next Steps ...................................................................................... 5-3

Hillsborough County Water Ferry Feasibility Study
Hillsborough County MPO iii
List of Tables
Table 4.1 Ferry Route Distances .............................................................................. 4-4
Table 4.2 Assumed Values for Factors Related Ferry Travel Time ................... 4-6
Table 4.3 Travel Time Savings Per One-Way Trip ............................................... 4-7
Table 4.4 Travel Cost Savings Per One-Way Trip .............................................. 4-10
Table 4.5 Score for Each Ferry Route ................................................................... 4-14
Table 4.6 Ridership Estimate ................................................................................. 4-17
Table 4.7 Revised Ridership Estimate for MacDill AFB .................................... 4-20
Table 4.8 Estimate of Costs and Revenues - MacDill AFB & Gibsonton ......... 4-23
Table 4.9 Estimate of Costs and Revenues - MacDill AFB & Apollo Beach ....... 4-24
Table 4.10 Estimate of Total Costs and Revenues ................................................ 4-25
List of Figures, continued
iv Hillsborough County MPO
List of Figures
Figure ES.1 Initial Ferry Routes and Stations ............................................................... 2
Figure ES.2 Stakeholder Survey Webpage Screenshot ............................................... 3
Figure ES.3 Potential Vessel Selected for Analysis ...................................................... 5
Figure ES.4 Waterfront in Tampa Bay Region ............................................................. 6
Figure 1.1 TBARTA’s Long Term Regional and Supporting Network ............... 1-2
Figure 2.1 Study Fact Sheet ....................................................................................... 2-2
Figure 2.2 Initial Survey Results: Evaluation of Station Locations ...................... 2-5
Figure 2.3 Survey Results: MacDill AFB Respondents ......................................... 2-6
Figure 2.4 Examples of Other Comments from MacDill Respondents ............... 2-7
Figure 3.1 Initial Ferry Stations and Routes ............................................................ 3-2
Figure 3.2 Revised Ferry Stations and Routes ........................................................ 3-2
Figure 3.3 Ferry Station Locations – Apollo Beach ................................................ 3-3
Figure 3.4 Ferry Station Locations – Gibsonton ..................................................... 3-3
Figure 3.5 Ferry Station Locations – MacDill AFB ................................................. 3-4
Figure 3.6 Ferry Station Locations – Downtown St. Petersburg .......................... 3-4
Figure 3.7 Ferry Station Locations – Downtown Tampa ...................................... 3-5
Figure 3.8 Ferry Station Locations – Westshore ..................................................... 3-5
Figure 3.9 Examples of Waterway Restrictions Water Depth and Waterway Restrictions ............................................................................ 3-7
Figure 3.10 Proposed Ferry Routes Downtown Tampa to MacDill AFB ............. 3-8
Figure 3.11 Proposed Ferry Routes Downtown Tampa to Apollo Beach ............. 3-8
Figure 3.12 Proposed Ferry Routes Downtown Tampa to Downtown St. Petersburg ................................................................................................. 3-9
Figure 3.13 Proposed Ferry Routes Downtown Tampa to Gibsonton ................. 3-9
Figure 3.14 Proposed Ferry Routes Downtown St. Petersburg to Westshore ... 3-10
Figure 3.15 Proposed Ferry Routes Downtown St. Petersburg to MacDill AFB ........................................................................................................... 3-10
Figure 3.16 Proposed Ferry Routes Downtown St. Petersburg to Gibsonton .... 3-11

Hillsborough County Water Ferry Feasibility Study
Hillsborough County MPO v
Figure 3.17 Proposed Ferry Routes Downtown St. Petersburg to Apollo Beach ........................................................................................................ 3-11
Figure 3.18 Proposed Ferry Routes MacDill AFB to Gibsonton .......................... 3-12
Figure 3.19 Proposed Ferry Routes MacDill AFB to Apollo Beach ..................... 3-12
Figure 3.20 Proposed Ferry Routes Gibsonton to Westshore ............................... 3-13
Figure 3.21 Proposed Ferry Routes Apollo Beach to Westshore ......................... 3-13
Figure 4.1 Waterborne Passenger Service Market Areas ...................................... 4-2
Figure 4.2 Potential Vessel....................................................................................... 4-22


Hillsborough County Water Ferry Feasibility Study
Hillsborough County MPO ES-1
Executive Summary
Study Purpose. In keeping pace with community desires and the ever-expanding transportation needs of the Tampa Bay region and in cooperation with Hillsborough County, the Hillsborough Metropolitan Planning Organization (MPO) studied potential water ferry connections in Tampa Bay. The objective of this study was to evaluate the feasibility of waterborne passenger service as a viable travel alternative and a part of the current and future transportation system of the county and region.
The study incorporates the findings of previous waterborne transportation studies, where relevant, and is consistent with the region’s transportation plans, including the Tampa Bay Area Regional Transportation Authority (TBARTA) Regional Transportation Master Plan and the MPO’s 2035 Long Range Transportation Plan (LRTP). This study identifies and evaluates a range of service options and provides recommendations for the most promising services that should be further explored.
Potential Users. Because commuting traffic represents the greatest single burden on local roadway capacity as well as a stable, repetitive market, the focus of this analysis was on the ability of waterborne transportation to provide a viable commuter service. Other service opportunities (i.e. recreational and excursion services for things like concerts, sports events, waterway tours, and more) have been identified, but ridership has not been estimated. The commuter service will dictate vessel capacity, operating costs, amenities, and business model options. Off-peak use of the vessel for recreational, tourist and other services can be explored further with additional market research.
Potential Destinations. Potential stations and routes were identified based on previous work, stakeholder input, and an initial comparison to the highway network (see Figure ES.1). Water routes that directly competed geographically with highways were excluded. Service to the following areas was considered: Downtown Tampa; Gibsonton; Apollo Beach; MacDill Air Force Base (AFB); Westshore Business District; Downtown St. Petersburg; Safety Harbor; Oldsmar; and Fort DeSoto State Park. Potential routes were identified based upon waterway characteristics, and each destination area was reviewed for potential station locations.

Hillsborough County Water Ferry Feasibility Study
ES-2 Hillsborough County MPO
Figure ES.1 Initial Ferry Routes and Stations
Community Interest. Interest in waterborne passenger transportation has remained strong for many years in the Tampa Bay region. Advocates have pushed for regional connections between Pinellas and Hillsborough counties, linking the business and cultural centers of Downtown Tampa and Downtown St. Petersburg. Proponents identified a range of services, including commuter and recreational connections. Recreational connections included shuttles to special events as well as tourist-related excursions.
To represent the needs of the community, key stakeholders were brought together to help guide this feasibility study. This group included local and regional transportation planning agencies, economic development organizations, marine industry representatives, MacDill AFB representatives, among others. An on-line survey was developed and distributed to the project stakeholders to help screen the stations and routes (see Figure ES.2). Further screening was conducted via the stakeholders through two workshops.
While there is overall support for waterborne transportation services, stakeholder input to date recommends initial services focus on a commuter service connecting MacDill AFB with key residential communities in Gibsonton and Apollo Beach areas. Subsequent stakeholder and community involvement will be critical as part of ongoing service development activities.
Travel Time Savings. Travel time is one of the most critical factors in determining markets where water ferry service can be competitive with the personal automobile. Given the speed and flexibility of the personal auto, it has been evident in existing services that a water ferry option will only be competitive in corridors where it travels a shorter distance or presents significant

Hillsborough County Water Ferry Feasibility Study
Hillsborough County MPO ES-3
Figure ES.2 Stakeholder Survey Webpage Screenshot
time savings (i.e. roadways where automobile travel times are greatly affected by congestion). Comparisons were developed between personal auto trip characteristics and proposed water routes. Connections where a water ferry and personal auto were comparable in direction and distance, such as Downtown St. Petersburg to the Westshore Business District, the ferry service was not competitive, taking 24 minutes longer. In other corridors, where the ferry provided a more direct route, such as Gibsonton to MacDill AFB, the ferry was 12 or more minutes faster. It is important to recognize that time has been built in to the total ferry trip time to account for the time it takes to travel from home to the origin ferry station and from the destination ferry station to place of work, including wait time.
Ridership Estimates. Ridership estimates were developed based on the potential to divert a portion of personal auto trips to ferry, specifically trips for commuting between home and work. Ferry trip characteristics (distance, speed, frequency of service, fare, transfer penalties, and a transit acceptance factor) were compared to auto trip characteristics (distance, speed, fuel costs, and parking costs). Estimates were developed for all identified origin/destination pairs. Results were summarized and shared with the stakeholders. Based upon stakeholder input and review of preliminary ridership estimates, service to MacDill AFB from the residential communities in Apollo Beach and Gibsonton were identified as the most promising opportunities for water ferry service.
Based on current conditions, it is estimated that over 100 daily commuter trips would move between Apollo Beach and MacDill AFB, and almost 400 daily trips would move between Gibsonton and MacDill AFB. These estimates are forecast to grow to approximately 400 and 1,400 by 2035, respectively. The ridership forecasts are based upon a service that would operate at least every 30 minutes in

Hillsborough County Water Ferry Feasibility Study
ES-4 Hillsborough County MPO
the AM and PM peak periods; would cost $2.50 one way; and would operate at 35 knots. Under these conditions, one-way water ferry service would cost up to $3.67 less than the personal auto per trip.1
Vessel Requirements and Potential Revenues. A preliminary assessment of vessels was completed; however, additional analysis is recommended as part of Phase 2 to explore addition vessels including local options, or existing vessels in the Tampa Bay region that are currently underutilized and may be appropriate for an initial service option.
The vessel identified for this preliminary analysis meets the key requirements; it has a cruising speed of 35 knots, has a shallow draft (18 inches at speed), carries 42 passengers, and a crew of two (see Figure ES.3).2 With the estimated ridership, 28 peak period trips will be required; 20 for Gibsonton to MacDill AFB and eight for Apollo Beach to MacDill AFB. With travel times of 9 and 11 minutes for the two selected routes, three vessels for Gibsonton to MacDill AFB and one for Apollo Beach to MacDill AFB will be necessary for each two-hour peak period. Preliminary estimates suggest the farebox revenues (at $2.50 per trip) would cover 45 percent of the daily operating costs3, creating a deficit of $3,123 per day. A $4.00 fare would yield a 72 percent recovery of operating costs; a $5.60 fare would provide approximately 100 percent recovery. Preliminary estimates of vessel costs (capital costs) are $550,000 per vessel, or $2.2 million. Station development costs have not been estimated as part of this phase.
Additional Opportunities. In addition to the two commuter-based MacDill AFB routes, other opportunities exist for the Tampa Bay region. Several other commuter-based routes should be considered over the medium to longer term based upon the success of the initial service and ongoing developments throughout the region to enhance public transportation options. The major destinations of Downtown Tampa and Downtown St Petersburg represent two opportunities where water ferry service does not currently exceed the service provided by personal autos, however, the travel time is close enough in some markets that transit-friendly patrons may be willing to use the service – especially after an initial service has been implemented and proven to be reliable and as regional congestion worsens. In addition to commuter-based service, recreational, excursion, tourist-based alternatives should be considered. This is critical to ensure effective utilization of vessels, infrastructure, and crew – particularly during off-peak weekday periods. This helps generate additional revenue for the
1 Three fares were tested; $2.50 represents current premium express bus service. Auto
costs reflect fuel cost only. 2 www.bentzboats.com/Sommer%20Star.pdf 3 Operating costs consist of crew, fuel, and nightly storage; other costs, including
maintenance, and insurance have not been included during this phase.

Hillsborough County Water Ferry Feasibility Study
Hillsborough County MPO ES-5
POSSIBLE USES Public Transportation – With its capacity to carry 42 passengers at 40 mph cruising speeds, in water as shallow as 18 inches, along with its low maintenance aluminum hull and Hamilton jet pumps, it offers an attractive alternative to buses and trains along inland waterways.
Tour Operators – Capable of speeds up to 50 mph, hotels, cruise lines, resorts, and tour companies can offer unique trips to enhance the experience of their guests.
Source: www.bentzboats.com/Sommer%20Star.pdf
operator and also provides an ongoing opportunity to build support for water-based passenger service by exposing additional segments of the population.
Figure ES.3 Potential Vessel Selected for Analysis
Recommendations. Several key activities are required to implement waterborne passenger service in the Tampa Bay region. The below recommendations describe the necessary activities. Preliminary findings suggest key next steps should focus on those recommendations related to market research, key service operating considerations, and station development.
• Build consensus with regional leaders and elected officials. Study findings should be presented to key decision makers to build support for the initial service. Based on these discussions, the study findings should be refined as necessary to document agreed upon next steps.
• Work with land owners to evaluate station locations. Potential sites have been identified. Figure ES.4 provides an example of existing waterfront in the Tampa Bay region. Meetings with the owners will be critical to refine the locations, determine investment requirements, or seek alternative locations.
• Identify and evaluate available vessels. Vessels that meet the service requirements should be identified; this should include outreach to local marine operators to determine the availability of local under-utilized vessels.

Hillsborough County Water Ferry Feasibility Study
ES-6 Hillsborough County MPO
• Identify and define operator options. Evaluate the range of options for operation of the service. Public, private, and public-private options should be considered.
• Refine market estimates. Based upon the above activities, ridership estimates should be refined; based on the above input, the estimate could increase or decrease.
• Determine financial/business model options. Review available financing options from county, state, national, and private sources. Evaluate the implications of various business models. This should include review of the federal Ferry Boat Discretionary program.
• Prepare marketing material for initial service. In order for the service to be successfully developed and implemented, the potential market must be presented with a detailed description of the service. Brochures, flyers, and other media should be developed that describe the stations, the routes, the schedule, the parking, and the cost. This material should be used to support the outreach program discussed below.
• Conduct community outreach. Develop and implement an outreach program at MacDill AFB and the communities of Gibsonton and Apollo Beach. This should include workshops and public meetings designed to inform, seek feedback, and build support for the service.
• Develop and implement service. The above activities should be used to develop an initial service; this can be a proof of concept/demonstration project or simply an initial deployment.
• Expand service options over time. Based upon the success of the initial service, consider expanding the service to meet community demands.
Figure ES.4 Waterfront in Tampa Bay Region

Hillsborough County Water Ferry Feasibility Study
Hillsborough County MPO 1-1
1.0 Introduction
1.1 BACKGROUND The two largest cities of our region, Tampa and St. Petersburg, are separated by the calm waters of Tampa Bay. The proximity of our communities and attractions to the water’s edge, our temperate year-round climate, and large tourism base, provide an excellent opportunity to take advantage of our waterways to move people around the region. With an aggressive program underway in the region to expand and improve available transit services through investments in technologies like bus rapid transit (BRT) and light rail, the consideration of waterborne transportation to serve a community market focused on those instances where water service has a natural advantage.
1.2 STUDY PURPOSE In keeping pace with community desires and the ever-expanding transportation needs of the Tampa Bay region and in cooperation with Hillsborough County, the Hillsborough Metropolitan Planning Organization (MPO) studied potential water ferry connections across Tampa Bay.
The objective of this study was to evaluate the feasibility of waterborne passenger service as a viable travel alternative and a part of the current and future transportation system of the county and region. This included a preliminary review of key routes and infrastructure, available vessel technologies, and potential order of magnitude ridership estimates. Future grant applications also were taken into consideration.
The study incorporates the findings of previous waterborne transportation studies, where relevant, and is consistent with the region’s transportation plans, including the Tampa Bay Area Regional Transportation Authority (TBARTA) Regional Transportation Master Plan and the MPO’s 2035 Long Range Transportation Plan (LRTP).
illustrates the Long-Term Regional and Supporting Network for the region, as developed by TBARTA. Waterborne passenger services discussed in this report are not in competition with this long range vision – in fact, such service would be developed as part of the vision. Water ferry connections currently are included as part of the supporting network. This study identifies and evaluates a range of service options and provides recommendations for the most promising services that should be further explored as part of subsequent work efforts.

Hillsborough County Water Ferry Feasibility Study
1-2 Hillsborough County MPO
Figure 1.1 TBARTA’s Long Term Regional and Supporting Network
Source: TBARTA Regional Transportation Master Plan, Adopted May 22, 2009.

Hillsborough County Water Ferry Feasibility Study
Hillsborough County MPO 1-3
1.3 PROJECT APPROACH The approach for this feasibility study focused on the integration of work completed to date in the region on water ferry service and the established transportation system plans. It also incorporated lessons learned in other areas that have studied the development of water passenger service, including a review of case studies where services have been deployed. These general guidelines, along with stakeholder input, were used to support the identification of markets and routes, development of ridership forecasts, development of an operating scenario for the preferred routes, and development of recommendations to guide future efforts.
1.4 ORGANIZATION The remainder of this report is organized as follows:
• Section 2.0, Outreach. This section describes the outreach activities completed to help guide the study direction, including stakeholder workshops and surveys.
• Section 3.0, Potential Station Locations, Routes, and Key System Characteristics. This section describes the stations and routes analyzed as part of this study. It also documents key system characteristics, such as water depth, areas of restrictions, and slow zones – all of which impact ferry operations.
• Section 4.0, Travel Demand Estimation and Transportation Analysis. This section describes the methodology used to develop ridership estimates for the selected ferry routes. It also includes an analysis of the operations of the preferred scenarios.
• Section 5.0, Recommendations. This section presents recommendations to guide future work, both for the recommended routes and for future commuter and non-commuter opportunities.


Hillsborough County Water Ferry Feasibility Study
Hillsborough County MPO 2-1
2.0 Outreach
2.1 DEFINITION OF STAKEHOLDERS Interest in waterborne passenger transportation has remained strong for many years in the Tampa Bay region. Advocates have pushed for regional connections between Pinellas and Hillsborough counties, linking the business and cultural centers of Downtown Tampa and Downtown St. Petersburg. Proponents have identified a range of services, including commuter and recreational connections. Recreational connections included shuttles to special events as well as tourist related excursions. Engaging key stakeholders was a critical component of this feasibility study; illustrating strong support for waterborne passenger service is necessary for the advancement of this initiative to the next phase.
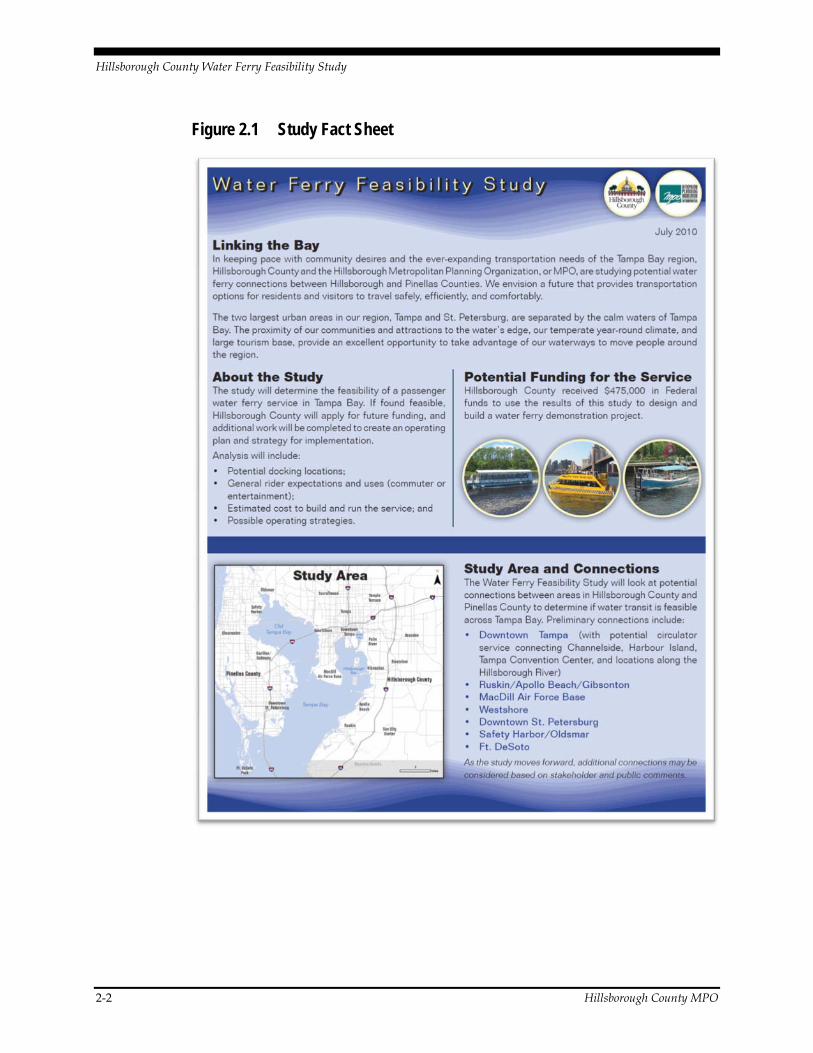
A fact sheet was developed for the project to help communicate the intent and begin to engage key stakeholders, as shown in Figure 2.1. Key stakeholders were engaged to help guide the feasibility study. Stakeholders included representatives from:
• Apollo Beach Chamber of Commerce
• City of Oldsmar
• City of Tampa
• Environmental Protection Commission of Hillsborough County
• Florida Department of Transportation (FDOT)
• Hillsborough Area Regional Transit (HART)
• Hillsborough County Planning and Growth Management Department
• Hillsborough County
• MacDill AFB
• Pinellas County MPO
• Port of Tampa
• SouthShore Roundtable
• Tampa Bay Area Regional Transportation Authority (TBARTA)
• Tampa Bay Downtown Partnership
• City of St. Petersburg
• City of St. Petersburg Downtown Partnership
• Westshore Alliance
The stakeholders met on two separate occasions over the course of the study to review and provide input on potential water ferry routes and findings of the preliminary analysis. The two workshops engaged the stakeholders in discussions relating to routes, stations, type of service, key characteristics, and how waterborne passenger service fits in to the overall transportation vision for the region.
Hillsborough County Water Ferry Feasibility Study
2-2 Hillsborough County MPO
Figure 2.1 Study Fact Sheet

Hillsborough County Water Ferry Feasibility Study
Hillsborough County MPO 2-3
Figure 2.1 Study Fact Sheet (continued)

Hillsborough County Water Ferry Feasibility Study
2-4 Hillsborough County MPO
2.2 USE OF ON-LINE SURVEY To further engage the community, an on-line survey was developed and distributed to a focused group of project stakeholders to help confirm and validate potential routes, identify potential station locations, identify key obstacles/ challenges, and begin to engage the community. The survey was not widely distributed to the public; however some members of the public received the survey by way of the stakeholders.
The Tampa Downtown Partnership representative included a link to the survey in an email distribution to newsletter recipients. Once the MacDill AFB route was identified as a potential route to move forward, the MacDill AFB representative engaged employees on the base to determine their support for further analysis of a route connecting MacDill AFB with South Hillsborough County.
Preliminary Findings Key survey findings include:
• Ninety-three percent do not believe the Tampa Bay region has adequate passenger transportation options available today;
• Ninety-one percent believe a water ferry system would be a viable passenger transportation alternative;
• Most favorable connection is from Downtown Tampa to Downtown St. Petersburg (86%) of the nine defined routes;
• Most respondents were not aware of any restrictions preventing development of a waterborne service; and
• Key factors identified for consideration included demand, speed, cost, service frequency, multimodal connections and access, and travel reliability.
Figure 2.2 illustrates the strong support for waterborne passenger service. All nine routes were supported; routes connecting Downtown Tampa and Downtown St. Petersburg to other points around the region experienced above average support.

Hillsborough County Water Ferry Feasibility Study
Hillsborough County MPO 2-5
Figure 2.2 Initial Survey Results: Evaluation of Station Locations
Survey results, along with preliminary route characteristics and ridership estimates were presented to the advisory committee. While there was overall support for waterborne transportation services, the committee recommended initial services focus on a commuter service connecting MacDill AFB with key residential communities in Gibsonton and Apollo Beach areas.
MacDill AFB Findings MacDill AFB, as a key study partner, distributed the survey to its employees to help measure the level of interest in waterborne connections to MacDill AFB. Respondents were also asked to provide any additional comments/observations. Over 1,175 of the 1,325 survey respondents agreed with connections between MacDill AFB and Gibsonton/Ruskin/Apollo Beach. Tampa and St. Petersburg also received strong support, representing key areas attracting folks at MacDill AFB. Figure 2.3 illustrates this support. Figure 2.4 summarizes other comments received; these comments show solid support for waterborne passenger service as well as a firm grasp of the potential benefits to the Tampa Bay region.
12/27/2010 22
Other connections to consider: Tampa International Airport; Downtown Tampa to Sarasota/Pinellas County Beaches
Stakeholder SurveyPreliminary Findings
0
10
20
30
40
50
60
70
80
Num
ber of Respo
nses
Agree
Disagree
Neutral
Evaluation of Potential Connections
Connection 1Dntn Tampa to Dntn St. PeteConnection 2Dntn Tampa CirculatorConnection 3Dntn Tampa to Gibsonton/
Ruskin/Apollo BeachConnection 4Dntn Tampa to Ft. DeSotoConnection 5MacDill AFB to Gibsonton/
Ruskin/Apollo BeachConnection 6Westshore to Dntn St. PeteConnection 7Westshore to Safety Harbor/
OldsmarConnection 8Dntn St. Pete to Ft. DeSotoConnection 9Dntn St. Pete to Gibsonton/
Ruskin/Apollo Beach

Hillsborough County Water Ferry Feasibility Study
2-6 Hillsborough County MPO
Figure 2.3 Survey Results: MacDill AFB Respondents
12/27/2010 44
Survey Result Summary• Do you agree or disagree with the connections identified
0 200 400 600 800 1000 1200 1400
Downtown Tampa ‐ Downtown St. Petersburg
Downtown Tampa Circulator to Harbour Island/along …
Downtown Tampa to Gibsonton/Ruskin/Apollo Beach
Downtown Tampa to Ft. DeSoto Park
MacDill AFB to Gibsonton/Ruskin/Apollo Beach
Westshore to Safety Harbor/Oldsmar
Downtown St. Petersburg to Ft. DeSoto Park
Downtown St. Petersburg to Westshore
Downtown St. Petersburg to Gibsonton/Ruskin/Apollo Beach
Neutral/Don't Know Disagree Agree

Hillsborough County Water Ferry Feasibility Study
Hillsborough County MPO 2-7
Figure 2.4 Examples of Other Comments from MacDill Respondents
12/28/2010 45
Examples of Additional Comments• “I would personally love it and would sign up in a heartbeat”
• “Everyone I talked to at MacDill is in favor of it”
• “There is definitely support and demand for this service”
• “Great idea – please pursue”
• “I can say I would use the ferry system if it was available”
• “We need a water ferry”
• “People want it!”
• “This service is needed very badly!”
• “Greatly desired basewide by residents on that side of the bay”
12/27/2010 46
Examples of Key Observations
• Service must be punctual and affordable• Service would:
– Reduce fuel consumption– Reduce travel time and aggravation of commuters– Reduce carbon footprint– Reduce regional congestion– Reduce tolls
• Questions remain about:– Routings – Parking costs– Security of parking areas– Security at base
GibsontonApollo BeachRuskinRiverviewBrandonValricoFishhawkLithiaTampaSt. Petersburgh…


Hillsborough County Water Ferry Feasibility Study
Hillsborough County MPO 3-1
3.0 Potential Station Locations, Routes, and Key System Characteristics
This feasibility study is predicated on an ongoing interest in developing waterborne passenger service in the Tampa Bay region. Potential routes have been identified and discussed over the last several years; routes to connect the Tampa and St. Petersburg downtowns, as well as service to MacDill AFB represent initial priorities. The following discusses refinements completed as part of this feasibility study.
3.1 STUDY AREA As part of this feasibility study, a full range of routes were identified and reviewed based on previous work and stakeholder input. Service to the following areas was considered: Downtown Tampa; Gibsonton; Apollo Beach; MacDill AFB; Westshore Business District; Downtown St. Petersburg; Safety Harbor; Oldsmar; and Fort DeSoto State Park. Figure 3.1 illustrates the initial system connections.
Based upon a review of waterway characteristics, existing highway corridors providing competitive service, site visits to each community, and input from the project stakeholders, the initial set of connections was reduced to six communities. These six areas consist of: Downtown Tampa, Downtown St. Petersburg, MacDill AFB, Westshore, Gibsonton, and Apollo Beach. Figure 3.2 shows these locations and the corresponding routes.
3.2 POTENTIAL FERRY STATION LOCATIONS Within each of the six identified communities, potential station locations were identified based upon site visits and analysis of aerials. Locations were selected based on existing waterfront infrastructure, where possible. This included docks, marine facilities, parking, roadway access, and adequate water depth. The Downtown Tampa site serves two markets (Downtown Tampa 1 and 2). This is described in detail in Section 4.0. In addition, multiple sites were identified for two areas (Gibsonton and Apollo Beach); this was done to provide flexibility in service development given that the sites are privately owned. Land owners have not been contacted as part of this phase of the study. This will be a critical first step as part of subsequent work efforts. Figures 3.3 through 3.8 show the potential ferry station locations.

Hillsborough County Water Ferry Feasibility Study
3-2 Hillsborough County MPO
Figure 3.1 Initial Ferry Stations and Routes
Figure 3.2 Revised Ferry Stations and Routes

Hillsborough County Water Ferry Feasibility Study
Hillsborough County MPO 3-3
Figure 3.3 Ferry Station Locations – Apollo Beach
Figure 3.4 Ferry Station Locations – Gibsonton

Hillsborough County Water Ferry Feasibility Study
3-4 Hillsborough County MPO
Figure 3.5 Ferry Station Locations – MacDill AFB
Figure 3.6 Ferry Station Locations – Downtown St. Petersburg

Hillsborough County Water Ferry Feasibility Study
Hillsborough County MPO 3-5
Figure 3.7 Ferry Station Locations – Downtown Tampa
Figure 3.8 Ferry Station Locations – Westshore
Hillsborough County Water Ferry Feasibility Study
3-6 Hillsborough County MPO
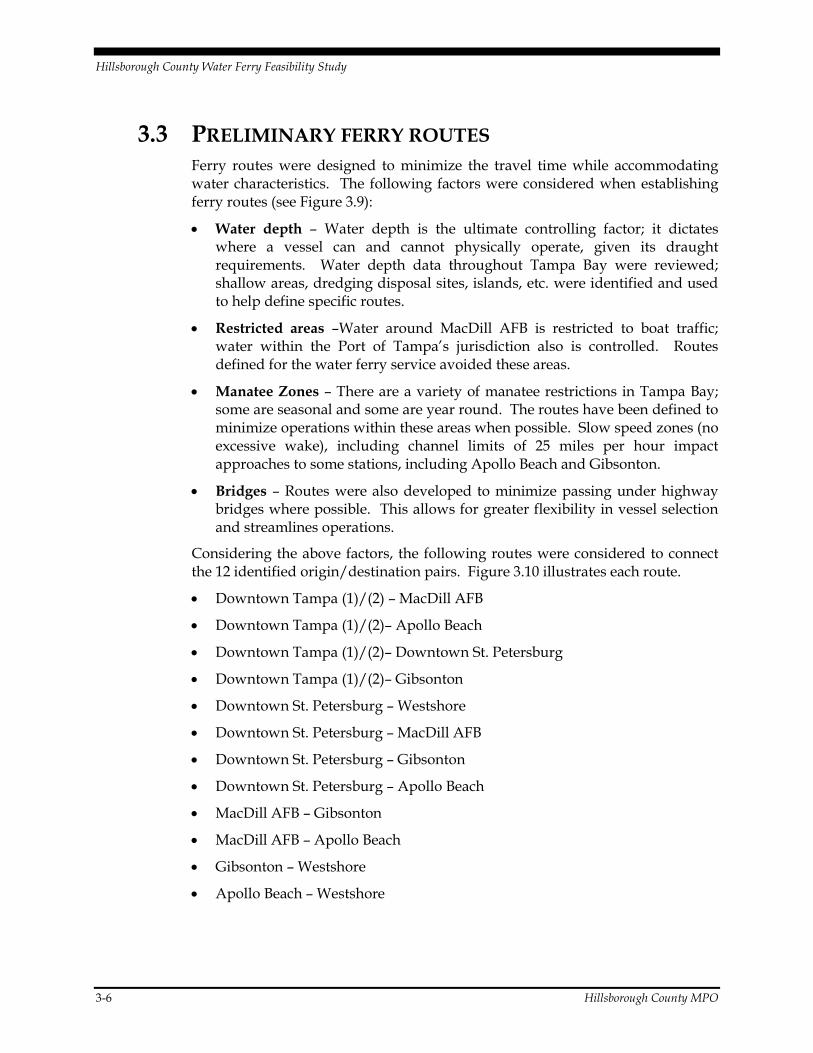
3.3 PRELIMINARY FERRY ROUTES Ferry routes were designed to minimize the travel time while accommodating water characteristics. The following factors were considered when establishing ferry routes (see Figure 3.9):
• Water depth – Water depth is the ultimate controlling factor; it dictates where a vessel can and cannot physically operate, given its draught requirements. Water depth data throughout Tampa Bay were reviewed; shallow areas, dredging disposal sites, islands, etc. were identified and used to help define specific routes.
• Restricted areas –Water around MacDill AFB is restricted to boat traffic; water within the Port of Tampa’s jurisdiction also is controlled. Routes defined for the water ferry service avoided these areas.
• Manatee Zones – There are a variety of manatee restrictions in Tampa Bay; some are seasonal and some are year round. The routes have been defined to minimize operations within these areas when possible. Slow speed zones (no excessive wake), including channel limits of 25 miles per hour impact approaches to some stations, including Apollo Beach and Gibsonton.
• Bridges – Routes were also developed to minimize passing under highway bridges where possible. This allows for greater flexibility in vessel selection and streamlines operations.
Considering the above factors, the following routes were considered to connect the 12 identified origin/destination pairs. Figure 3.10 illustrates each route.
• Downtown Tampa (1)/(2) – MacDill AFB
• Downtown Tampa (1)/(2)– Apollo Beach
• Downtown Tampa (1)/(2)– Downtown St. Petersburg
• Downtown Tampa (1)/(2)– Gibsonton
• Downtown St. Petersburg – Westshore
• Downtown St. Petersburg – MacDill AFB
• Downtown St. Petersburg – Gibsonton
• Downtown St. Petersburg – Apollo Beach
• MacDill AFB – Gibsonton
• MacDill AFB – Apollo Beach
• Gibsonton – Westshore
• Apollo Beach – Westshore

Hillsborough County Water Ferry Feasibility Study
Hillsborough County MPO 3-7
Figure 3.9 Examples of Waterway Restrictions Water Depth and Waterway Restrictions
Water Depth
Waterway Restrictions

Hillsborough County Water Ferry Feasibility Study
3-8 Hillsborough County MPO
Figure 3.10 Proposed Ferry Routes Downtown Tampa to MacDill AFB
Figure 3.11 Proposed Ferry Routes Downtown Tampa to Apollo Beach

Hillsborough County Water Ferry Feasibility Study
Hillsborough County MPO 3-9
Figure 3.12 Proposed Ferry Routes Downtown Tampa to Downtown St. Petersburg
Figure 3.13 Proposed Ferry Routes Downtown Tampa to Gibsonton

Hillsborough County Water Ferry Feasibility Study
3-10 Hillsborough County MPO
Figure 3.14 Proposed Ferry Routes Downtown St. Petersburg to Westshore
Figure 3.15 Proposed Ferry Routes Downtown St. Petersburg to MacDill AFB

Hillsborough County Water Ferry Feasibility Study
Hillsborough County MPO 3-11
Figure 3.16 Proposed Ferry Routes Downtown St. Petersburg to Gibsonton
Figure 3.17 Proposed Ferry Routes Downtown St. Petersburg to Apollo Beach

Hillsborough County Water Ferry Feasibility Study
3-12 Hillsborough County MPO
Figure 3.18 Proposed Ferry Routes MacDill AFB to Gibsonton
Figure 3.19 Proposed Ferry Routes MacDill AFB to Apollo Beach

Hillsborough County Water Ferry Feasibility Study
Hillsborough County MPO 3-13
Figure 3.20 Proposed Ferry Routes Gibsonton to Westshore
Figure 3.21 Proposed Ferry Routes Apollo Beach to Westshore


Hillsborough County Water Ferry Feasibility Study
Hillsborough County MPO 4-1
4.0 Travel Demand Estimation and Transportation Analysis
A waterborne passenger system can be used to provide a variety of commuter and recreational services. From a public policy perspective, enhancing modal options for daily commuter traffic is a major goal, while economic development organizations and private industry lead for-profit service development, such as tourist-based excursions. This first phase feasibility study focused on the demand for a daily commuter option, while acknowledging the opportunity for development of secondary recreational service in off peak periods. Other service opportunities (recreational, excursion services for things like concerts, sports events, waterway tours, and more) were identified, but ridership was not estimated. The commuter service will dictate vessel capacity, operating costs, amenities, and business model options. Off-peak use of the vessel for recreational, tourist, and other services can be explored further with additional market research.
Ridership estimates were developed based on the potential to divert a portion of personal auto trips to ferry, specifically trips for commuting between home and work. Ferry trip characteristics (distance, speed, frequency of service, fare, transfer penalties, and a transit acceptance factor) were compared to auto trip characteristics (distance, speed, fuel costs, parking costs). Estimates were developed for all identified origin/destination pairs. Results were summarized and shared with the project stakeholders. Based upon stakeholder input and review of preliminary ridership estimates, service to MacDill AFB from the residential communities in Apollo Beach and Gibsonton were identified as the most promising opportunities for water ferry service.
Additional data were collected via an expanded on-line survey of MacDill AFB staff to further quantify the potential market for these routes and to refine demand estimates based on potential user input. This included residency by zip code, assumptions on daily travel demand, and gate time penalties for auto access to MacDill AFB. These new data were integrated into the ridership estimation methodology to develop revised demand estimates. Model origin/destination data were replaced with MacDill’s data for the two defined routes. Estimates were developed for 2006 base year and 2035 cost feasible conditions.
The following describes the methodology and resulting ridership estimates.

Hillsborough County Water Ferry Feasibility Study
4-2 Hillsborough County MPO
4.1 METHODOLOGY Definition of Market Area Seven market areas were defined based on the potential station areas using the Tampa Bay Regional Travel Planning Model (TBRPM). These markets represent the catchment areas for each of the six stations/communities defined above. Due to its potential to attract commuter travel, Downtown Tampa consists of two sub-areas; one represents the area adjacent to the waterfront; the other represents the central business district. The seven market areas are shown in Figure 4.1.
The market connections (origin/destination pairs) identified represent the connections between stations that were selected for testing. The majority of connections were tested, with the exception of a few that did not pass an initial screening. Safety Harbor, Oldsmar, and Fort DeSoto were eliminated from further consideration at this time as they did not represent competitive commuter markets. Of the seven remaining markets, two origin/destination pairs were excluded (Downtown Tampa to Westshore and MacDill AFB to Westshore) due to the lack of competitiveness of the water connection. The resulting sixteen ferry connections were analyzed to estimate the diversion of home-based work trips from auto to ferry. Thirty-two directional ridership estimates were developed. The methodology for estimating the ridership is detailed below.
Figure 4.1 Waterborne Passenger Service Market Areas
Source: TBRPM and Cambridge Systematics, Inc. analysis.

Hillsborough County Water Ferry Feasibility Study
Hillsborough County MPO 4-3
Major Variables Considered in Ridership Estimate Four factors were identified as critical to commuter mode choice: travel time savings; travel cost savings, frequency of ferry service (headways), and community transit acceptance. Travel time savings and travel cost savings are based on a comparison of auto and ferry trips; travel time and travel cost were estimated and compared for both auto and ferry. Frequency of service and transit acceptance were defined only for ferry service; auto is assume to have the advantage given current level of auto acceptance (it is the primary commuter mode) and unparalleled flexibility (frequency is at a driver’s discretion).
Travel Time Savings Travel time savings is defined as the reduction in travel time a commuter experiences by using the water ferry as opposed to his/her auto. A positive travel time savings indicates that commuting by ferry takes less time than commuting by auto; a negative value indicates that commuting by ferry takes more time. If the ferry commuting time is shorter than auto commuting time, the ferry service is considered to be advantageous.
Total commute time by ferry is a total of ferry travel time, adjusted by walk or auto access time to the ferry stations (origin and destination), initial waiting time at the ferry stations, boarding and alighting time at each ferry boat station, and waiting time for transferring to other transit services. Ferry route distances were calculated using GIS as part of the route creation process. The resulting route distances are listed in Table 4.1.

Hillsborough County Water Ferry Feasibility Study
4-4 Hillsborough County MPO
Table 4.1 Ferry Route Distances Origin Destination Distance (miles)
Downtown Tampa (1)/(2) MacDill AFB 7.87
MacDill AFB Downtown Tampa (1)/(2) 7.87
Downtown Tampa (1)/(2) Downtown St. Petersburg 20.63
Downtown St. Petersburg Downtown Tampa (1)/(2) 20.63
Downtown Tampa (1)/(2) Gibsonton 11.24
Gibsonton Downtown Tampa (1)/(2) 11.24
Downtown Tampa (1)/(2) Apollo Beach 13.41
Apollo Beach Downtown Tampa (1)/(2) 13.41
Downtown St. Petersburg Westshore 14.69
Westshore Downtown St. Petersburg 14.69
Downtown St. Petersburg Apollo Beach 13.48
Apollo Beach Downtown St. Petersburg 13.48
Downtown St. Petersburg MacDill AFB 10.48
MacDill AFB Downtown St. Petersburg 10.48
Downtown St. Petersburg Gibsonton 17.43
Gibsonton Downtown St. Petersburg 17.43
MacDill AFB Gibsonton 6.33
Gibsonton MacDill AFB 6.33
MacDill AFB Apollo Beach 7.15
Apollo Beach MacDill AFB 7.15
Gibsonton Westshore 25.68
Westshore Gibsonton 25.68
Apollo Beach Westshore 21.67
Westshore Apollo Beach 21.67

Hillsborough County Water Ferry Feasibility Study
Hillsborough County MPO 4-5
Ferry operating speeds of 15 knots, 30 knots, and 45 knots were tested; 30 knots was determined to be the default ferry operating speed. Ferry commute times were calculated using the following equation:
Values for the other factors used to calculate total commute time by ferry – walk or auto access time to the ferry stations, initial waiting time at the ferry stations, boarding and alighting time, and waiting time for transferring to other transit services – were assumed based on the land use surrounding each ferry station. Different stations had different access modes – bus or personal car.
Walk or auto access time was calculated based on three factors: 1) the estimated distance from the market area to the station by auto or bus; 2) the estimated distance to walk from a bus station or auto parking lot to the station; and 3) the estimated speed (walking, auto, bus). For ferry stations in residential areas with parking facilities next to them, walking distance to ferry stations was an estimation of average distance from parking lot to the ferry station, in addition, the average travel distance from the residential area to the station was estimated; if a ferry station has no close-by parking facility, walking distance to the ferry station was an estimation of average distance from near-by bus stations, in addition, the average travel distance by bus was estimated.
Walking speed is assumed the same as the National Personal Transportation Survey average speed of 3.16 mph; bus speed is assumed to be 10 mph; and personal car speed is assumed to be 40 mph. Initial waiting time at the ferry station is an estimate of average time passengers wait for the ferry boats. Transfer time to other transit is an estimate of average time passengers wait to transfer to other transit modes to reach their final destination. Boarding and alighting ferry time is an estimate of time to load and unload all the passengers at each ferry station.
To illustrate, assume the following example. A passenger is traveling from Gibsonton to Downtown Tampa(1) by ferry. An average driving distance of 10 miles is estimated for the passenger to travel from home to the Gibsonton ferry station parking lot; an average walking distance of 0.08 miles is estimated for the passenger to walk from his/her car to the ferry station; the passenger is assumed to wait 5 minutes at the ferry station; after the ferry boat arrives, it takes the boat 3 minutes to load the passengers; after the ferry reaches the Downtown Tampa station, it takes 3 minutes for the passengers to unload; next, an average walking distance of 0.25 miles is estimated for the passenger to get to a bus station; the passenger is then assumed to wait at the bus station for 5 minutes; finally, the passenger travels another one mile before he/she reaches his work place. In this example, the total time is 63 minutes. This compares to 29 minutes by auto. Table 4.2 lists all the values assumed for each station.

Hillsborough County Water Ferry Feasibility Study
4-6 Hillsborough County MPO
Table 4.2 Assumed Values for Factors Related Ferry Travel Time
Stations Walk
ing
Dist
ance
to
Ferry
Sta
tions
(Mile
s)
Bus o
r Aut
o Ac
cess
Di
stan
ce (M
iles)
Walk
or A
uto
Acce
ss
Tim
e – O
rigin
(m
inut
es)
Walk
or A
uto
Acce
ss
Tim
e –De
stin
atio
n (m
inut
es)
Initi
al W
aitin
g Ti
me a
t Fe
rry S
tatio
n (m
inut
es)
Tran
sfer
Tim
e to
Othe
r Tra
nsit
(min
utes
) Bo
ardi
ng /A
light
ing
Ferry
Tim
e (m
inut
es)
Downtown Tampa (1) 0.25 1 (bus) 11 11 5 5 3/3
Downtown Tampa (2) 0.25 1.5 (bus) 14 14 5 5 3/3
MacDill AFB 0.05 1 (bus) 2 2 5 5 3/3
Westshore 0.1 3 (car) 6 6 5 5 3/3
Downtown St. Pete 0.02 1 (bus) 6 6 5 5 3/3
Gibsonton / Riverview 0.08 10 (car) 17 17 5 5 3/3
Apollo Beach / Sun City 0.06 10 (car) 16 16 5 5 3/3
Total commute time by auto is obtained from the TBRPM. The seven market areas and sub-areas previously defined were used in the model to establish origin/destination matrices. After running the model, daily home-based work trips between origin/destination pairs, and auto travel times for 2006 and 2035 were generated. An additional time penalty was added to all trips destined for or originating at MacDill AFB due to delays resulting from the process of passing through the gate’s security checkpoint. This consisted of 15 to 20 minutes delay entering the AFB during the AM commute and 5 to 15 minutes delay exiting the AFB in the PM commute; an average delay of 17.5 and 10 minutes, respectfully, were added to the auto trip time. Travel time savings from using ferry services can be calculated using the equation below:
SavingsTotal Commute Time by Auto Total Commute Time by Ferry
The travel times for ferry and auto, and the resulting travel time savings are shown in Table 4.3.

Hillsborough County Water Ferry Feasibility Study
Hillsborough County MPO 4-7
Table 4.3 Travel Time Savings Per One-Way Trip Origin Destination Total Commute Time by
Ferry (minutes) Total Commute Time by
Auto (minutes) Travel Time Savings
(minutes)
Downtown Tampa (1) MacDill AFB 43 31 -12
MacDill AFB Downtown Tampa (1) 43 23 -20
Downtown Tampa (1) Downtown St. Petersburg 69 32 -37
Downtown St. Petersburg Downtown Tampa (1) 69 32 -37
Downtown Tampa (1) Gibsonton 63 29 -34
Gibsonton Downtown Tampa (1) 63 29 -34
Downtown Tampa (1) Apollo Beach 66 33 -33
Apollo Beach Downtown Tampa (1) 66 33 -33
Downtown Tampa (2) MacDill AFB 46 31 -15
MacDill AFB Downtown Tampa (2) 46 23 -23
Downtown Tampa (2) Downtown St. Petersburg 72 32 -40
Downtown St. Petersburg Downtown Tampa (2) 72 32 -40
Downtown Tampa (2) Gibsonton 66 29 -37
Gibsonton Downtown Tampa (2) 66 29 -37
Downtown Tampa (2) Apollo Beach 69 33 -36
Apollo Beach Downtown Tampa (2) 69 33 -36
Downtown St. Petersburg Westshore 54 25 -29
Westshore Downtown St. Petersburg 54 25 -29
Downtown St. Petersburg Apollo Beach 62 45 -17
Apollo Beach Downtown St. Petersburg 62 45 -17

Hillsborough County Water Ferry Feasibility Study
4-8 Hillsborough County MPO
Origin Destination Total Commute Time by Ferry (minutes)
Total Commute Time by Auto (minutes)
Travel Time Savings (minutes)
Downtown St. Petersburg MacDill AFB 43 48 5
MacDill AFB Downtown St. Petersburg 43 41 -2
Downtown St. Petersburg Gibsonton 69 58 -11
Gibsonton Downtown St. Petersburg 69 58 -11
MacDill AFB Gibsonton 46 49 3
Gibsonton MacDill AFB 46 57 11
MacDill AFB Apollo Beach 47 54 7
Apollo Beach MacDill AFB 47 62 15
Gibsonton Westshore 84 35 -48
Westshore Gibsonton 84 36 -48
Apollo Beach Westshore 76 40 -37
Westshore Apollo Beach 76 40 -36

Hillsborough County Water Ferry Feasibility Study
Hillsborough County MPO 4-9
Travel Cost Savings Travel cost savings is defined as the additional travel cost incurred by commuters using auto compared to commuters using ferry. A positive travel cost saving indicates that commuting by ferry cost less than commuting by auto. If the ferry commuting cost is less than auto commuting cost, then the ferry service has an advantage over auto.
Total commuter cost by ferry is assumed to be ferry fare. Ferry fare of $2.50, $5, and $10 were tested in this study. $5 was determined to be used as the default value. Parking at ferry stations was assumed to be free, similar to other park and ride facilities in the region. Total commuter cost by auto has three components: auto operating cost, tolls, and parking.
The auto operating cost is estimated to be $0.1129 per mile according to the AAA 2010 estimate for fuel cost. After applying the auto travel distance, the travel cost by auto can be calculated for each origin/destination pair. Tolls vary by origin/destination pair; the following toll rates were assumed:
• Downtown Tampa – Downtown St. Petersburg/MacDill AFB: $1.13
• Apollo Beach/Gibsonton – Downtown Tampa: $1.63
• Apollo Beach/Gibsonton – St. Petersburg/MacDill AFB: $2.75
Parking costs were applied to Downtown Tampa and Downtown St. Petersburg. Parking in Downtown Tampa is $67.65 per month or $6.47 per day; parking in Downtown St. Petersburg is $54.43 per month or $6 per day. The monthly rate was converted to a daily rate (assuming 22 work days) and used to reflect average commuter parking costs. This translated into $3.08 per day in Downtown Tampa and $2.47 per day in Downtown St. Petersburg.
Based on the above assumptions, the resulting travel cost savings are presented in Table 4.4.

Hillsborough County Water Ferry Feasibility Study
4-10 Hillsborough County MPO
Table 4.4 Travel Cost Savings Per One-Way Trip Origin Destination Travel Cost by Ferry
(dollars) Travel Cost by Auto
(dollars) Travel Cost Savings
(dollars)
Downtown Tampa (1) MacDill AFB $ 5.00 $ 1.95 $ (3.05)
MacDill AFB Downtown Tampa (1) $ 5.00 $ 5.00 $ (0.00)
Downtown Tampa (1) Downtown St. Petersburg $ 5.00 $ 5.92 $ 0.92
Downtown St. Petersburg Downtown Tampa (1) $ 5.00 $ 6.51 $ 1.51
Downtown Tampa (1) Gibsonton $ 5.00 $ 3.80 $ (1.20)
Gibsonton Downtown Tampa (1) $ 5.00 $ 6.87 $ 1.87
Downtown Tampa (1) Apollo Beach $ 5.00 $ 4.24 $ (0.76)
Apollo Beach Downtown Tampa (1) $ 5.00 $ 7.34 $ 2.34
Downtown Tampa (2) MacDill AFB $ 5.00 $ 1.95 $ (3.05)
MacDill AFB Downtown Tampa (2) $ 5.00 $ 5.00 $ (0.00)
Downtown Tampa (2) Downtown St. Petersburg $ 5.00 $ 5.92 $ 0.92
Downtown St. Petersburg Downtown Tampa (2) $ 5.00 $ 6.51 $ 1.51
Downtown Tampa (2) Gibsonton $ 5.00 $ 3.80 $ (1.20)
Gibsonton Downtown Tampa (2) $ 5.00 $ 6.87 $ 1.87
Downtown Tampa (2) Apollo Beach $ 5.00 $ 4.24 $ (0.76)
Apollo Beach Downtown Tampa (2) $ 5.00 $ 7.34 $ 2.34
Downtown St. Petersburg Westshore $ 5.00 $ 1.91 $ (3.09)
Westshore Downtown St. Petersburg $ 5.00 $ 4.39 $ (0.61)
Downtown St. Petersburg Apollo Beach $ 5.00 $ 7.08 $ 2.08
Apollo Beach Downtown St. Petersburg $ 5.00 $ 9.57 $ 4.57

Hillsborough County Water Ferry Feasibility Study
Hillsborough County MPO 4-11
Origin Destination Travel Cost by Ferry (dollars)
Travel Cost by Auto (dollars)
Travel Cost Savings (dollars)
Downtown St. Petersburg MacDill AFB $ 5.00 $ 2.01 $ (2.99)
MacDill AFB Downtown St. Petersburg $ 5.00 $ 4.59 $ (0.41)
Downtown St. Petersburg Gibsonton $ 5.00 $ 7.20 $ 2.20
Gibsonton Downtown St. Petersburg $ 5.00 $ 9.66 $ 4.66
MacDill AFB Gibsonton $ 5.00 $ 5.70 $ 0.70
Gibsonton MacDill AFB $ 5.00 $ 5.70 $ 0.70
MacDill AFB Apollo Beach $ 5.00 $ 6.14 $ 1.14
Apollo Beach MacDill AFB $ 5.00 $ 6.17 $ 1.17
Gibsonton Westshore $ 5.00 $ 5.39 $ 0.39
Westshore Gibsonton $ 5.00 $ 5.40 $ 0.40
Apollo Beach Westshore $ 5.00 $ 5.86 $ 0.86
Westshore Apollo Beach $ 5.00 $ 5.84 $ 0.84

Hillsborough County Water Ferry Feasibility Study
4-12 Hillsborough County MPO
Frequency of service (Headway) Frequency of transit service is an important predictor of whether people will rely on and use public transit to commute to work. In this study, ferry headways of 30 minutes and 60 minutes were tested, and 30 minutes was decided to be the default value for headway.
Community transit acceptance It is assumed in this study that a percentage of people will not be willing to consider using public transit, regardless of any documented advantage. Community transit acceptance in this study is assumed to be the same as the percentage of voters who favored the Hillsborough County Transit 1% Sales Tax Referendum (42%).
Scoring System and Ridership Estimation A scoring system was developed to determine the percentage of commuters who would ride the proposed ferry service. The scoring system uses a scale of 0 to 100 points. Each ferry route was evaluated and assigned a score based on its travel time savings (50 points), travel cost savings (25 points), and frequency of service (25 points).
Travel time savings is considered to have the most influence on a commuter’s choice. It is given 50 points out a total 100. To further emphasize the importance of travel time, all points are zeroed out for all three point categories if the travel time savings exceeds a negative 30 minutes – that is, if the ferry trip is 30 or more minutes longer than the auto trip. Based on the travel time saved, points are awarded as follows:
• 50 points for commuter time savings greater than 0
• 30 points for commuter time savings between negative 10 and 0.
• 10 points for commuter time savings between negative 20 and negative 10
• 0 points if commuter time savings is less than negative 20 minutes
Travel cost savings also drives a commuter’s decision. It is given 25 points out of a total of 100 points. Based on the travel costs saved, points are awarded as follows:
• 25 points for cost savings greater than $5
• 15 points for cost savings between $5 and 0
• 0 points for no cost savings or negative cost savings

Hillsborough County Water Ferry Feasibility Study
Hillsborough County MPO 4-13
• 0 points if commute time savings are less than negative 30 minutes
Headway is the final factor. It is given 25 points out of a total of 100 points. The frequency of service defines its flexibility for a commuter. Based upon the headway provided, points are awarded as follows:
• 25 points for 30 minutes headway
• 10 points for 60 minutes headway
• 0 points if commute time savings are less than negative 30 minutes
4.2 PRELIMINARY SCREENING OF FERRY ROUTES Based on the scoring system developed in the previous section, the scores for travel time savings, travel cost savings, and headways were calculated, and the total score for each ferry route was calculated. The results are listed in Table 4.5.

Hillsborough County Water Ferry Feasibility Study
4-14 Hillsborough County MPO
Table 4.5 Score for Each Ferry Route Origin Destination Travel Time
Savings Score Travel Cost
Savings Score Headways
Score Total Score
Downtown Tampa (1) MacDill AFB 10 0 25 35
MacDill AFB Downtown Tampa (1) 0 0 25 25
Downtown Tampa (1) Downtown St. Petersburg 0 0 0 0
Downtown St. Petersburg Downtown Tampa (1) 0 0 0 0
Downtown Tampa (1) Gibsonton 0 0 25 0
Gibsonton Downtown Tampa (1) 0 15 25 0
Downtown Tampa (1) Apollo Beach 0 0 25 0
Apollo Beach Downtown Tampa (1) 0 15 25 0
Downtown Tampa (2) MacDill AFB 10 0 25 35
MacDill AFB Downtown Tampa (2) 0 0 25 25
Downtown Tampa (2) Downtown St. Petersburg 0 0 0 0
Downtown St. Petersburg Downtown Tampa (2) 0 0 0 0
Downtown Tampa (2) Gibsonton 0 0 0 0
Gibsonton Downtown Tampa (2) 0 0 0 0
Downtown Tampa (2) Apollo Beach 0 0 25 0
Apollo Beach Downtown Tampa (2) 0 15 25 0
Downtown St. Petersburg Westshore 0 0 25 25
Westshore Downtown St. Petersburg 0 0 25 25
Downtown St. Petersburg Apollo Beach 10 15 25 50
Apollo Beach Downtown St. Petersburg 10 15 25 50

Hillsborough County Water Ferry Feasibility Study
Hillsborough County MPO 4-15
Origin Destination Travel Time Savings Score
Travel Cost Savings Score
Headways Score
Total Score
Downtown St. Petersburg MacDill AFB 50 0 25 75
MacDill AFB Downtown St. Petersburg 30 0 25 55
Downtown St. Petersburg Gibsonton 10 15 25 50
Gibsonton Downtown St. Petersburg 10 15 25 50
MacDill AFB Gibsonton 50 15 25 90
Gibsonton MacDill AFB 50 15 25 90
MacDill AFB Apollo Beach 50 15 25 90
Apollo Beach MacDill AFB 50 15 25 90
Gibsonton Westshore 0 0 0 0
Westshore Gibsonton 0 0 0 0
Apollo Beach Westshore 0 0 0 0
Westshore Apollo Beach 0 0 0 0

Hillsborough County Water Ferry Feasibility Study
4-16 Hillsborough County MPO
Based on the results, the ferry routes with the highest scores include Apollo Beach/MacDill AFB and Gibsonton/MacDill AFB (90 points). The next most attractive route is between MacDill AFB and St. Petersburg (75 points). After obtaining the score for each ferry route, ridership for each ferry route can be estimated. The equation below was used to estimate the ridership for each route:
%
The results are listed in Table 4.6.
These results were reviewed and presented to the project stakeholders, as described in Section 2.0. Based on stakeholder input, further exploration of MacDill service for Gibsonton and Apollo Beach was recommended. The remainder of this section presents that refined analysis.

Hillsborough County Water Ferry Feasibility Study
Hillsborough County MPO 4-17
Table 4.6 Ridership Estimate Origin Destination
Scor
e
Tran
sit A
ccep
tanc
e
2006
OD
(HBW
Aut
o)
2035
OD
(HBW
Aut
o)
Estim
ate o
f Trip
s Ca
ptur
ed b
y Fer
ry
Serv
ice (2
006)
Estim
ate o
f Trip
s Ca
ptur
ed b
y Fer
ry
Serv
ice (2
035)
Downtown Tampa (1) MacDill AFB 35 42% 195 239 29 35
MacDill AFB Downtown Tampa (1) 25 42% 1329 1722 140 181
Downtown Tampa (1) Downtown St. Petersburg 0 42% 13 24 0 0
Downtown St. Petersburg Downtown Tampa (1) 0 42% 47 37 0 0
Downtown Tampa (1) Gibsonton 0 42% 15 3 0 0
Gibsonton Downtown Tampa (1) 0 42% 832 2126 0 0
Downtown Tampa (1) Apollo Beach 0 42% 23 3 0 0
Apollo Beach Downtown Tampa (1) 0 42% 499 1582 0 0
Downtown Tampa (2) MacDill AFB 35 42% 48 179 7 26
MacDill AFB Downtown Tampa (2) 25 42% 3471 4436 364 466
Downtown Tampa (2) Downtown St. Petersburg 0 42% 15 44 0 0
Downtown St. Petersburg Downtown Tampa (2) 0 42% 69 94 0 0
Downtown Tampa (2) Gibsonton 0 42% 7 5 0 0
Gibsonton Downtown Tampa (2) 0 42% 3567 9146 0 0
Downtown Tampa (2) Apollo Beach 0 42% 10 1 0 0
Apollo Beach Downtown Tampa (2) 0 42% 2158 6815 0 0

Hillsborough County Water Ferry Feasibility Study
4-18 Hillsborough County MPO
Origin Destination
Scor
e
Tran
sit A
ccep
tanc
e
2006
OD
(HBW
Aut
o)
2035
OD
(HBW
Aut
o)
Estim
ate o
f Trip
s Ca
ptur
ed b
y Fer
ry
Serv
ice (2
006)
Estim
ate o
f Trip
s Ca
ptur
ed b
y Fer
ry
Serv
ice (2
035)
Downtown St. Petersburg Westshore 25 42% 44 66 5 7
Westshore Downtown St. Petersburg 25 42% 83 157 9 16
Downtown St. Petersburg Apollo Beach 50 42% 10 0 2 0
Apollo Beach Downtown St. Petersburg 50 42% 413 361 87 76
Downtown St. Petersburg MacDill AFB 75 42% 23 33 7 10
MacDill AFB Downtown St. Petersburg 55 42% 422 365 97 84
Downtown St. Petersburg Gibsonton 50 42% 0 0 0 0
Gibsonton Downtown St. Petersburg 50 42% 163 214 34 45
MacDill AFB Gibsonton 90 42% 36 7 14 3
Gibsonton MacDill AFB 90 42% 372 459 141 174
MacDill AFB Apollo Beach 90 42% 62 4 23 2
Apollo Beach MacDill AFB 90 42% 220 268 83 101
Gibsonton Westshore 0 42% 1581 1377 0 0
Westshore Gibsonton 0 42% 6 0 0 0
Apollo Beach Westshore 0 42% 963 846 0 0
Westshore Apollo Beach 0 42% 8 0 0 0

Hillsborough County Water Ferry Feasibility Study
Hillsborough County MPO 4-19
4.3 REVISED RIDERSHIP ESTIMATE BASED ON MACDILL AFB SURVEY Ridership estimates for the MacDill, Apollo Beach, and Gibsonton connections were significantly revised based upon employee resident location information provided by MacDill AFB. Specifically, employee home location distribution information at the zip code level was provided. These data were used to develop new ridership forecasts.
According to the MacDill AFB data, approximately 6,000 employees from the Gibsonton area and 1,700 employees from the Apollo Beach area work at MacDill AFB. Approximately 15-20 percent (an average of 17.5%) are not available due to deployment, business/training trips, or leave. Of the remaining number, 90 percent work Monday through Friday between 6:00 AM and 6:00 PM. After applying the adjustment, there are 4,400 employees in Gibsonton and 1,200 employees in Apollo Beach currently commuting to MacDill AFB daily. Twenty percent growth was estimated between 2010 and 2035 to calculate 2035 ridership estimates. Ten percent of the employees are assumed to divert to the ferry in the short term; as the system is proven and expands, 25 percent are assumed to use the service by 2035. This reflects a growing “transit acceptance” factor.
To better test the sensitivity of the ridership estimates, three ferry speeds were evaluated (15 knots, 35 knots, and 45 knots). At 15 knots, there is slight decrease in ridership; this is the result of the ferry service not being fast enough on the return trip to beat the auto; this only shows up on the eastbound trip as the gate exit penalty is less in the PM than the AM. There is no difference in ridership at the higher speeds as both are faster than the auto trip. The 35 knot speed (revised from the analysis of all routes) reflects the cruising speed of the potential vessel identified for this service (defined below). The proposed service between Gibsonton and MacDill AFB is estimated to attract almost 400 passengers today, growing to almost 1,400 in 2035. Apollo Beach to MacDill AFB is estimated to attract over 100 and over 400, respectively. Table 4.7 summarizes the results.

Hillsborough County Water Ferry Feasibility Study
4-20 Hillsborough County MPO
Table 4.7 Revised Ridership Estimate for MacDill AFB Origin Destination
Ferry
Spe
ed (k
nots
)
Scor
e
Tran
sit A
ccep
tanc
e (2
010)
Tran
sit A
ccep
tanc
e (2
035)
2010
OD
(HBW
Aut
o)
2035
OD
(HBW
Aut
o)
Estim
ate o
f Trip
s Ca
ptur
ed b
y Fer
ry
Serv
ice (2
010)
Estim
ate o
f Trip
s Ca
ptur
ed b
y Fer
ry
Serv
ice (2
035)
MacDill AFB Gibsonton 15 90 10% 25% 4,430 5,317 310 930
Gibsonton MacDill AFB 15 90 10% 25% 4,430 5,317 399 1,196
MacDill AFB Apollo Beach 15 90 10% 25% 1,238 1,486 87 260
Apollo Beach MacDill AFB 15 90 10% 25% 1,238 1,486 111 334
MacDill AFB Gibsonton 35 90 10% 25% 4,430 5,317 399 1,196
Gibsonton MacDill AFB 35 90 10% 25% 4,430 5,317 399 1,196
MacDill AFB Apollo Beach 35 90 10% 25% 1,238 1,486 111 334
Apollo Beach MacDill AFB 35 90 10% 25% 1,238 1,486 111 334
MacDill AFB Gibsonton 45 90 10% 25% 4,430 5,317 399 1,196
Gibsonton MacDill AFB 45 90 10% 25% 4,430 5,317 399 1,196
MacDill AFB Apollo Beach 45 90 10% 25% 1,238 1,486 111 334
Apollo Beach MacDill AFB 45 90 10% 25% 1,238 1,486 111 334

Hillsborough County Water Ferry Feasibility Study
Hillsborough County MPO 4-21
4.4 ESTIMATE OF COSTS AND REVENUES FOR SERVICE TO MACDILL AFB To develop an assessment of operating and capital costs, along with potential service revenues, a vessel must be identified. A preliminary assessment of vessels was completed; however, additional analysis is recommended as part of Phase 2 to explore addition vessels including local options – existing vessels in the Tampa Bay region that currently are underutilized and may be appropriate for an initial service option. The vessel identified for this preliminary analysis meets the key requirements; it has a cruising speed of 35 knots, has a shallow draft (18 inches at speed), carries 42 passengers, and a crew requirement of two.4 Vessel characteristics are provided in Figure 4.2.
Twenty-eight peak period trips (14 in AM and PM) will be required to handle daily ridership of 1,020; 20 for Gibsonton to MacDill AFB and 8 for Apollo Beach to MacDill AFB. With travel times of 9 and 11 minutes for the two selected routes, three vessels for Gibsonton to MacDill and one for Apollo Beach to MacDill AFB will be necessary for each two hour peak period. There will be excess capacity available in all vessels should the traffic level grow.5
Preliminary estimates have been developed for three fare levels. A fare consistent with existing premium transit service ($2.50) yields a 45 percent farebox recovery. A $4.00 fare would yield a 72 percent recovery of operating costs; a $5.60 fare would provide approximately 100 percent recovery. Preliminary estimates of vessel costs (capital costs) are $550,000 per vessel, or $2.2 million. Station development costs have not been estimated as part of this phase. Table 4.8, Table 4.9, and Table 4.10 provide a breakdown of costs and revenues for the three fares defined above. Table 4.8 provides an estimate of costs and revenues for the service between MacDill AFB and Gibsonton; Table 4.9 provides an estimate for the service between MacDill AFB and Apollo Beach; Table 4.10 shows the combined costs and revenues based on Table 4.8 and Table 4.9.6
4 www.bentzboats.com/Sommer%20Star.pdf 5 A 35-knot cruising speed was assumed for this refined analysis; this speed was required
to meet peak period demands with the defined number of vessels and headways. 6 For this preliminary analysis, operating cost estimates include: vessel crew, station
attendant, fuel, storage, maintenance, insurance, and administration.

Hillsborough County Water Ferry Feasibility Study
4-22 Hillsborough County MPO
POSSIBLE USES
Public Transportation – With its capacity to carry 42 passengers at 40 mph cruising speeds, in water as shallow as 18 inches, along with its low maintenance aluminum hull and Hamilton jet pumps, it offers an attractive alternative to buses and trains along inland waterways.
Tour Operators – Capable of speeds up to 50 mph, hotels, cruise lines, resorts, and tour companies can offer unique trips to enhance the experience of their guests.
Source: www.bentzboats.com/Sommer%20Star.pdf
Figure 4.2 Potential Vessel

Hillsborough County Water Ferry Feasibility Study
Hillsborough County MPO 4-23
Table 4.8 Estimate of Costs and Revenues - MacDill AFB & Gibsonton Total Daily Riders (399 per direction) 798 798 798
Vessels Required 3 3 3
Crew (Captain, First Mate, Shore Hand) $1,255 $1,255 $1,255
Fuel $972 $972 $972
Vessel Storage (Security) $69 $69 $69
Insurance Costs (20% of Operating Costs) $459 $459 $459
Administrative & Business Costs (10% of Operating Costs) $276 $276 $276
Total Operating Cost Per Day $3,031 $3,031 $3,031
Maintenance Cost Per Day (30% of Operating) $909 $909 $909
Total Operating & Maintenance Costs Per Day $3,940 $3,940 $3,940
Capital Cost Per Vessel $550,000 $550,000 $550,000
Total Capital Cost $1,650,000 $1,650,000 $1,650,000
Fare $2.50 $4.00 $5.60
Revenues/Day $1,995 $3,192 $4,469
Profit/Day $(1,945) $(748) $529
Annual Subsidy $(505,701) $(194,481) $137,487
Farebox Recovery 51% 81% 113%
Sources: Cambridge Systematics, Inc. analysis.
Please note that the cost estimates do not include additional capital cost like ferryboat terminals/stations
Crew costs estimated based upon www.salaryexpert.com
Dockage costs estimated based upon www.docksearch.com
Fuel costs estimated based upon vessel operating parameters (www.bentzboats.com) and diesel costs in Florida (www.eia.doe.gov).
Capital costs estimated by Cambridge Systematics, Inc. based on previous work.
Annual costs based on 260 days per year.

Hillsborough County Water Ferry Feasibility Study
4-24 Hillsborough County MPO
Table 4.9 Estimate of Costs and Revenues - MacDill AFB & Apollo Beach Total Daily Riders (111 per direction) 222 222 222
Vessels Required 1 1 1
Crew (Captain, First Mate, Shore Hand) $534 $534 $534
Fuel $540 $540 $540
Vessel Storage (Security) $23 $23 $23
Insurance Costs (20% of Operating Costs) $219 $219 $219
Administrative & Business Costs (10% of Operating Costs) $132 $132 $132
Total Operating Cost Per Day $1,448 $1,448 $1,448
Maintenance Cost Per Day (30% of Operating) $434 $434 $434
Total Operating & Maintenance Costs Per Day $1,882 $1,882 $1,882
Capital Cost Per Vessel $550,000 $550,000 $550,000
Total Capital Cost $550,000 $550,000 $550,000
Fare $2.50 $4.00 $5.60
Revenues/Day $555 $888 $1,243
Profit/Day $(1,327) $(994) $(639)
Annual Subsidy $(345,017) $(258,437) $(166,085)
Farebox Recovery 29% 47% 66%
Sources: Cambridge Systematics, Inc. analysis.
Please note that the cost estimates do not include additional capital cost like ferryboat terminals/stations
Crew costs estimated based upon www.salaryexpert.com
Dockage costs estimated based upon www.docksearch.com
Fuel costs estimated based upon vessel operating parameters (www.bentzboats.com) and diesel costs in Florida (www.eia.doe.gov).
Capital costs estimated by Cambridge Systematics, Inc. based on previous work.
Annual costs based on 260 days per year.

Hillsborough County Water Ferry Feasibility Study
Hillsborough County MPO 4-25
Table 4.10 Estimate of Total Costs and Revenues Total Daily Riders 1,020 1,020 1,020 Gibsonton (399 per direction) 798 798 798
Apollo Beach (111 per direction) 222 222 222
Vessels Required 4 4 4
Crew (Captain, First Mate, Shore Hand) $1,702 $1,702 $1,702
Fuel $1,512 $1,512 $1,512
Vessel Storage (Security) $92 $92 $92
Insurance Costs (20% of Operating Costs) $661 $661 $661
Administrative & Business Costs (10% of Operating Costs) $397 $397 $397
Total Operating Cost Per Day $4,364 $4,364 $4,364
Maintenance Cost Per Day (30% of Operating) $1,309 $1,309 $1,309
Total Operating & Maintenance Costs Per Day $5,673 $5,673 $5,673
Capital Cost Per Vessel $550,000 $550,000 $550,000
Total Capital Cost $2,200,000 $2,200,000 $2,200,000
Fare $2.50 $4.00 $5.60
Revenues/Day $2,550 $4,080 $5,712
Profit/Day $(3,123) $(1,593) $39
Annual Subsidy $(812,108) $(414,308) $10,012
Farebox Recovery 45% 72% 101%
Sources: Cambridge Systematics, Inc. analysis.
Please note that the cost estimates do not include additional capital cost like ferryboat terminals/stations
Crew costs estimated based upon www.salaryexpert.com
Dockage costs estimated based upon www.docksearch.com
Fuel costs estimated based upon vessel operating parameters (www.bentzboats.com) and diesel costs in Florida (www.eia.doe.gov).
Capital costs estimated by Cambridge Systematics, Inc. based on previous work.
Annual costs based on 260 days per year.


Hillsborough County Water Ferry Feasibility Study
Hillsborough County MPO 5-1
5.0 Recommendations
5.1 KEY CONSIDERATIONS FOR NEXT STEPS RAISED BY STAKEHOLDERS As part of final stakeholder outreach efforts, a number of comments were provided to the study team for consideration. These comments are summarized below:
• Evaluate potential station locations, including ownership, location, zoning, community acceptance, etc.
• Evaluate additional key capital cost items, like station development, including docks, concessions, ticketing, parking lots, etc.
• Calculate cost associated with transfer service at destinations (e.g., shuttle bus service needed to move passengers to/from MacDill AFB station and final destination;
• Incorporate security check time penalties at ferry stations into travel time analysis an document impact;
• Evaluate impact of inclement weather on ferry travel time and ferry service reliability;
• Evaluate the impact of other vessel traffic on ferry operating speed (e.g., safety zones for cargo vessels transporting hazardous materials, slow moving cargo vessels, U.S. Coast Guard restrictions, etc.;
• Develop an enhanced analysis of the market for ferry service to MacDill AFB (e.g., existing and future market size, market location, existing mode share of market, willingness to use ferry service, flexibility requirements for off-peak service, etc.);
• Evaluate environmental benefits of ferry service;
• Incorporate and evaluate impact of full cost of auto trips (e.g., mileage rate used to capture all costs, not just fuel).
This input will be used to help guide development of the Phase 2 scope.

Hillsborough County Water Ferry Feasibility Study
5-2 Hillsborough County MPO
5.2 DEVELOPMENT OF MACDILL AFB SERVICE Several key activities are recommended to implement an initial MacDill AFB-based waterborne passenger service.
• Build consensus with regional leaders and elected officials. Study findings should be presented to key decision makers to build support for the initial service. Based on these discussions, the study findings should be refined as necessary to document agreed upon next steps.
• Work with land owners to evaluate station locations. Potential sites have been identified. Meetings with the owners will be critical to refine the locations, determine investment requirements, or seek alternative locations.
• Identify and evaluate available vessels. Vessels that meet the service requirements should be identified; this should include outreach to local marine operators to determine the availability of local under-utilized vessels.
• Identify and define operator options. Evaluate the range of options for operation of the service. Public, private, and public-private options should be considered.
• Refine market estimates. Based upon the above activities, ridership estimates should be refined; based on the above input, the estimate could increase or decrease.
• Determine financial/business model options. Review available financing options from county, state, national, and private sources. Evaluate the implications of various business models. This should include review of the federal Ferry Boat Discretionary program.
• Prepare marketing material for initial service. In order for the service to be successfully developed and implemented, the potential market must be presented with a detailed description of the service. Brochures, flyers, and other media should be developed that describe the stations, the routes, the schedule, the parking, and the cost. This material should be used to support the outreach program discussed below.
• Conduct community outreach. Develop and implement an outreach program at MacDill AFB and the communities of Gibsonton and Apollo Beach. This should include workshops and public meetings designed to inform, seek feedback, and build support for the service.
• Develop and implement service. The above activities should be used to develop an initial service; this can be a proof of concept/demonstration project or simply an initial deployment.
• Expand service options over time. Based upon the success of the initial service, consider expanding the service to meet community demands.

Hillsborough County Water Ferry Feasibility Study
Hillsborough County MPO 5-3
5.3 OTHER OPPORTUNITIES In addition the commuter-based MacDill AFB service, several other opportunities should be explored:
• Monitor and explore other commuter routes. In addition to the two commuter-based MacDill AFB routes, other opportunities exist for the Tampa Bay region. Several other commuter-based routes should be considered over the medium to longer term based upon the success of the initial service and ongoing developments throughout the region to enhance public transportation options. The major destinations of Downtown Tampa and Downtown St Petersburg represent two opportunities where water ferry service does not currently exceed the service provided by personal autos, however, the travel time is close enough in some markets that transit-friendly patrons may be willing to use the service – especially after an initial service has been implemented and proven to be reliable and as regional congestion worsens.
• Explore market for recreational/excursion service. In addition to commuter-based service, recreational, excursion, tourist-based alternatives should be considered. This is critical to ensure effective utilization of vessels, infrastructure, and crew – particularly during off-peak weekday periods. This may help generate additional revenue for the operator and also provide an ongoing opportunity to build support for water-based passenger service by exposing additional segments of the population.
5.4 PHASE 2 NEXT STEPS The above recommendations address a full range of activities required to implement a water ferry service. Based upon stakeholder input and MPO guidance, a short list of immediate action items has been identified to guide development of the Phase 2 Study. The purpose of the Phase 2 Study will be to provide community leaders with additional information to address identified concerns and better answer the question of feasibility. These action items include:
• Further evaluate market potential for an initial closed-loop MacDill AFB service;
• Conduct detailed market research with MacDill employees;
• Evaluate commitment of MacDill to support water-based service, including financial subsidy similar to existing express bus service;
• Evaluate key station sites, including development requirements, costs, and availability; and
• Refine vessel operational parameters based on further review and input.