HIGHER EDUCATION IN FACTS AND FIGURES · INTRODUCTION Welcome to the 2017 edition of Higher...
35
HIGHER EDUCATION IN FACTS AND FIGURES 2017
Transcript of HIGHER EDUCATION IN FACTS AND FIGURES · INTRODUCTION Welcome to the 2017 edition of Higher...

HIGHER EDUCATION IN
FACTS AND FIGURES2017
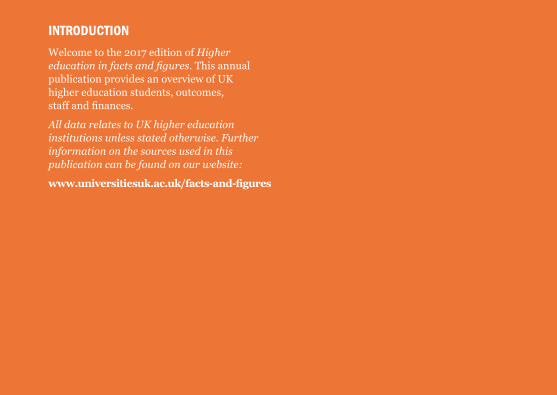
INTRODUCTION
Welcome to the 2017 edition of Higher education in facts and figures. This annual publication provides an overview of UK higher education students, outcomes, staff and finances.
All data relates to UK higher education institutions unless stated otherwise. Further information on the sources used in this publication can be found on our website:
www.universitiesuk.ac.uk/facts-and-figures

14% of undergraduates, 38% of postgraduates and
29% of academic staff are from outside of the UK.
University applications from
18-year-olds in areas of England with lower
higher education participation rates have increased
to record levels.
Employment rates and median salaries continue to
be higher for graduates than for non-graduates.
In 2017, overall student satisfaction at UK higher
education institutions was 84%.
Just under a quarter of total university income is from direct
UK government sources.
16% of research income came from sources outside of the UK.
For further information: Tel: +44 (0)20 7419 4111
Visit: www.universitiesuk.ac.uk Email: [email protected]
HIGHLIGHTS 3
High
lights

4
Con
tents
CONTENTS
STUDENTS Students by country of provider, 2014–15 to 2015–16 7
Students by level of study and mode of study, 2015–16 8
Young university application rates, 2006 to 2017 9
Application rates from the most disadvantaged 18-year-olds, 2006 to 2017 10
Students by subject area, 2015–16 11
Students by domicile and level of study, 2015–16 12
Top 20 home countries of non-UK students, 2015–16 13
Non continuation rates, 2006−07 to 2014–15 14
OUTCOMESQualifications awarded by mode of study, 2015–16 16
Qualifications awarded by domicile, 2015–16 17
Destinations of UK-domiciled leavers by level of qualification and sex, 2015–16 18
Destinations of UK- and other EU-domiciled leavers, 2011−12 and 2015−16 19
Unemployment rates and median salaries in the UK, 2016 20
National Student Survey, 2017 21
STAFFStaff by nationality and contract level, 2015–16 23
Academic staff, 2015–16 24
Staff salaries by sex, 2015–16 25

5
Con
tents
FINANCEIncome and size of higher education institutions, 2014−15 to 2015−16 27
Income of higher education institutions by source, 2015–16 28
Teaching and research income of higher education institutions, 2015–16 29
Operating expenditure of higher education institutions, 2015–16 30
ANNEXESources 31
Glossary 32
Notes on data 34

STUDENTS
With the UK attracting more students from overseas than any other country besides the United States, its student population is incredibly diverse. Overall, 14% of undergraduates and 38% of postgraduates were from outside of the UK.
The way that students complete their studies also varies. In 2015–16, 82% of undergraduates studied full time, whereas 43% of postgraduates studied part time.

0.9%
-2.1%
-3.2%
1.3%
235,565 TOTAL 2.6% FULL-TIME-2.8% PART-TIME19 PROVIDERS
Scotland
1,861,345 TOTAL 2.9% FULL-TIME-5.0% PART-TIME132 PROVIDERS
Wales
128,675 TOTAL -0.3% FULL-TIME
-9.9% PART-TIME10 PROVIDERS
Northern Ireland
55,245 TOTAL -1.9% FULL-TIME -2.6% PART-TIME
5 PROVIDERS
England
STUDENTS BY COUNTRY OF PROVIDER, 2014–15 TO 2015–16
In 2015, the number of full-time students at UK higher education institutions increased in England and Scotland. All home nations showed decreases in numbers of part-time students.
Note: figures show numbers in 2015−16, and percentage changes between 2014−15 and 2015−16. The Open University has been distributed across each of the home nations.
7
Stu
den
ts

8
Stu
den
ts
STUDENTS BY LEVEL OF STUDY AND MODE OF STUDY, 2015−16
Part-time students make up 75% of other undergraduate students and a quarter of postgraduate (research) students at UK higher education institutions. 89% of undergraduates undertaking a first degree are studying full time.
Postgraduate (research)
113,175
Postgraduate (taught)
419,795
Otherundergraduate
183,955
First degree
1,563,900
53%
25%
25%
75%
24%
76%
11%
89%
47%
75%
Total 2,280,830
Full-time Part-time Full-time Part-time

9
Stu
den
ts
20
25
30
35
40
45
50
2006 2007 2008 2009 2010 2011 2012 2013 2014 20172015 2016
Northern Ireland England Scotland Wales
Year
Ap
pli
cati
on r
ate
(%
)
48%
37%
33%
32%
YOUNG UNIVERSITY APPLICATION RATES, 2006 TO 2017
18-year-olds from England were more likely to apply to full-time, undergraduate study in 2017 than in any previous year. From 2016 to 2017, the 18-year-old application rate decreased in Wales and Northern Ireland, and remained the same in Scotland.

APPLICATION RATES FROM THE MOST DISADVANTAGED 18-YEAR-OLDS, 2006 TO 2017
18-year-olds from the lowest areas of participation in England and Scotland are more likely than ever to apply to university.
Northern Ireland England Scotland Wales
Ap
pli
cati
on r
ate
(%
)
Ap
pli
cati
on r
ate
(%
)
0
5
10
15
20
25
30
2006
2007
2008
2009
2010
2011
2012
2013
2014
2015
2016
2017
2006
2007
2008
2009
2010
2011
2012
2013
2014
2015
2017
2016
0
5
10
15
2024.4%
22.5%
19.7%
17.0%
Note: POLAR3 method is used for England, Wales and Northern Ireland, while SIMD is used for Scotland. Therefore, they are not directly comparable. Application rates reported for Scotland are lower, as a substantial section of Scottish providers do not use UCAS.
10
Stu
den
ts

11
Stu
den
ts
STUDENTS BY SUBJECT AREA, 2015−16
Undergraduate numbers at UK higher education institutions are highest for business, subjects allied to medicine, and biological sciences, while for postgraduates, the numbers are highest for business, education, and subjects allied to medicine.
Su
bjec
t a
rea Computer science
Mathematical sciencesPhysical sciences
Agriculture & related subjects
Social studiesArchitecture, building & planning
Engineering & technology
Mass communications & documentationLanguages
Business & administrative studiesLaw
Creative arts & designEducationCombined
Historical & philosophical studies
Veterinary scienceBiological sciences
Subjects allied to medicineMedicine & dentistry
0 350,000250,000200,000 300,000150,000100,00050,000
Undergraduate Postgraduate

STUDENTS BY DOMICILE AND LEVEL OF STUDY, 2015−16
14% of undergraduate students and 38% of postgraduate students at UK higher education institutions are from outside of the UK.
0 400,000 800,000 1,200,000 1,600,000
First degree
Otherundergraduate
Pos
tgra
du
ate
Un
der
gra
du
ate
UK Non-European UnionOther European Union
1,342,770
77,825166,795
12,885
143,300
4,275
Postgraduate(research)
64,28533,680
15,205
Postgraduate(taught)
268,470
30,130
120,710
12
Stu
den
ts

13
Stu
den
ts
TOP 20 HOME COUNTRIES OF NON-UK STUDENTS, 2015−16
In 2015−16, the top six home countries of non-UK students were China – accounting for 21% of non-UK students – Malaysia, the United States, India, Hong Kong and Nigeria (accounting for 4% each).
Country Count Percentage Country Count Percentage
China 91,215 21% Greece 9,790 2%
Malaysia 17,405 4% Cyprus 9,140 2%
United States 17,115 4% Saudi Arabia 8,570 2%
India 16,745 4% Spain 7,840 2%
Hong Kong 16,745 4% Singapore 7,540 2%
Nigeria 16,100 4% Romania 7,200 2%
Germany 13,425 3% Bulgaria 6,195 1%
France 12,525 3% Thailand 6,095 1%
Italy 12,135 3% Canada 5,980 1%
Ireland 10,245 2% Poland 5,655 1%

NON-CONTINUATION RATES, 2006−07 TO 2014−15
In 2014−15, the percentage of UK-domiciled, full-time, first degree entrants not continuing in higher education after their first year was below the level seen in 2006−07.
Non
-con
tin
ua
tion
ra
te (
%)
0
2
4
6
10
8
12
14
16
2006–07 2007−08 2008–09 2009–10 2010–11 2011–12 2012–13 2013–14 2014–15
Young students Mature students
6.2%
11.7%
14
Stu
den
ts

OUTCOMES
The 2017 National Student Survey showed that student satisfaction was 84% overall, and there is a growing public and policy interest in the student experience and graduate outcomes.
Salaries and employment rates continue to be higher for both undergraduates and postgraduates when compared to non-graduates, while more than 90% of UK-domiciled undergraduates and postgraduates were working and/or pursuing further study six months after graduation.
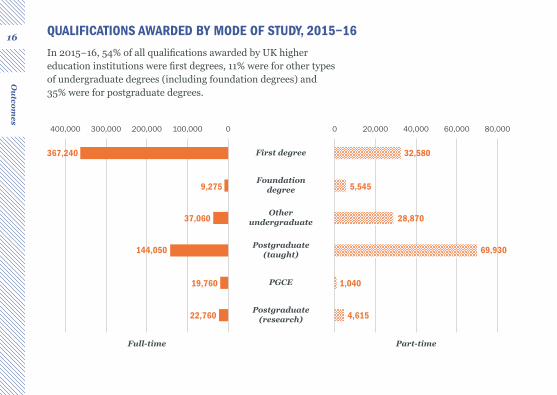
QUALIFICATIONS AWARDED BY MODE OF STUDY, 2015−16
In 2015−16, 54% of all qualifications awarded by UK higher education institutions were first degrees, 11% were for other types of undergraduate degrees (including foundation degrees) and 35% were for postgraduate degrees.
First degree
Foundationdegree
Otherundergraduate
Postgraduate(taught)
PGCE
Postgraduate(research)
Full-time Part-time
400,000 0 0100,000200,000300,000 60,000 80,00040,00020,000
367,240
9,275 5,545
32,580
28,870
69,930
1,040
4,615
37,060
144,050
19,760
22,760
16
Ou
tcomes
Ou
tcomes

17
Ou
tcomes
QUALIFICATIONS AWARDED BY DOMICILE, 2015−16
In 2015–16, 74% of qualifications awarded to UK students were undergraduate degrees, while 62% of qualifications awarded to non-UK students were postgraduate degrees.
0% 20% 40% 60% 80% 100%
First degree
Foundationdegree
HNC/HND
Otherundergraduate
Postgraduate(research)
Postgraduate(taught)
UK full-time UK part-time Other European Union full-time
Non-European Union full-time
Other European Union part-time
Non-European Union part-time

18
Ou
tcomes
Ou
tcomes
DESTINATIONS OF UK-DOMICILED LEAVERS BY LEVEL OF QUALIFICATION AND SEX, 2015−16
Six months after graduation, 93% of postgraduates and 90% of undergraduates were working and/or pursuing further study.
0% 20% 40% 60% 80% 100%
Postgraduatetotal
Postgraduatefemale
Postgraduatemale
Undergraduatefemale
Undergraduatetotal
Undergraduatemale
Work Work and further study Further study Unemployed Other
84% 4% 5% 3%4%
67% 6% 17% 5% 5%
68% 7% 16% 4% 5%
66% 6% 18% 7% 4%
83% 4% 6% 3% 4%
81% 4% 7% 5% 3%
Un
der
gra
du
ate
Pos
tgra
du
ate

19
Ou
tcomes
DESTINATIONS OF UK- AND OTHER EU-DOMICILED LEAVERS, 2011−12 AND 2015−16
The percentage of leavers in work or further study has increased from 89% in 2011−12 to 92% in 2015−16.
67%64%
14% 15%
5%
4%4%
4%
7%
7%
UK work Overseas work Further studyWork and further study Unemployed Other
4%
6%2011–12 2015–16

20
Ou
tcomes
Ou
tcomes
UNEMPLOYMENT RATES AND MEDIAN SALARIES IN THE UK, 2016
Median salaries and employment rates continue to be higher for both undergraduates and postgraduates when compared to non-graduates.
0%
10%
30%
50%
20%
40%
60%
70%
80%
90%
Postgr
aduate
Graduate
Non-gr
aduate
High-skill employment rate (16–64 year olds)
Young high-skill employment rate (21–30 year olds)
Young unemployment rate (21–30 year olds) Unemployment rate (16–64 year olds)
Young median salary (21–30 year olds)
Median salary (16–64 year olds)
0%
1%
3%
2%
5%
4%
6%
7%
8%
9%
Postgr
aduate
Graduate
Non-gr
aduate
£15,000
£10,000
£5,000
£0
£20,000
£25,000
£30,000
£35,000
£40,000
Postgr
aduate
Graduate
Non-gr
aduate
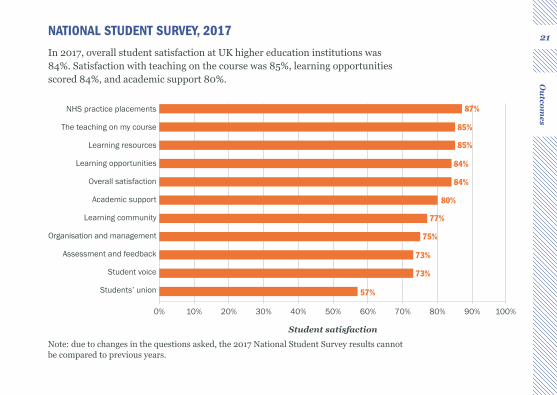
NATIONAL STUDENT SURVEY, 2017
In 2017, overall student satisfaction at UK higher education institutions was 84%. Satisfaction with teaching on the course was 85%, learning opportunities scored 84%, and academic support 80%.
0% 10% 20% 30% 40% 50% 60% 70% 80% 90% 100%
NHS practice placements
The teaching on my course
Learning resources
Learning opportunities
Overall satisfaction
Academic support
Learning community
Organisation and management
Assessment and feedback
Student voice
Students’ union
Student satisfaction
87%
85%
85%
84%
84%
80%
77%
75%
73%
73%
57%
Note: due to changes in the questions asked, the 2017 National Student Survey results cannot be compared to previous years.
21
Ou
tcomes

STAFF
29% of the UK’s academic staff are from overseas, with 17% from other EU countries.Nearly a quarter of senior lecturers and 18% of professors working at UK higher education institutions are non-UK nationals. Females make up 45% of the academic workforce.
23
Sta
ff
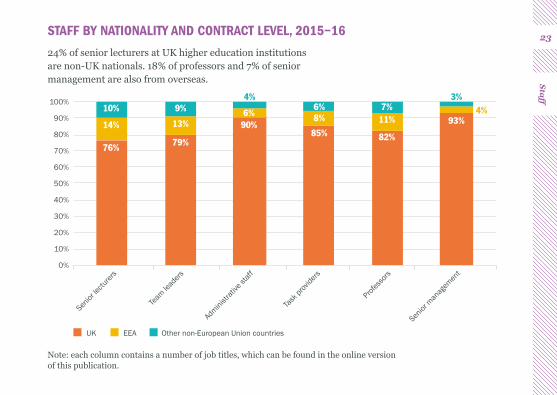
STAFF BY NATIONALITY AND CONTRACT LEVEL, 2015−16
24% of senior lecturers at UK higher education institutions are non-UK nationals. 18% of professors and 7% of senior management are also from overseas.
UK EEA Other non-European Union countries
0%
10%
20%
30%
40%
50%
60%
70%
80%
90%
100%
Senior
lectu
rers
Senior
man
agem
ent
Profes
sors
Administ
rative
staff
Task
providers
Team
lead
ers
76%
14%
10%
79%
13%
9%
90%
4%
6%
85%
8%6%
82%
11%7%
93%4%
3%
200
300
400
500
Note: each column contains a number of job titles, which can be found in the online version of this publication.

24
Sta
ff
ACADEMIC STAFF, 2015−16
29% of academic staff at UK higher education institutions are from outside of the UK. A third of academic staff are employed on a part-time basis.
Sta
ff
Academic staff by nationality and sex
Academic staff by employment function and mode of employment
0
20,000
40,000
60,000
80,000
120,000
100,000
Teac
hing and
resea
rch
Resea
rch on
ly
Teac
hing only
Neither
teach
ing
nor res
earch
Full-time Part-time
7%
5%
9%
8%
Male non-EU staff
Female non-EU staff
Male other EU staff
Female other EU staff
Male UK staff
Female UK staff
39%
32%
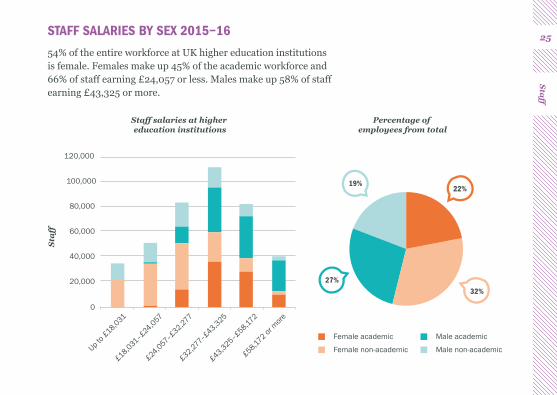
STAFF SALARIES BY SEX 2015−16
54% of the entire workforce at UK higher education institutions is female. Females make up 45% of the academic workforce and 66% of staff earning £24,057 or less. Males make up 58% of staff earning £43,325 or more.
Sta
ff
Percentage of employees from total
0
20,000
40,000
60,000
80,000
120,000
100,000
Up to £18,031
£18,031–£24,057
£24,057–£32,277
£32,277–£43,325
£43,325–£58,172
£58,172 or
more
22%
32%27%
19%
Staff salaries at higher education institutions
Female academic
Female non-academic
Male academic
Male non-academic
25
Sta
ff
FINANCE
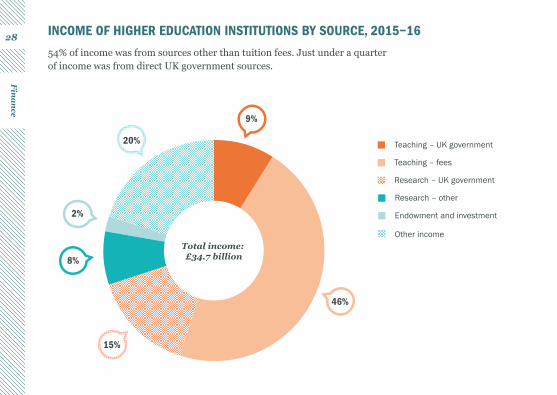
Higher education institutions raise income from a wide range of sources. In 2015−16, 54% of income was from sources other than tuition fees, while 24% of income was from direct UK government sources. 16% of research income came from non-UK sources.
55% of spending at UK higher education institutions was related to teaching and research activities, which includes spending on academic and support staff working in academic departments. Additional spending also contributes to the student experience, including spending on libraries, accommodation and IT.

27
Fin
an
ce
INCOME AND SIZE OF HIGHER EDUCATION INSTITUTIONS, 2014–15 TO 2015–16
In 2015–16, nearly two-thirds of UK higher education institutions had an income of more than £100 million. Just over a quarter of institutions had over 20,000 students.
Inco
me
Nu
mbe
r of
stu
den
ts
Number of institutions Number of institutions
2014–15 (restated) 2015–16 2014–15 2015–16
0 10 20 30 40 50 60 0 10 20 30 40
More than £1bn
£500–1000m
£200–500m
£100–200m
£50–100m
£20–50m
£10–20m
Less than £10m
50,000 to 200,000
30,000 to 50,000
25,000 to 30,000
20,000 to 25,000
15,000 to 20,000
10,000 to 15,000
5,000 to 10,000
1,000 to 5,000
Less than 1,000
28
Fin
an
ce
Teaching – UK government
Teaching – fees
Research – UK government
Research – other
Endowment and investment
Other income
46%
15%
8%
2%
20%
9%
Total income: £34.7 billion
INCOME OF HIGHER EDUCATION INSTITUTIONS BY SOURCE, 2015−16
54% of income was from sources other than tuition fees. Just under a quarter of income was from direct UK government sources.

Research income by source
Teaching income by source
64%
4%
11%
UK governmentUK charitiesUK business
EU sourcesNon-EU sourcesOther sources
15%
6% 1%
49%
6%
23%
17%
UK and EU undergraduate feesUK and EU postgraduate feesNon-EU fees
UK government grantsOther fees and grants
5%
TEACHING AND RESEARCH INCOME OF HIGHER EDUCATION INSTITUTIONS, 2015−16
In 2015–16, UK higher education institutions received a total of £19.1 billion in teaching income. Institutions also received £7.8 billion in research income, of which 16% came from non-UK sources.
29
Fin
an
ce

30
Fin
an
ce
OPERATING EXPENDITURE OF HIGHER EDUCATION INSTITUTIONS, 2015−16
55% of spending by higher education institutions was related to teaching and research activities, which includes spending on academic and support staff working in academic departments.
0% 10% 20% 30% 40% 50% 60%
Teaching and research
Maintaining campuses
Libraries, IT and museums
Running the university
Accommodation andconferences
Financial support to studentsand outreach
Student and staff facilities
Other expenditure
Percentage of university expenditure
55%
11%
9%
7%
5%
4%
3%
5%
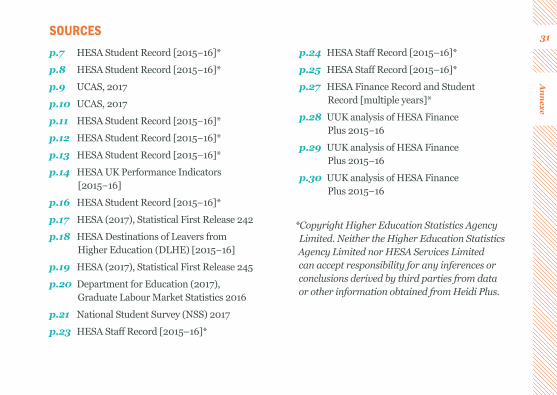
SOURCES
p.7 HESA Student Record [2015−16]*
p.8 HESA Student Record [2015−16]*
p.9 UCAS, 2017
p.10 UCAS, 2017
p.11 HESA Student Record [2015−16]*
p.12 HESA Student Record [2015−16]*
p.13 HESA Student Record [2015−16]*
p.14 HESA UK Performance Indicators [2015−16]
p.16 HESA Student Record [2015−16]*
p.17 HESA (2017), Statistical First Release 242
p.18 HESA Destinations of Leavers from Higher Education (DLHE) [2015−16]
p.19 HESA (2017), Statistical First Release 245
p.20 Department for Education (2017), Graduate Labour Market Statistics 2016
p.21 National Student Survey (NSS) 2017
p.23 HESA Staff Record [2015–16]*
p.24 HESA Staff Record [2015–16]*
p.25 HESA Staff Record [2015–16]*
p.27 HESA Finance Record and Student Record [multiple years]*
p.28 UUK analysis of HESA Finance Plus 2015−16
p.29 UUK analysis of HESA Finance Plus 2015−16
p.30 UUK analysis of HESA Finance Plus 2015−16
*Copyright Higher Education Statistics Agency Limited. Neither the Higher Education Statistics Agency Limited nor HESA Services Limited can accept responsibility for any inferences or conclusions derived by third parties from data or other information obtained from Heidi Plus.
31
An
nexe

32
An
nexe
GLOSSARY
Application rateThe number of applicants divided by the estimated base population.
DLHEThe Destinations of Leavers from Higher Education (DLHE) survey asks leavers from higher education what they are doing six months after graduation. About three-quarters of leavers complete the survey.
DomicileA student’s permanent country of residence.
EEAThe European Economic Area (EEA) is the 28 EU countries plus Norway, Iceland and Liechtenstein.
First degreeA three- or four-year undergraduate higher education course taken after finishing further education, generally resulting in a bachelor’s degree.
Higher education institutions In 2015–16, there were 162 higher education institutions in the UK in receipt of public funding
via one of the UK funding councils. This report features aggregated data from all 162, plus the University of Buckingham, largely based on institutional returns to the Higher Education Statistics Agency (HESA). On page 7, students from The Open University have been split across each UK nation to better reflect the number of students in each part of the UK.
Unless explicitly stated otherwise, the analysis in this report therefore excludes other higher education providers, including alternative providers or further education colleges that currently do not return consistent and full data to HESA.
HEFCE The Higher Education Funding Council for England (HEFCE) funds and regulates universities and colleges in England.
HESA Higher Education Statistics Agency.

33
An
nexe
High-skill employment (ONS definition) Occupations at this level are generally termed ‘professional’ or ‘managerial’ positions, and are found in corporate enterprises or governments. Examples include senior government officials; financial managers; scientists; engineers; medical doctors; teachers; and accountants.
Mode of studyWhether a student studies full or part time.
Non-continuation rateFor this publication, the non-continuation rate is the percentage of full-time, first degree entrants not continuing in higher education after their first year.
NSS National Student Survey.
Other undergraduate Undergraduate degrees which are not first degrees, including foundation degrees and Higher National Diplomas.
POLAR3Participation of Local Areas (POLAR) is a widening participation measure which classifies local areas or ‘wards’ into five groups, based on the proportion of 18-year-olds who enter higher education aged 18 or 19 years old. These groups range from quintile 1 areas, with the lowest young participation (most disadvantaged), up to quintile 5 areas with the highest rates (most advantaged).
SIMDThe Scottish index of multiple deprivation (SIMD) ranks small geographical areas in Scotland by their relative level of deprivation across a range of measures. Data used in this publication refers to 18-year-olds from the most disadvantaged SIMD quintile.

NOTES ON DATA
All percentages have been calculated using raw figures and rounded, and therefore rounded figures may not sum precisely.
Full data and further information on sources can be found on our website:
www.universitiesuk.ac.uk/facts-and-figures
34
An
nexe

UNIVERSITIES UK
Universities UK is the representative organisation for the UK’s universities. Founded in 1918, our mission is to be the voice of universities in the UK, providing high quality leadership and support to our members to promote a successful and diverse higher education sector. With 136 members and offices in London, Cardiff (Universities Wales) and Edinburgh (Universities Scotland), we promote the strength and success of UK universities nationally and internationally.
Woburn House, 20 Tavistock Square, London, WC1H 9HQ
Tel: +44 (0)20 7419 4111 Email: [email protected] Web: www.universitiesuk.ac.uk Twitter: @UniversitiesUK
ISBN 978-1-84036-386-9 October 2017