Continuum models of the mechanical behavior of rolled and die-cast ...

High Temperature Mechanical Properties of Cast as well asPowder Metallurgical Manufactured Metallic Foams
Von der Fakultät für Georessourcen und Materialtechnik
der Rheinisch- Westfälischen Technischen Hochschule Aachen
Zur Erlangung des akademischen Grades eines
Doktors der Ingenieurwissenschaften
genehmigte Dissertation
vorgelegt von M. Sc.
Mohamed Shehata Mohamed Abbas Aly
aus El-Giza / Ägypten
Berichter: Univ.-Prof. Dr.-Ing. Wolfgang Bleck
Univ.-Prof. Dr. rer. nat. Dr.-Ing. e.h. Winfried Dahl
Tag der mündlichen Prüfung: 03.11. 2004
Diese Dissertation ist auf den Internetseiten der Hochschulbibliothek online verfügbar

Acknowledgement
The content of this Dissertation was carried out during my work at the Department of Ferrous
Metallurgy (IEHK) RWTH Aachen University, as a scholarship holder supported by the
Ministry of Higher Education and Scientific Research in Egypt. I gratefully acknowledge the
Egyptian government for supporting me during my study in Germany.
I would like to express my appreciation and gratitude to my supervisor Prof. Dr.-Ing. W. Bleck
for the scientific guidance and his interest in my work.
I also thank Prof. Dr.-Ing. e.h. W. Dahl for taking over the co-referee.
The help of the academic director of the institute Dr.-Ing. G. Heßling as well as the plant
engineer Dipl.-Ing. G. Leisten in solving all the problems related to my work is gratefully
acknowledged. I also appreciate the helpful technical advice of Dr. P.-F. Scholz.
I appreciate the efforts of both of Mr. K. Hermann and Mr. H. Tschammer for their
contributions in carrying out the high temperature compression tests.
I thank all my colleagues at IEHK, especially my colleagues at the office, Dipl.-Ing. Patrick
Larour and M.Sc. Malek Naderi, for the comfortable working atmosphere.
A large part of this work was accomplished in many weekends and via working at the
institute until late hours, so a special acknowledgement to my patient, lovely wife who has
enabled me via managing a good environment to finish the Master as well as Doctorate at
the RWTH Aachen University. My lovely daughters Nour and Habiba are acknowledged as
well.
At least but not last, I deeply express my thanks to my lovely mother. Without her preying,
I would not be able to accomplish this work. I thank her for all, what she has made for us and
may ALLAH reward her in the paradise. I do not forget also to thank my brothers, Mostafa
(Faculty of Medicine, Cairo Uni.), Maged (Faculty of Low, Menoufia Uni.) and my sister
Mayada (secondary school) for taking care with my mother during my staying abroad.
Aachen, in November 2004
Ramadan 1425 n. H.
Mohamed Shehata Aly

Dedicated to the memory of my
father and grandparents

Contents
1
1 INTRODUCTION........................................................................................................................................ 4
2 METAL FOAMS.......................................................................................................................................... 7
2.1 INTRODUCTION ........................................................................................................................................... 7
2.2 PRODUCTION METHODS OF METALLIC FOAMS ........................................................................................... 7
2.2.1 Casting .............................................................................................................................................. 8
2.2.1.1 Foaming in Metals.................................................................................................................................... 8
2.2.1.2 Casting Metal around Granules ................................................................................................................ 9
2.2.1.3 Investment Casting ................................................................................................................................. 10
2.2.2 Coating............................................................................................................................................ 11
2.2.2.1 Chemical – electrochemical Plating ....................................................................................................... 11
2.2.2.2 Physical Vapour Deposition (PVD)........................................................................................................ 11
2.2.3 Powder Metallurgy ......................................................................................................................... 12
2.2.3.1 SRFS-Process ......................................................................................................................................... 12
2.2.3.2 Loose Powder Sintering ......................................................................................................................... 14
2.2.3.3 Fibre Metallurgy..................................................................................................................................... 14
3 DEFORMATION OF METALLIC FOAMS .......................................................................................... 16
3.1 COMPRESSIVE DEFORMATION OF METALLIC FOAMS ................................................................................ 16
3.1.1 Linear Elastic Regime ..................................................................................................................... 18
3.1.2 Plateau (Collapse) Regime ............................................................................................................. 23
3.1.3 Densification Regime ...................................................................................................................... 27
3.2 CREEP DEFORMATION OF METALLIC FOAMS ............................................................................................ 29
4 HIGH TEMPERATURE OXIDATION .................................................................................................. 33
4.1 FUNDAMENTALS OF OXIDATION ............................................................................................................... 33
4.2 FORMATION AND GROWTH OF OXIDE SCALES .......................................................................................... 35
4.3 HIGH TEMPERATURE OXIDATION OF IRON ................................................................................................ 38
5 EXPERIMENTAL WORK ....................................................................................................................... 41
5.1 TESTED MATERIALS ................................................................................................................................. 41
5.1.1 Alporas-Foams................................................................................................................................ 41
5.1.2 Distaloy and Astaloy Foams ........................................................................................................... 42
5.2 DENSITY MEASUREMENT.......................................................................................................................... 47
5.3 TESTING MACHINES.................................................................................................................................. 47
5.3.1 Compressive Testing Machine ........................................................................................................ 47
5.3.2 Schenck Equipment ......................................................................................................................... 48
5.3.3 Creep Testing Machine ................................................................................................................... 49
5.3.4 Differential Thermal Analysis ......................................................................................................... 50
5.4 FOLLOW-UP EXAMINATION....................................................................................................................... 51
5.4.1 Metallographic Characterisation.................................................................................................... 51

Contents
2
5.4.2 SEM Examination ........................................................................................................................... 52
5.4.3 Electron Probe Microanalysis ........................................................................................................ 52
6 RESULTS & DISCUSSION...................................................................................................................... 53
6.1 DENSITY MEASUREMENT.......................................................................................................................... 53
6.2 COMPRESSION TEST OF METALLIC FOAMS ............................................................................................... 53
6.2.1 Compression Test in Normal Atmosphere....................................................................................... 53
6.2.1.1 Quasi-static Compression Test of Alporas Foams.................................................................................. 53
6.2.1.1.1 Effect of Density ............................................................................................................................... 54
6.2.1.1.2 Effect of Temperature........................................................................................................................ 57
6.2.1.1.3 Effect of Strain Rate on the Mechanical Properties of Alporas Foams.............................................. 59
6.2.1.1.4 Microstructural Examination of Alporas Foams................................................................................ 60
6.2.1.1.5 SEM Characterisation of Alporas Foams .......................................................................................... 65
6.2.1.2 Quasi-static Compression Test of the Distaloy Foams ........................................................................... 65
6.2.1.2.1 Determination of the Compression Strength of the Green Distaloy Foams....................................... 65
6.2.1.2.2 Effect of Density ............................................................................................................................... 67
6.2.1.2.3 Effect of Temperature........................................................................................................................ 68
6.2.1.2.4 Metallographic Examination ............................................................................................................. 70
6.2.1.2.5 SEM Characterisation of Distaloy Foams.......................................................................................... 76
6.2.1.3 Quasi-static Compression Test of the Astaloy Foams ............................................................................ 77
6.2.1.3.1 Determination of the Compression strength of the Green Astaloy Foams......................................... 77
6.2.1.3.2 Effect of Density ............................................................................................................................... 78
6.2.1.3.3 Effect of Temperature........................................................................................................................ 79
6.2.1.3.4 Metallographic Examination ............................................................................................................. 81
6.2.1.3.5 SEM characterisation of Astaloy Foams ........................................................................................... 86
6.2.2 Compression Test in Inert Atmosphere ........................................................................................... 87
6.2.2.1 Quasi-static Compression Test of Distaloy Foams................................................................................. 87
6.2.2.1.1 Effect of Density ............................................................................................................................... 87
6.2.2.1.2 Effect of Temperature........................................................................................................................ 93
6.2.2.1.3 Metallographic Examination ............................................................................................................. 95
6.2.2.1.4 SEM Characterisation of the Distaloy Foams.................................................................................... 99
6.2.2.2 Quasi-static Compression Test of the Astaloy Foams ............................................................................ 99
6.2.2.2.1 Effect of Density ............................................................................................................................... 99
6.2.2.2.2 Effect of Temperature...................................................................................................................... 105
6.2.2.2.3 Metallographic Examination ........................................................................................................... 107
6.2.2.2.4 SEM Characterisation of the Astaloy Foams................................................................................... 110
6.2.3 Comparison between in air- in Ar Compressive Tests .................................................................. 112
6.2.3.1 Distaloy Foams..................................................................................................................................... 112
6.2.3.2 Astaloy Foams...................................................................................................................................... 113
6.2.4 Size Effect on the Foams’ Mechanical Properties ........................................................................ 118
6.2.5 Strain Rate Dependence of the Foam’s Mechanical Properties ................................................... 120
6.2.6 DTA Measurement ........................................................................................................................ 121
6.2.7 X-ray Spectrometer ....................................................................................................................... 122

Contents
3
6.2.8 Line Scan Analysis ........................................................................................................................ 123
6.3 CREEP TEST ............................................................................................................................................ 126
6.3.1 Creep of Alporas ........................................................................................................................... 126
6.3.1.1 Effect of Density .................................................................................................................................. 126
6.3.1.2 Effect of Stress ..................................................................................................................................... 129
6.3.1.3 Effect of Temperature .......................................................................................................................... 130
6.3.1.4 Microstructural Examination................................................................................................................ 133
7 SUMMARY & OUTLOOK..................................................................................................................... 135
8 KURZFASSUNG & ABSTRACT........................................................................................................... 139
9 NOMENCLATURE................................................................................................................................. 140
10 BIBLIOGRAPHY .................................................................................................................................... 143

Introduction
4
1 Introduction
When nature builds large load-bearing structures, she generally uses cellular materials.
Typical examples include wood, bones, coral and cork. There must be good reasons for this
[Ashby].
In the past, when a large dense metal contained any kind of pores, it was considered “defect”
and therefore thought unsuitable for engineering purposes. Consequently efforts were made
by engineers to produce a fully dense metal, free from any kind of pores [SIM02]. In recent
years a great importance has been attached a new class of engineering material, known as
“Porous metals or metal foams“ as a result to their unique mechanical and physical
properties. Owing to their pores, metal foams are classified into open cell and closed cell
metal foams [YU98]. Banhart [BAN02] has summarised the potential applications of metallic
foams as a function of their porosity, as shown in Fig. 1-1.
Fig. 1-1 Potential applications of metallic foams as a function of porosity [BAN02].
Closed cell foams are being used in light-weight constructions due to their high stiffness and
low density [RIN71, OLU01].Their capacity to undergo a large deformation at almost
constant stress makes them ideal energy absorbers in the automobile industry and
packaging applications [KES03, HAL00, KAN00]. Other potential applications of closed cell
metal foams include acoustic damping [HAR99].
Open cell foams however offer a wide range of applications, e.g. as a heat exchanger
[KUL73]. The high surface area and large volume of interconnected porosity of open cell
kind of
application
structural
functional
open partially open closed
heat
exchanger
filters
catalyst
supports
bearings
silencers
bio-
medical
implants
load-bearing
components
energy
absorbers

Introduction
5
foams make them attractive for use as heat sinks in electronic devices [KES03], and in
transpiration cooling [BAN02]. The interconnected porosity is of special significance for parts
like filters, diaphragms, bearings [THÜ93] in addition they can also be used as membranes
as well as in biomedical applications [RAU02]. Batteries, as in the case of nickel foams and
jewellery, as in the case of gold and silver foams [YU98] are all potential uses of open cell
foams.
Moreover metallic foams have a potential for use in applications where high temperatures
are involved, e.g. the transpiration cooled rocket nozzles, a cooling system in the burning
chamber of gas and steam turbines and as heat shielding for aircraft exhaust.
To date, research on the mechanical behaviour of metal foams has mainly been focused on
the room-temperature behaviour. This is due to that foams are mostly used at room
temperatures. However, in order to expand their applicability in the near future at high
temperatures, information is required regarding their high temperature mechanical
properties. At the present time, sparse information has been reported concerning the high
temperature mechanical properties of aluminium foams [AND99a, AND99b, AND00].
The driving force of this research work is to assess the feasibility of the applicability of such
metallic foams at high temperature applications e.g. in the transpiration cooling of the burning
chamber in gas turbines or as a core for hollow engine turbine blades, thus reducing the
overall weight and increasing the fuel performance. Other possible high temperature
applications are as thermal and sound insulators around engine burners. For this purpose,
three different types of metallic foams have been quasi-statically compressed at high
temperatures in different testing atmospheres (air and/or argon). They are:
1- AlCaTi (trade-name ALPORAS) foams, delivered by Shinko-wire Company in Japan.
This type of foams has been manufactured by the casting technique.
2- Distaloy foams based on low-alloy (Fe-Cu-Ni) steel powder.
3- Astaloy foams based on low-alloy (Fe-Mo) steel powder delivered by the company
Höganäs.
Both (2, 3) have been produced by the powder metallurgical route at the Department of
Ferrous Metallurgy (IEHK, RWTH Aachen). A set of parameters, e.g. foam’s density, test
temperature, strain rate, has been varied in order to examine the effect of each parameter on
the foam response upon testing.
When temperature goes above 0.3*Tm (Tm is the melting point in K), a time-dependant creep

Introduction
6
deformation becomes very important, especially for the foams which carry loads at elevated
temperatures for prolonged times. The effect of the foam’s density, stress as well as test
temperature on the creep behaviour of AlCaTi (ALPORAS) foams was examined. By means
of a conventionally light microscope, the changes within the cell-wall microstructure have
been investigated. Fracture surfaces of the tested metallic foams have been examined by a
scanning electron microscope.
The content of this thesis starts with giving a general review on the different production
methods of metallic foams which have been used so far, followed by a detailed chapter
concerning the behaviour of metallic foams under compressive deformation only at room
temperature. This is due to the lack of information dealing with this topic at high
temperatures. Time-dependent creep deformation of metallic foams was introduced with the
help of the present literature. High temperature oxidation of iron and some properties of the
wustite, Hematite and Magnetite scales are also presented.
The experimental work deals with the preparation and production of the tested materials, the
testing machines, and the different instruments which have been used to examine the
microstructure of the foams, through which the attained results were analysed and
interpreted.

Literature Survey
7
2 Metal Foams
2.1 Introduction
Before starting to talk about this new class of engineering materials, the meaning of a foam
has to be firstly introduced. “Foaming“ means releasing gas in a liquid, ensuring that the gas
bubbles do not escape and finally stabilising the liquid foam by cooling [DUA02].
Solid metal foams are known to have many interesting combinations of physical and
mechanical properties such as relative high stiffness, low specific weight and high gas
permeability combined with high strength. The term (metallic foams) must be distinguished
from others such as cellular metals, porous metals and metal sponges as follows:
Cellular metals refer to a metallic body with any kind of gaseous voids dispersed in it. They
are characterised by their low relative densities (< 0.3) [DEG02], whereas porous metals
(relative density > 0.3) is a term restricted to special types of voids, which are round and
isolated from each other. Metal foams are a special class of cellular metals, originating from
liquid metal foam. Metal sponges refer to a special morphology of cellular metal with usually
interconnected voids [BAN00].
2.2 Production Methods of Metallic Foams
There are many methods available to produce metallic foams [GAR67]. The first attempts on
foaming techniques in the past have pointed to the use of a gas as a blowing agent. Another
method produced an interconnected cellular structure by using granules, which can be
incorporated into the melt or introduced into a casting mould. Fig. 2-1 shows a summary of
the methods used in the production of metallic foams.

Literature Survey
8
Fig. 2-1 Methods of producing metallic foams [DAV83, HAG99].
2.2.1 Casting
2.2.1.1 Foaming in Metals
According to this process, foamed metals are produced by adding a blowing agent to
a molten metal and heating the mixture to decompose the blowing agent to evolve gas. The
gas expands causing the molten metal to foam. After foaming the resultant body is cooled to
form a foamed solid. Usually the blowing agent is a metal hydride such as TiH2 or ZrH2. As
an example for this technique is the production of Al-foams (ALPORAS) using the process
shown in Fig. 2-2.
Production Methods of Metallic Foams
Casting
Foaming in metals
Casting around granules
Investment casting
SRFS-process
Loose-powder sintering
Fibre metallurgy
Powder Metallurgy
Coating
Chemical- elctrochemical plating
Physical vapor deposition (PVD)

Literature Survey
9
1.6wt% TiH2
680°CThickening
680°CFoaming
Cooling Foamedblock
Slicing
1.5 wt% Ca, Pure Al
Fig. 2-2 ALPORAS manufacturing process [MIY99].
Another process which is based on foaming in a metal is the ALCAN process, illustrated in
Fig. 2-3. This process, which was developed by Alcan and Norsk Hydro in the late 1980‘s, is
used for the production of Al-foams.
Gas input Internal wallRotor
CuttingConveyor belt
PropellerGas output
Al-melt
Fig. 2-3 ALCAN process [ÅSH99]
In this process, a gas is dispersed into small bubbles in an aluminium melt by a rotor
impeller. The walls of the bubbles created are stabilised by refractory particles, avoiding
coalescence between them. The gas bubbles rise to the surface where they accumulate. The
accumulated foam on the melt surface is then transferred to a conveyor belt, where it
solidifies and cools [SAN92].
2.2.1.2 Casting Metal around Granules
This method produces an interconnected cellular structure or sponge metal by casting metal
around granules introduced into the casting mould, as shown in Fig.2-4. These granules can
be soluble (but heat-resistant), such as sodium chloride, which is leached out to leave a
porous metal [KUC66]. The principle of this process was developed by ACCESS e.v. in
Aachen. In this process the following three steps are included:

Literature Survey
10
1- Preparation of space-holder filler, by using either inorganic or organic granules
2- Infiltration of the filler with a metal
3- Removal of filler granules [GRO00].
Space holder
Preparation ofbulk of space
holders
Infiltration withmelt
Removal of spaceholder
MetalPore
Fig. 2-4 Casting around granules [BAN99].
2.2.1.3 Investment Casting
Investment casting technique has also been used to produce metallic foams [JPN80]. In this
process, voids of spongy foamed plastic are filled with a fluid refractory material which is then
hardened. Following this the integral plastic refractory material is heated so as to vaporise
the plastic component and a mould having sponge lattice pores is produced. Molten metal is
poured into this mould and allowed to cool and solidify. The refractory is then removed and
metallic foams having the same sponge form as the original spongy plastic are obtained.
This process was applied by the Foundry Department, Aachen University, in order to
produce near-net shape components based on cellular metal materials.
The principles of this process are depicted in Fig. 2-5. A pattern of desired shape with
desired dimensions is produced and embedded into a mould. Afterwards the metal is poured
to fill the interstices in the mould. After cooling, the pattern is removed and a semi-product is
obtained [HIN99].

Literature Survey
11
pattern production pattern assembling embedding
Fig. 2-5 A schematic drawing of the investment casting process for the production of
porous materials [HIN99].
2.2.2 Coating
2.2.2.1 Chemical – electrochemical Plating
In this process, three stages are involved, rigidization, electroless plating and electroplating
[COH68]. Rigidization is used to coat the polyurethane foam with a thin epoxy layer to
provide the necessary rigidity. After rigidization, the urethane foam surface is made slightly
conductive by electroless deposition of a thin film. As preparation for this the surface must be
treated with a strong oxidising acidic solution (such as a chromic/sulphuric/phosphoric acid
mixture) which converts the surface to the water-respective condition and selectively etches
it to produce micro-roughening.
This provides a mechanical key to improve the adhesion of the subsequently-deposited
metal layers. The surface is then catalysed with palladium from a palladium chloride solution.
After that a continuous deposit can be obtained by immersion in an electroless platting
solution [CAR77, GAB72].
2.2.2.2 Physical Vapour Deposition (PVD)
According to this method, a metal body containing atoms of entrapped inert gas evenly
distributed throughout is prepared by sputtering the metal under a partial pressure of inert
gas, onto a substrate. Then the metal body obtained is heated to a temperature above the
melting point of the metal for a period of a time sufficient to permit the entrapped gas to
expand and form individual cells. After cooling metal foam having a closed cellular structure
is obtained [SOS48, SHA94].

Literature Survey
12
2.2.3 Powder Metallurgy
2.2.3.1 SRFS-Process
The Slip Reaction Foam Sintering (SRFS) process is one of the recently developed methods
based on the powder metallurgical route for the production of the metallic foams [SCH97].
This process, which has been developed at the Department of Ferrous Metallurgy, Aachen
University, enables the production of metallic foams at room temperature with
a little instrumental outlay in addition to its low environmental impact.
In this process, as shown in Fig. 2-6, a fine metallic powder is mixed with a dispersant, which
is laminate silicate in the form of a powder having a chemical formula [Mg3(OH)4(Si2O5)]. This
dispersant stabilises the slip during the process. Concentrated ortho-phosphoric acid
(H3PO4) which acts as a foaming agent is then mixed with the mixture. Water in different
amounts is then poured. After mixing, the powder forms a slip. The foams are initiated as the
reaction metal-acid is setting H2 bubbles. Additionally, iron phosphate forms, which acts as a
strong binder [CHV75, BAR68]. This binder freezes the bubbles in the slip (since it raises the
viscosity of the slurry, thereby preventing the bubbles from escaping). After drying, the green
samples are cut in order to remove the foams’ skins. The green samples are then sintered
under a reduction atmosphere, using a tube-type furnace. The resulting high strength values
may be attributed to the formation of metallic bonds formed during the sintering process
[MOH01].

Literature Survey
13
Metallic foamGreen sample
Drying atRT
Solvent Bindingagent H3PO4
MetalPowder
Dispersant
Sintering
Fig. 2-6 SRFS-Process [ANG03].
The reactions which take place during the SRFS- process can be classified into [MOH03]:
1- Foaming of a slip
24243 )(2 HPOHFePOHFe +→+ (2.1)
2- Freezing of pores (Oxide-free powder):
OHFePOOFePOHFe 24242 4422)(2 +→++ (2.2)
OHOPFeOPOHFe 27222242 221)( +→+
(2.3)
3- Freezing of pores (containing oxide powder):
OHPOHFePOHFeO 224243 )(2 +→+ (2.4)
OHPOHFePOHOFe 2424332 3)(26 +→+ (2.5)

Literature Survey
14
OHPOHFePOHFePOHOFe 22423424343 4)()(28 ++→+ (2.6)
4- Condensation of Fe-phosphate
OHPOPPHOOHP 2+−−→−+− (2.7)
Some general rules must be taken into consideration during the sintering process and can be
stated as follows:
a) A higher reduction temperature and a longer time provide: larger particle size, lower
specific surface, and lower residual oxygen content.
b) A lower reduction temperature and a shorter time provide: smaller particle size, higher
specific surface, and higher residual oxygen content.
c) A high flow rate with low dew-point results in a high reduction rate, low residual oxygen
content and no, or very little, re-oxidation during the cooling period. A low flow rate with a
high dew-point would produce the opposite results and would therefore be generally
impracticable [THÜ93].
2.2.3.2 Loose Powder Sintering
In this process, contacts between powder particles are established and grow due to the
surface tension forces. This occurs whilst the powder particles are heated in contact to each
other [LEN80, FED79]. Porous metallic materials, e.g. bronze filters, porous nickel
membranes used as electrodes for alkaline storage batteries and fuel cell can be
manufactured by using this process. The porosities of the materials produced by this
technique vary from 40 to 60 vol. %. In order to achieve high degrees of porosity, a spacing
agent can be added to the charge. This spacing agent decomposes or evaporates during the
sintering process or is removed by sublimation or dissolution [FED79].
2.2.3.3 Fibre Metallurgy
Instead of metal powders, metal fibres can be utilised in producing porous materials
[FED79]. This process has the following advantages:
(i) Porosity can be controlled within very wide limits
(ii) High strength and ductility can be obtained
(iii) High permeability.

Literature Survey
15
Fibre metallurgy involves the preparation of metal fibres of ferrous or non-ferrous alloys by
machining, drawing and/or other techniques. These are then processed into felts by slip
casting or mechanical felting followed by sintering to develop the required strength and
porosity [YAR66].

Literature Survey
16
3 Deformation of Metallic Foams
Since most applications of metallic foams are concentrated in the field of energy absorption
(impacts, packaging and crash protection) [FOR89], this may explain why the deformation
behaviour of metallic foams under compressive testing is a recurrent theme studied by many
researchers. In the next chapter, the compressive behaviour of metallic foams will be
discussed further in some detail.
3.1 Compressive Deformation of Metallic Foams
Quasi-static, uniaxial compression tests are being used for characterisation of metall foams.
This enables us to describe the mechanical stability of metall foams. When metallic foams
are subjected to a uniaxial or hydrostatic compression test, a typical stress-strain curve, as
shown in Fig. 3-1, is obtained.
T = 410°C
0.0
0.2
0.4
0.6
0.8
1.0
1.2
1.4
1.6
1.8
0 10 20 30 40 50 60 70Compressive strain, %
Com
pres
sive
stre
ss, M
Pa
ρ=0.36 g/ccρ=0.29 g/ccρ=0.25 g/ccρ=0.23 g/cc
Fig. 3-1 Stress-strain curves for Al foams having four different densities compressed at
410°C [ALY03].
As Fig. 3-1 shows, the stress-strain curve consists of three regions, linear elastic regime
which ends with a maximum compression strength value, followed by a long plateau stress in
which the deformation occurs at almost constant stress [GIB97]. The collapse of cell-walls
and struts of cellular structure accounts for this long plateau. The deformed cells build-up
deformation bands in a direction perpendicular to the direction of deformation [GRO03]. The

Literature Survey
17
compression strength in case of brittle materials is defined as the first maximum value of
stress in the compressive stress-strain curve, whereas in case of ductile materials, the
compression strength of the material lies at that point, at which the slope of the stress-strain
curve for the first time equals zero. However, there are other ductile materials showing
a direct transfer to plateau regime without showing any maximum. In this case the point of
intersection of the tangent drawn to the linear elastic regime and that drawn to plateau is
defined as the compressive strength of the material [GRO03]. The stress-strain curve ends
with a region where the stress increases rapidly. This region is known as the densification
regime [GIB97]
Fig. 3-2 shows the deformation processes of metallic foams during compression. At the
beginning of the compression test, zones of large pores begin to deform. With increasing the
compression, new pores which lie in the already deformed zones, begin to deform [HAG99].At the end of the compressive deformation, deformation bands with a thickness equal to a
pore diameter are formed within the fractured zones [BAR98]
1 2 3
4 5 6
Fig 3-2 Deformation behaviour of metallic foams under compressive test (1) initial state,
(2-6) with increasing compression [HUS97, HAG99].
Gibson and Ashby have studied each region of the three regions of the stress-strain curve in
detail. Each region has a certain feature, e.g. in the linear elastic regime, the bending of the
cell walls is the characteristic mechanism for the deformation of metallic foams, whereas the

Literature Survey
18
plateau regime is associated by collapse of the cell walls. In elastomeric foams, e.g. rubber
the collapse of foams occurs due to the elastic buckling. In case of metals, the collapse is
caused due to the formation of plastic hinges. Ceramics which are known as brittle materials,
collapse by brittle crushing. Following the approach of Gibson and Ashby, the three regions
of the obtained stress-strain curves will be discussed here in more detail.
3.1.1 Linear Elastic Regime
As mentioned before there are two different types of metallic foams, as shown in Fig. 3-3.
They are (a) closed-cell (connected), in which the faces of the cells are solid and each cell is
sealed off from its neighbours, and (b) open-cell (interconnected) metallic foams, in which the
cells are connected through open faces.
Closed-cell face
(a)
Open-cell face
Cell edge
(b)
Fig. 3-3 A schematic drawing of a) closed-cell foam and b) open-cell foam [GIB97].
The mechanisms of linear elasticity depends on the porosity of the cell i.e. whether the cell is
open or closed. In open-cell foams cell-edge bending is the dominant deformation
mechanism, as shown in Fig. 3-4. When closed-cell metal foams are subjected to
compressive loads greater than the collapse strength, deformation initiates via plastic
bending of cell walls and stretching of the cell faces [MAR99].

Literature Survey
19
FF
FF
Cell edgebending
Fig.3-4 Deformation mechanisms in an open cell foam [GIB97].
Since the cell faces of conventional low relative density metallic foams are often curved or
corrugated, this gives rise to poor mechanical properties. Curved cell walls result from the
pressure differences between cells in the liquid metal foam before solidification. Smaller cells
have a higher internal gas pressure than larger cells. The liquid cell face separating two
adjacent cells has a curvature which is proportional to the difference in the internal gas
pressure of the cells. Air convection within the cells can also cause cell faces to be curved in
the direction of gas rise. Corrugations of the cell wall are the result of handling the liquid
foam during solidification. Lower density foams with large cells are more susceptible to cell
face wrinkling due to the low thickness-to-edge length ratio of their cell faces [SIM98].Fig. 3-5 summarises the different types of cell imperfections.
Literature Survey
20
Fig. 3-5 Different types of cell imperfections a) corrugations b) non-uniform wall thickness
c) fractured cell walls d) cell-wall misalignment e) Voroni structure and f) missing
cells [CHE99].
It was found that face curvature and corrugations can significantly reduce the elastic modulus
(which is a measure of the stiffness) and peak stress of metal foams [DAN00]. The effect of
such imperfections on mechanical properties of cellular solids was modelled by Grenestedt
[GRE98]. It was found that these imperfections have a negative effect on the mechanical
performance of cellular solids.
For low density foams (ρ< 0.03), strut bending and twisting are the dominant deformation
mechanisms [ZHU00]. At low densities, experimental studies indicated that the Young’s
modulus )(E of cellular solids is related to their density )(ρ through the following relation
[GIB97]

Literature Survey
21
n
ss
CEE
=
ρρ
(3.1)
Where E is the Young’s modulus in GPa, ρ is the density of the foam in g/cm3, sE and
sρ are the Young’s modulus in GPa and density of the solid material in g/cm3, respectively.
If the cell walls are much thinner than the cell edges, the deformation is governed by edge-
bending. In this case, E varies quadratically with density (n= 2). If cell-wall bending is the
mechanism of deformation, Gibson and Ashby have shown that E should vary cubicly (n= 3)
with density. However, the fact that 1< n <2 indicates that cell-wall stretching (n= 1) is
actually the dominant behaviour [ROB01].
Since the mechanical properties of the cellular solids depend on the geometric structure of
the foams (size and shape of the cells) as well as on the properties of the solid material, from
which the cell walls are made, it is important to determine the size of unit cell. A mesh
sensitivity study performed by Zhu et al. [ZHU02] based on changing the number of cells
was carried out to determine the number of cells. It was found that the larger the number, the
greater the possibility of instability during compression.
Smith [SMI98] has examined the compressive deformation mechanisms that occur in both
closed cell (Alporas) and open cell (Duocel) Al foams using X-ray tomography (CT) and
surface strain mapping to determine the deformation modes and the cell morphologies that
control the onset of yielding. It was found that, for Duocel, the deformations were relatively
homogeneous whereas Alporas deforms heterogeneously by deformation banding, as shown
in Fig. 3-6.

Literature Survey
22
Fig. 3-6 Surface maps of incremental principle strains. Stress-strain curves are also
indicated for a) Duocel and b) Alporas materials [SMI98].
In an attempt for characterisation of the 3-D structure and compressive deformation of
Alporas foams using X-ray microtomography, McDonald et al. [MCD03] have observed two
extreme modes of deformation in the Alporas foams: uniform crushing along a band running
perpendicular to the direction of compression and a large distortion or anisotropic buckling of
the sample structure. By anisotropic buckling it is meant that the specimen has had a sharp
change or kink along its edges.
If the cells of the foams are quite spherical, uniaxial compression actually leads to uniaxial
compaction with no lateral spreading-up to large strains. This remains true even for materials
with elongated cells as long as the cells are aligned or perpendicular to the compression
axis; otherwise the sample will shear and spread in various directions perpendicular to the
compression axis. Samples with skin on one of their faces display a different behaviour when
the skin is not perpendicular to the compression axis. The presence of a vertical skin
Literature Survey
23
(parallel to the compression axis) reduces the effect of the defects found through the sample
and stabilises the structure. In case of heterogeneous cells, the stress needed increases with
deformation. In practice such heterogeneities are due to local variations in cell wall
thickness, the geometry of the cells, the size of the connecting nodes, and the metallurgical
characteristics of the material in the walls or structural features such as the cell size
distribution [CHA99]. These non-uniformities may be due to the method of fabrication
[FOR99].
3.1.2 Plateau (Collapse) Regime
In compression the stress-strain curve exhibits an extensive plateau stress, wherein localised
collapse propagates from one cell band to another [PAU00]. This plateau stress is known as
the elastic collapse stress σel*. The foam’s density determines the plateau stress which is
achieved if one of the deformation bands fails [MOS03]. The energy absorption efficiency is
a function of the duration of this plateau during compression [PAR00]. The long plateau
stress-strain curve arises due to bending of cell walls and stretching of cell faces [PAU00]followed by cell collapse due to buckling and yielding [MOT01]. These mechanisms allow for
large energy absorption at constant or slightly increasing stress. Plateau stress is of great
importance in selecting foams for packaging and cushioning applications [COC00].
Gibson and Ashby have mentioned that the plateau stress (collapse stress) and post-
collapse behaviour depend on whether the foam has open or closed cells. A decrease in
energy absorbing efficiency of foams was found with the increase of the porosity [BIN01]whereas an enhancement in the energy absorbing efficiency of foams was obtained as
a result for an increase in the aspect ratio of cell-wall thickness against the cell-edge length
of the foam [MIY99a]. In open-cell foams like polyurethanes, collapse occurs at almost
constant load. In closed-cell foams like polyethylenes, collapse occurs at slightly increasing
stress with strain. This is due to the compression of the gas within the cells. Many
experiments have proved that most foams behave as if their cells were open because the
surface tension concentrates the material into the cell edges during manufacture [ASH83,
GIB82].
Gibson et al. have been built a series of equations based on a cubic model of an open-cell
cellular material and Euler’s equation to describe each region of the stress-strain curve.
Some of them are listed below
Literature Survey
24
Linear elastic regime2
=
ssEE
ρρ (3.2)
Plateau regime for plastic foam23
1
*
=
sy
pl Cρρ
σσ (3.3)
Plateau regime for brittle foam23
2
*
=
sf
f Cρρ
σσ (3.4)
Where E is the Young’s modulus of the foam in GPa, sE is the Young’s modulus of cell wall
material in GPa, pl*σ is the plastic collapse stress of the plastic foam in MPa, yσ is the
yielding strength of cell wall material in MPa, f*σ is the fracture strength of cell wall material
in MPa, σ is the compressive stress in MPa, fσ is the modulus of rupture of cell wall
material in MPa, sρρ , are the densities of foam and cell wall material in g/cm3, respectively;
and 21 ,CC are constants [GIB97]
In order to measure the energy absorption of metallic foams, two methods are considered.
One is the energy per unit volume, which is determined by the area under the stress-strain
curve
∫=l
dC0
εσ (3.5)
Where σ is the compressive stress, l the limit of strain concerned, and ε is the strain.
The second method is the measurement of the energy absorption efficiency, which is defined
by
l
dE
l
⋅=
∫max
0
σ
εσ(3.6)
Where the numerator is the real energy absorbed after deformation over the strain l , and the
dominator is the ideal energy absorption given by the product of the maximum stress applied
( maxσ ) and the strain l [HAN98], as shown in Fig. 3-7.

Literature Survey
25
σp
ε
σ
dense solid
energy in foam
foam
Fig. 3-7 A comparison between a real and an ideal energy absorber after 50%
compression test [CHI98].
The efficiency of energy absorbing materials in crash elements is strongly influenced by their
stress-strain behaviour under uniaxial compression. Experimental studies of the influence of
meso-inhomogeneities of the cell structure on the crash worthiness of aluminium foams have
shown that the cell sizes, the cell wall thickness and other micro-geometrical parameters
should not vary too much in order to achieve optimum specific energy absorption. Strong
meso-inhomogeneities lead to strain localisations and, consequently, to a decrease of the
initial plateau stress and to increasing ascents in the plateau regime, both reducing the
energy absorption efficiency. Specimens with comparable mean apparent density have the
highest initial plateau stress when they do not show significantly varying microstructures, i.e.
they are microscopically homogeneous. Metal foams which are used in energy absorbing
elements exhibit a weak energy absorbing efficiency if the foam structure shows strong
meso-inhomogeneities [GRA99]. For example Alporas foams have an almost constant
collapse plateau stress which makes it superior for energy absorption applications. This is
due to the homogeneity of their structure [SIM98a].
Mukai et al. [MUK99] have found that there is a strain rate dependence of energy absorption.
For example the absorbed energy by Alporas foams under dynamic strain rate of (2.5 x 10³ s-
1) is 50% greater than that at the quasi-static strain rate (1 x 10⁻³ s-1).
The energy absorbed by the metallic foams depends on the density of the foams as well.
Increasing the foam’s density will increase the amount of the energy absorbed by the foam

Literature Survey
26
[HAL00], as shown in Fig. 3-8 and Fig. 3-9. In case of the foam with the lowest density ρ3
a long plateau was achieved and a large amount of absorbed energy (W3) was obtained.
Increasing the foam’s density will compensate the obtained short plateau and the same
amount of energy can be absorbed, as in case of the foam with the density ρ1.
σ
ε1
W2W1
ε
ρ1ρ2
ρ3
0 ε2 ε3
W3
ρ1> ρ2 > ρ3
Fig. 3-8 Stress-strain curves for metallic foams having three different densities and the
same amount of the absorbed energy [HAG99].
0 0.2 0.4 0.6 0.8 1.0024
68
1012141618
Density, g/cm3
Ener
gy p
er v
olum
e, N
/mm
2
ε= 20%
ε= 40%
ε= 60%
Fig. 3-9 Energy absorption of Al foam as a function of the foam’s density at three different
compression strains [BAU97].

Literature Survey
27
3.1.3 Densification Regime
Depending on the nature of the solid making the foams and on their relative density, foams
can fail by several mechanisms (elastic buckling, plastic yielding, brittle crushing or brittle
fracture) [GIO00].
In case of metallic foams, which have a plastic yield point, the failure is localised in a band
transverse to the loading direction which propagates throughout the foam with increasing
strain.
Brittle crushing of the foams occur at large compressive strains where the opposing walls of
the cells crush together and the cell wall material is compressed.
Brittle fracture of metallic foams is caused by the propagation of small cracks either along the
boundaries of the grains or across the cleavage planes of the individual crystals. The cracks
sometimes pre-exist in metal (a result of growth defects when the metal was cast or formed)
or they are nucleated by slip when the metal starts to deform [GIB97] These cracks initiate at
defects either in the cells or at the surface and extend as plane stress cracks in the thin cell
walls. This process occurs beyond general yielding (strain = 2%) and is accompanied by wall
thinning. Fig. 3-10 shows a schematic of the crack growth which occurs in a tension test.
Fig.3-10 A schematic of the crack growth process a) thin sheet tearing and b) growth
through the cell walls [SUG97].
The crack growth proceeds within a fracture zone, along the thinned region, via the
nucleation, plastic growth and coalescence of voids. The crack meanders across adjoining
walls and progresses through the material [SUG97].
Markaki et al. [MAR01] have examined the fracture surfaces of three different closed cell
foams. It was found that the fracture surfaces for all three materials indicate the presence of

Literature Survey
28
large cells, which probably acted as stress concentrators and favourable sites for failure
initiation. In one of them a band of cell had become completely crushed. Failure in the other
two foams occurred by plastic buckling of the cell walls.
Hanssen et al. [HAN01] have found that local and/or global failure mechanism is a reason for
fracture of foams. Rupture, as in case of hollow extrusions filled with aluminium foam, is a
likely mechanism.
By the examination of the failure mechanisms of aluminium foams under compressive loads,
Sáenz et al. [SÁE99] have found that in the initial stages of failure mechanisms, crushing-
shearing cell failure is associated with the interaction between non-uniform material, cell size
distribution and the material’s defects (cavities).

Literature Survey
29
3.2 Creep Deformation of Metallic Foams
The mechanical strength of metals decreases with increasing temperature and the properties
become much more time-dependent. Metals subjected to a constant load at elevated
temperature will undergo creep, which is known as a time dependent change in length or in
other words a time dependent plastic deformation at constant stress (or load) and
temperature. The form of a typical creep curve of strain versus time is shown in
Fig. 3-11.
Stra
in, ε
Time, t
Initial (instantaneous) plastic deformation
Primary creep
Secondary (steady state)
Tertiary creep
Fracture
Fig. 3-11 Stages in a typical creep curve.
The slope of this curve is the creep ratedtdε
. The curve may show the instantaneous elastic
and plastic strain that occurs upon loading, followed by the plastic strain which occurs over
time. Three stages of the creep curve may be identified as follows:
a) Primary creep: in which the creep resistance increases with strain leading to a
decreasing creep strain rate.
b) Secondary (steady state) creep: in which there is a balance between work hardening and
recovery processes, leading to a minimum constant creep rate.
c) Tertiary creep: in which there is an accelerating creep rate due to the accumulating
damage, which leads to creep rupture, and which may only be seen at high temperatures
and stresses and in constant load machines.
The minimum secondary creep rate is interesting to design engineers, since failure
avoidance is required [NN].

Literature Survey
30
Solids react upon loading at high temperatures with an instantaneous strain oε and a time-
dependent strain tε . When they are completely unloaded after creep, an instantaneous
contraction oε ′ is followed by a time-dependent anelastic strain recovery tε ′ . The residual
strain pε is called plastic creep strain, as shown in Fig. 3-12.
Time
Stre
ssSt
rain
εt
ε0
ε´0
ε´t
εp
Fig. 3-12 Stages of creep strain and its partial relaxation after unloading [BRE81].
There is general agreement that creep is a thermally activated process. Thermal agitation is
added locally to mechanical energy and this concurrence provides time-dependent
deformation. High temperature creep (T> 0.5Tm) is believed to be a diffusion-controlled
process [BRE81].
Several empirical models have been proposed to describe creep curves. Since the
secondary creep which is of great importance for the engineering design is strongly
dependent on temperature, the secondary creep rate can be determined using the following
equation
−
−=RT
QAdtd νσε oexp (3-7)
Where ν,A are constants, σ is the applied stress in MPa, oQ is the activation energy for
creep in J/mole, R is the gas constant in J/K. mole, and T is the absolute temperature in K.
An alternative expression is given by the equation (3-8) as follows:

Literature Survey
31
−=
RTQA
dtd n oexpσε
(3-8)
Where n is creep exponent and have the values from 3-8 except at low stress where it is
approximately 1. Hence the term “Power low creep” [NN].
In the case of metallic foams, there is a number of existing and prospective applications in
which elevated temperatures are involved, e.g. open-cell foams are used as a key
component in heat exchangers or as catalyst carriers in chemical reactors. Closed-cell foams
are used as core materials in light-weight sandwich components, for example in automotive
and aerospace constructions, where high-temperatures exist frequently next to combustion
or propellant engines. While the room-temperature plasticity of cellular metallic materials has
widely been studied in recent years, relatively little research has been devoted to the high-
temperature properties of this interesting class of materials.
When the foams are loaded at low temperatures (T< 0.3Tm), the foams deform by elastic
buckling, elastic deflection and plastic collapse of their cell walls. At elevated temperatures,
creep contributes to the deformation, which becomes time-dependant [AND99a].
The creep behaviour of closed and open cell foams can be modelled by analysing the
bending of cell edges and the stretching of the cell faces [KES03]. Andrews et al. [AND99a]have studied the creep behaviour of closed-cell aluminium foam in both tension and
compression in a temperature range of 260°C-350°C and under a constant stress of
0.42 MPa. It was found that the power low creep exponent n is 5.4 in compression and 3.9
in tension for low stress values (less than 0.42 MPa) and 15.0 in compression and 14.4 in
tension at higher stresses. The value of n at low stresses is close to that for aluminium
( n = 4.4). The activation energy is 62.4 kJ/mole in compression and 133.1 kJ/mol. in tension
at low temperatures (less than 300°C). At higher temperatures, the activation energy
increases to 555.4 kJ/ mole. in compression and 404.0 kJ/mole in tension.
Another set of experiments has been carried out by Andrews et al. [AND99b] on open-cell
foams (Doucel, ERG, Oakland, CA foams) at stresses ranging from 0.25 MPa to 0.68 MPa
and temperatures ranging from 275°C to 350°C. The solid making up the foam is 6101-T6
aluminium alloy (0.6 Mg-0.5 Si) and it has also undergone creep tests. The creep tests were
carried out at stresses ranging from 22.1 MPa to 44.0 MPa and temperatures ranging from
275°C to 325°C. The main application of this material is in heat exchangers because of its
uniformity in cell size, shape and orientation. The results attained indicate that the foam
should have the same activation energy Q and power low exponent n of the solid material.

Literature Survey
32
Goretta et al. [GOR90] have carried out compressive creep tests on open-cell Al2O3 for
temperatures of 1200°C-1500°C. The creep experiments were conducted at either constant
load or constant cross-head speed. It was found that the data follows a general trend of
linear dependence between strain rate and stress, which is characteristic for the diffusional
flow with a creep exponent 1=n ± 0.1. This result was also obtained elsewhere [BRO80,
FRO82].
According to Andrews et al. [AND99a] it is assumed that the creep rate of the cell-wall
material can be described by the following equations:
n
ss
=
⋅
0
0
.
σσεε
(3-9)
−=
⋅
RTQAexp0ε
(3-10)
Where ⋅
ssε is the steady state creep rate in s-1, A is a constant, σ is the uniaxial applied
stress in MPa, 0σ and n are constants, R is the gas constant and T is the absolute
temperature in K. According to the last equation it appears that, the creep rate depends on
the foam’s density, as shown in Fig. 3-13. This shows a good agreement with the results
obtained by Andrews et al.
T = 275°C
Stress, MPa
Stra
in ra
te, s
ec-1
0.1 1.0 10.010-9
10-8
10-7
10-6
10-5
0.060.09
0.14
Fig.3-13 Secondary strain rate plotted against stress for different relative densities at
a constant temperature [AND99b].
The increase in the strain rate is believed due to the collapse of a layer of cells, whereas the
increase in stresses is due to the inhomogeneous microstructure which causes some cell
walls to enter the power low breakdown regime with very rapid creep rates.

Literature Survey
33
4 High Temperature Oxidation
4.1 Fundamentals of Oxidation
During exposure to elevated temperatures in air, nearly all metals react to form oxides and in
some cases nitrides. The conversion of a structural component from metal to oxide can lead
initially to a loss of load bearing capacity and ultimately failure [BRA00]. When a metal is
oxidised at high temperatures in air, a protective oxide (scale) generally forms by a chemical
reaction between the metal and the oxygen of the air according to the following equation:
yxOMy
OMyx 22
2 ↔+ (4-1)
Where M represents the metal component which reacts with oxygen and yx, are
stochiometric factors. When the free energy of formation °∆G , which is defined as follows:
tsreacproducts GGG tan−=∆ ° (4-2)
is negative, this reaction ends up with the metal oxide yxOM . When °∆G = 0, a chemical
equilibrium will occur [KUE92].
A graphical representation known as Richardson-Ellingham diagram, shown in Fig. 4-1, is of
technical importance because it supplies information about several oxidation reactions
[SCH00].

Literature Survey
34
Fig.4-1 Richardson-Ellingham diagram [HOG97].
In this figure the °∆G values are represented as a function of the temperature. Generally,°∆G can be defined according to the following equation [KUE92]:
KRTG ln−=∆ ° (4-3)
Where K is the equilibrium constant of the reaction, which is given by
)/exp(/2
/2
RTGa
aK yx
M
yOM yx ∆−== (4-4)

Literature Survey
35
Where a is the activity of the different parts in the reaction, R is the general gas constant
and T is the absolute temperature.
The activity for the gas phases can be approximated by the partial pressure so that for the
oxygen activity the oxygen partial pressure 2Op can be inserted according to the following
equation:
)/exp(/2
/2
2RTG
a
aP yx
M
yOM
Oyx ∆== (4-5)
Where 2OP represents the equilibrium oxygen partial pressure at which both phases metal
and oxide are stable. Below this value no oxide is formed and the metal is still stable. Above
this value the oxide is stable and can form a protective scale. The most stable oxides are
those where the equilibrium partial pressures take the lowest values, e.g. Al2O3, Cr2O3 and
SiO2. Less stable oxides are the oxides of iron and nickel [SCH00].
In order to determine the upper-use temperatures for these oxides, Perkins et al. [PER89]estimated a generalised upper-use temperature. For example, the maximum-use
temperature for Cr2O3 is 1100°C, whereas for Al2O3 and SiO2, the maximum-use
temperatures are 1425°C and 1750°C, respectively.
4.2 Formation and Growth of Oxide Scales
The formation of an oxide scale starts with the adsorption of oxygen gas on the metal
surface. During adsorption, oxygen molecules or molecules of other gaseous species in the
environment dissociate and are adsorbed as atoms. These atoms initially adsorb at sites
where the atom is in contact with the maximum number of surface atoms in the metal
substrate. Therefore, in polycrystalline materials, grains of preferential orientation exist where
the number of adsorbed atoms from the gaseous atmosphere is highest [OUD83]. This
process results in a two-dimensional adsorption layer. The presence of adsorbed layers may
increase the rates of the surface diffusion by orders of magnitude compared with those for
surfaces with none or small amounts of adsorbate [BEN71].
When the metal surface which is saturated with adsorbed oxygen atoms or atoms from other
gaseous species is further exposed to the gas, the gaseous species may dissolve in the
metal and nuclei grow laterally and form a continuous film on the surface, as shown in
Fig. 4-2.

Literature Survey
36
Vapor phase
Adsorption-Desorption
Capture CaptureSurfacediffusion
Metal surfaceNucleusNucleus
Fig. 4-2 Schematic representation of the process occurring during the nucleation of
corrosion products on metal surfaces [KOF88].
Nucleation and growth of the nuclei are dependent on the composition of the substrate, the
grain orientation, the temperature and the gas partial pressure. The nuclei grow in thickness
and lateral direction and the reaction rate increases with time as shown in Fig. 4-3 .
Time, t
Oxi
de th
ickn
ess,
x
Parabolic oxidationX2= 2Kp.t
Fig. 4-3 Schematic diagram reflects the effect of time on the oxide thickness [SCH00].
The growth of oxide scales never stops as long as the material is exposed to an oxidising
environment. The reason for this is the situation of the oxide scale that is determined by the
ambient oxygen partial pressure at the outside surface and the equilibrium partial pressure
between metal and oxide at the metal/oxide interface is considered. These two partial
pressures represent fixed values as the equilibrium between oxide and metal is always
maintained at the interface; thus the oxygen partial pressure always remains the same at this
site, and at the outside of the oxide scale the oxygen partial pressure remains constant. The
result of this situation is that there is a very strong oxygen partial pressure gradient across
the scale . This gradient in oxygen partial pressure results in a defect concentration gradient
across the scale. As temperatures are sufficiently high, diffusion can take place via the lattice
defects. Diffusion process can be described by Fick’s first law as follows:
xcDj
∂∂
−= (4-6)

Literature Survey
37
Where j is the flux or mass diffusion per second through a unit cross section in the
concentration gradient xc
∂∂
and D is the diffusion coefficient or diffusivity in (m2/s) which is
mainly a function of the diffusing ions, the structure in which these ions diffuse, and the
temperature. If the gradient of the defect concentration is considered in the form xc /∆ ,
where x is the thickness of the oxide, then the diffusion equation can be expressed as
follows:
xcD
dtdx ∆−
= (4-7)
As c∆ is a constant because it is determined by the two fixed points of the oxygen partial
pressures at the two boundaries of the oxide scale (i.e. metal/oxide equilibrium pressures
and oxygen partial pressure of the environment, respectively) and D is a constant as well,
both can be taken together and replaced by a constant 'pk . The result is the general
equation for parabolic oxidation:
xk
dtdx p
'
= (4-8)
This equation in the differential form can be integrated yielding the well-known parabolic type
of equation [SCH00]:
tkx p'2 2= (4-9)
The formation of an oxide layer on the metal surface at high temperature acts as a protection
for the basis metal when the following requirements are fulfilled:
1- Slow growing up of the oxide layer
2- Good adhesion with the basis material
3- High thermodynamic stability
4- Good thermal and mechanical tolerance with the basis material
5- Good resistance towards the impurities in the atmosphere
Slow growing of an oxide layer means low values of the oxidation constant 'pk and thus
a small diffusion constant value.

Literature Survey
38
The oxide layers which are suitable for the high temperature applications are those of Al, Si
and Cr [SCH00].
4.3 High temperature Oxidation of Iron
At temperatures ranging from below room temperature to temperatures of up to 1000°C, iron
reacts chemically with the oxygen of the air to form a surface film of oxide. The films formed
at room temperature are only a few Angstrom (Å) thick and hence invisible, but at higher
temperatures, thick scales are produced [COR96].
During the oxidation of iron, the following reaction takes place:
12 2 −+ +→ eFeFe (4-10)
132 1 −++ +→ eFeFe (4-11)
At high temperatures, the reaction rate increases. The oxidation product, which results from
the chemical reaction between iron and oxygen, is known as scale. The oxidation products
can be determined by means of Fe-O phase diagram, as shown in Fig. 4-4.
Atomic percent oxygen, atom.%
Weight percent oxygen, %00.20.4 22 24 26 28 30 32
50 52 54 56 58 60 Liq. Fe
AB C
GI
JN H
VR
Y Z
Z’
L
Q
FeOFeO+Fe O3 4
Fe O3 4
Fe O +
2 3
O2
Fe O+
Fe O
3 4
2 3
Fe O2FeOα-Fe+Fe O3 4
Liq. Oxide +Fe O3 4
Liq. Oxide+ O2
Fe O + O3 4 2
Liq. OxideLiq. Fe+Liq. Oxide
γ-Fe+Liq. Oxideγ-Feo+FeO
α-FeO+FeO
Tem
pera
ture
, °C
δ-Fe+Liq.Oxide
3
Fig. 4-4 Equilibrium Fe-O phase diagram [IEH03].
The Fe-O phase diagram shows that the maximum solubility of Oxygen in α-Fe at 700°C is

Literature Survey
39
about 7 ppm (1ppm = 10-4 weight-%), whereas the solubility of oxygen in γ-Fe reaches about
10 ppm. Depending on the lattice defects, the solubility of oxygen can be reached 50 ppm.
The chemical reaction between Fe and oxygen results in three products, which are
FeO Wustite ( )+2Fe
43OFe Magnetite ),( 32 ++ FeFe
32OFe Hematite )( 3+Fe
The metallic compound FeO is thermodynamically stable at temperatures above 570°C. At
room temperatures, the other compounds 32OFe and 43OFe can be presented. In case of
thermodynamic equilibrium, the three compounds will be formed together: Fe / FeO / 43OFe /
32OFe / 2O .
Tab. 4-1 summarises the different physical properties of the three oxides. The oxides differ
from each other in colour, density, volume ratio, thermal expansion and hardness. It is known
that the density of the oxide is smaller than that of the iron. Volume ratio between the oxide
and base metal can be given by Pilling-Bedworth-Ratio which is
PBR = volume of oxide/ volume of iron
The coefficient of thermal expansion of the oxide differs from that of the base metal (iron:
thermal expansion coefficient at RT is about 12*10-6 k-1 and 16*10-6 k-1 at temperature
> 500°C).
Specific heat
(Cal/cm.s.K)
Electrical
conductivi
ty (W-
Color Melting
temperature
(°C)
Density
(g/cm3)
Pilling-
Bedworth-
ratio
Thermal
expansion
coefficient
Thermal
conductivity
(Cal/K.mole)
To
25°C
To
1000°C
32` OFeα brown/red
(in divided
form), black
- 5.24 2.14 9.6-13.9*10-6 0.035 to 30°C 25 36 -
43OFe black 1600 5.18 2.10 8*10-6 - 36.3 48 178 at RT
FeO black 1371-1424 5.52-7.50
(depending
on vacancy
ccontent
1.83-1.67 11*10-6
independent of
temperature
- 11.5 14.2 90 to 200
Tab. 4-1 Physical properties of iron oxides [IEH03].

Literature Survey
40
Tab. 4-2 summarises the mechanical properties of the three oxides of iron. The hardness of
43OFe as well as 32OFe is greater with respect to FeO .
Room temperature 800°C
Hardness E-Modulus
103 Kg/mm2
Yield strength Kg/mm2
Ultimate
tensile
strength
Kg/mm2
Vickers
Kgf/mm
Mohs
E-Modulus
103 Kgf/mm2
G-Modulus
103 Kgf/mm2
Hardness
Kgf/mm2
Tension Compression Tension Compression
32OFe P 986-
1219
5 to 6 M23, P 21.4
to 30.5
M 8.6 to 9 , P.
9.4 to 9.6
- - - - - -
43OFe M 500,
P 690
6 M 21.7 to
24.7 P. 23.5
M 8.9 to 9.9, P.
9.3
- - - - - -
FeO P 388 - P. 12.6 GFeO=GFe/2 P. 30 P 0.11-
0.12
P 0.12-0.25 P 2.5-
3.4
P 9.6-10.7 P 3-3.7
Tab. 4-2 Mechanical properties of iron oxides [IEH03].
A set of experiments has been carried out by Hidaka et al. [HID01] in order to study the
deformation of FeO oxide scales at high temperatures. Tensile tests of FeO were performed
at 600-1200°C under strain rates ranging from 10-3 to 10-5 s-1. Test specimens of FeO scales
were prepared by complete oxidation of 99.999% pure Fe before the tensile test, and gas
atmospheres were adjusted through the tensile test to maintain the scale composition. It was
found that oxide scales of FeO deformed plastically above 700°C, fracture elongation
increased and tensile strength decreased as the temperature increases. It was also
suggested that the deformation of FeO scale above 1000°C resulted from dynamic recovery
associated with dislocation climb.
Experimental Work
41
5 Experimental Work
5.1 Tested Materials
Three different types of metallic foams have been utilised in the present work. One of the
tested foams being Alporas (AlCaTi) foams, delivered by the Shinko-wire Company in Japan.
The other two types of foams are based on low alloyed steel powders, Distaloy SA and
Astaloy Mo, produced by Hoganaes Company. For simplicity, During the course of this work
Distaloy SA and Astaloy Mo foams will be referred to as Distaloy and Astaloy foams,
respectively.
5.1.1 Alporas-Foams
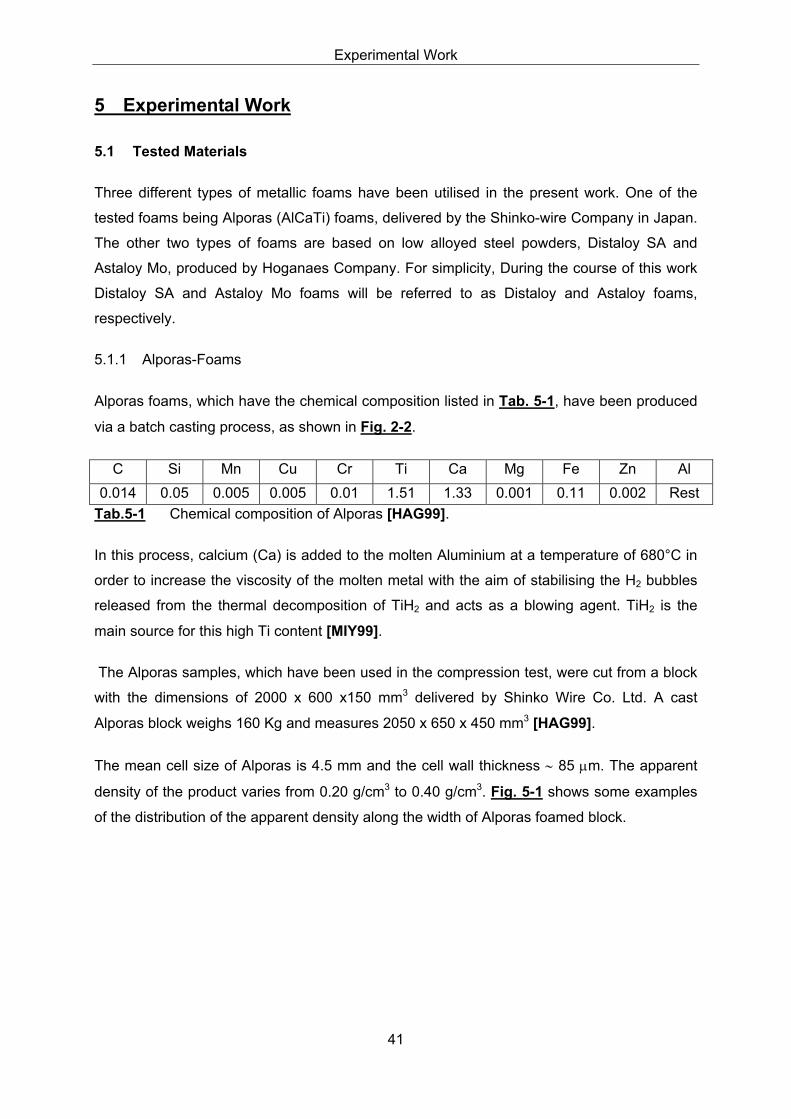
Alporas foams, which have the chemical composition listed in Tab. 5-1, have been produced
via a batch casting process, as shown in Fig. 2-2.
C Si Mn Cu Cr Ti Ca Mg Fe Zn Al0.014 0.05 0.005 0.005 0.01 1.51 1.33 0.001 0.11 0.002 Rest
Tab.5-1 Chemical composition of Alporas [HAG99].
In this process, calcium (Ca) is added to the molten Aluminium at a temperature of 680°C in
order to increase the viscosity of the molten metal with the aim of stabilising the H2 bubbles
released from the thermal decomposition of TiH2 and acts as a blowing agent. TiH2 is the
main source for this high Ti content [MIY99].
The Alporas samples, which have been used in the compression test, were cut from a block
with the dimensions of 2000 x 600 x150 mm3 delivered by Shinko Wire Co. Ltd. A cast
Alporas block weighs 160 Kg and measures 2050 x 650 x 450 mm3 [HAG99].
The mean cell size of Alporas is 4.5 mm and the cell wall thickness ∼ 85 µm. The apparent
density of the product varies from 0.20 g/cm3 to 0.40 g/cm3. Fig. 5-1 shows some examples
of the distribution of the apparent density along the width of Alporas foamed block.

Experimental Work
42
400mm Width
170Kg160Kg
150KgDen
sity
, g/c
m3
Fig. 5-1 The distribution of the apparent density along the width of foamed blocks
[MIY99].
Tab. 5-2 gives the relevant properties of Alporas foams [PAU00].
Property Value
Relative density ( sρρ /* ) 0.08-0.1
Average cell size ( L ) 4-5 mm
Edge thickness ( et ) 75-100 µm
Elastic modulus in tension ( tE ) 0.8-1.05 GPa
Elastic modulus in compression ( cE ) 0.75-1 GPa
0.2% Offset strength in tension ( 002.0tσ ) ∼ 1.35 MPa
0.2% Offset strength in compression ( 002.0cσ ) ∼ 1.28 MPa
Tensile strength ( tσ ) 1.85 -1.92 MPa
Compressive strength (first peak) ( cσ ) 2 – 2.5 MPa
Fracture toughness ( ICK ) ∼ 0.8 MPa m1/2
Tab. 5-2 Properties of Alporas foams.
5.1.2 Distaloy and Astaloy Foams
Based on low alloyed steel powders, two different types of powders with different chemical
Experimental Work
43
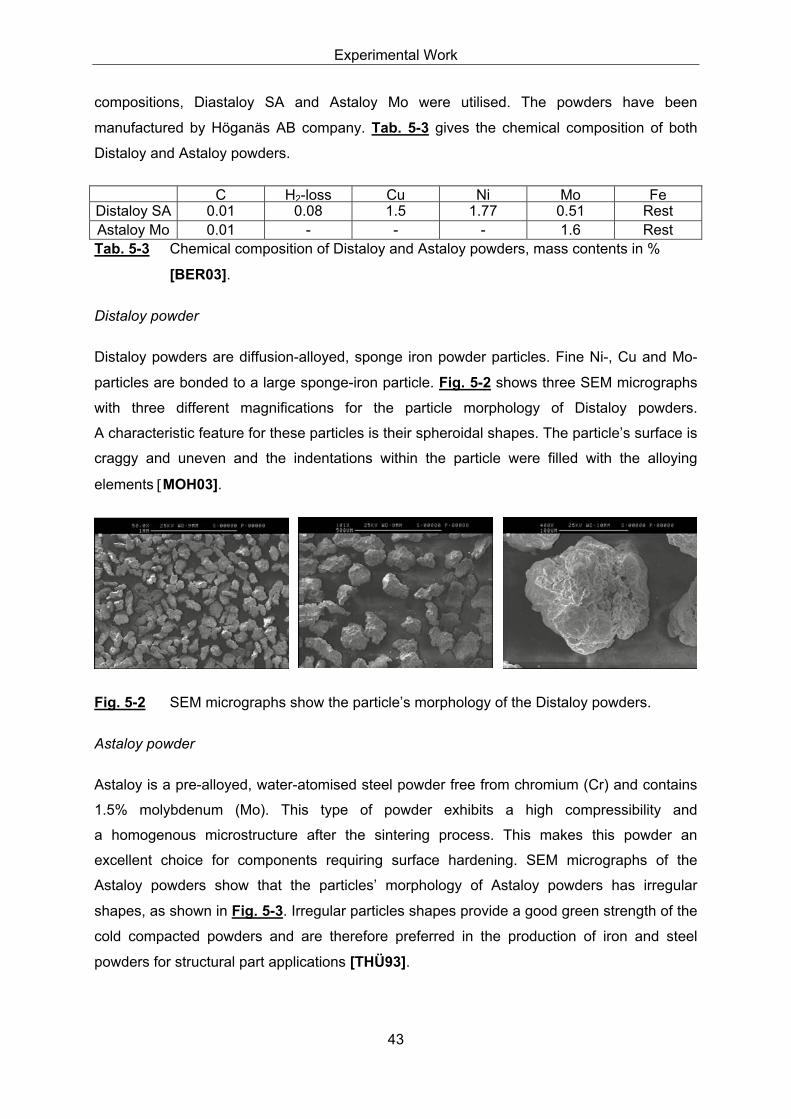
compositions, Diastaloy SA and Astaloy Mo were utilised. The powders have been
manufactured by Höganäs AB company. Tab. 5-3 gives the chemical composition of both
Distaloy and Astaloy powders.
C H2-loss Cu Ni Mo FeDistaloy SA 0.01 0.08 1.5 1.77 0.51 RestAstaloy Mo 0.01 - - - 1.6 RestTab. 5-3 Chemical composition of Distaloy and Astaloy powders, mass contents in %
[BER03].
Distaloy powder
Distaloy powders are diffusion-alloyed, sponge iron powder particles. Fine Ni-, Cu and Mo-
particles are bonded to a large sponge-iron particle. Fig. 5-2 shows three SEM micrographs
with three different magnifications for the particle morphology of Distaloy powders.
A characteristic feature for these particles is their spheroidal shapes. The particle’s surface is
craggy and uneven and the indentations within the particle were filled with the alloying
elements [MOH03].
Fig. 5-2 SEM micrographs show the particle’s morphology of the Distaloy powders.
Astaloy powder
Astaloy is a pre-alloyed, water-atomised steel powder free from chromium (Cr) and contains
1.5% molybdenum (Mo). This type of powder exhibits a high compressibility and
a homogenous microstructure after the sintering process. This makes this powder an
excellent choice for components requiring surface hardening. SEM micrographs of the
Astaloy powders show that the particles’ morphology of Astaloy powders has irregular
shapes, as shown in Fig. 5-3. Irregular particles shapes provide a good green strength of the
cold compacted powders and are therefore preferred in the production of iron and steel
powders for structural part applications [THÜ93].

Experimental Work
44
Fig. 5-3 SEM micrographs of particle’s morphology of Astaloy powders
Distaloy and Astaloy foams were produced by using the Slip Reaction Foam Sintering
(SRFS) Process. In this process a metal powder was mixed with a dispersant (SiO2). Water
and a foaming agent (H3PO4) were added to form the slip. SiO2 acts as a binding agent to
stabilise the slip. Tab. 5-4 gives the amounts of the used materials to produce both Distaloy
and Astaloy samples, respectively.
Amount and type of
metal powder
Phosphoric acid Amount of dispersant Amount of added
water
100g Distaloy 3g H3PO4 2g SiO2 17-22g H2O
100g Astaloy 3g H3PO4 2g SiO2 18-22g H2O
Tab. 5-4 Amounts of used materials in production of Distaloy and Astaloy foams at IEHK
[MOH01].
The resulted green samples are dried and then sintered. Sintering process is a heat
treatment process, by which loose fine powder particles are converted into a compact
material. This process takes place at a temperature ranging from 0.6-0.8Tm of the material.
During this process, the loose powder particles bind together forming sintering bridges
(sintering neck) by means of a diffusion process, i.e. the sintering process is a thermal
activated process. The specific area of the particles decreases due to the enlargement of the
contact areas which influences the volume of the pores and pore morphology [MOH03].
Sintering of the green samples occurs under a reduction atmosphere in the sintering furnace,
depicted in Fig. 5-4. The furnace was manufactured by Xerion Company. As shown in
Fig. 5-4, the furnace is of a tube-type and the maximum allowed sintering temperature is
1500°C. The furnace operating program consists of the following steps, as shown in Fig. 5-5;
two evacuation processes take place during the sintering process as the furnace is turned
on. At the end of evacuation, N2 flows inside the furnace and afterwards H2 starts to flow
parallel with N2 for about 1 hour. Afterwards the heating process is started. The maximum
allowed heating as well as cooling rate is 10 K/min. The sintering process must not exceed

Experimental Work
45
999 min; otherwise the furnace will be turned off automatically. The flow of H2 and the
cooling process take place farther in an N2 atmosphere and the end of the sintering process
at this moment is reached.
The green samples have been sintered at 1170°C according to the scheduled temperature-
time (T-t) diagram, shown in Fig. 5-6.
(a) (b)
Fig. 5-4 (a) Sintering furnace at IEHK, (b) some samples are stacked on a ceramic muffle
inside the furnace chamber

Experimental Work
46
Heating
Flame on
Evacuation
N2 on
H2 on
Holdback 30min Holdback 30min 50min 1min 999minend of heatinh programm
50min Holdback 30min
Pump N2 on Pump N2 on H2 on Heating on
Heating N2 on Pump N2 on End
t,min
1000 mbar
Fig. 5-5 Operating program of the sintering furnace at IEHK.
0
200
400
600
800
1000
1200
1400
0 100 200 300 400 500 600 700 800 900Time, min
Tem
pera
ture
, °C
Heating rate8k/min
90 min
Cooling rate2k/min
T-t diagram
Fig. 5-6 T-t diagram of the sintering process.
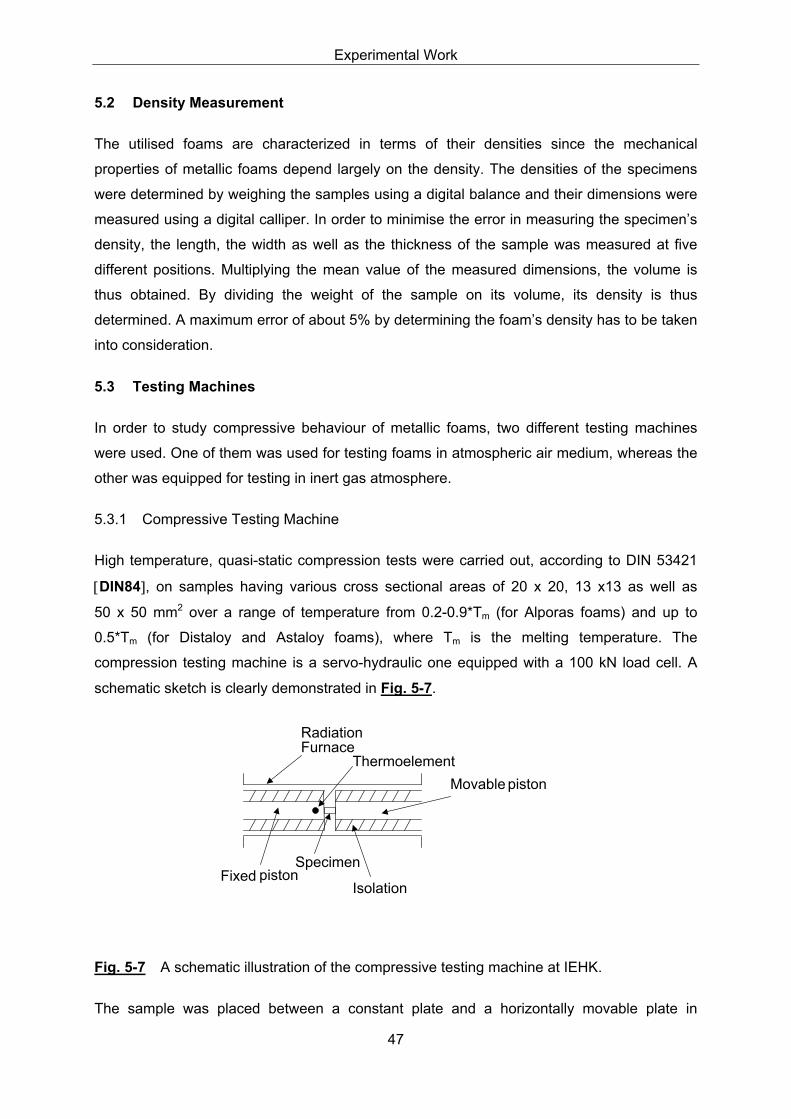
Experimental Work
47
5.2 Density Measurement
The utilised foams are characterized in terms of their densities since the mechanical
properties of metallic foams depend largely on the density. The densities of the specimens
were determined by weighing the samples using a digital balance and their dimensions were
measured using a digital calliper. In order to minimise the error in measuring the specimen’s
density, the length, the width as well as the thickness of the sample was measured at five
different positions. Multiplying the mean value of the measured dimensions, the volume is
thus obtained. By dividing the weight of the sample on its volume, its density is thus
determined. A maximum error of about 5% by determining the foam’s density has to be taken
into consideration.
5.3 Testing Machines
In order to study compressive behaviour of metallic foams, two different testing machines
were used. One of them was used for testing foams in atmospheric air medium, whereas the
other was equipped for testing in inert gas atmosphere.
5.3.1 Compressive Testing Machine
High temperature, quasi-static compression tests were carried out, according to DIN 53421
[DIN84], on samples having various cross sectional areas of 20 x 20, 13 x13 as well as
50 x 50 mm2 over a range of temperature from 0.2-0.9*Tm (for Alporas foams) and up to
0.5*Tm (for Distaloy and Astaloy foams), where Tm is the melting temperature. The
compression testing machine is a servo-hydraulic one equipped with a 100 kN load cell. A
schematic sketch is clearly demonstrated in Fig. 5-7.
Specimen
Thermoelement
Fixed piston
Movable piston
RadiationFurnace
Isolation
Fig. 5-7 A schematic illustration of the compressive testing machine at IEHK.
The sample was placed between a constant plate and a horizontally movable plate in

Experimental Work
48
a furnace which can be folded back. The machine is connected with a heat control unit,
which supplies it through 3 suppliers with the required heat. The maximum achievable
temperature is about 800°C. The temperature was monitored with a thermocouple Fe-CuNi
(L) DIN 43710. The specimens were maintained at the test temperature for 15 minutes prior
to testing. The force was recorded as a function of the plate’s displacement. The
displacement of the plate was used to determine the overall strain. The displacement rate
was constant at 1 mm/min.
Fig. 5-8 shows the test sample before and after compression.
(a) (b)
Fig. 5-8 Test sample a) before compression b) after compression.
5.3.2 Schenck Equipment
High temperature compressive tests in argon (Ar) have been carried out for the Astaloy as
well as the Distaloy foams, using a servo-hydraulic testing machine equipped with 160 kN
load cell. A schematic drawing of the test set-up is shown in Fig. 5-9. Samples having
a cross sectional area of 13 x 13 mm2 and 50 x 50 mm2 were placed between a fixed piston
and a vertically movable piston. The sample was inductively heated by a coil at a constant
rate of heating of 200 K/min to the required temperature. Thermocouple type S
(Pt- PtRh10%) was used to measure the temperature. As soon as the required temperature
is reached, a holding time of 60 sec is done in order to achieve a homogeneous distribution
of the temperature throughout the sample.
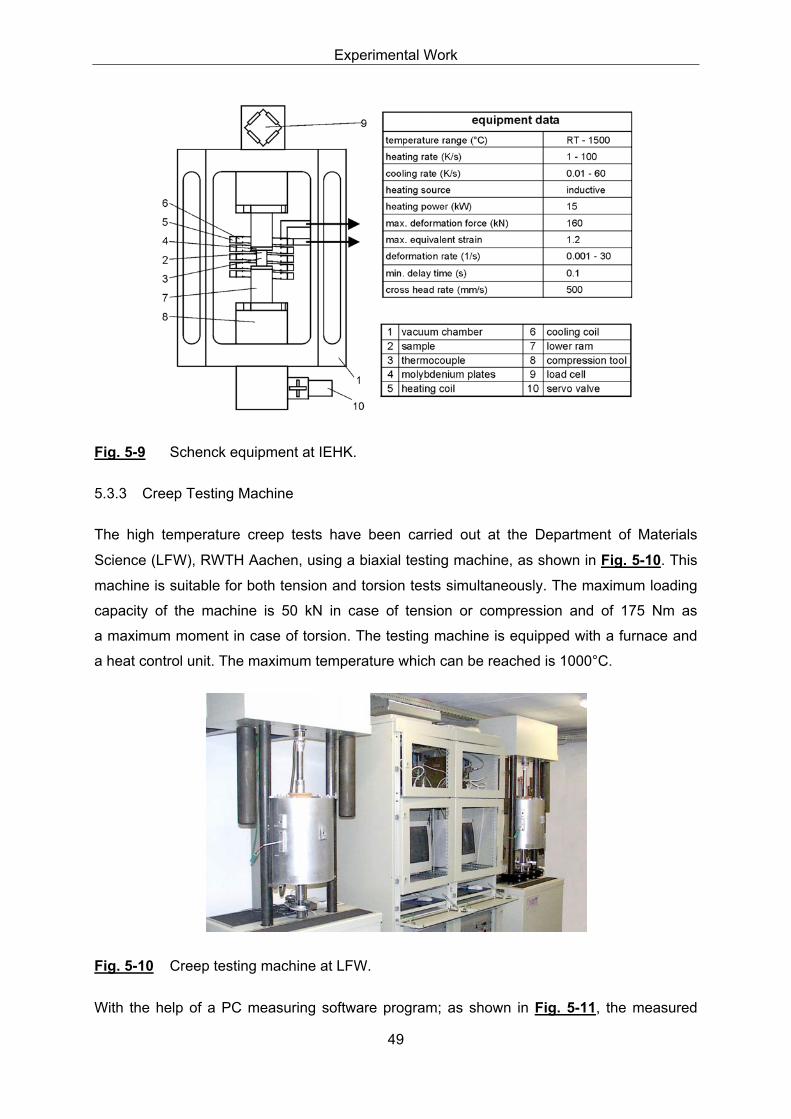
Experimental Work
49
Fig. 5-9 Schenck equipment at IEHK.
5.3.3 Creep Testing Machine
The high temperature creep tests have been carried out at the Department of Materials
Science (LFW), RWTH Aachen, using a biaxial testing machine, as shown in Fig. 5-10. This
machine is suitable for both tension and torsion tests simultaneously. The maximum loading
capacity of the machine is 50 kN in case of tension or compression and of 175 Nm as
a maximum moment in case of torsion. The testing machine is equipped with a furnace and
a heat control unit. The maximum temperature which can be reached is 1000°C.
Fig. 5-10 Creep testing machine at LFW.
With the help of a PC measuring software program; as shown in Fig. 5-11, the measured

Experimental Work
50
data can be expressed in terms of strain, time and stress, thus the creep curves can be
easily obtained.
Machine Drive
Tested Sample
Tension
Torsion
Measuring Devices
Tension Motor
TorsionMotor
Tension-DMS
.
Position Measuring Dev
Torsion-DMS
Angel Measuring Dev.
Measured Data
A / DPC-Card
PC+RegulationProgram forTension and Torsion
DPC-Card
MotorMovement Control Unit
Data Correction Input and Output Data Comparison
Input DataTension StressStrain Torsion StressTwisting Angle
Fig. 5-11 Flow chart of the measuring system for the creep testing machine at LWK.
5.3.4 Differential Thermal Analysis
Differential Thermal Analysis (DTA) is used to investigate the phase transformations
occurring during heating and/or cooling of a material via measuring the temperature
difference between the material to be investigated and a reference material using Netzsch
DTA 404 S type equipment, which is schematically depicted in Fig. 5-12. This device has the
ability to determine a temperature range from room temperature to 1550°C with heating or
cooling rates between 0.5 and 50 K/min. To avoid an oxidation of the specimens, the tests
are performed with a constant argon flow. The reference substrate is Al2O3, which shows no
transformation in the temperature area of interest. Since the whole bottom of the crucible

Experimental Work
51
must be covered with metal in the liquid state, especially for materials with a high density, the
amount of 200 mg has been proved as ideal. Only in this way is it possible to achieve the
relevant accuracy, which is required upon determining the difference in temperature between
the sample and the reference substrate. The sample was heated in inert atmosphere (Ar)
with a rate of heating 10 K/min. The results of this experiment will be later discussed in more
detail.
SampleReference substrateCrucibleThermocoupleThermocouple wireSeal cooling
Sample holderOxidation protection
tubeSiC-tubeThermocouple of thefurnace for controlling
Controlunit
Argon
Dataacquisition
Fig. 5-12 Differential thermal analysis equipment.
5.4 Follow-up Examination
5.4.1 Metallographic Characterisation
Microstructural characterisation of samples in the green state, after sintering as well as after
high temperature compression was performed using a conventional light optical microscope
(LOM) working with a digital software Soft Imaging System (SIS). The samples were ground
and polished using the normal grinding and polishing techniques. It is very important during

Experimental Work
52
the preparation of the samples for the metallographic examination to preserve the foamed
structure; i.e. the samples containing the pores have to be sawed carefully to avoid the
damage of the cells [SCH88]. The samples were infiltrated in vacuum by a low viscosity
resin. The resin was poured onto the samples and on admitting the air to the chamber; it was
forced into the small pores. Afterwards the samples are ground and polished using the
normal grinding and polishing tools.
5.4.2 SEM Examination
A scanning electron microscope (SEM), Stereoscan 90, Firm Cambridge Instruments with an
acceleration voltage of 25 kV was used to characterise the particle morphology of the used
powders. The topography of foams’ surfaces in the green state as well as after high
temperature compression was also investigated using SEM. SEM micrographs having
different magnifications were taken in various directions; aiming to investigate the topography
of the foams’ cell-walls prior to deformation as well as after compressive deformation.
5.4.3 Electron Probe Microanalysis
Electron probe microanalysis (EPMA) investigation was carried out at the Central Facility of
Electron Microscopy (GFE) - RWTH Aachen. This kind of investigation provides information
about the quantitatively distribution of the alloying elements in weight (wt. %) as well as
atomic percentage (at. %), respectively. The measurements were carried out by an electron
microprobe (Camebax SX50) equipped with wavelength-dispersive spectrometers. For
EPMA analysis the following measuring conditions were applied: electron beam energy:
15 keV; electron beam current: 40 nA; measuring time per analysing point: 10s; ~1 µm
focussed electron beam.
For calibration SiO2, Al2O3 were chosen for silicon, oxygen, calcium and pure metallic
standards for the other elements. Point analyses were performed in different phases, i.e.
calibrated characteristic X-ray intensities were determined and transformed to chemical
composition by using a matrix-correction procedure.
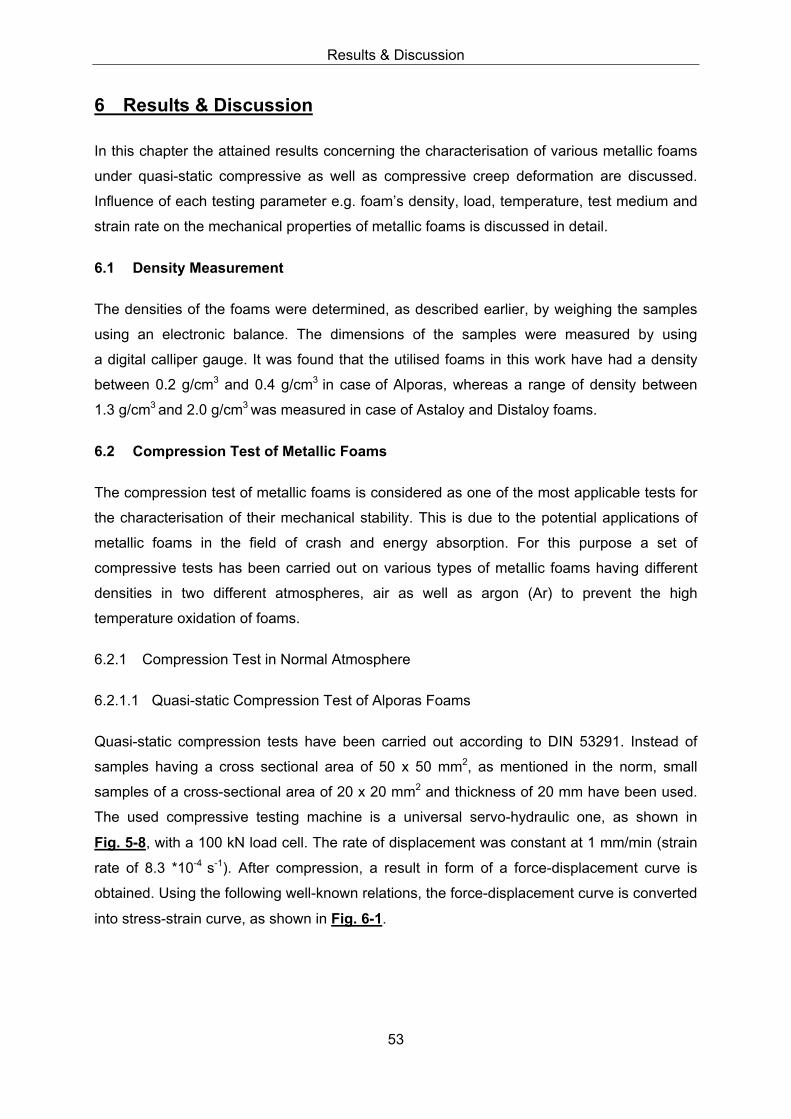
Results & Discussion
53
6 Results & Discussion
In this chapter the attained results concerning the characterisation of various metallic foams
under quasi-static compressive as well as compressive creep deformation are discussed.
Influence of each testing parameter e.g. foam’s density, load, temperature, test medium and
strain rate on the mechanical properties of metallic foams is discussed in detail.
6.1 Density Measurement
The densities of the foams were determined, as described earlier, by weighing the samples
using an electronic balance. The dimensions of the samples were measured by using
a digital calliper gauge. It was found that the utilised foams in this work have had a density
between 0.2 g/cm3 and 0.4 g/cm3 in case of Alporas, whereas a range of density between
1.3 g/cm3 and 2.0 g/cm3 was measured in case of Astaloy and Distaloy foams.
6.2 Compression Test of Metallic Foams
The compression test of metallic foams is considered as one of the most applicable tests for
the characterisation of their mechanical stability. This is due to the potential applications of
metallic foams in the field of crash and energy absorption. For this purpose a set of
compressive tests has been carried out on various types of metallic foams having different
densities in two different atmospheres, air as well as argon (Ar) to prevent the high
temperature oxidation of foams.
6.2.1 Compression Test in Normal Atmosphere
6.2.1.1 Quasi-static Compression Test of Alporas Foams
Quasi-static compression tests have been carried out according to DIN 53291. Instead of
samples having a cross sectional area of 50 x 50 mm2, as mentioned in the norm, small
samples of a cross-sectional area of 20 x 20 mm2 and thickness of 20 mm have been used.
The used compressive testing machine is a universal servo-hydraulic one, as shown in
Fig. 5-8, with a 100 kN load cell. The rate of displacement was constant at 1 mm/min (strain
rate of 8.3 *10-4 s-1). After compression, a result in form of a force-displacement curve is
obtained. Using the following well-known relations, the force-displacement curve is converted
into stress-strain curve, as shown in Fig. 6-1.

Results & Discussion
54
ε, %
σ, MPa
20 50
σ20%
σ50%
Fig. 6-1 Compressive stress-strain curve.
The stress-strain values can be easily calculated by using the following equations [HAG99]:
Compression strength (MPa)o
cc A
F=σ (6.1)
Compression strength at 20%
strain (MPa) oc A
F %20%20 =σ (6.2)
Compression strength at 50%
strain (MPa) 0
%50%50 A
Fc =σ (6.3)
Strain (%) 100*0hh
c∆
=ε (6.4)
Where cσ is the compressive stress in (MPa), cF is the compressive applied force in (N),
0A is the initial cross-sectional area of the sample in (mm2), cε is the compressive strain,
h∆ is the change within the height of the sample in (mm) and 0h is the initial height of the
sample in (mm).
6.2.1.1.1 Effect of Density
The foam’s properties are largely determined by its density. In order to study the influence of
density on the mechanical properties, a set of compression tests was carried out on foams
having different densities. For each density, two samples were taken and compressed.
Tab. 6-1 gives the measured compressive strength at 20% and 50% strain, respectively as a
function of foam’s density and temperature. It can be concluded, that the compressive
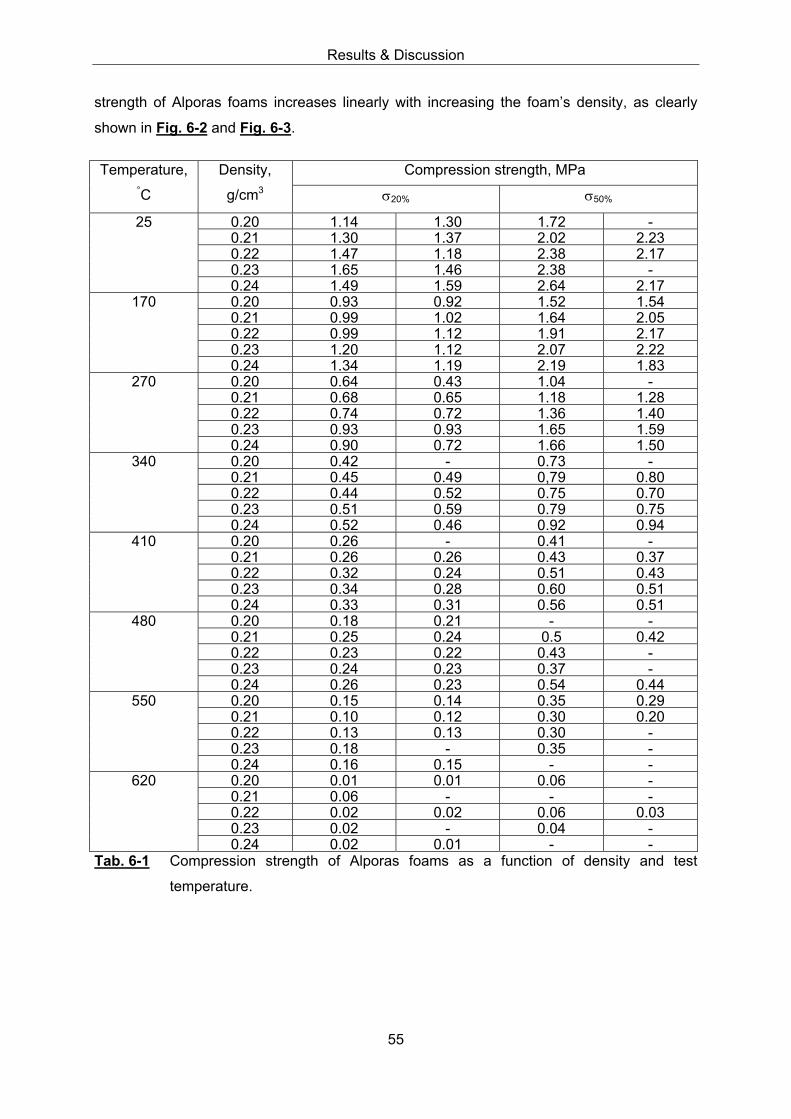
Results & Discussion
55
strength of Alporas foams increases linearly with increasing the foam’s density, as clearly
shown in Fig. 6-2 and Fig. 6-3.
Compression strength, MPaTemperature,°C
Density,
g/cm3 σ20% σ50%
0.20 1.14 1.30 1.72 -0.21 1.30 1.37 2.02 2.230.22 1.47 1.18 2.38 2.170.23 1.65 1.46 2.38 -
25
0.24 1.49 1.59 2.64 2.170.20 0.93 0.92 1.52 1.540.21 0.99 1.02 1.64 2.050.22 0.99 1.12 1.91 2.170.23 1.20 1.12 2.07 2.22
170
0.24 1.34 1.19 2.19 1.830.20 0.64 0.43 1.04 -0.21 0.68 0.65 1.18 1.280.22 0.74 0.72 1.36 1.400.23 0.93 0.93 1.65 1.59
270
0.24 0.90 0.72 1.66 1.500.20 0.42 - 0.73 -0.21 0.45 0.49 0,79 0.800.22 0.44 0.52 0.75 0.700.23 0.51 0.59 0.79 0.75
340
0.24 0.52 0.46 0.92 0.940.20 0.26 - 0.41 -0.21 0.26 0.26 0.43 0.370.22 0.32 0.24 0.51 0.430.23 0.34 0.28 0.60 0.51
410
0.24 0.33 0.31 0.56 0.510.20 0.18 0.21 - -0.21 0.25 0.24 0.5 0.420.22 0.23 0.22 0.43 -0.23 0.24 0.23 0.37 -
480
0.24 0.26 0.23 0.54 0.440.20 0.15 0.14 0.35 0.290.21 0.10 0.12 0.30 0.200.22 0.13 0.13 0.30 -0.23 0.18 - 0.35 -
550
0.24 0.16 0.15 - -0.20 0.01 0.01 0.06 -0.21 0.06 - - -0.22 0.02 0.02 0.06 0.030.23 0.02 - 0.04 -
620
0.24 0.02 0.01 - -Tab. 6-1 Compression strength of Alporas foams as a function of density and test
temperature.

Results & Discussion
56
T= 25°C
0.0
0.5
1.0
1.5
2.0
2.5
3.0
3.5
4.0
0.19 0.20 0.21 0.22 0.23 0.24 0.25
Density, g/cm3
Com
pres
sion
Stre
ngth
, MPa
test series 1-20%test series 2-20%test series 1-50%test series 2-50%
σ20%
σ50%
Fig. 6-2 Compression strength as a function of density of Alporas foams, tested at RT.
T = 270°C
0.0
0.5
1.0
1.5
2.0
2.5
3.0
3.5
4.0
0.19 0.20 0.21 0.22 0.23 0.24 0.25
Density, g/cm3
Com
pres
sion
Stre
ngth
, MPa
test series 1-20%test series 2-20%test series 1-50%test series 2-50%
σ20%
σ50%
Fig. 6-3 Compression strength as a function of density of Alporas foams, tested at 270°C.
The obtained compressive stress-strain curves consist of three regions. Linear elastic
regime, in which the stress attains its maximum value indicating the onset of the collapse,

Results & Discussion
57
followed by a softening region to a plateau regime, which is caused by the evolution of
collapse bands due to buckling of individual cells [MOT01]. In this plateau regime there are
distinct and quite regular stress oscillations [SMI97]. Finally, the densification regime, in
which the cells crush together and the cell wall material is compressed. The stress increases
rapidly, as the faces and edges are forced together [GIB97]. The duration of each region
depends on the density of the foam. The magnitude (or the height) of the compression
strength as well as the plateau stress of Alporas increases linearly with increasing the foam’s
density. A foam with lower density exhibits a longer and flatter plateau. This is because of the
structure itself, which affords more opportunity for cell walls to collapse and deform [PAR00].Moreover, the compression strain, at which the densification starts, increases with
decreasing the foam’s density, as shown in Fig. 6-4.
T = 410°C
0.0
0.2
0.4
0.6
0.8
1.0
1.2
1.4
1.6
1.8
0 10 20 30 40 50 60 70Compressive strain, %
Com
pres
sive
stre
ss, M
Pa
ρ=0,36 g/ccρ=0,29 g/ccρ=0,25 g/ccρ=0,23 g/cc
Fig. 6-4 Stress-strain curves of Alporas foams with a range of density between
0.25 g/cm3 and 0.36 g/cm3.
6.2.1.1.2 Effect of Temperature
A comparison of a set of curves plotted at various temperatures clearly reveals the tendency
of the Alporas foams to deform plastically. Fig. 6-5 shows that decreasing the test
temperature is accompanied with an increase within the compression strength as well as in
the plateau stress, whereas the compression strain, at which densification occurs,
decreases. Alporas foams with a density of 0.20 g/cm3 having at room temperature

Results & Discussion
58
a compression strength value of about 1 MPa. This value decreases to its half at 410°C and
to its one tenth at 620°C. The reason for this low value at room temperature may be due to
the presented thin cell-walls of the structure [GRO03]. The apparent oscillations within the
plateau regime of the stress-strain curve may be due to the brittle fracture of cell walls or due
to the shearing of the foam walls during the deformation process [KOZ01].
ρ= 0.20 g/cm3
0.0
0.5
1.0
1.5
2.0
2.5
3.0
0 10 20 30 40 50 60 70Strain, %
Stre
ss, M
Pa
RT
170°C
270°C
340°C
410°C
480°C
620°C
Fig. 6-5 Stress-strain curves of Alporas (ρ= 0.20 g/cm3) as a function of test temperature.
The aluminium metal has a great affinity to oxygen, so it forms an oxide layer on the surface
of the metal even at room temperature. With increasing the temperature, the thickness of the
oxide layer covering the surface of the metal also increases. It was found that the oxide scale
at RT has a thickness around 5 nm. The oxide scale at this thickness does not affect the
deformation of the foam, however, if the oxide scale becomes thicker, what is expected with
increasing the temperature, it may influence the behaviour of foams having struts only a few
micrometers thick. This mechanism may be consistent with the reduction in the amount of
the absorbed energy (area under stress-strain curve) by the foam that is observed with
increasing the temperature [DES03]
Fig. 6-6 below summarises the influence of foam’s density as well as the homologous
temperature on the ratio of the compressive strength of Alporas foams measured at various
testing temperatures to that measured at room temperature. As expected, the compression
strength of Alporas foams decreases with increasing the homologous temperature. This high
temperature behaviour of Alporas foams is similar to that of compact Al metal. The poor high

Results & Discussion
59
temperature mechanical properties of Alporas foams may be due to the coarsening of Al4Ca
and TiAl3 precipitates.
0.0
0.1
0.2
0.3
0.4
0.5
0.6
0.7
0.8
0.9
0.0 0.1 0.2 0.3 0.4 0.5 0.6 0.7 0.8 0.9 1.0T/Tm
σ 20%
(Τ)/σ
20%
(RΤ)
0.20 g/cc0.22 g/cc0.24 g/cc
Fig.6-6 The influence of the homologous temperature on the compression strength of
Alporas foams having densities of 0.20, 0.24 as well as 0.30 g/cm3.
6.2.1.1.3 Effect of Strain Rate on the Mechanical Properties of Alporas Foams
In order to evaluate the compressive behaviour of Alporas foams at high strain rates,
compressive tests at three different strain rates, 8*10-4 s-1, 8*10-3 s-1 and 8*10-2 s-1
respectively, have been carried out on Alporas foams having a density of
0.20 g/cm3. Fig. 6-7 shows that an increase of strain rate is accompanied by a slight
increase of the plateau stress as well as the compressive yield strength. This slight increase
was also observed in case of compact material [BÖL03]. Consequently, the foams collapse
more quickly. A large densification strain (an indication for a large resistance for deformation)
was obtained upon deformation at low strain rates. Two factors affecting the foam resistance
against deformation upon high strain rates deformation, they are 1) the release of the
entrapped gas inside the closed-cells and 2) resistance of the foam skeleton against elastic-
plastic deformation (strain-rate insensitive) [BÖL03].
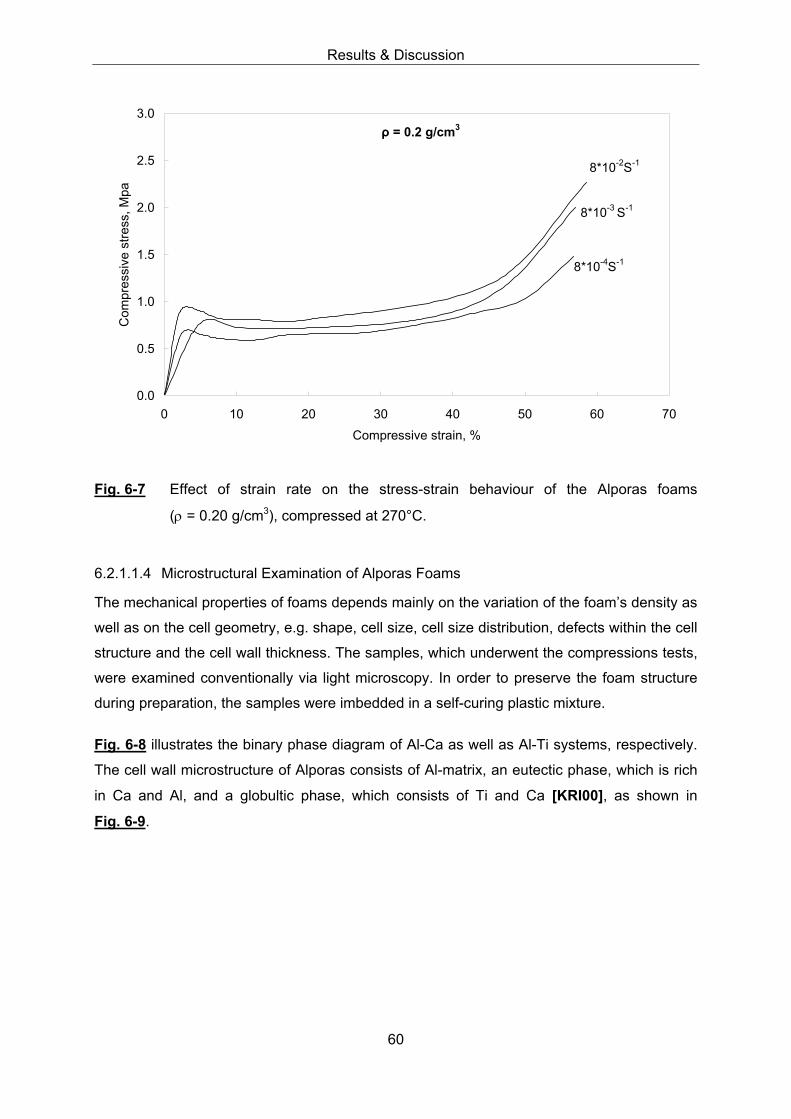
Results & Discussion
60
0.0
0.5
1.0
1.5
2.0
2.5
3.0
0 10 20 30 40 50 60 70Compressive strain, %
Com
pres
sive
stre
ss, M
pa
8*10-4S-1
8*10-3 S-1
8*10-2S-1
ρ = 0.2 g/cm3
Fig. 6-7 Effect of strain rate on the stress-strain behaviour of the Alporas foams
(ρ = 0.20 g/cm3), compressed at 270°C.
6.2.1.1.4 Microstructural Examination of Alporas Foams
The mechanical properties of foams depends mainly on the variation of the foam’s density as
well as on the cell geometry, e.g. shape, cell size, cell size distribution, defects within the cell
structure and the cell wall thickness. The samples, which underwent the compressions tests,
were examined conventionally via light microscopy. In order to preserve the foam structure
during preparation, the samples were imbedded in a self-curing plastic mixture.
Fig. 6-8 illustrates the binary phase diagram of Al-Ca as well as Al-Ti systems, respectively.
The cell wall microstructure of Alporas consists of Al-matrix, an eutectic phase, which is rich
in Ca and Al, and a globultic phase, which consists of Ti and Ca [KRI00], as shown in
Fig. 6-9.

Results & Discussion
61
(a)
(b)
Fig. 6-8 a) Calculated phase diagrams of Al-Ca [KEV01] and b) Al-Ti systems [MCC89,
MUR86], respectively.
Change in cell wall thickness of Alporas was prominent in the cell structure. This change in
wall thickness results from the cells, which have been elongated during the deformation, and
thus results in a change in the density distribution, i.e. there are regions of higher density and

Results & Discussion
62
others having lower one, from which the deformation propagate to the rest of the structure
[KRI99].
Al-CaAl-Ca-Ti
Fig. 6-9 Microstructure of a cell-wall of an Alporas sample (ρ = 0.25 g/cm3) deformed at
340°C.
Fig.6-10 (a-d) illustrates the difference within the cell-wall thickness of undeformed as well
as deformed Alporas samples upon compressive loading at 340°C in the linear-elastic,
plateau regimes as well as after complete densification, respectively. It can be seen that the
grain sizes of Alporas foams are of several hundreds micrometer so the grains usually
stretch over the whole width of the cell faces [HAA03]. It is obvious to notice that great
changes within the cell-wall thickness of the sample take place upon loading. The curvature
of the cell-wall also increases with increasing the load. When the load goes over a certain
value, which is the maximum value that can be withstood by the cell-walls, rupture occurs, as
shown in Fig. 6-10 d. The presence of such thin cell-walls may be the cause for this low
strength of the foams [GRO03].

Results & Discussion
63
(a) (b)
(c) (d)
Fig.6-10 Cell wall microstructure of Alporas foams (a) undeformed, (b) in linear-elastic
regime, (c) in plateau regime and (d) after densification at 340°C, respectively.
Fig. 6-11 shows the cell-wall microstructure of the Alporas foams, which have been tested at
different temperatures. It is clearly visible that the cell wall of the deformed samples have
been largely distorted [MCD03]. The dominant deformation mechanism was found to be the
cell-wall buckling [MCD03, SAL03]. Characteristic deformation behaviour of the metallic
foams is the formation of fracture zones in the form of deformation bands having a thickness
equals to the pore diameter. Such deformation bands are formed in a perpendicular direction
to the main deformation direction [HAG99].

Results & Discussion
64
RT 170°C
270°C 340°C
410°C 480°C
550°C 620°C
Fig. 6-11 Cell wall microstructure of Alporas foams after testing at different temperatures.
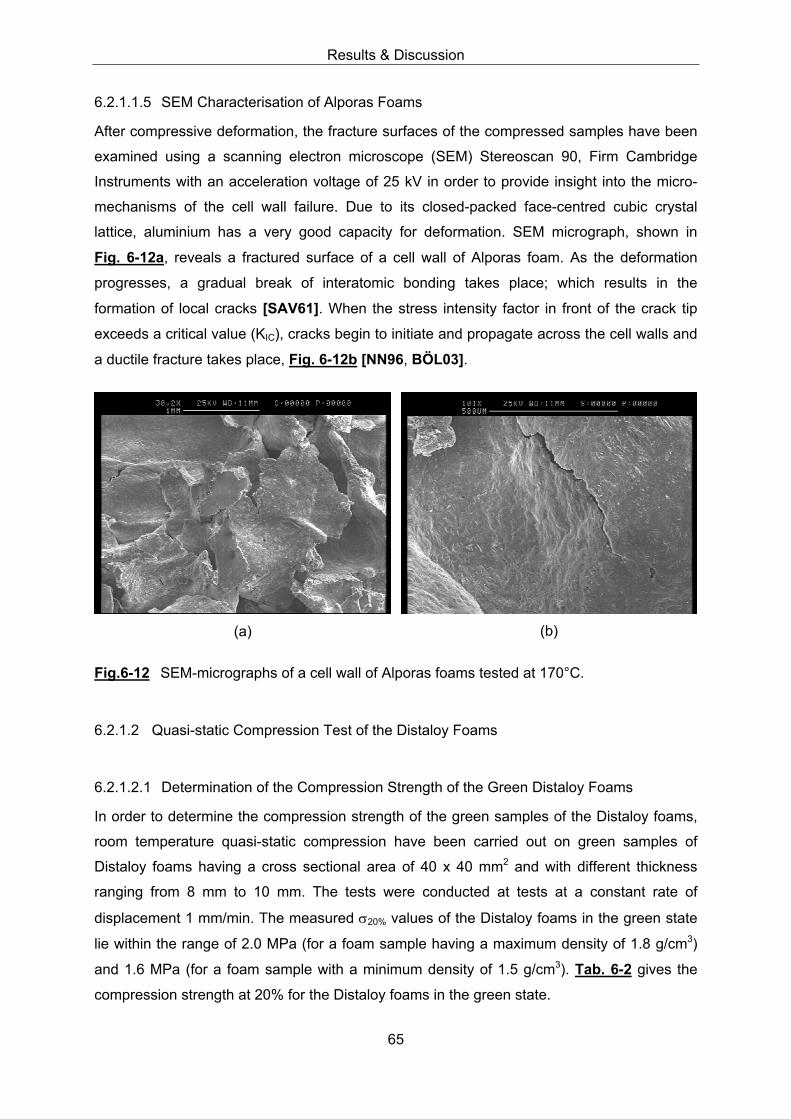
Results & Discussion
65
6.2.1.1.5 SEM Characterisation of Alporas Foams
After compressive deformation, the fracture surfaces of the compressed samples have been
examined using a scanning electron microscope (SEM) Stereoscan 90, Firm Cambridge
Instruments with an acceleration voltage of 25 kV in order to provide insight into the micro-
mechanisms of the cell wall failure. Due to its closed-packed face-centred cubic crystal
lattice, aluminium has a very good capacity for deformation. SEM micrograph, shown in
Fig. 6-12a, reveals a fractured surface of a cell wall of Alporas foam. As the deformation
progresses, a gradual break of interatomic bonding takes place; which results in the
formation of local cracks [SAV61]. When the stress intensity factor in front of the crack tip
exceeds a critical value (KIC), cracks begin to initiate and propagate across the cell walls and
a ductile fracture takes place, Fig. 6-12b [NN96, BÖL03].
(a) (b)
Fig.6-12 SEM-micrographs of a cell wall of Alporas foams tested at 170°C.
6.2.1.2 Quasi-static Compression Test of the Distaloy Foams
6.2.1.2.1 Determination of the Compression Strength of the Green Distaloy Foams
In order to determine the compression strength of the green samples of the Distaloy foams,
room temperature quasi-static compression have been carried out on green samples of
Distaloy foams having a cross sectional area of 40 x 40 mm2 and with different thickness
ranging from 8 mm to 10 mm. The tests were conducted at tests at a constant rate of
displacement 1 mm/min. The measured σ20% values of the Distaloy foams in the green state
lie within the range of 2.0 MPa (for a foam sample having a maximum density of 1.8 g/cm3)
and 1.6 MPa (for a foam sample with a minimum density of 1.5 g/cm3). Tab. 6-2 gives the
compression strength at 20% for the Distaloy foams in the green state.

Results & Discussion
66
Density, g/cm3 σ20%, MPa
1.5 1.6
1.6 1.6
1.7 1.7
1.8 2.0
Tab- 6-2 Compressive strength values at 20% for Distaloy samples in the green state.
The density of the Distaloy samples was measured once more after the sintering process.
A noticeable enhancement in the foam’s density after the sintering process was observed,
this is because of the building of a stable network (necking) during the sintering process
between the particles and the compaction or the hardening of the cell walls as well [BRA04].
Fig. 6-13 shows the behaviour of the density of the samples, measured before and after the
sintering process, as a function of the added amount of water. After undergoing the sintering
process the samples became denser, as shown from the values listed in Tab. 6-3.
Added amount of solvent
(water), g
Density before sintering,
g/cm3
Density after sintering at
1170°C, g/cm3
19.0 1.8 1.9
20.0 1.7 1.7
21.0 1.6 1.7
22.0 1.3 1.5
23.0 1.3 1.4
Tab. 6-3 Density of the Distaloy foams before and after the sintering process as well.

Results & Discussion
67
Distaloy
1.0
1.1
1.2
1.3
1.4
1.5
1.6
1.7
1.8
1.9
2.0
18 19 20 21 22 23 24Added amount of water, g
Den
sity
, g/c
m3
Before sinteringAfter sintering
Fig.6-13 Density of the Distaloy samples measured before and after the sintering process.
In comparison with the green samples, the sintered samples have attained higher
compressive strength values. This is due to the enhancement in the foam’s density resulted
from the formation of metallic bonds during the sintering process. Tab. 6-4 lists the
compressive strength values at 20% for sintered Distaloy samples.
Density, g/cm3 σ20%, MPa
1.4 5.6
1.6 9.3
1.7 10.5
1.9 18.0
Tab. 6-4 Compressive strength values at 20% for sintered Distaloy samples.
6.2.1.2.2 Effect of Density
Fig.6-14 shows the stress-strain curves of the Distaloy foams with different densities ranging
from 1.4 g/cm3 to 1.9 g/cm3. Typically, compressive stress-strain curves consisting of three
regions have been obtained. Linear elastic regime, a plateau regime and a densification
regime. The critical stress which marked the end of linear elastic deformation and the
beginning of foam collapse, is known as the compression strength. In the plateau regime, in
which the cell walls buckle and collapse, stress increases slightly with an increase in the
amount of strain. The attitude of the plateau stress is strongly affected by the intrinsic yield

Results & Discussion
68
strength of the metal, whereas the length of the plateau regime depends on the density of the
foam [PAR00]. Foam with a higher density has a short plateau regime. On the other hand,
foam of a lower density exhibits a longer, flatter plateau and the collapse of the cell walls
takes a long time compared to the higher density one.
T = 450°C
0
5
10
15
20
25
0 5 10 15 20 25 30 35 40 45Compressive strain, %
Com
pres
sive
stre
ss, M
Pa
1.9 g/cm3
1.7 g/cm3
1.6 g/cm3
1.4 g/cm3
Fig. 6-14 Stress-strain curves of Distaloy foams having different densities.
6.2.1.2.3 Effect of Temperature
The previous experiments investigated the effect of the foams’ density on their mechanical
properties and showed that an increase within the foam’s density leads to an enhancement
in the mechanical properties. In the following the temperature dependence of the mechanical
properties of metallic foams will be studied. Distaloy samples having a density of 1.7 g/cm3
have been compressed at various temperatures ranging from room temperature (RT) up to
800°C. The resulting compressive stress-strain curves are depicted in Fig. 6-15. The
compressive strength of the Distaloy foams increases with the temperature until a certain
temperature (450°C) is reached. This increase in the compression strength with increasing
the temperature may be due to the ageing effect, where the diffusion velocity of c-atoms
increases towards the dislocations, and thus hinders the dislocation motion and
consequently raises the strength of the material [BLE99]. When the temperature goes over
450°C, the foams begin to soften and a decrease in both the compressive yield strength as
well as the plateau stress is observed; moreover, the densification strain has been increased.

Results & Discussion
69
0
5
10
15
20
25
0 5 10 15 20 25 30 35 40 45Compressive strain, %
Com
pres
sive
stre
ss, M
Paρ = 1.7 g/cm3
450°C
RT
600°C800°C
Fig. 6-15 Temperature dependence of stress-strain curves of the Distaloy foams
(ρ= 1.7 g/cm3).
In Fig. 6-16, the ratio of the compressive strength at 20% measured at various temperatures
to that measured at room temperature for different densities of the Distaloy foam is
represented on the y-axis, whereas the homologous temperature is plotted on the x-axis. It
can be seen that an increase within the foam’s density leads to a higher compressive
strength value. This is the same at all test temperatures. On the contrary, an increase in the
test temperature leads to poor mechanical properties. If we consider, for example, foam with
a density of 1.4 g/cm3 compressed at RT, its compressive strength value was measured to
be about 5.5 MPa; whereas about the half of this value was obtained upon compression at
800°C. This is similar in case of foams having a density of 1.9 g/cm3. A compressive strength
value of about 16 MPa was obtained at RT, whereas about 50% of this value was obtained if
the foam is compressed at 800°C. The measured compressive strength values are listed in
Tab. 6-5. The large scattering in the obtained results are probably due to the inhomogeneous
density distribution within the foam cells.

Results & Discussion
70
0.0
0.2
0.4
0.6
0.8
1.0
1.2
1.4
1.2 1.3 1.4 1.5 1.6 1.7 1.8 1.9 2.0Density, g/cm3
σ 20%
(T)/ σ
20%
(RT)
800°C
600°C
450°C
Fig. 6-16 Compression strength (mean value) of Distaloy foams as a function of
temperature and foam’s density.
Compression strength at 20% (σ20%), MPaDensityg/cm3 RT 450°C 600°C 800°C
1.4 6.2 4.9 4.1 4.8 3.2 4.0 1.9 2.01.6 9.4 9.1 7.5 7.5 6.3 5.1 2.1 1.91.7 10.1 10.8 13.7 12.0 7.9 8.7 5.4 2.91.9 20.2 15.7 24.1 21.0 13.2 13.4 - 7.4
Tab. 6-5 Density and temperature dependence of compression strength of Distaloy foams.
6.2.1.2.4 Metallographic Examination
6.2.1.2.4.1 Stereoscopic Examination of the Distaloy foams
The stereoscopic macrographs of the Distaloy foams after high temperature compression
testing in air shows that the samples have been heavily oxidised due to the reaction
occurring between the oxygen of the air and the iron particles and this explains the presence
of this dark colour on the samples’ surfaces, as shown in Fig. 6-17.

Results & Discussion
71
Fig. 6-17 Stereoscopic macrographs of Distaloy foams having different densities, tested at
RT (left), 450°C (middle) and 600°C (right), respectively.
6.2.1.2.4.2 Microstructural Examination of the Distaloy Foams
The samples for the microstructural investigation were prepared by using normal grinding
and polishing techniques. The samples have firstly to be embedded under vacuum in
a plastic mixture in order to protect the cell structure from damage during preparation.
Microstructural examination was carried out using a light optical microscope working with
a digital software soft imaging system (SIS). As shown in Fig. 6-18, the microstructure of
Distaloy foam consists of a ferrite matrix, primary as well as secondary pores and iron oxide.
The size of the primary pores ranges from 0.1 to 3.0 mm whereas the secondary pores
having a size of typically 0.1 mm [ANG03]. The secondary pores are usually found within the
cell walls. The iron oxide may be formed via several routes; (i) the reaction of metal particles
with water molecules during the sintering process, or (ii) the reaction of the iron particles with
the oxygen of the air during the heating process upon compression.
Iron oxide
Secondary pores
Ferrite
Primary pores
Fig. 6-18 Microstructure of Distaloy foams.

Results & Discussion
72
6.2.1.2.4.3 Measurement of the Oxide Scale Thickness on the Distaloy Foams
Due to their ability to build a protect layer on their surfaces, metallic materials can be used at
high temperatures for prolonged times. The oxide layer growth rate must be slow in order to
provide an effective protection influence. The life-time of a material used at high
temperatures depends on the oxide growth rate as well as on oxide stability [LEY97].Tab. 6-6 elucidates the oxidation dependence of Distaloy foams on the temperature. After
compression at high temperatures in atmospheric air, an oxide layer was formed on the
surfaces of the Distaloy foams. The thickness of the oxide scales which built up on Distaloy
foams of differing densities (ranging from 1.7 g/cm3 to 1.9 g/cm3), has been measured at two
different positions, around the edges and in the middle of the specimens. At each position
two different sites (a, b) have been determined. Increasing the oxide thickness is a matter of
a diffusion process.
Position T, °C Oxide thickness, µm Mean
25 0 0 0 0 0 0 0 0 0450 3.5 3.2 4.5 4.7 4.8 2.3 2.6 2.2 3.5600 7.4 13.5 7.2 6.9 7.8 13.6 11.0 2.7 8.8
Edge-a
800 41.3 35.7 36.9 32.8 45.7 33.2 11.0 11.2 31.025 0 0 0 0 0 0 0 0 0
450 2.8 2.5 3.0 2.3 2.4 7.1 2.1 3.6 3.2600 4.7 6.4 16.5 10.5 7.1 17.3 23.1 9.3 11.8
Edge-b
800 42.1 37.7 28.4 10.4 24.8 13.3 21.8 34.6 26.725 0 0 0 0 0 0 0 0 0
450 3.0 1.5 2.8 1.7 1.6 2.0 1.7 0.7 1.9600 5.2 6.8 4.7 10.1 3.6 4.7 5.1 2.9 5.4
Middle-a
800 2.2 1.7 2.6 1.4 1.9 4.9 2.4 2.0 2.425 0 0 0 0 0 0 0 0 0
450 2.1 3.0 2.0 1.4 1.7 1.8 2.6 1.4 2.0600 4.9 7.3 3.6 3.9 3.6 5.9 3.5 5.2 4.8
Middle-b
800 2.4 1.4 2.4 1.5 1.1 2.7 1.4 2.6 1.9Tab. 6-6 The thickness of the scale, which has been built on the oxidised Distaloy foams.
As shown in Fig. 6-19 and Fig. 6-20, there is no oxide layer, neither in the middle nor around
the edges of the Distaloy samples compressed at RT. The edges of the samples have been
heavily oxidised in comparison to the middle of the samples. This is illustrated by the values
given in Tab. 6-6. A relation exists between the thickness of the built-up oxide scale and
temperature - where an increase of test temperature leads to the build-up of a thicker oxide
scale on the surface of the sample. Increasing the thickness of the oxide scale makes it
mechanically unstable. The reason for this is the building of internal stresses, which become
larger during the growth of the thickness of the oxide layer [SCH91]. If the oxide thickness
exceeds a certain critical value, the growing stresses at the metal/oxide surfaces lead to
build-up large normal stresses, which result in exceeding the adhesion forces of the oxide
layer and thus results in delaminating of the oxide layer [LEY97]. This thick oxide layer

Results & Discussion
73
retards the inward diffusion process of the oxygen ions and therefore provides a protection
against further oxidation and corrosion [CLA]. This leads to the formation of thinner oxide
layers in the middle of the samples. The presence of copper as an alloying element in
concentrations over 0.25 wt.% contributes in increasing the resistance against corrosion
[VAY97]. Phosphor has also a positive effect on increasing the corrosion resistance
[HOU00]. A thick oxide layer can also support the porous structure even above the melting
point of the alloy, provided that no significant external force is applied on the structure
[SIM02].

Results & Discussion
74
1.9 g/cm3-RT-edge-a 1.9 g/cm3-RT-edge-b
1.9 g/cm3-450°C-edge-a 1.9 g/cm3-450°C-edge-b
1.9 g/cm3-600°C-edge-a 1.9 g/cm3-600°C-edge-b
1.9 g/cm3-800°C-edge-a 1.9 g/cm3-800°C-edge-b
Fig.6-19 Microstructure micrographs at two different sites around the edges of Distaloy
foams (ρ = 1.9 g/cm3) compressed at 1mm/min at given temperatures.

Results & Discussion
75
1.9 g/cm3-RT-middle-a 1.9 g/cm3-RT-middle-b
1.9 g/cm3-450°C-middle-a 1.9 g/cm3-450°C-middle-b
1.9 g/cm3-600°C-middle-a 1.9 g/cm3-600°C-middle-b
1.9 g/cm3-800°C-middle-a 1.9 g/cm3-800°C-middle-b
Fig.6-20 Microstructure micrographs at two different sites in the middle of Distaloy foams
(ρ = 1.9 g/cm3) compressed at 1mm/min at given temperatures.

Results & Discussion
76
6.2.1.2.5 SEM Characterisation of Distaloy Foams
Fig. 6-21 shows a SEM-micrograph of Distaloy foam in the green state. Cell-walls separating
each pore from its neighbouring are clearly to be observed. It is also easily to distinguish
between the primary pores and the secondary pores. No micro cracks can be observed. On
the other hand, Fig. 6-22 reveals a post-sintering, deformed SEM-micrograph of Distaloy
foam. It is difficult here to distinguish between the primary and secondary pores. The
formation and propagation of cracks along the cell-walls are the dominant fracture
mechanisms. Crack initiates from the weakest and thinnest cell wall and then propagates
through the entire structure.
Primary pores
Secondary pores
Cell-walls
Fig. 6-21 SEM-micrograph of a Distaloy foam (ρ = 1.8 g/cm3) in the green state.
Fig. 6-22 SEM-micrograph of a Distaloy foam (ρ = 1.8 g/cm3) deformed at 800°C.

Results & Discussion
77
6.2.1.3 Quasi-static Compression Test of the Astaloy Foams
6.2.1.3.1 Determination of the Compression strength of the Green Astaloy Foams
The compression strength of the green Astaloy samples was measured and listed in
Tab. 6-7. It can be noted that there is a proportional relation between the foam’s density of
the green samples and their compression strength. An increase within the foam’s density
increases the compression strength as expected.
Density, g/cm3 σ20%, MPa
1.3 0.6
1.5 0.9
1.7 0.8
1.8 1.4
1.9 1.8
Tab. 6-7 Compressive strength at 20% for Astaloy samples in the green state.
Tab. 6-8 lists the measured values of the densities of the Astaloy foams in the green state,
i.e. before the sintering process, and after sintering as well.
Added amount of water, g Density before sintering,
g/cm3
Density after sintering at
1170°C, g/cm3
18.0 1.7 1.8
19.0 1.5 1.7
20.0 1.4 1.6
21.0 1.2 1.4
22.0 1.2 1.4
Tab. 6-8 Density of the Astaloy foams in the green state and post-sintering process.
Like the Distaloy foams, the density of the Astaloy foams show a dependence on the added
amount of water in both cases; pre- and post-sintering process as well, as shown in
Fig. 6-23. Before the sintering process the foam’s density decreases with increasing the
added amount of water which in turn lowers the viscosity of the slurry and thus permit easier
escaping of H2 bubbles, meanwhile the foam’s density after the sintering process increases
as metallic bonds between the particles are formed.

Results & Discussion
78
Astaloy
0.0
0.2
0.4
0.6
0.8
1.0
1.2
1.4
1.6
1.8
2.0
16 17 18 19 20 21 22 23 24Added amount of water, g
Den
sity
, g/c
m3
Before sinteringAfter sintering
Fig. 6-23 Density of the Astaloy samples measured before and after the sintering process.
6.2.1.3.2 Effect of Density
It was observed that the Astaloy foams also exhibit the typical behaviour of stress-strain
curves, namely, linear elastic regime, plateau and collapse or densification regime.
Increasing the foam’s density is accompanied by an increase in the compressive yield
strength as well as the plateau stress, whereas the compressive strain at which the
densification starts, decreases, Fig. 6-24. After the stress attains its maximum value,
softening post-yield response was observed before the plateau stress regime appears. This
softening behaviour may be due to either the presence of molybdenum (Mo) or to the
buckling of the material’s strut. It was found that the materials which have such like softening
behaviour may be less attractive as energy absorbers, since this application requires a
stress-strain response with a long, flat plateau [DES01]. During the plateau stress, energy is
absorbed largely by the bending and collapse of cell walls in the foam [PAR00]. The height
(or the attitude) of the plateau stress is strongly affected by the yield strength of the metal.
Thus, when compared to aluminium foams, steel foams afford greater energy absorption
capability because of their much higher yield stresses [BAN95].

Results & Discussion
79
T = 450°C
0
5
10
15
20
25
0 5 10 15 20 25 30 35 40 45 50Compressive strain, %
Com
pres
sive
stre
ss, M
Pa
1.5 g/cm3
1.6 g/cm3
1.8 g/cm3
1.7 g/cm3
Fig. 6-24 Stress-strain curves of Astaloy samples, tested at 450°C, as a function of foam’s
density.
6.2.1.3.3 Effect of Temperature
Fig. 6-25 shows the stress-strain behaviour of Astaloy foams with a density of 1.7 g/cm3 after
compression at various temperatures. Like the Distaloy foams, the mechanical properties of
Astaloy foams are strongly dependent on the test temperature. The compressive strength of
the Astaloy foams reaches its maximum value when a temperature of about 450°C is
reached. When the test temperature goes over 450°C a decrease in both compressive yield
strength as well as plateau stress is observed.

Results & Discussion
80
0
5
10
15
20
25
0 5 10 15 20 25 30 35 40 45Compressive strain, %
Com
pres
sive
stre
ss, M
Pa
800°C
600°C
RT
450°C
ρ= 1.7 g/cm3
Fig. 6-25 Temperature dependence of stress-strain curves of Astaloy foams
(ρ = 1.7 g/cm3).
The effect of both temperature and density on the compression strength of Astaloy foams is
presented in Fig. 6-26. It was found that the foams have attained a maximum compression
strength values at a temperature of 450°C, over which the foams begin to soften and their
strengths are thus reduced. As mentioned earlier, the reason for this phenomenon may be
due to the effect of the ageing. Tab. 6-9 gives the measured compression strength of the
Astaloy foams as a function of temperature and density.

Results & Discussion
81
Astaloy
0
2
4
6
8
10
12
14
0 100 200 300 400 500 600 700 800 900T, °C
Com
pres
sive
stre
ngth
at 2
0%, M
Pa
1.5 g/cm3
1.6 g/cm3
1.7 g/cm3
Fig. 6-26 Influence of temperature on the Compression strength of 1.5 g/cm3, 1.6 g/cm3
and 1.7 g/cm3 of Astaloy foams.
Density, g/cm3 Compression strength at 20%, MPaRT 450°C 600°C 700°C 800°C
1.5 3.6 3.7 5.0 6.0 4.4 4.6 3.1 3.4 1.4 1.51.6 6.9 8.3 7.0 8.5 6.4 5.6 3.5 4.7 1.9 1.91.7 8.2 7.9 8.9 7.9 6.7 7.1 5.4 5.5 2.1 1.9
Tab. 6-9 Compression strength of the Astaloy foams as a function of density and test
temperature.
6.2.1.3.4 Metallographic Examination
6.2.1.3.4.1 Stereoscopic Examination of Astaloy Foams
As shown in Fig. 6-27, the outer surface of the Astaloy samples have been strongly oxidised
due to the high temperature oxidation reaction with oxygen of the air.

Results & Discussion
82
Fig. 6-27 Stereoscopic macrographs of Astaloy foams having different densities, tested at
RT (left), 450°C (middle) as well as 600°C (right), respectively.
6.2.1.3.4.2 Microstructural Examination of Astaloy Foams
The microstructure micrograph of an Astaloy foam, shown in Fig. 6-28, taken by a light
optical microscope reveals that the microstructure consists of a ferrite matrix. There are two
different types of pores, primary-as well as secondary pores each have different sizes. Iron
oxide scale has been formed as well, due to the reaction occurring between the iron particles
and the oxygen of the air upon high temperature compression.
Iron oxide
Ferrite
Primary pores
Secondary pores
Fig. 6-28 Microstructure micrograph of an Astaloy sample compressed at 450°C.

Results & Discussion
83
6.2.1.3.4.3 Measurement of the Oxide Scale Thickness on the Astaloy Foams
During the high temperature compressive testing of Astaloy foams, the foams have been
oxidised because of the reaction of the iron particles with oxygen ions presented in air. In
order to study the effect of temperature on the thickness of the built oxide layer in the cell
walls at the middle as well as around the edges of the Astaloy samples, the thickness of this
built layer was measured at different temperatures. Tab. 6-10 gives the measured thickness
at the middle as well as around the edge at different temperatures.
Position T, °C Oxide thickness, µm Mean
RT 0 0 0 0 0 0 0 0 0450° 1.2 1.3 0.9 1.6 1.9 0.9 - - 1.3600° 13.3 6.7 10,0 9.9 10.0 9.7 7.0 7.5 9.1
Edge-a
800° 7.7 10.7 14.6 20.1 16.5 10.1 9.2 19.9 13.6RT 0 0 0 0 0 0 0 0 0
450° 4.7 1.5 2.1 2.1 1.4 1.4 3.0 2.0 2.3600° 6.5 6.1 7.3 5.8 8.0 8.4 6.2 7.6 5.9
Edge-b
800° 20.1 19.0 18.3 13.0 19.5 12.2 12.7 13.1 16.0RT 0 0 0 0 0 0 0 0 0
450° 1.7 1.5 1.8 1.1 2.5 2.0 1.8 1.2 1.9600° 2.3 2.7 2.5 3.3 1.9 2.9 2.4 3.4 2.7
Middle-a
800° 2.7 2.5 1.5 2.2 3.0 5.1 1.7 5.2 3.0RT 0 0 0 0 0 0 0 0 0
450° 1.5 2.1 1.8 1.8 1.5 1.7 3.2 1.7 1.9600° 3.3 3.8 3.0 3.4 5.0 1.5 2.5 2.9 3.3
Middle-b
800° 4.5 5.1 5.3 5.8 3.3 3.4 3.6 2.4 4.2Tab. 6-10 Measured oxide thickness of Astaloy samples at different temperatures
The microstructure micrographs of the Astaloy samples in Fig. 6-29 and Fig. 6-30, illustrate
the changes within the thickness of the built oxide scales at two different sites as a function
of the temperature. It can be seen that the Astaloy samples compressed at RT, have no
oxide scales neither in the middle of the sample nor around the edges. With increasing
temperature, a thick oxide layer is built on the surface of the samples. The formation of such
scales increases the resistance of the material against corrosion, which is also enhanced by
molybdenum as well as phosphorus [HOU00].

Results & Discussion
84
1.8 g/cm3-RT-edge-a 1.8 g/cm3-RT-edge-a
1.8 g/cm3-450°C-edge-a 1.8 g/cm3-450°C-edge-b
1.8 g/cm3-600°C-edge-a 1.8 g/cm3-600°C-edge-b
1.8 g/cm3-800°C-edge-a 1.8 g/cm3-800°C-edge-b
Fig. 6-29 Microstructure micrographs around the edges of the Astaloy samples (having
a density of 1.8 g/cm3) compressed at different temperatures.

Results & Discussion
85
1.8 g/cm3-RT-middle-a 1.8 g/cm3-RT-middle-b
1.8 g/cm3-450°C-middle-a 1.8 g/cm3-450°C-middle-b
1.8 g/cm3-600°C-middle-a 1.8 g/cm3-600°C-middle-b
1.8 g/cm3-800°C-middle-a 1.8 g/cm3-800°C-middle-b
Fig. 6-30 Microstructure micrographs at two different sites in the middle of Astaloy samples
(having a density of 1.8 g/cm3) deformed at different temperatures.

Results & Discussion
86
6.2.1.3.5 SEM characterisation of Astaloy Foams
SEM micrograph of a non-deformed green sample of Astaloy foams reveals obviously the
foamy structure, wherein the pores are separated from each other via the cell-walls, as
shown in Fig. 6-31, meanwhile Fig. 6-32 shows a SEM micrograph of the Astaloy foam in
sintered, deformed state. it can be seen a dense agglomerate with no more primary pores
but too many secondary pores are observed. The cell-walls have been completely destroyed.
The formation of trans-agglomerate cracks is the dominant fracture mechanism. These
cracks formed as a result of the nucleation of small voids, which coalesce together forming
large cavities.
Primary pores
Cell-Walls
Secondary pores
Fig. 6-31 SEM-micrograph of a non-deformed Astaloy foam (ρ = 1.8 g/cm3) in the green
state.
Secondary pores
Cracks
Fig. 6-32 SEM-micrograph of an Astaloy foam (ρ = 1.8 g/cm3) deformed at 800°C.
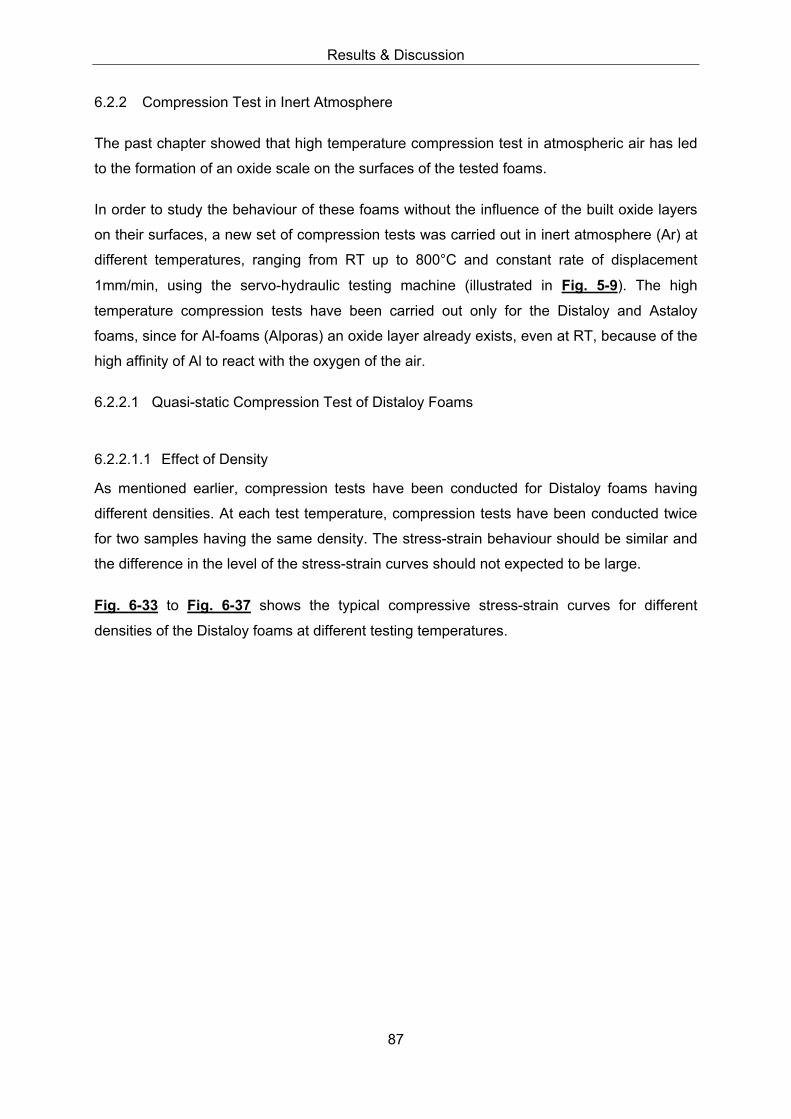
Results & Discussion
87
6.2.2 Compression Test in Inert Atmosphere
The past chapter showed that high temperature compression test in atmospheric air has led
to the formation of an oxide scale on the surfaces of the tested foams.
In order to study the behaviour of these foams without the influence of the built oxide layers
on their surfaces, a new set of compression tests was carried out in inert atmosphere (Ar) at
different temperatures, ranging from RT up to 800°C and constant rate of displacement
1mm/min, using the servo-hydraulic testing machine (illustrated in Fig. 5-9). The high
temperature compression tests have been carried out only for the Distaloy and Astaloy
foams, since for Al-foams (Alporas) an oxide layer already exists, even at RT, because of the
high affinity of Al to react with the oxygen of the air.
6.2.2.1 Quasi-static Compression Test of Distaloy Foams
6.2.2.1.1 Effect of Density
As mentioned earlier, compression tests have been conducted for Distaloy foams having
different densities. At each test temperature, compression tests have been conducted twice
for two samples having the same density. The stress-strain behaviour should be similar and
the difference in the level of the stress-strain curves should not expected to be large.
Fig. 6-33 to Fig. 6-37 shows the typical compressive stress-strain curves for different
densities of the Distaloy foams at different testing temperatures.

Results & Discussion
88
RT
0
5
10
15
20
25
0 5 10 15 20 25 30 35 40 45
test 1test 2
1.7g/cm3
Compressive strain, %
Com
pres
sive
stre
ss, M
Pa
0
5
10
15
20
25
0 5 10 15 20 25 30 35 40 45
test 1test 2
1.8 g/cm3
Compressive strain,%
Com
pres
sive
stre
ss, M
Pa
0
5
10
15
20
25
0 5 10 15 20 25 30 35 40 45
test 1test 2
1.9 g/cm3
Compressive strain, %
Com
pres
sive
stre
ss, M
Pa
0
5
10
15
20
25
0 5 10 15 20 25 30 35 40 45
test 1
2.0 g/cm3
Compressive strain, %
Com
pres
sive
stre
ss; M
Pa
Fig. 6-33 Stress-strain curves of different densities of the Distaloy foams, compressed at
RT in Ar atmosphere.

Results & Discussion
89
200°C
0
5
10
15
20
25
0 5 10 15 20 25 30 35 40 45
test 1test 2
1.7 g/cm3
Compressive strain; %
Com
pres
sive
stre
ss; M
Pa
0
5
10
15
20
25
0 5 10 15 20 25 30 35 40 45
test 1
1.8 g/cm3
Compressive strain; %
Com
pres
sive
stre
ss; M
Pa
0
5
10
15
20
25
0 5 10 15 20 25 30 35 40 45
test 1
1.9 g/cm3
Compressive strain; %
Com
pres
sive
stre
ss; M
Pa
0
5
10
15
20
25
0 5 10 15 20 25 30 35 40 45
test 1test 2
2.0 g/cm3
Compressive strain; %
Com
pres
sive
stre
ss; M
Pa
Fig. 6-34 Stress-strain curves of different densities of the Distaloy foams, compressed at
200°C in Ar atmosphere.

Results & Discussion
90
450°C
05
101520253035
0 5 10 15 20 25 30 35 40 45
test 1test 2
1.8 g/cm3
Compressive strain, %
Com
pres
sive
stre
ss, M
Pa
05
101520253035
0 5 10 15 20 25 30 35 40 45
test 1test 2
Compressive strain,%
Com
pres
sive
stre
ss, M
Pa
05
101520253035
0 5 10 15 20 25 30 35 40 45
test 1
2.0 g/cm31.9 g/cm3
Compressive strain, %
Com
pres
sive
stre
ss, M
Pa
05
101520253035
0 5 10 15 20 25 30 35 40 45
test 11.7 g/cm3
Compressive strain; %
Com
pres
sive
stre
ss; M
Pa
Fig. 6-35 Stress-strain curves of different densities of the Distaloy foams, compressed at
450°C in Ar atmosphere.

Results & Discussion
91
600°C
0
5
10
15
20
25
0 5 10 15 20 25 30 35 40 45
test 1test 2
1.7g/cm3
Compressive strain; %
Com
pres
sive
stre
ss; M
Pa
0
5
10
15
20
25
0 5 10 15 20 25 30 35 40 45
test 1test 2
1.8 g/cm3
Compressive strain, %
Com
pres
sive
stre
ss, M
Pa
0
5
10
15
20
25
0 5 10 15 20 25 30 35 40 45
test 1test 2
1.9 g/cm3
Compressive strain, %
Com
pres
sive
stre
ss, M
Pa
0
5
10
15
20
25
0 5 10 15 20 25 30 35 40 45
test 1
2.0 g/cm3
Compressive strain, %
Com
pres
sive
stre
ss, M
Pa
Fig. 6-36 Stress-strain curves of different densities of the Distaloy foams, compressed at
600°C in Ar atmosphere.
800°C
05
101520253035
0 5 10 15 20 25 30 35 40 45
test 1test 2
1.7g/cm3
Compressive strain, %
Com
pres
sive
stre
ss, M
Pa
0
5
10
15
20
25
0 5 10 15 20 25 30 35 40 45
test 1test 2
1.9 g/cm3
Compressive strain, %
Com
pres
sive
stre
ss, M
Pa
Fig. 6-37 Stress-strain curves of different densities of the Distaloy foams, compressed at
800°C in Ar atmosphere.
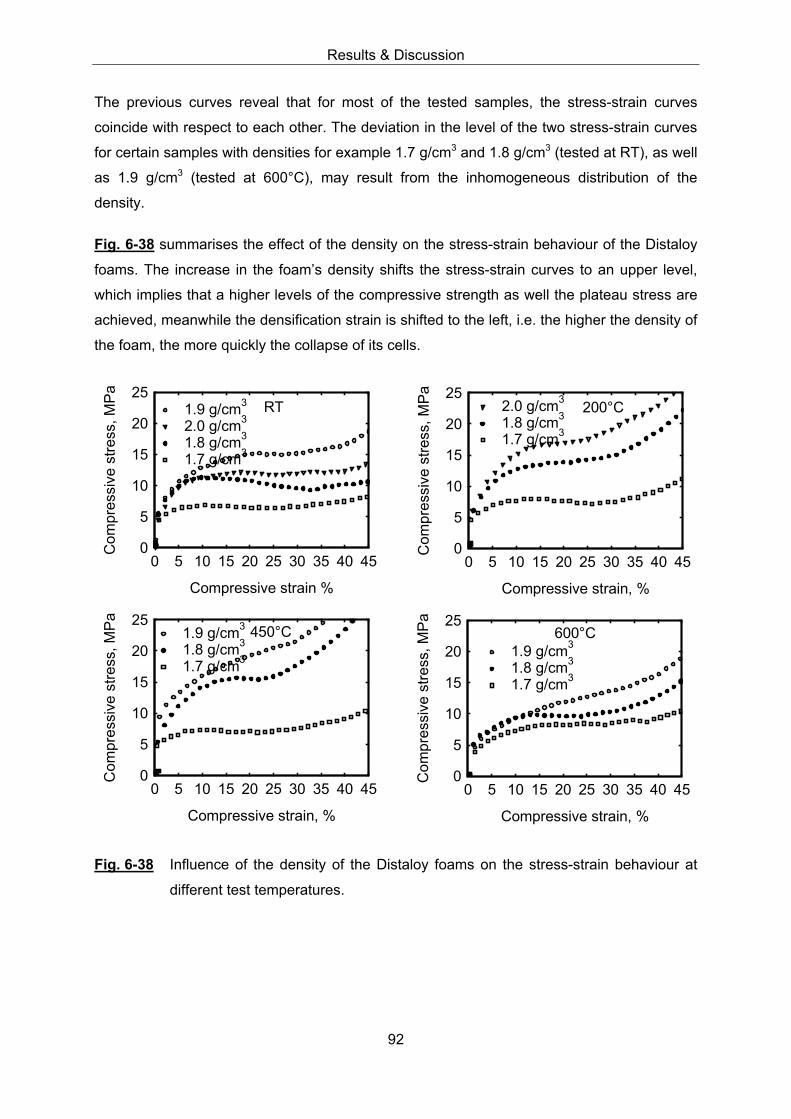
Results & Discussion
92
The previous curves reveal that for most of the tested samples, the stress-strain curves
coincide with respect to each other. The deviation in the level of the two stress-strain curves
for certain samples with densities for example 1.7 g/cm3 and 1.8 g/cm3 (tested at RT), as well
as 1.9 g/cm3 (tested at 600°C), may result from the inhomogeneous distribution of the
density.
Fig. 6-38 summarises the effect of the density on the stress-strain behaviour of the Distaloy
foams. The increase in the foam’s density shifts the stress-strain curves to an upper level,
which implies that a higher levels of the compressive strength as well the plateau stress are
achieved, meanwhile the densification strain is shifted to the left, i.e. the higher the density of
the foam, the more quickly the collapse of its cells.
0
5
10
15
20
25
0 5 10 15 20 25 30 35 40 45
1.9 g/cm3
1.8 g/cm3
1.7 g/cm3
450°C
Compressive strain, %
Com
pres
sive
stre
ss, M
Pa
0
5
10
15
20
25
0 5 10 15 20 25 30 35 40 45
2.0 g/cm3
1.8 g/cm3
1.7 g/cm3
200°C
Compressive strain, %
Com
pres
sive
stre
ss, M
Pa
0
5
10
15
20
25
0 5 10 15 20 25 30 35 40 45
1.9 g/cm3
1.8 g/cm3
1.7 g/cm3
600°C
Compressive strain, %
Com
pres
sive
stre
ss, M
Pa
0
5
10
15
20
25
0 5 10 15 20 25 30 35 40 45
1.9 g/cm3
2.0 g/cm3
1.8 g/cm3
1.7 g/cm3
RT
Compressive strain %
Com
pres
sive
stre
ss, M
Pa
Fig. 6-38 Influence of the density of the Distaloy foams on the stress-strain behaviour at
different test temperatures.

Results & Discussion
93
6.2.2.1.2 Effect of Temperature
Fig. 6-39 summarises the effect of test temperature upon the stress-strain behaviour of the
Distaloy foams as a function of the foam’s density. It is well-known from the physical
metallurgy of metals and alloys that the strength of solid metals decrease with increasing
temperature. However, it was observed that the compressive strength of foams at 200°C as
well as 450°C, respectively, was larger than that at RT. This was observed for all foams
under study. The reason for the increase in the compressive strength of the Distaloy foams in
this range of temperature (200°C-450°C) may result from the interaction between C-element
and immigrating dislocations. This phenomenon is known as „age-hardening“ [BLE99].
0
5
10
15
20
25
0 5 10 15 20 25 30 35 40 45
200°C450°CRT600°C800°C
1.7 g/cm3
Compressive strain, %
Com
pres
sive
stre
ss, M
Pa
0
5
10
15
20
25
0 5 10 15 20 25 30 35 40 45
450°C200°C600°CRT
1.8 g/cm3
Compressive strain, %
Com
pres
sive
stre
ss, M
Pa
0
5
10
15
20
25
0 5 10 15 20 25 30 35 40 45
450°C200°C600°CRT
2.0 g/cm3
Compressive strain, %
Com
pres
sive
stre
ss, M
Pa
0
5
10
15
20
25
0 5 10 15 20 25 30 35 40 45
200°C600°CRT800°C
1.9 g/cm3
Compressive strain, %
Com
pres
sive
stre
ss, M
Pa
Fig. 6-39 Stress-strain curves for different densities of Distaloy foams at different test
temperatures.
The compression strength values of the Distaloy foams as a function of the foam’s density
and of the test temperature are given in Tab. 6-10.

Results & Discussion
94
Density, g/cm3 Compression strength at 20%, MPaRT 200°C 450°C 600°C 800°C
1.7 5.8 6.5 6.3 7.0 - 6.8 5.7 5.6 0.7 1.11.8 8.6 10.7 13.7 - 14.2 14.2 9.7 8.0 - -1.9 15.0 15.0 7.8 - 18.9 - 11.8 10.4 2.3 2.12.0 12.1 - 16.9 12.7 15.1 13.8 6.7 - - -
Tab. 6-11 Compressive strength of Distaloy foams at 20% as a function of foam’s density
and test temperature.
Fig. 6-40 illustrates the relation between the mean values of the compressive strength at
20% strain for Distaloy foams having two different densities as a function of test temperature.
It is obvious to see that there are two different mechanisms - strengthening and softening –
taking place during the compression test. Like the Distaloy foams, the compressive strength
of the Astaloy foams increases as the temperature increases until it reaches 450°C,
afterwards the foams begin to soften with increasing the temperature. As mentioned before,
an interpretation for this increase in the compressive strength values over this range of
temperature may be due to the ageing effect [BLE99, MEM89]. On the same diagram, the
compressive strength at 20% of 0.24 g/cm3 Alporas foam is plotted in order to compare
between the behaviour of the Distaloy foams and that of the Alporas foams. Unlike the
Distaloy foams, the compressive strength of Alporas foams decreases with increasing the
test temperature. An interpretation for this softening may be due to the coarsening of the
precipitates which have been formed during the manufacturing process.

Results & Discussion
95
Distaloy
0
2
4
6
8
10
12
14
16
18
20
22
24
0 100 200 300 400 500 600 700 800 900T, °C
Com
pres
sive
stre
ngth
at 2
0%, M
Pa
Alporas 0.24 g/cm3
1.7 g/cm3
1.9 g/cm3
Fig. 6-40 Compressive strength of Distaloy foams as a function of foam’s density and test
temperature in comparison to Alporas foams.
6.2.2.1.3 Metallographic Examination
6.2.2.1.3.1 Stereoscopic Examination of the Distaloy Foams
Observing the stereoscopic macrographs of the tested Distaloy samples, shown in
Fig. 6-41 to Fig. 6-44, it was found that each sample has had certain characteristic features,
e.g., in some samples some pores with different sizes were found, whereas in others very
fine pores were present. Some samples showed some kind of agglomeration or clustering of
particles in certain areas than the other, while others did not exhibit it. The number, size and
distribution of pores influence undoubtedly the homogeneity of the foam’s density and
consequently their mechanical properties.
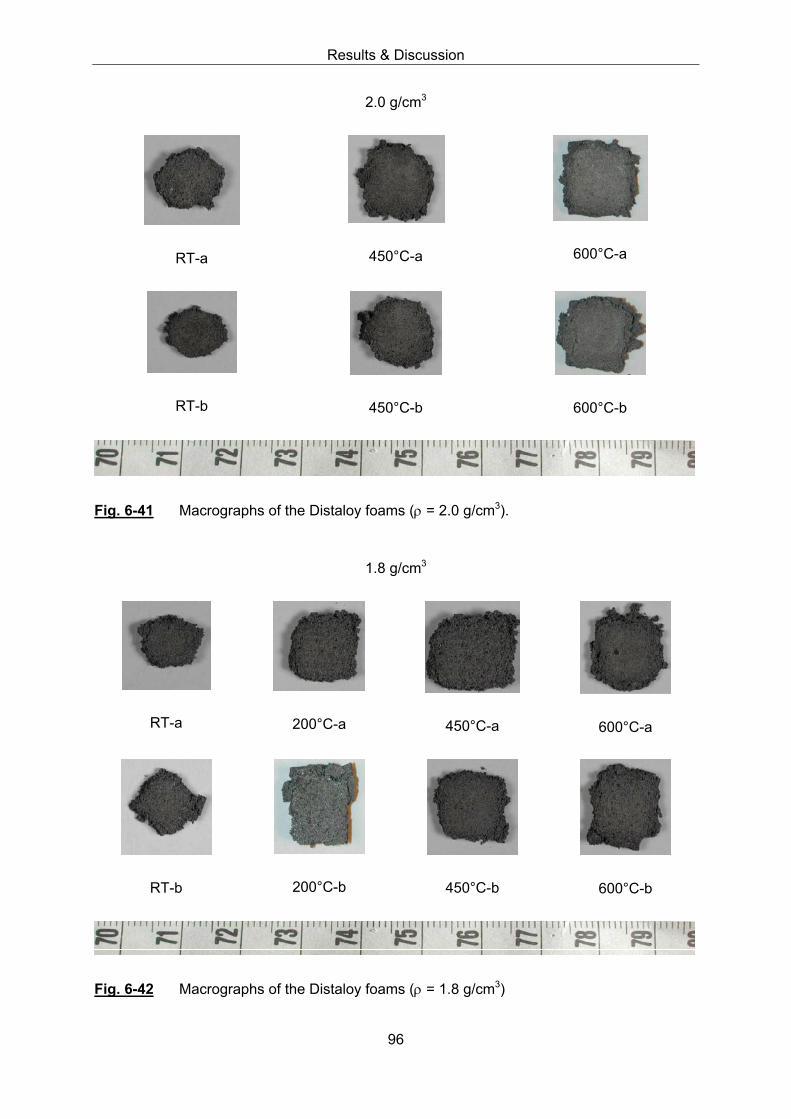
Results & Discussion
96
2.0 g/cm3
RT-a 450°C-a 600°C-a
RT-b 450°C-b 600°C-b
Fig. 6-41 Macrographs of the Distaloy foams (ρ = 2.0 g/cm3).
1.8 g/cm3
RT-a 200°C-a 450°C-a 600°C-a
RT-b 200°C-b 450°C-b 600°C-b
Fig. 6-42 Macrographs of the Distaloy foams (ρ = 1.8 g/cm3)

Results & Discussion
97
1.9 g/cm3
RT-a 200°C-a 450°C-a 600°C-a 800°C-a
RT-b
200°C-b
450°C-b 600°C-b 800°C-b
Fig. 6-43 Macrographs of the Distaloy foams (ρ = 1.9 g/cm3)
1.7 g/cm3
RT-a 200°C-a 450°C-a
600°C-a
RT-b 200°C-b 450°C-b 600°C-b
Fig. 6-44 Macrographs of the Distaloy foams (ρ = 1.7 g/cm3)

Results & Discussion
98
6.2.2.1.3.2 Microstructural Examination of the Distaloy Foams
Fig. 6-45 shows the light optical microscope (LOM) micrographs of the Distaloy foams at
a magnification of 500 µm at each test temperature. The micrograph of the Distaloy foam
compressed at RT has a large number of primary pores with small sizes. Primary pores with
larger sizes and of irregular shapes have been appeared at higher temperatures. This
causes inhomogeneous distribution of the local density within the sample. A neck (sintering-
bridge) has been formed between some particles. This indicates that the sintering process
was not completely carried out, i.e. the samples should be sintered either at high sintering
temperatures or at long sintering times. The interconnection between some pores was also
observed.
RT 200°C
450°C 600°C
Fig. 6-45 Microstructure micrograph of the deformed Distaloy foams (ρ = 1.8 g/cm3) at
different testing temperatures.

Results & Discussion
99
6.2.2.1.4 SEM Characterisation of the Distaloy Foams
Fig. 6-46 shows a micrograph of a cell wall of Distaloy foam. After deformation, pores were
still found in certain sites of the cell wall, whereas the rest of the cell wall of the foam has
been completely compressed into a compact material. The coalescence of small pores leads
to the formation of micro-cracks. The particles have been completely stuck with each other.
As will be seen later in case of Astaloy, this sticking effect has not appeared; therefore this
phenomenon may be due to either the nature of the powder or its chemical composition.
Fig. 6-46 SEM micrograph of a Distaloy foam tested at 200°C (ρ= 1.8 g/cm3).
6.2.2.2 Quasi-static Compression Test of the Astaloy Foams
6.2.2.2.1 Effect of Density
Like the Distaloy foams, compression tests on different densities of Astaloy foams were
carried out under similar conditions. Fig. 6-47 to Fig. 6-50 shows the compressive stress
strain behaviour for different densities of the Astaloy foams at each given test temperature.
The compression test was carried out twice for each density. The deviation in the obtained
stress-strain curves in some cases is possibly resulting from the inhomogeneous distribution
of the density.
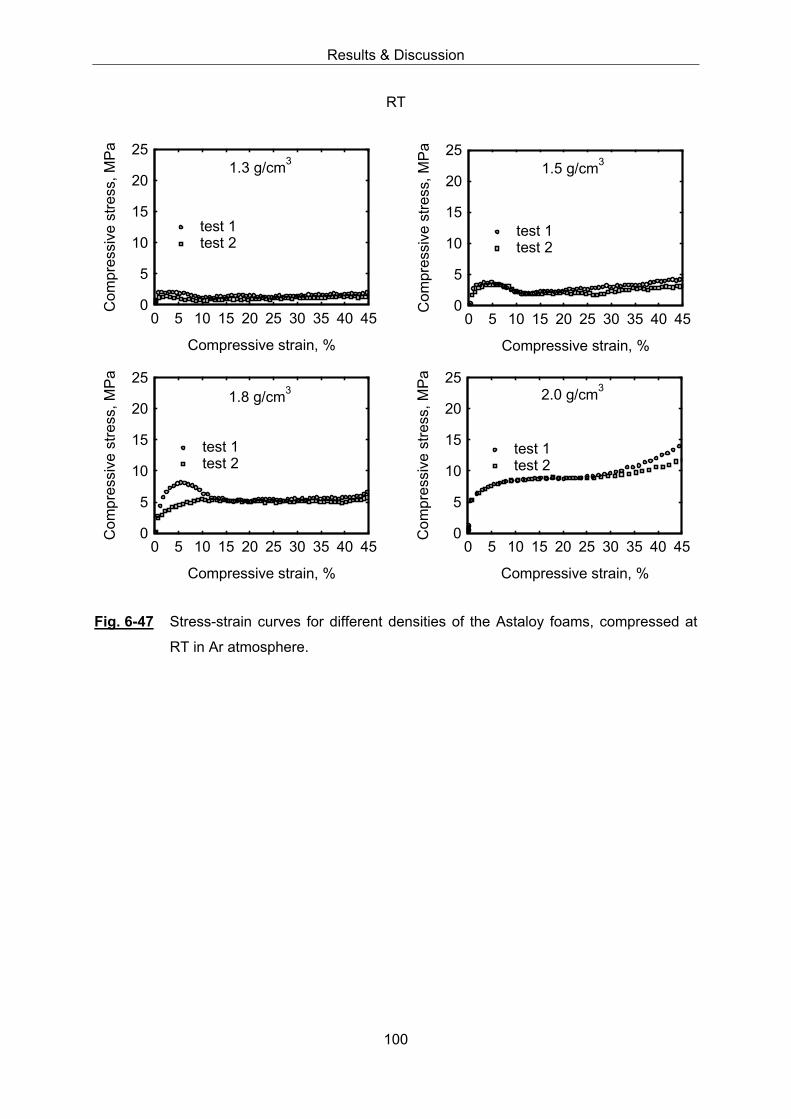
Results & Discussion
100
RT
0
5
10
15
20
25
0 5 10 15 20 25 30 35 40 45
test 1test 2
1.3 g/cm3
Compressive strain, %
Com
pres
sive
stre
ss, M
Pa
0
5
10
15
20
25
0 5 10 15 20 25 30 35 40 45
test 1test 2
1.5 g/cm3
Compressive strain, %
Com
pres
sive
stre
ss, M
Pa
0
5
10
15
20
25
0 5 10 15 20 25 30 35 40 45
test 1test 2
1.8 g/cm3
Compressive strain, %
Com
pres
sive
stre
ss, M
Pa
0
5
10
15
20
25
0 5 10 15 20 25 30 35 40 45
test 1test 2
2.0 g/cm3
Compressive strain, %
Com
pres
sive
stre
ss, M
Pa
Fig. 6-47 Stress-strain curves for different densities of the Astaloy foams, compressed at
RT in Ar atmosphere.

Results & Discussion
101
200°C
0
5
10
15
20
25
0 5 10 15 20 25 30 35 40 45
test 1test 2
1.5 g/cm3
Compressive strain, %
Com
pres
sive
stre
ss, M
Pa
0
5
10
15
20
25
0 5 10 15 20 25 30 35 40 45
test 1
1.3 g/cm3
Compressive strain, %
Com
pres
sive
stre
ss, M
Pa
0
5
10
15
20
25
0 5 10 15 20 25 30 35 40 45
test 1test 2
1.8 g/cm3
Compressive strain, %
Com
pres
sive
stre
ss, M
Pa
0
5
10
15
20
25
0 5 10 15 20 25 30 35 40 45
test 1test 2
2.0 g/cm3
Compressive strain, %
Com
pres
sive
stre
ss, M
Pa
Fig. 6-48 Stress-strain curves for different densities of the Astaloy foams, compressed at
200°C in Ar atmosphere.

Results & Discussion
102
450°C
0
5
10
15
20
25
0 5 10 15 20 25 30 35 40 45
test 1test 2
1.3 g/cm3
compressive strain, %
Com
pres
sive
stre
ss, M
Pa
0
5
10
15
20
25
0 5 10 15 20 25 30 35 40 45
test 1test 2
1.5 g/cm3
Compressive strai, %
Com
pres
sive
stre
ss, M
Pa
0
5
10
15
20
25
0 5 10 15 20 25 30 35 40 45
test 1test 2
1.8 g/cm3
Compressive strain, %
Com
pres
sive
stre
ss, M
Pa
0
5
10
15
20
25
0 5 10 15 20 25 30 35 40 45
test 1test 2
2.0 g/cm3
Compressive strain, %
Com
pres
sive
stre
ss, M
Pa
Fig. 6-49 Stress-strain curves for different densities of the Astaloy foams, compressed at
450°C in Ar atmosphere.

Results & Discussion
103
600°C
0
5
10
15
20
25
0 5 10 15 20 25 30 35 40 45
test 1
1.5 g/cm3
Compressive strain, %
Com
pres
sive
stre
ss, M
Pa
0
5
10
15
20
25
0 5 10 15 20 25 30 35 40 45
test 1test 2
1.8 g/cm3
Compressive strain, %
Com
pres
sive
stre
ss, M
Pa
0
5
10
15
20
25
0 5 10 15 20 25 30 35 40 45
test 1
2.0 g/cm3
Compressive strain, %
Com
pres
sive
stre
ss, M
Pa
Fig. 6-50 Stress-strain curves for different densities of the Astaloy foams, compressed at
600°C in Ar atmosphere.
Fig. 6-51 represents the effect of the foam’s density on the stress-strain behaviour of the
Astaloy samples at different test temperatures. The compressive strength increases with
increasing foam density. Non-homogeneous distribution of the density may be a cause for
the deviation in the obtained results.

Results & Discussion
104
0
5
10
15
20
25
0 5 10 15 20 25 30 35 40 45
2.0 g/cm3
1.8 g/cm3
1.5 g/cm3
1.3 g/cm3
RT
Compressive strain, %
Com
pres
sive
stre
ss, M
Pa
0
5
10
15
20
25
0 5 10 15 20 25 30 35 40 45
2.0 g/cm3
1.8 g/cm3
1.5 g/cm3
1.3 g/cm3
200°C
Compressive strain, %
Com
pres
sive
stre
ss, M
Pa
0
5
10
15
20
25
0 5 10 15 20 25 30 35 40 45
1.8 g/cm3
2.0 g/cm3
1.5 g/cm3
600°C
Compressive strain, %
Com
pres
sive
stre
ss, M
Pa
0
5
10
15
20
25
0 5 10 15 20 25 30 35 40 45
2.0 g/cm3
1.8 g/cm3
1.5 g/cm3
1.3 g/cm3
450°C
compressive strain, %
Com
pres
sive
stre
ss, M
Pa
Fig. 6-51 Density dependence of the stress-strain curves of the Astaloy foams,
compressed at different temperatures.

Results & Discussion
105
6.2.2.2.2 Effect of Temperature
Fig. 6-52 represents the effect of the temperature on the stress strain curves of different
densities of the Astaloy foams
0
5
10
15
20
25
0 5 10 15 20 25 30 35 40 45
450°C200°CRT
1.3 g/cm3
Compressive strain, %
Com
pres
sive
stre
ss, M
Pa
0
5
10
15
20
25
0 5 10 15 20 25 30 35 40 45
450°C200°C600°CRT
1.5 g/cm3
Compressive strain, %C
ompr
essi
ve s
tress
, MPa
0
5
10
15
20
25
0 5 10 15 20 25 30 35 40 45
450°C600°C200°CRT
1.8 g/cm3
compressive strain, %
Com
pres
sive
stre
ss, M
Pa
0
5
10
15
20
25
0 5 10 15 20 25 30 35 40 45
450°C200°CRT600°C
2.0 g/cm3
Compressive strain, %
Com
pres
sive
stre
ss, M
Pa
Fig. 6-52 Temperature dependence of stress-strain curves of different densities of Astaloy
foams.
Tab 6-12 gives the compressive strength of the Astaloy foams at 20% strain as a function of
the foam’s density and temperature. It is worth noting that the compressive strength values of
the Astaloy foams at higher temperatures (until 450°C) compared with those at RT are
relatively large, as illustrated in Fig. 6.53. The Astaloy foams begin to soften when the
temperature goes over 450°C. Experiments on low and high alloyed steels revealed that the
presence of molybdenum increases the high temperature strength as well as the creep
resistance of the material. Experiments carried out on Fe-Mo alloys revealed that
molybdenum increases the creep resistance of α-solid solution as well as it decreases the
recrystallisation temperature after cold working. This may explain why Mo-alloyed steels
have better properties than Mo-free steels. In case of steels with low carbon content as well
as low alloying elements, the formation of an intermediate structure (bainite), which has

Results & Discussion
106
better properties than those of perlite as well as martensite, may explain this important role of
molybdenum on the mechanical properties of materials especially at high temperatures
[ARC51].
Like the behaviour of the Distaloy foams compared with that of Alporas foams, the Astaloy
foams have been found to behave in the same manner, as shown in Fig. 6-53, wherein the
compressive strength of Astaloy foams having two different densities 1.5 and 2.0 g/cm3,
respectively as well as of 0.20 g/cm3 Alporas foams was plotted as a function of the
temperature. Alporas foams soften with increasing the test temperature unlike the Astaloy
foams, whose compressive strength increases with the temperature (untill 450°C) and then
decreases with increasing the temperature. As noted above the coarsening of the
precipitates may be the reason for this softening effect in case of Alporas foams.
Compression strength at 20%, MPaDensity, g/cm3
RT 200°C 450°C 600°C1.3 0.7 1.7 1.2 - 2.3 2.9 - -1.5 2.1 2.4 3.2 2.4 3.9 5.0 2.7 -1.8 5.0 5.3 3.4 5.3 6.5 7.3 6.4 9.22.0 8.8 8.8 8.9 8.7 9.2 8.8 4.5 -
Tab. 6-12 Density and temperature dependence of compression strength of the Astaloy
foams
Astaloy
0
2
4
6
8
10
12
14
0 100 200 300 400 500 600 700T, °C
Com
pres
sive
stre
ngth
at 2
0%, M
Pa
Alporas 0.20 g/cm3
1.5 g/cm3
2.0 g/cm3
Fig. 6-53 Compression strength as a function of foam’s density and test temperature.

Results & Discussion
107
6.2.2.2.3 Metallographic Examination
6.2.2.2.3.1 Stereoscopic Examination of the Astaloy Foams
The stereoscopic macrographs of the upper surfaces of the tested Astaloy samples,
Fig. 6-54 to Fig. 6-58, show that some samples have pores of various sizes. Others having
regions, in which a cluster of material is found and the foam looks like to be a compact one.
This may have resulted from the effect of stirring of the mixture during the manufacturing
process. All these factors may be the reasons for that scattering in the obtained results.
2.0 g/cm3
RT-a 200°C-a
450°C-a
600°C-a
RT-b 200°C-b 450°C-b
600°C-b
Fig. 6-54 Stereoscopic macrographs of the Astaloy foams (ρ = 2.0 g/cm3).

Results & Discussion
108
1.9 g/cm3
RT-a 200°C-a 450°C-a 600°C-a
RT-b 200°C-b 450°C-b 600°C-b
Fig. 6-55 Stereoscopic macrographs of the Astaloy foams (ρ = 1.9 g/cm3).
1.8 g/cm3
RT-a 200°C-a 450°C-a 600°C-a
RT-b 200°C-b 450°C-b 600°C-b
Fig. 6-56 Stereoscopic macrographs of the Astaloy foams (ρ = 1.8 g/cm3).

Results & Discussion
109
1.5 g/cm3
RT-a 200°C-a 450°C-a 600°C-a
RT-b 200°C-b 450°C-b 600°C-b
Fig. 6-57 Stereoscopic macrographs of the Astaloy foams (ρ = 1.5 g/cm3).
1.3 g/cm3
RT-a 200°C-a 450°C-a 600°C-a
RT-b 200°C-b 450°C-b 600°C-b
Fig. 6-58 Stereoscopic macrographs of the Astaloy foams (ρ = 1.3 g/cm3).

Results & Discussion
110
6.2.2.2.3.2 Microstructural Examination of the Astaloy Foams
Fig. 6-59 shows the microstructure of deformed Astaloy foams after testing at various
temperatures. It can be observed that the pores having large sizes are not homogeneously
distributed. Some partial connections (sintering bridges) between the powder particles are
also observed. The irregularities of the pore size as well as pore distribution within the foams
influence their mechanical properties.
RT 200°C
450°C 600°C
Fig. 6-59 Microstructure micrographs of the deformed Astaloy foams (ρ = 1.8 g/cm3) at
different test temperatures.
6.2.2.2.4 SEM Characterisation of the Astaloy Foams
An Astaloy sample having a density of 1.8 g/cm3 and compressed at 450°C was taken as an
example for the investigation by means of a scanning electron microscope. Fig. 6-60 shows
a typical irregular morphology of the Astaloy powders. The particles have not completely

Results & Discussion
111
stuck with each other, as for Distaloy. The irregular shapes of Astaloy particles and their
clogged surfaces do not allow the particles to get stuck with each other.
Fig. 6-60 SEM micrograph of an Astaloy foam (ρ= 1.8 g/cm3) compressed at 450°C.

Results & Discussion
112
6.2.3 Comparison between in air- in Ar Compressive Tests
6.2.3.1 Distaloy Foams
Compared with tests conducted in Ar, compression strength values of the Distaloy foams
which were compressed in atmospheric air were enhanced, as illustrated in Fig. 6-61. The
formation of an oxide scale on the surface of the foam affects its mechanical properties and
increases its resistance against corrosion.
0
2
4
6
8
10
12
14
16
0 100 200 300 400 500 600 700 800 900T, °C
Com
pres
sive
stre
ngth
at 2
0%, M
Pa
1.7 g/cm3- in Ar
1.7 g/cm3- in air
Distaloy
Fig. 6-61 Temperature dependence of the compression strength of Distaloy foams
(ρ= 1.7 g/cm3) at 20% strain after testing in air as well as Ar atmosphere.

Results & Discussion
113
6.2.3.2 Astaloy Foams
A similar trend for Astaloy foams having a density of 1.5 g/cm3 was observed, as shown in
Fig. 6-62.
Astaloy
0
2
4
6
8
10
12
14
16
0 100 200 300 400 500 600 700 800 900T, °C
Com
pres
sive
stre
ngth
at 2
0%, M
Pa
1.5 g/cm3-in Ar
1.5 g/cm3-in air
Fig. 6-62 Temperature dependence of the compression strength of the Astaloy foams
(ρ=1.5 g/cm3) at 20% strain after testing in air as well as Ar atmosphere.
It is clearly noticeable from the last two figures, that the compressive strength of the Distaloy
foams is larger than that of the Astaloy foams in both test conditions, namely air and Ar
atmospheres, respectively. An explanation for this discrepancy may be due to the effect of
the alloying elements, where it was found that the presence of Cu as an alloying element in
the chemical composition of Distaloy powders increases the corrosion resistance of the
material by means of building-up a thick oxide scale on the surface of the material [VAY97].Another explanation that may clarify the behaviour of both foams upon high temperature
compression may explained by the difference in the particle morphology of the two powders.
To clarify this cause, a set of metallographical as well as SEM examinations has been
carried out on samples of Distaloy and Astaloy foams in the green state as well as after
sintering. The chemical composition of these samples is given in Tab. 6-13

Results & Discussion
114
Sample No. Material Added amount of
H2O (g)
Added amount of
H3PO4(g)
Added amount of
SiO2 (g)1123 Astaloy 17.0 1.0 2.01124 Astaloy 17.0 1.5 2.01125 Astaloy 17.0 2.0 2.01126 Astaloy 17.0 2.5 2.01127 Astaloy 17.0 3.0 2.01128 Astaloy 19.0 1.0 2.01129 Astaloy 19.0 1.5 2.01130 Astaloy 19.0 2.0 2.01131 Astaloy 19.0 2.5 2.01132 Astaloy 19.0 3.0 2.01133 Astaloy 22.0 1.0 2.01134 Astaloy 22.0 1.5 2.01135 Astaloy 22.0 2.0 2.01136 Astaloy 22.0 2.5 2.01137 Astaloy 22.0 3.0 2.01138 Distaloy 16.0 1.0 2.01139 Distaloy 16.0 1.5 2.01140 Distaloy 16.0 2.0 2.01141 Distaloy 16.0 2.5 2.01142 Distaloy 16.0 3.0 2.01143 Distaloy 18.0 1.0 2.01144 Distaloy 18.0 1.5 2.01145 Distaloy 18.0 2.0 2.01146 Distaloy 18.0 2.5 2.01147 Distaloy 18.0 3.0 2.01148 Distaloy 21.0 1.0 2.01149 Distaloy 21.0 1.5 2.01150 Distaloy 21.0 2.0 2.01151 Distaloy 21.0 2.5 2.01152 Distaloy 21.0 3.0 2.0
Tab. 6-13 Composition of Distaloy and Astaloy foams used for metallographical and
SEM examinations.
Considering the microstructural micrographs of the Distaloy as well as the Astaloy foams,
Fig. 6-63 to Fig. 6-66, it can be seen that the particles of the Distaloy samples are existing in
round forms, compared to the irregular shapes of Astaloy one. In the green state, a loose-
powdered structure was observed in case of the Distaloy as well as the Astaloy foams
respectively. In the sintered state, however, the particles became closer to each other and
necking (sintering bridges) have been observed. After sintering the cell walls have been
compacted as well. The cell structure of the Distaloy powders seems to be more
homogeneous than that of Astaloy one. Astaloy samples have a thick-walled cell structure,
i.e. large pores and isolated particles are dominant within the structure. Some large pores
were found locally in certain sites beside other small pores. This difference in pore sizes as
well as pore distribution within the foams has certainly a significant influence on their
mechanical properties. Large pores will lead to poor mechanical properties. A sign for foams’
irregularity can be immediately observed with the necked eye upon detecting the upper
surfaces of the samples (stereoscopic micrographs).
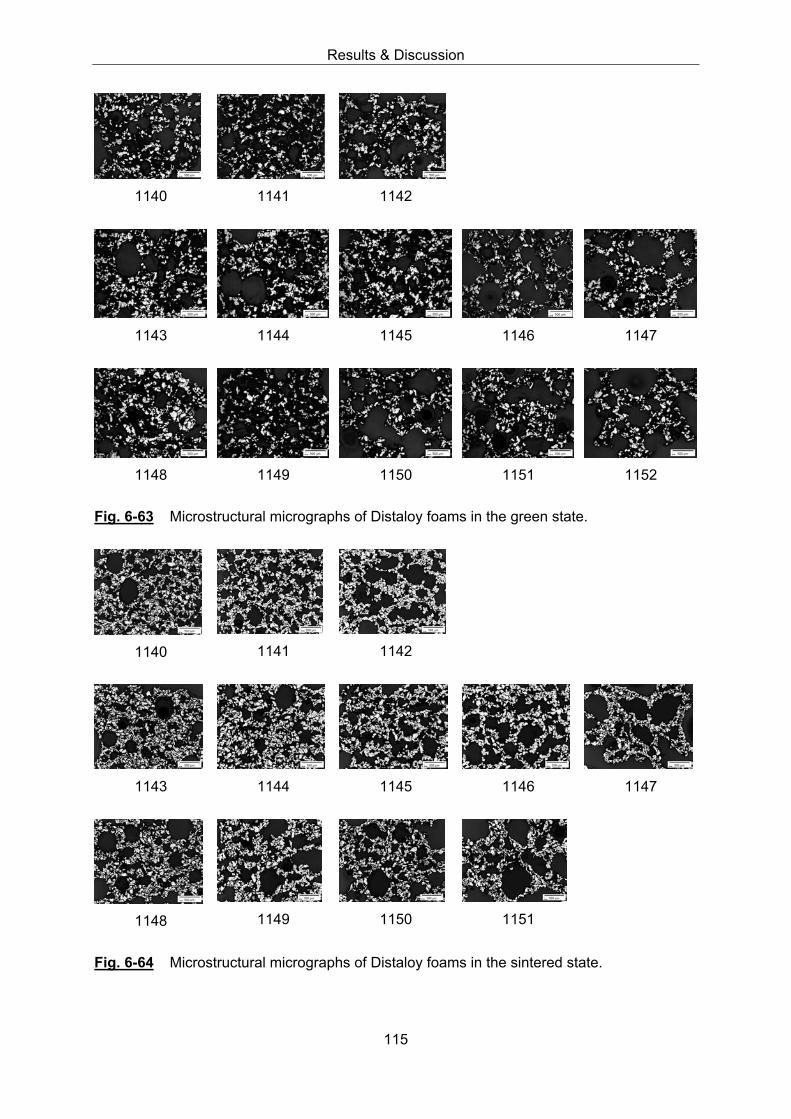
Results & Discussion
115
1140 1141 1142
1143 1144 1145 1146 1147
1148 1149 1150 1151 1152
Fig. 6-63 Microstructural micrographs of Distaloy foams in the green state.
1140 1141 1142
1143 1144 1145 1146 1147
1148 1149 1150 1151
Fig. 6-64 Microstructural micrographs of Distaloy foams in the sintered state.

Results & Discussion
116
1123 1124 1125 1126 1127
1128 1129 1130 1131 1132
1133 1134 1135 1136 1137
Fig. 6-65 Microstructural micrographs of Astaloy foams in the green state.
1123 1124 1125 1126 1127
1129 1130 1131 1132
1133 1134 1135 1136 1137
Fig. 6-66 Microstructural micrographs of Astaloy foams in the sintered state.

Results & Discussion
117
Considering the SEM-micrographs of the Distaloy as well as the Astaloy foams in the green
and in the sintered state as well, shown in Fig. 6-67 to Fig. 6-70, it can be seen that both
foams in the green state have had a characteristic foamy structure. Post-sintering SEM-
micrographs of Distaloy and Astaloy foams show a larger number of micro-pores than that
existing in green state. The number written beneath each micrograph indicates the sample
number. Via this number, the chemical composition of each sample can be easily known by
referring to Tab. 6-13.
1143 1144 1145 1146 1147
Fig. 6-67 SEM-micrographs of Distaloy foams in the green state.
1128 1129 1130 1131 1132
Fig. 6-68 SEM-micrographs of Astaloy foams in the green state.
1143 1144 1145 1146 1148
Fig. 6-69 SEM-micrographs of Distaloy foams in the sintered state.
1129 1130 1131 1132
Fig. 6-70 SEM-micrographs of Astaloy foams in the sintered state.

Results & Discussion
118
6.2.4 Size Effect on the Foams’ Mechanical Properties
A new set of experiments was carried out on large samples of Astaloy foams consisting of
several thousand cells. The samples have a cross sectional area of 50 x 50 mm2.
A thermocouple type S (Pt-Pt Rh 10%) is conducted to the sample in three positions in order
to monitor accurately the temperature of the sample, as shown in Fig. 6-71. The difference
between the nominal as well as the measured temperature was found to be ±10°C, as shown
in Fig. 6-72. The samples were compressed under the same conditions like the small ones,
i.e. at a constant rate of displacement of 1 mm/min. After reaching the required test
temperature, the samples were held at this temperature for approximately 1 min in order to
achieve a homogeneous temperature distribution throughout the sample.
Thermocouple 2
Thermocouple 1
Thermocouple 3
50mm
20mm
50mm
Fig. 6-71 A schematic illustration of three thermocouples conducted to a foam sample
having a cross sectional area of 50 x 50 mm2.

Results & Discussion
119
0
100
200
300
400
500
600
0 200 400 600 800 1000 1200Time, s
Tem
pera
ture
, °C
(3)
(2)
(1)
Nominal temperature (N)Thermocouple (1)Thermocouple (2)Thermocouple (3)
(N)
Fig. 6-72 Temperature monitoring in a foam sample using three different thermocouples.
Two different densities of Astaloy foams, namely 1.5 and 1.9 g/cm3, respectively, were
compressed in an inert atmosphere (Ar) at various temperatures. The compression strength
at 20% was measured at the correspondent testing temperature and listed in Tab. 6-13.
Compression strength at 20%, MPaDensity, g/cm3
25°C 200°C 450°C 600°C1.5 3.3 4.8 4.1 8.1 5.2 9.1 5.0 7.61.9 9.6 10.9 12.1 7.4 12.7 12.0 11.9 8.5
Tab.6-13 compression strength at 20% for large samples of Astaloy foams as a function of
temperature.

Results & Discussion
120
Astaloy
0.0
2.0
4.0
6.0
8.0
10.0
12.0
14.0
16.0
0 100 200 300 400 500 600 700T, °C
Com
pres
sive
stre
ngth
at 2
0%, M
Pa1.5 g/cc-test 11.5 g/cc-test 21.9 g/cc-test 11.9 g/cc-test 2
Fig. 6-73 Temperature dependence of compressive strength (mean value) of large
samples of Astaloy foams (ρ= 1.5 and 1.9 g/cm3) having a cross sectional area of
50 x 50 mm2 (after compression in Ar-atmosphere).
As clearly shown from the past results, listed in Tab. 6-13 and represented in Fig. 6-73, the
dependence of the compressive strength of the Astaloy foams, having large cross sectional
area, and consequently large number of cells, on the temperature is similar to that of small
ones.
6.2.5 Strain Rate Dependence of the Foam’s Mechanical Properties
In order to examine the effect of the dynamic age hardening, a new set of compressive tests
was carried out on samples of Astaloy (1.5 g/cm3) as well as Distaloy (1.9 g/cm3) foams
having a cross sectional area of 50 x 50 mm2 by using the Schenck equipment with a
maximum load cell of 160 kN. The tests were carried out at the same conditions but the
difference here is that the specimens were deformed under high strain rate. The tests were
performed at a fixed rate of displacement of 100 mm/min.
It can be seen from Fig. 6-74 that the metallic foams show, at higher temperatures, the same
behaviour like that of the compact materials. As the temperature increases, the compressive
strength of the foams decreases. This degrading in the foam’s mechanical properties may be
regarded to the softening mechanisms (recovery and recrystallisation) taking place during
the high temperature testing. The disappearance of the ascending compressive strength of

Results & Discussion
121
the foams at 200°C as well as 450°C, respectively indicates clearly that the mechanical
properties of Distaloy as well as Astaloy foams are strongly dependant on the rate of strain at
which the test was carried out and this ensures the assumption that the reason for the
enhancement within the foam’s mechanical properties which have been deformed at
1 mm/min over this range of temperature was because of the well-known phenomenon “age-
hardening” [MEM89].
0.0
2.0
4.0
6.0
8.0
10.0
12.0
14.0
16.0
0 100 200 300 400 500 600 700Temperature, °C
Com
pres
sive
stre
ngth
at 2
0%, M
Pa
1.5 g/cm3 Astaloy
1.6 g/cm3 Distaloy
Fig. 6-74 Temperature dependence of the compressive strength of Astaloy and Distaloy
foams (50 x 50 mm2) after compressive testing in Ar atmosphere at 100 mm/min.
6.2.6 DTA Measurement
In order to have an insight on the thermal events taking place upon heating during the high
temperature compression tests, a sample of Distaloy foam (250 mg) was investigated by
means of a Differential Thermal Analysis (DTA). A device Netzsch 404 S, shown in
Fig. 5-12, was used to measure the temperature difference between a reference material
(Al2O3) and the material which has to be investigated, as described in the past chapter.
200 mg of a Distaloy foam has to be finely ground so as to guarantee a homogeneous
distribution over the entire crucible and accurate measurements are thus obtained. The
sample was heated with a rate of heating of 10 K/min.
Fig. 6-75 shows the results obtained from DTA measurements for Distaloy foam as well as
the Distaloy powder (as delivered), respectively. DTA measurements were carried out for

Results & Discussion
122
powder, which is previously melted, cooled and then reheated, and for another one which
was only heated, i.e. without any previous melting. It can be seen that the powder in both
cases has almost the same behaviour. Compared to the powder, the powderdised foam
sample exhibited a completely different behaviour. It can be observed that an endothermic
reaction takes place upon heating the foam sample. The reaction starts at approximately
210°C and ends at approximately 470°C. The phase transformations occurring over this
range of temperature are still unclear so far, but it has been supposed to be due to the
decomposition of H3PO4, involved in the foam processing, which starts at approximately
213°C. This probably represents another interpretation for this enhancement within the
compressive strength of the foams measured over this range of temperature.
-4.5
-4.0
-3.5
-3.0
-2.5
-2.0
-1.5
-1.0
-0.5
0.0
0 100 200 300 400 500 600 700 800 900Temperature, °C
DTA
/(mW
/mg)
Powderdised foam (only heating)
Powder (after melting, cooling and reheating)
Powder (only heating)
Fig. 6-75 DSC scans for samples of Distaloy powder and Distaloy foam as well.
6.2.7 X-ray Spectrometer
A set of experiments was carried out at the Department of Glass, Ceramics and Builiding
materials (GHI, RWTH-Aachen) using a Philips PW 1830 X-ray powder spectrometer device.
This device aims at measuring the intensity of the X-ray reflections from a crystal with an
electronic device, such as a Geiger counter tube. The measurements were carried out at
a constant rate of 0.005 s-1 in a 2θ range from 5 up to 70°.
Two samples of Distaloy as well as Astaloy foams were finely ground into powders. These
fine powders were characterised using the X-ray spectrometer. The reflected intensity is
recorded as a function of 2θ (Bragg angle) as shown in Fig. 6-76 and Fig. 6-77, respectively.

Results & Discussion
123
The presence of the Bragg diffraction peaks, appeared in the two diffraction diagrams,
indicates that the structure of the Distaloy as well as Astaloy foams is pure crystalline.
Fe
Fe
Fig.6-76 X-ray diffraction diagram of Distaloy sample.
Fe
Fe
Fig.6-77 X-ray diffraction diagram of Astaloy sample.
6.2.8 Line Scan Analysis
A line scan analysis was carried out at the Central Facility of Electron Microscopy (GFE),
RWTH Aachen using an electron microprobe (Camebax SX 50) equipped with wavelength
dispersive spectrometers. This kind of investigation aims at determining the quantitative
distribution of the elements over the microstructure of the foam.

Results & Discussion
124
Fig. 6-78 shows Element X-ray Mapping micrographs of a cell-wall microstructure of Distaloy
foam in the sintered state. It is clearly visible that the contact areas between the iron particles
are enriched with Si, P and O atoms. The diffusion of phosphorous atoms between the iron
particles indicates that H3PO4 has wetted all the iron particles, i.e. H3PO4 has good wetting
properties.
Fig. 6-78 Element X-ray Mapping micrographs for a cell-wall microstructure of Distaloy
foam.
Considering for example a section in the cell-wall microstructure, as shown in Fig. 6-79a, the
quantitative line scan measurements related to this section is illustrated in Fig. 6-79b. It is
obviously shown that Fe, Mg, Si, Mn and P form certain types of ceramic oxides or glass
phase consisting of the oxides of the past mentioned elements. The smoothing effect caused
by glass solder results in an enhancement within the mechanical properties of SRFS foams
upon heating until the softening temperature of this glass phase is reached [ALYxx].

Results & Discussion
125
Line scantraces
(a)
0
5
10
15
20
25
30
35
40
0 1 2 3 4 5 6 7 8 9 10 11 12 13 14 15 16Distance, µm
Mas
s co
nten
t, %
Fe
O
Mg
Si
MnP
(b)
Fig. 6-79 Quantitative line scan measurements.

Results & Discussion
126
6.3 Creep Test
Because of the high melting points of metallic foams in comparison to polymer foams,
metallic foams can be utilised in high temperature applications as heat exchangers or heat
sinks in electronic devices. If the temperature exceeds 0.3*Tm, a time-dependent creep
deformation takes place. This is of great importance particularly for such components that
carry loads for prolonged times.
Since the biaxial testing machine, Fig. 5-11, at the Department of Material Science (LFW) is
not equipped with a set-up which enables us to carry out tests in an inert atmosphere, the
compressive creep tests were carried out only on Alporas foams in normal air in a range of
temperatures and applied stresses regardless the formation of an oxide scale on the surface
of foams. The tested samples were of dimensions 45 x 45 x 20 mm3. The tests were carried
out in atmospheric air since the thickness of the oxide scale covering pure Al is around 5 nm
thick and it is not expected that the formation of an oxide scale having such thickness affects
the foam deformation [DES03]. The effect of the foam’s density, the test temperature as well
as the applied stress on the creep behaviour of the Alporas foams was examined. Each
parameter’s influence was studied and will be discussed in the following section.
6.3.1 Creep of Alporas
6.3.1.1 Effect of Density
In order to gain information about the influence of the foam’s density upon the foam’s
behaviour during creep test, a set of compressive creep experiments at a constant stress of
approximately 0.6 MPa and at 300°C was performed on samples of Alporas foams with
different densities, ranging from 0.25 g/cm3 up to 0.32 g/cm3.
Typical creep curves, with the well- known primary, secondary and tertiary creep regimes
were obtained, as depicted in Fig. 6-80. The shape of the curve of the creep rate versus
strain plot is similar to that obtained by Zhang et al. [ZHA02] and Andrews et al.
[AND99a, b]. In the primary creep regime, the creep rate decreased over a period of time
until the minimum creep rate was reached. In the secondary creep regime, the creep rate
increased to a maximum value with increasing the strain. According to Andrews et al., the
occurrence of such a peak is associated with the formation of a crush band in which the cells
collapse quickly while the material outside the band appears to creep in a steady fashion
[ZHA02]. The tertiary creep is terminated by rupture. Various plots, strain versus time, creep
rate versus strain and creep rate versus time, for different densities of Alporas foams are
illustrated in Fig. 6-80 to Fig. 6-83.

Results & Discussion
127
0.25 g/cm3
10-3
10-2
10-1
100
0 5 10 15 20
0.6 MPaT = 300°C
Time t; h
Cre
ep ra
te d
ε/dt;
h-1
0
5
10
15
20
25
0 5 10 15 20
0.6 MPa
T = 300°C
Time t; h
Stra
in ε;
%
10-3
10-2
10-1
100
0 5 10 15 20 25
0.6 MPa
T = 300°C
Strain ε; %
Cre
ep ra
te d
ε/dt;
h-1
Fig. 6-80 Creep behaviour of Alporas foams having a density of 0.25 g/cm3.
0.27 g/cm3
0
0.05
0.10
0.15
0.20
0 10 20 30 40 50
0.6 MPaT =300°C
Time t, h
Stra
in ε
10-3
2x10⁻³
5x10⁻³
10-2
0 2 4 6 8 10
0.6 MPa
T =300°C
Strain ε; %
Cre
ep ra
te d
ε/dt
, h-1
10-3
2x10⁻³
5x10⁻³
10-2
0 10 20 30 40 50
0.6 MPaT =300°C
Time t, h
Cre
ep ra
te d
ε/dt
, h-1
Fig. 6-81 Creep behaviour of Alporas foams having a density of 0.27 g/cm3.

Results & Discussion
128
0.30 g/cm3
10-4
10-3
10-2
10-1
100
0 20 40 60 80 100
0.6 MPa
T = 300°C
Time t, h
Cre
ep ra
te d
ε/dt,
h-1
0
5
10
15
20
25
30
0 20 40 60 80 100
0.6 MPa
T = 300°C
Time t; h
Stra
in ε;
%
10-4
10-3
10-2
10-1
100
0 5 10 15 20 25 30
0.6 MPa
T = 300°C
Strain ε; %
Cre
ep ra
te d
ε/dt
, h-1
Fig. 6-82 Creep behaviour of Alporas foams having a density of 0.30 g/cm3.
0.32 g/cm3
0
5
10
15
20
0 20 40 60 80 100 120
0.6 MPaT = 300°C
Time t; h
Stra
in ε;
%
10-4
10-3
10-2
10-1
0 5 10 15 20
0.6 MPa
T = 300°C
Strain ε; %
Cre
ep ra
te d
ε/dt,
h-1
10-4
10-3
10-2
10-1
0 20 40 60 80 100 120
0.6 MPa
T = 300°C
Time t, h
Cre
ep ra
te d
ε/dt,
h-1
Fig. 6-83 Creep behaviour of Alporas foams having a density of 0.32 g/cm3.

Results & Discussion
129
Fig. 6-84 summarises the effect of the foam’s density on the compressive creep behaviour of
the Alporas foams. The increase in the foam’s density leads to a higher resistance of the
material to creep and consequently to fracture. Time of rupture varies from as short as 1 hour
to as long as 80 hours.
0
5
10
15
20
25
30
35
40
0 20 40 60 80 100 120
0.25 g/cm3
0.27 g/cm3
0.3 g/cm3
0.32 g/cm3
time of rupture tr
T = 300°Cσ = 0.6 MPa
Time t, h
Stra
in ε
, %
Fig. 6-84 Density dependence of strain-time curves of Alporas foams.
6.3.1.2 Effect of Stress
A set of creep experiments was carried out on Alporas foams of a certain density under
different applied stresses in order to study the influence of the stress on the creep behaviour.
Typical creep curves were obtained, Fig. 6-85. It can be clearly noticed that with decreasing
applied stress on the foam, a longer life- time is achieved. A higher creep strain rate was
achieved with increasing the applied stress. This increase within the creep strain rate
corresponds to the collapse of a layer of cells and the formation of crush band [AND99b].

Results & Discussion
130
0
5
10
15
20
25
30
0 20 40 60 80
0.5 MPa0.4 MPa0.3 MPa
T = 300°Cρ = 0.24 g/cm3
Time t, h
Stra
in ε,
%
Fig. 6-85 Influence of the stress on the creep of the Alporas foams.
6.3.1.3 Effect of Temperature
Alporas samples having a density of 0.24 g/cm3 have been undergone creep tests at
different temperatures and under an applied stress which was fixed at approximately
0.6 MPa. Fig. 6-86 to Fig. 6-88 represents the strain-time curves at temperatures of 275°C,
325°C and 350°C respectively.
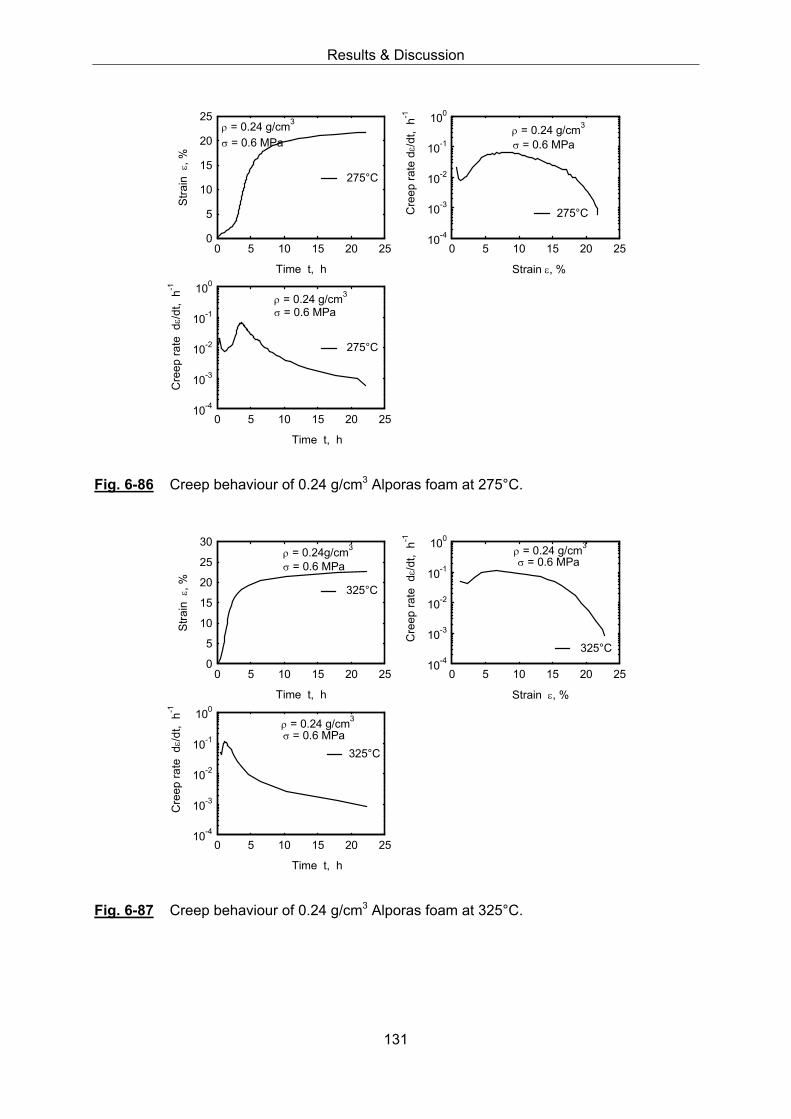
Results & Discussion
131
10-4
10-3
10-2
10-1
100
0 5 10 15 20 25
275°C
σ = 0.6 MPaρ = 0.24 g/cm3
Time t, h
C
reep
rate
dε/d
t, h
-1
0
5
10
15
20
25
0 5 10 15 20 25
275°C
σ = 0.6 MPaρ = 0.24 g/cm3
Time t, h
Stra
in ε
, %
10-4
10-3
10-2
10-1
100
0 5 10 15 20 25
275°C
σ = 0.6 MPaρ = 0.24 g/cm3
Strain ε, %
Cre
ep ra
te d
ε/dt,
h-1
Fig. 6-86 Creep behaviour of 0.24 g/cm3 Alporas foam at 275°C.
10-4
10-3
10-2
10-1
100
0 5 10 15 20 25
325°Cσ = 0.6 MPaρ = 0.24 g/cm3
Time t, h
Cre
ep ra
te d
ε/dt
, h-1
0
5
10
15
20
25
30
0 5 10 15 20 25
325°C
σ = 0.6 MPa ρ = 0.24g/cm3
Time t, h
Stra
in ε
, %
10-4
10-3
10-2
10-1
100
0 5 10 15 20 25
325°C
σ = 0.6 MPa ρ = 0.24 g/cm3
Strain ε, %
Cre
ep ra
te d
ε/dt,
h-1
Fig. 6-87 Creep behaviour of 0.24 g/cm3 Alporas foam at 325°C.
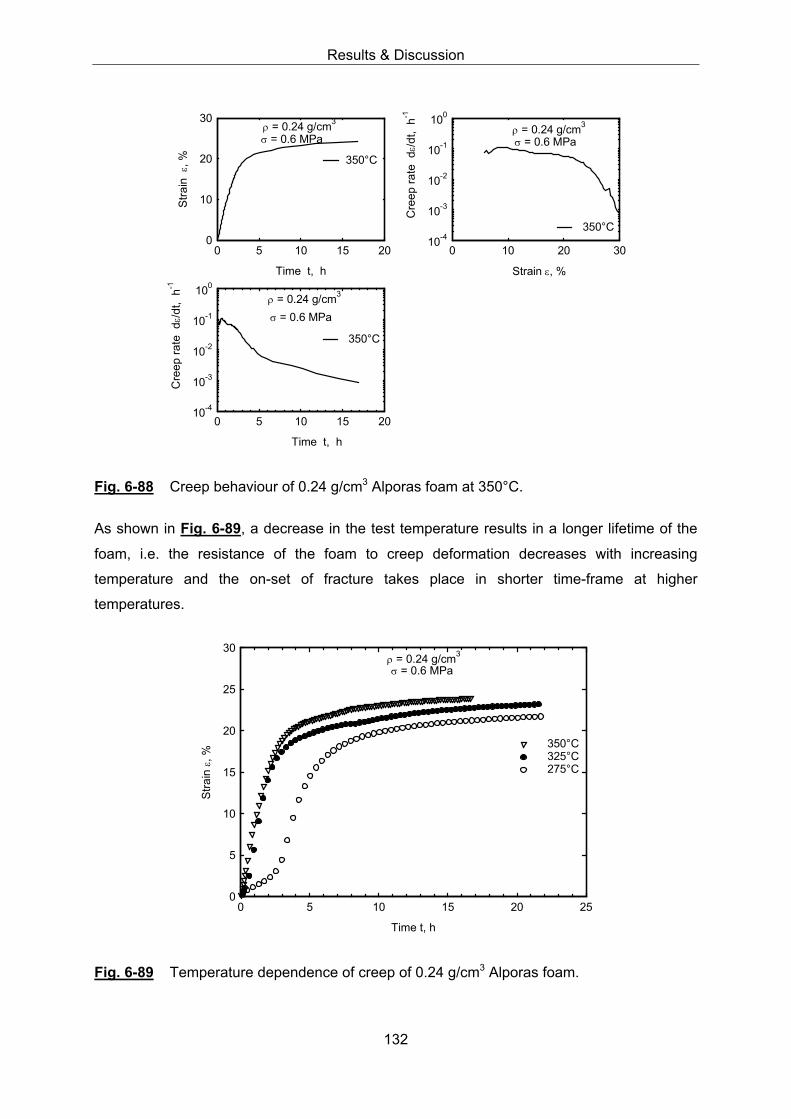
Results & Discussion
132
0
10
20
30
0 5 10 15 20
350°C
σ = 0.6 MPaρ = 0.24 g/cm3
Time t, h
Stra
in ε
, %
10-4
10-3
10-2
10-1
100
0 5 10 15 20
350°C
σ = 0.6 MPaρ = 0.24 g/cm3
Time t, h
Cre
ep ra
te d
ε/dt
, h-1
10-4
10-3
10-2
10-1
100
0 10 20 30
350°C
σ = 0.6 MPaρ = 0.24 g/cm3
Strain ε, %
Cre
ep ra
te d
ε/dt,
h-1
Fig. 6-88 Creep behaviour of 0.24 g/cm3 Alporas foam at 350°C.
As shown in Fig. 6-89, a decrease in the test temperature results in a longer lifetime of the
foam, i.e. the resistance of the foam to creep deformation decreases with increasing
temperature and the on-set of fracture takes place in shorter time-frame at higher
temperatures.
0
5
10
15
20
25
30
0 5 10 15 20 25
350°C325°C275°C
ρ = 0.24 g/cm3
σ = 0.6 MPa
Time t, h
Stra
in ε,
%
Fig. 6-89 Temperature dependence of creep of 0.24 g/cm3 Alporas foam.

Results & Discussion
133
In an attempt to determine the activation energy, described by equation 3-9, strain rate
against inverse of temperature is plotted in Fig. 6-90 for Alporas foams (0.24 g/cm3) which
have been undergone compressive creep tests at a constant stress of 0.6 MPa. An activation
energy of about 100 kJ/mole is obtained. Andrews et al. [AND99b] found the activation
energy to be about 62.4 kJ/mole. An activation energy of slightly above 71 kJ/mole between
260°C and 350°C was expected [AND99b]. The activation energy of the solid material
making up the foams is about 140 kJ/mole. The obtained results showed that Alporas foams
have attained an activation energy which is rather equal to that of the solid material making
up the foams.
0.00E+00
2.00E-06
4.00E-06
6.00E-06
8.00E-06
1.00E-05
1.20E-05
1.40E-05
1.60E-05
1.80E-05
2.00E-05
0.0016 0.00165 0.0017 0.00175 0.0018 0.00185 0.0019 0.001951/T, K
Stra
in ra
te, s
-1
Q= 97.7 kJ/mole
Fig. 6-90 strain rate plotted against inverse of temperature for Alporas foams
(ρ = 0.24 g/cm3) at a constant stress of 0.6 MPa.
6.3.1.4 Microstructural Examination
Fig. 6-91 shows cell wall microstructures of 0.24 g/cm3 deformed Alporas samples under
a constant stress of 0.6 MPa and at different temperatures. The cell-wall consists of granular
microstructure with a grain size of several hundreds of micrometers. The small and large
holes were produced during the manufacturing process. Bending of cell walls indicate that
they have been strongly deformed.

Results & Discussion
134
250°C 275°C
300°C 325°C
350°C
Fig. 6-91 Cell wall microstructure of Alporas foams (ρ = 0.24 g/cm3) after compressive
creep deformation at different test temperatures (σ= 0.6 MPa).

Summary & Outlook
135
7 Summary & Outlook
The present work has aimed to characterise the mechanical properties of different types of
foams at high temperatures. for this goal, three different types of foams have been used.
AlCaTi foams (trade-name ALPORAS) were processed by a casting technique and they were
delivered by the company Shinko Wire Co. Ltd. in Japan. The other two types of foams are
made from low-alloyed steel powders having different chemical compositions, Distaloy SA
with small traces of copper as well as nickel and Astaloy Mo with molybdenum. The powders
were delivered by the company Höganäs AB, Sweden. Distaloy and Astaloy foams were
manufactured at the Department of Ferrous Metallurgy (IEHK), RWTH Aachen University, by
means of a powder metallurgical route. The developed method is known as Slip Reaction
Foam Sintering process (SRFS). In this process, a certain amount of powder is mixed with
a dispersant SiO2. Water which acts as a solvent is added to the mixture in order to make
a slip. Afterwards a binder, ortho-phosphoric acid H3PO4, is then added. A chemical reaction
takes place between the metal powder and acid resulting in H2 bubbles, which are the main
cause for foaming process. The slip is then poured in a form and dried at RT for 24h. The
green samples are then obtained. The surfaces of the samples are removed by using
a sawing machine and the samples are then introduced into a tube-type furnace, in which
they undergo a sintering process under reductive atmosphere. After sintering, the samples
become more strength due to the formation of metallic bonds. Samples are then ready to be
handled and examined.
High temperature compressive tests were performed on the above mentioned types of
foams, namely Alporas, Distaloy as well as Astaloy foams. The tests were conducted at
various temperatures (up to 620°C in case the of Alporas foams, and 800°C for the low-alloy
steel foams, Distaloy and Astaloy). Several parameters were varied, e.g. the testing medium
(air, Ar), foam’s density, testing temperature, loading velocity as well as the applied stress.
The influence of each variable upon the behaviour of the metallic foams was studied.
Typical compressive stress-strain curves were obtained. Like that of compact materials, the
compressive stress-strain curves consist of three different regions. A linear elastic regime,
which ends with the maximum compressive strength, before the curve changes its direction
to the plateau regime. This regime is of great importance, especially for design engineers,
because the amount of the absorbed energy by the foam is related to this region. The last
region, which is called the densification region, is featured by an increase of the stress level
due to the collapse of the cell walls and faces touching each other, i.e. the foam becomes
more dense- like a compact metal.

Summary & Outlook
136
The mechanical properties of (SRFS) foams are strongly dependent upon many parameters
e.g. particle shape, foam’s density, test temperature, pore size, pore size distribution, cell
wall thickness as well as the sintered contact areas between the particles (secondary pores).
Compared with particles of irregular shapes, round particles provide good mechanical
properties.
With increasing the foam’s density, the compressive strength of the foam increases, the
magnitude of the plateau strength also increases. The length of the plateau depends upon
the foam’s density as well. Foam with a low density is characterised by its long and flat
plateau. Foams having higher densities collapse more quickly than that of lower ones. This
means that foams with low densities are more suitable for energy absorption applications
than that of high densities. A similar effect of the foam’s density on the mechanical properties
of the (SRFS) foams was obtained upon testing them in an inert atmosphere.
As with the foam’s density, the mechanical properties of the (SRFS) foams were affected by
the test temperature, however, here the trend is reversed. A foam with a higher compressive
strength (and therefore, a higher magnitude of plateau stress) was obtained by decreasing
the test temperature. It was also found that the length of the plateau was affected by the test
temperature. A more decrease of test temperature, resulted in a longer plateau.
Compared with the compressive strength of the Astaloy and Distaloy foams at room
temperature, their compressive strengths at 200°C and 450°C were found to be a little bit
larger. An explanation for this increase is probably due to the well-known phenomenon
“ageing effect” caused by the C-element over this temperature range. The strain rate
dependence of the foam’s compressive strength shows that Distaloy as well as Astaloy
foams exhibit no enhancement within its compressive strength over this range of
temperature, which ensures strongly the assumption that the reason for the obtained
increase within the mechanical properties was the “ age hardening effect” [ALYxx].
The presence of certain alloying elements e.g. molybdenum as well as copper increase the
high temperature strength in this range of temperature [ARC51]. Another explanation for this
enhancement in the compression strength of the foams with increasing the temperature may
be due to the presence of a mixture of ceramic oxides- glass phase- consisting of FeO, MgO,
MnO, SiO2 and P2O5 found in the contact areas between the iron particles. The smoothing
effect caused by glass solder results in an enhancement within the mechanical properties of
SRFS processed foams upon heating until the softening temperature of this glass phase is
reached.

Summary & Outlook
137
The large scatter in the obtained results may be due to the density gradients within the
structure, since there is no exact method to guarantee the production of a metallic foam with
a homogeneous density distribution.
The examination the cell-wall microstructure of the deformed ALPORAS samples indicated
that the buckling of the cell walls was the main deformation mechanism at each test
temperature.
The microstructure micrographs of the Distaloy as well as Astaloy foams show that the
porosity of the samples increased with increasing test temperature.
The compression strength values of the Distaloy as well as Astaloy foams which have been
compressed in atmospheric air are large compared with those compressed in argon. An
oxide scale of varying thicknesses built-up on the surface of the foams tested in atmospheric
air. This scale acts as a protective layer from further oxidation and makes the base material
more stable [SIM02]. The thickness of the built scale at the edge of the sample is larger than
that formed at the middle of the sample. Compared with the oxide scales formed on the
surfaces of the Astaloy foams, the Distaloy foams have thicker scales. This may be due to
the difference in chemical composition, where the presence of Cu in concentrations over
0.25 wt% increases the corrosion resistance of the material [VAY97]. Molybdenum as well
as phosphorus has also been found to have a positive effect in increasing the corrosion
resistance of the material [HOU00].
Increasing the thickness of the oxide scale makes it mechanically unstable. The reason for
this is the building of internal stresses, which become larger during the growth of the
thickness of the oxide [SCH91]. If the oxide thickness exceeds a specified critical value, the
growing stresses at the metal/oxide surfaces lead to build large normal stresses, which result
in exceeding the adhesion forces of the oxide layer and thus results in delamination of the
oxide layer [LEY97].
The micrographs of the fractured surfaces of the tested samples have shown that the failure
of the foams resulted from the initiation of cracks which further propagate through the whole
structure.
Using the metal foams as load carriers over long periods at applied temperatures larger than
0.3 of their melting points, a time-dependant creep deformation takes place. The creep tests
were carried out for Alporas foams having different densities in temperature range between
250°C-350°C and under different stresses from 0.2 MPa to 0.6 MPa, respectively.
A foam with a larger density exhibits more resistance against creep, i.e. the higher the

Summary & Outlook
138
density of the foam, the larger the time needed to fracture. On the other hand, when the foam
is subjected to large stresses, it fails relatively quickly. Higher temperatures have a similar
effect as that of stress upon the metallic foams. With increasing temperature, the strain-time
curves are shifted to shorter times.
The Alporas foams deformed by bending their cell-walls when subjecting to creep
deformation at different temperatures.
The results indicated also that the Alporas foams are insensitive to large deformation
velocities. The difference in the stress-strain response at different strain rates was not large.
Outlook
The results obtained at the end of this work from the quantitative line scan analysis opened
the door for more questions which require further deep investigation for better understanding.
One of the most interesting points, which should be studied later, is the effect of SiO2, H3PO4
on the mechanical properties of (SRFS) foams. Foams having various amounts of SiO2 and
H3PO4 have to be compressed at elevated temperatures.
If we consider again the ageing phenomenon, further tests should be carried out under high
strain rates because it may also share in finding a good interpretation for the effect of the test
temperature on the mechanical properties of foams.

Kurzfassung & Abstract
139
8 Kurzfassung & Abstract
In dieser Arbeit werden die mechanischen Eigenschaften verschiedener metallischer
Schäume bei erhöhten Temperaturen charakterisiert. Die untersuchten Schäume wurden
mittels zweier unterschiedlicher Methoden hergestellt. Alporas Schäume wurden durch ein
schmelzmetallurgisches Verfahren hergestellt, während die auf niedriglegierten Stahlpulvern
basierenden Distaloy- bzw. Astaloy-Schäume unter Anwendung einer neu entwickelten
Methode erzeugt wurden. Diese Methode, das SchlickerReaktionSchaumSinter (SRSS)-
Verfahren, gehört zu den pulvermetallurgischen Verfahren.
An proben dieser Schäume wurden Hochtemperaturdruckversuche in normaler Atmosphäre
sowie unter Argonatmosphäre durchgeführt. Die mechanischen Eigenschaften wurden in
Abhängigkeit von Dichte, Temperatur, Probengröße und Dehngeschwindigkeit ermittelt.
Zusätzlich wurden Alporas-Schäume Kriecheversuchen unterzogen. Dabei wurde die
Abhängigkeit der mechanischen Eigenschaften von Dichte, Temperatur sowie Spannung
ermittelt.
This work deals with studying the high temperature mechanical properties of different types
of metallic foams. The foams which have been used in this work were manufactured by two
different processing methods. Al-foams (trade-name Alporas) were processed by a melt
metallurgical route whereas Distaloy as well as Astaloy foams which are based on low-
alloyed steel powders, were manufactured by a newly developed method. This method which
is known as Slip Reaction Foam Sintering (SRFS)-process, belongs to the powder
metallurgical route.
High temperature compressive tests were carried out, in air as well as in argon, on foams
having different densities in a variable range of temperature. The effect of the foam density,
test temperature, size of the specimen as well as the strain rate on the mechanical properties
was studied. Moreover, Alporas foams have been undergone creep tests in air. The effect of
the foam density, test temperature and the applied stress on determining the creep
properties was studied as well.
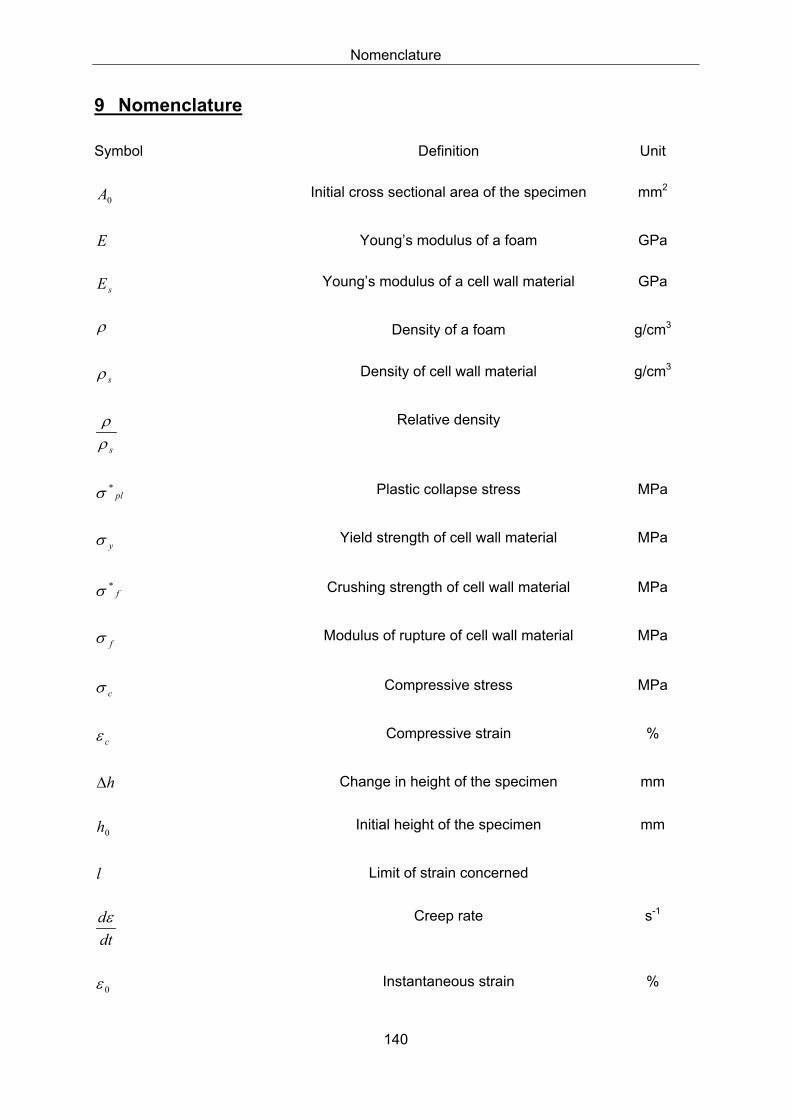
Nomenclature
140
9 Nomenclature
Symbol Definition Unit
0A Initial cross sectional area of the specimen mm2
E Young’s modulus of a foam GPa
sE Young’s modulus of a cell wall material GPa
ρ Density of a foam g/cm3
sρ Density of cell wall material g/cm3
sρρ Relative density
pl*σ Plastic collapse stress MPa
yσ Yield strength of cell wall material MPa
f*σ Crushing strength of cell wall material MPa
fσ Modulus of rupture of cell wall material MPa
cσ Compressive stress MPa
cε Compressive strain %
h∆ Change in height of the specimen mm
0h Initial height of the specimen mm
l Limit of strain concerned
dtdε Creep rate s-1
0ε Instantaneous strain %
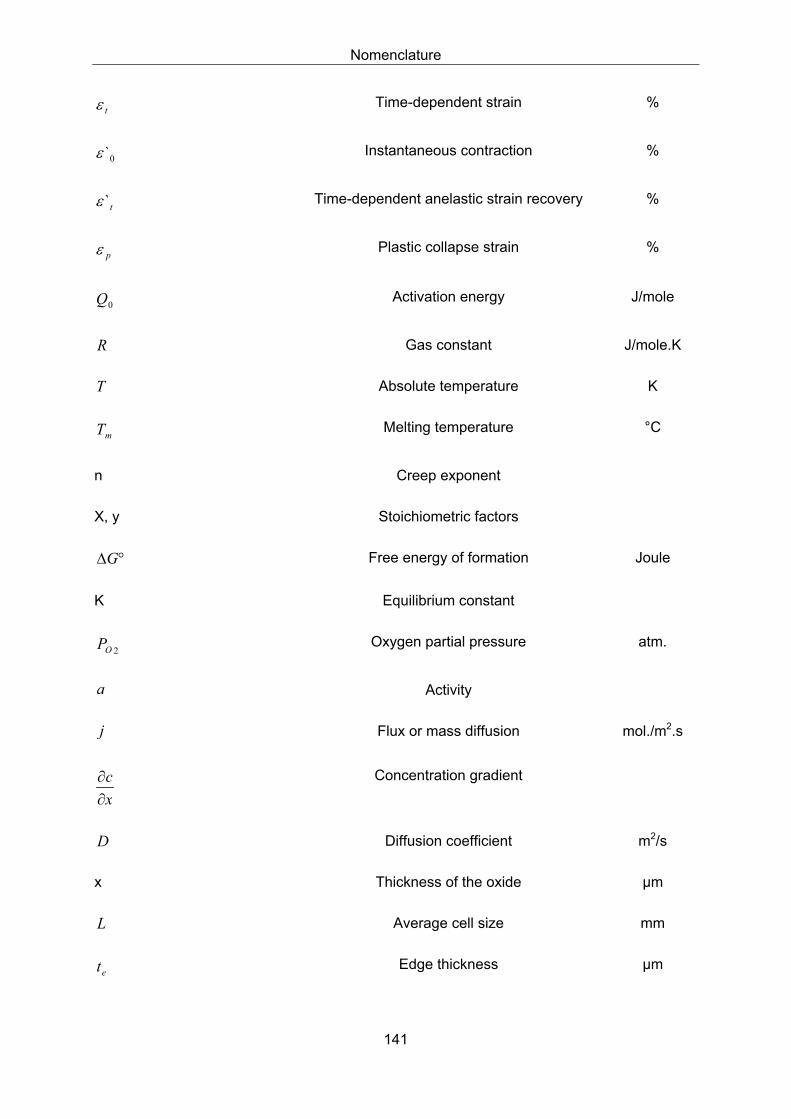
Nomenclature
141
tε Time-dependent strain %
0`ε Instantaneous contraction %
t`ε Time-dependent anelastic strain recovery %
pε Plastic collapse strain %
0Q Activation energy J/mole
R Gas constant J/mole.K
T Absolute temperature K
mT Melting temperature °C
n Creep exponent
X, y Stoichiometric factors
°∆G Free energy of formation Joule
K Equilibrium constant
2OP Oxygen partial pressure atm.
a Activity
j Flux or mass diffusion mol./m2.s
xc
∂∂ Concentration gradient
D Diffusion coefficient m2/s
x Thickness of the oxide µm
L Average cell size mm
et Edge thickness µm
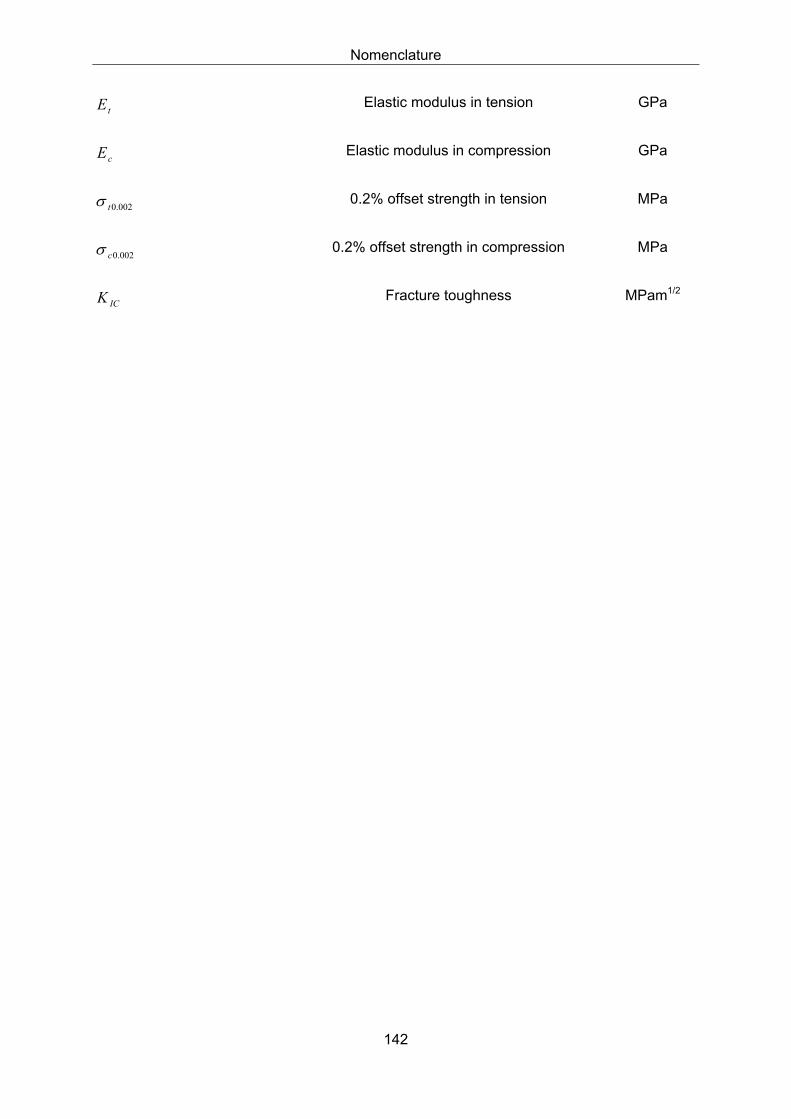
Nomenclature
142
tE Elastic modulus in tension GPa
cE Elastic modulus in compression GPa
002.0tσ 0.2% offset strength in tension MPa
002.0cσ 0.2% offset strength in compression MPa
ICK Fracture toughness MPam1/2
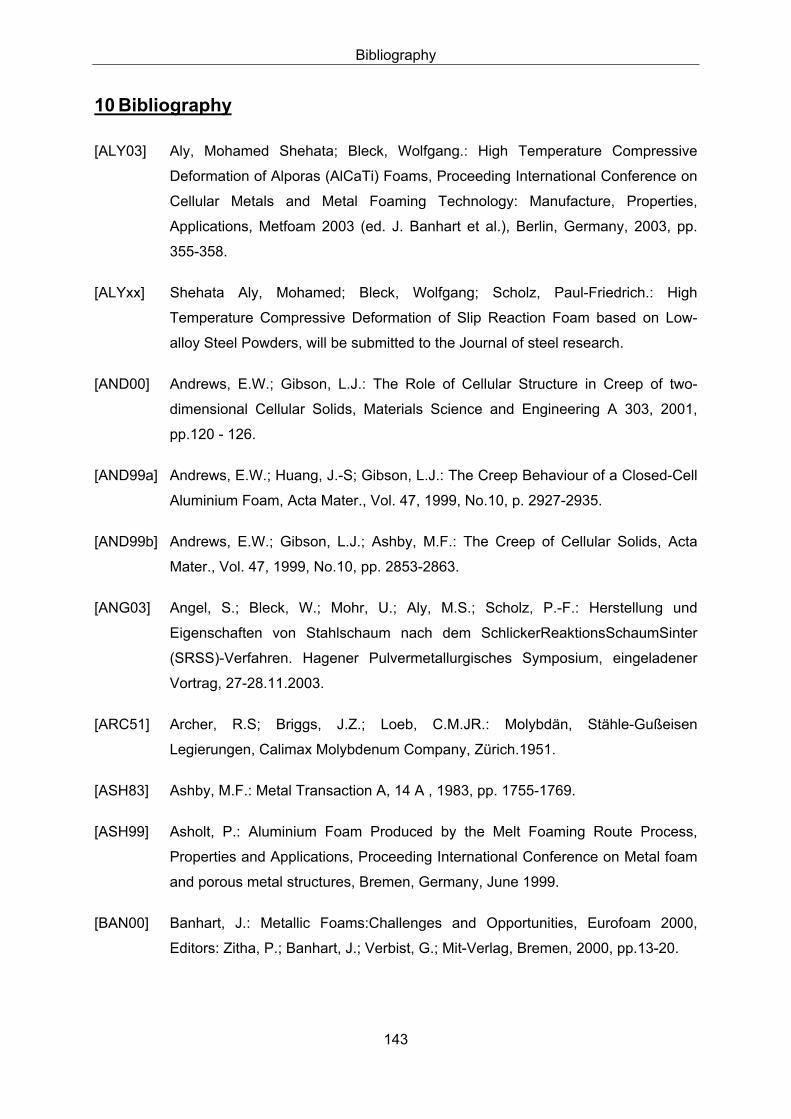
Bibliography
143
10 Bibliography
[ALY03] Aly, Mohamed Shehata; Bleck, Wolfgang.: High Temperature Compressive
Deformation of Alporas (AlCaTi) Foams, Proceeding International Conference on
Cellular Metals and Metal Foaming Technology: Manufacture, Properties,
Applications, Metfoam 2003 (ed. J. Banhart et al.), Berlin, Germany, 2003, pp.
355-358.
[ALYxx] Shehata Aly, Mohamed; Bleck, Wolfgang; Scholz, Paul-Friedrich.: High
Temperature Compressive Deformation of Slip Reaction Foam based on Low-
alloy Steel Powders, will be submitted to the Journal of steel research.
[AND00] Andrews, E.W.; Gibson, L.J.: The Role of Cellular Structure in Creep of two-
dimensional Cellular Solids, Materials Science and Engineering A 303, 2001,
pp.120 - 126.
[AND99a] Andrews, E.W.; Huang, J.-S; Gibson, L.J.: The Creep Behaviour of a Closed-Cell
Aluminium Foam, Acta Mater., Vol. 47, 1999, No.10, p. 2927-2935.
[AND99b] Andrews, E.W.; Gibson, L.J.; Ashby, M.F.: The Creep of Cellular Solids, Acta
Mater., Vol. 47, 1999, No.10, pp. 2853-2863.
[ANG03] Angel, S.; Bleck, W.; Mohr, U.; Aly, M.S.; Scholz, P.-F.: Herstellung und
Eigenschaften von Stahlschaum nach dem SchlickerReaktionsSchaumSinter
(SRSS)-Verfahren. Hagener Pulvermetallurgisches Symposium, eingeladener
Vortrag, 27-28.11.2003.
[ARC51] Archer, R.S; Briggs, J.Z.; Loeb, C.M.JR.: Molybdän, Stähle-Gußeisen
Legierungen, Calimax Molybdenum Company, Zürich.1951.
[ASH83] Ashby, M.F.: Metal Transaction A, 14 A , 1983, pp. 1755-1769.
[ASH99] Asholt, P.: Aluminium Foam Produced by the Melt Foaming Route Process,
Properties and Applications, Proceeding International Conference on Metal foam
and porous metal structures, Bremen, Germany, June 1999.
[BAN00] Banhart, J.: Metallic Foams:Challenges and Opportunities, Eurofoam 2000,
Editors: Zitha, P.; Banhart, J.; Verbist, G.; Mit-Verlag, Bremen, 2000, pp.13-20.

Bibliography
144
[BAN02] Banhart, J.: Functional Applications, "Handbook of Cellular Metals, Production,
Processing, Applications", edited by Hans-Peter Degischer and Brigitte Kriszt,
WILEY-VCH Verlag GmbH, 2002.
[BAN99] Banhart, J.: Properties and applications of cast aluminium sponges, Proceeding
International Conference on Metal foam and porous metal structures, Bremen,
Germany, June 1999.
[BAR68] Bartha, P.; Lehmann, H.; Koltermann, M.; Verhalten phosphategebundener
Werkstoffe bei hohen Temperaturen, Glas-Email-Keramo-Technik, Heft 8,
pp. 282, 1968.
[BAR98] Bart-Smith, H.; Bastrawos, A.F.; Mumm, D.R.; Evans, A.G.; Sypeck, D.J.;
Wadley, H.N.G.: Compressive Deformation and Yielding Mechanisms in Cellular
Al Alloys Determined Using X-Ray Tomography and Surface Strain Mapping, in:
Schwartz, D.S.; Shih,D.S.; Wadely, H.N.G., Evans, A.G.: Materials Research
Society MRS Proceedings, Vol. 521: Porous and Cellular Materials for Structural
Applications, 1998, pp .71-81.
[BAU97] Baumeister, J.; Banhart, J.; Weber, M.: Aluminium Foams for Transport Industry,
Materials Design, Vol. 18 (1997), pp. 217-220.
[BEN71] Benard, J.: in : Oxidation of Metals and Alloys, 1971.
[BER03] Bericht " Entwicklung von offenporigen Schäumen aus Nickelbasislegierungen
und intermetallischen Phasen", IEHK, RWTH-Aachen, 2003.
[BIN01] Bin, W.; Deping, H.; Guangji, S.: Compressive Properties and Energy Absorption
of Foamed Al Alloy, Proceeding International Conference on Cellular Metals and
Metal Foaming Technology (ed. J. Banhart et al.), Bremen, Germany, June 2001,
pp. 351-354.
[BLE99] Bleck, W. (Hrsg.).: Werkstoffprüfung in Studium und Praxis, Aachen, 1999.
[BÖL03] Böllinghaus, T.: Werkstoffeigenschaften und Verarbeitung von
Aluminumschäumen, Dr.-Ing Dissertation, RWTH Aachen, Shaker Veralg, 2003.
[BRA00] Brady, M.P.; Pint,B.A.; Tortorelli, P.F.; Wright, I.G.: High Temperature Oxidation
and Corrosion of Intermetallics, Materials Science and Technology, Corrosion
and Environmental Degradation, Ed. M. Schuetz, Vol. II, Wiley-VCH Verlag,
2000.

Bibliography
145
[BRA04] Bram, M.; Laptev, A.; Buchkremer, H.P.; Stöver, D.: Herstellung von
hochporösen, endkontournahen Titan-Formkörpern für biomedizinsche
Anwendungen, Mat.-wiss. U. Werkstofftech., Vol. 35, No. 4, 2004, pp. 213-218.
[BRE81] Bressers, J.: Creep and Fatigue in High Temperature Alloys, Galliard Printers
Ltd, Great Braitain, 1981.
[BRO80] Brown, A.M.; Ashby, M.F.: Scr. Metall., 14 (1980), pp. 1297.
[CAR77] Carter, V.E.: Metallic Coatings for Corrosion Control, Butterworths, London,
1977.
[CHA99] Chastel, Y.; Hudry, E.; Forest, S.; Peytour; C.: Mechanical Behaviour of
Aluminium Foams For Various Deformation Paths. Experimental and Modelling,
Proceeding International Conference on Metal foam and porous metal structures,
Bremen (Germany), June 1999, pp. 263-268.
[CHE99] Chen, C.; Lu, T.J.; Fleck, N.A.: Effect of Imperfections on the Yielding of Two-
Dimensional Foams, Journal of Mechanics and Physics of Solids, 47, 1999,
pp. 2235-2272.
[CHI98] Chin, J.Y.; Eifert, H.; Banhart, J.; Baumeister, J.: Metal Foaming by a Powder
Metallurgy Method: Production, Properties and Applications, Mat Res Innovat, 2,
1998, pp. 181-188.
[CHV75] Chvatal, T.: Stand der feuerfesten Phosphatbindung heute, Sprechsaal 108.
Jahrgang, Internat. Ceramics & Glass Magazine, Coburg, 1975, pp. 576-588.
[CLA] Clarke, D.R.: Stress Generation during High-Temperature Oxidation of Metallic
Alloys, Materials Dep., Colleage of Eng., Uni. Of California, CA 93160-5050.
[COC00] Cocks, A.C.F.; Ashby, M.F.: Creep-Buckling of Cellular Solids, Acta Mater.,
Vol. 48, 2000, pp. 3395-3400.
[COH68] Cohen, L.A.; Power, W.A.; Fabel, D.A.: Mater. Eng. , Vol. 67, 1968, pp. 44.
[COR96] Cornel, R.M.; Schwertmann, U.: The Iron Oxides, Structure, Properties,
Reactions, Occurrence and Uses, VCH Verlag GmbH, Germany, 1996.

Bibliography
146
[DAN00] Dannemann, K.A.; Lankfordjr, J.: High Strain Rate Compression of Closed-Cell
Aluminium Foams, Materials Science and Engineering A, Vol. 293, Issues 1-2,
2000, pp. 157-164.
[DAV83] Davies, G.J.; Shu Zhen.: Review Metallic foams: Their Production, Properties
and Applications, Journal of Materials Science , Vol.18, 1983, pp. 1899-1911.
[DEG02] Degischer, H.P.: Materials Definitions, Processing, and Recycling, Handbook of
Cellular Metals, Production, Processing, Applications, Edited by Degischer, H.-P.
and Kriszt, B., Wiley-VCH Verlag GmbH, Weinheim, 2002.
[DES03] Despois, J.-F; Conde, Y.; San Marchi, C.; Mortensen, A.: Tensile Behaviour of
Replicated Aluminium Foams, Proceeding International Conference on Cellular
Metals and Metal Foaming Technology: Manufacture, Properties, Applications
(ed. J. Banhart et al.), Berlin, Germany, June 2003, pp. 375-380.
[DIN84] DIN 53421: Prüfung von harten Schaumstoffen, Druckversuch, Berlin, 1984.
[DUA02] Duarte, I.; Banhart, J.: A Study of Aluminium Foam Formation Kinetic and
Microstructure, Acta mater., 48, 2002, pp. 2349-2362.
[FED79] Fedorchenko, I.M.: Sov. Powder Metall. Met. Ceram. 18625, 1979.
[FOR89] Fortes, M.A.; Fernandes, J.J.; Serralheiro, I; Rosa, M.E.: Experimental
Determination of Hydrostatic Compression versus Volume Change Curves for
Cellular solids, Journal of Testing and Evaluation JTEVA, Bd.17, 1989, Nr.1,
pp. 67-71.
[FOR99] Fortes, M.A.; Ashby, M.F.: The Effect Of Non-Uniformity On The In-Plane
Modulus Of Honeycombs, Acta Mater., Vol. 47, No. 12,1999, pp. 3469-3473.
[FRO82] Frost, H.J.; Ashby, M.F.: Deformation Mechanism Maps: The Plasticity and Creep
of Metals and Ceramics, Pergamon Oxford, 1982.
[GAB72] Gabe, D.R.: Principles of Metal Treatment and Protection, Pergamon Press,
Oxford, 1972.
[GAR67] Gardner, A.R.: Prod. Eng., 38, 141, 1967.
[GIB97] Gibson, J.; Ashby, F.: Cellular Solids : Structure and Properties, 2nd edition,
Cambridge University Press, 1997.

Bibliography
147
[GIO00] Gioux, G.; McCormack, T.M.; Gibson, L.J.: Failure of Aluminium Foams Under
Multiaxial Loads, Int. Journal of Mech. Sci., 42, 2000, pp. 1097-1117.
[GOR90] Goretta, K.C.; Brezny, R.; Dam, C.Q.; Green, D.G.: High Temperature
Mechanical Behaviour of Porous Open-cell Al2O3, Materials Science and
Engineering, A124, 1990, pp. 151-158.
[GRA99] Gradinger, R.; Rammerstorfer, F.G.: On The Influence Of Meso-Inhomogenities
On The Crush Worthiness Of Metal Foams, Acta Mater., Vol. 47, 1999, No. 1,
pp.143-148.
[GRE98] Grenstedt, J.L.: Influence of Imperfections on Effective Properties of Cellular
Solids, in: D.S. Schwarz; D.S. Shih, A.G. Evans, H.N.G. Wadley (Eds.), Porous
and Cellular Materials for Structural Applications, Materials Research Society
Symposium Proceedings, 521, 1998, pp. 3-13.
[GRO03] Grote, F.: Offenporige Metallstrukturen nach dem Platzhalterverfahren, Dr.-Ing.
Dissertation, RWTH Aachen, Shaker Verlag, 2003.
[HAA03] Haag, M.; Wanner, A.; Clemens, H.; Zhang, P.; Kraft, O.; Arzt, E.: Creep of
Aluminium-Based Closed-Cell Foams, Metallurgical and Materials Transactions
A, Vol. 34A, 2003, pp. 2809-2817.
[HAG99] Hagen, H.Von.: Werkstoffeigenschaften eines Sandwichverbundes aus
Stahldeckblechen mit einem Aluminiumschaumkern, Dr.-Ing. Dissertation,
RWTH Aachen, Shaker Verlag, 1999.
[HAL00] Hall, I.W.; Guden, M.; Yu, C.-J.: Crushing of Aluminium Closed Cell Foams:
Density and Strain Rate Effects, Scripta Mater., 43, 2000, pp. 515-521.
[HAN01] Hanssen, A.G.; Langseth, M.; Hopperstad, O.S.: Crash Behaviour of Foamed-
Based Components: Validation of Numerical Simulations, Proceeding
International Conference on Cellular Metals and Metal Foaming Technology (ed.
J. Banhart et al.), Bremen, Germany, June 2001, pp. 329-338.
[HAN98] Han, F.; Zhu, Z.; Gao, J.: Compressive Deformation and Energy Absorbing
Characteristic of Foamed Aluminium, Metallurgical and Materials Transactions A,
29A, 1998, pp. 2497.
[HAR99] Harte, A.-M.; Fleck, N.A.; Ashby, M.F.: Fatigue Failure of an Open Cell and a
Closed Cell Aluminium Alloy Foam, Acta Mater., Vol. 47, 1999, pp. 2511-2524.
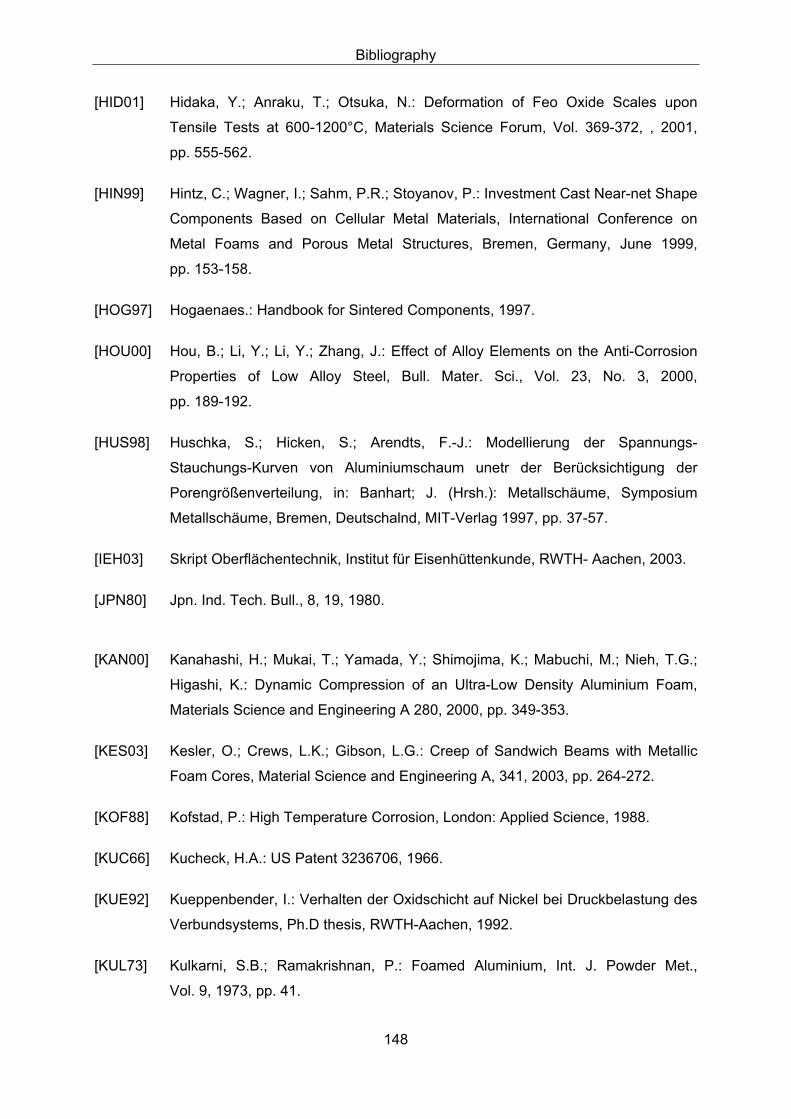
Bibliography
148
[HID01] Hidaka, Y.; Anraku, T.; Otsuka, N.: Deformation of Feo Oxide Scales upon
Tensile Tests at 600-1200°C, Materials Science Forum, Vol. 369-372, , 2001,
pp. 555-562.
[HIN99] Hintz, C.; Wagner, I.; Sahm, P.R.; Stoyanov, P.: Investment Cast Near-net Shape
Components Based on Cellular Metal Materials, International Conference on
Metal Foams and Porous Metal Structures, Bremen, Germany, June 1999,
pp. 153-158.
[HOG97] Hogaenaes.: Handbook for Sintered Components, 1997.
[HOU00] Hou, B.; Li, Y.; Li, Y.; Zhang, J.: Effect of Alloy Elements on the Anti-Corrosion
Properties of Low Alloy Steel, Bull. Mater. Sci., Vol. 23, No. 3, 2000,
pp. 189-192.
[HUS98] Huschka, S.; Hicken, S.; Arendts, F.-J.: Modellierung der Spannungs-
Stauchungs-Kurven von Aluminiumschaum unetr der Berücksichtigung der
Porengrößenverteilung, in: Banhart; J. (Hrsh.): Metallschäume, Symposium
Metallschäume, Bremen, Deutschalnd, MIT-Verlag 1997, pp. 37-57.
[IEH03] Skript Oberflächentechnik, Institut für Eisenhüttenkunde, RWTH- Aachen, 2003.
[JPN80] Jpn. Ind. Tech. Bull., 8, 19, 1980.
[KAN00] Kanahashi, H.; Mukai, T.; Yamada, Y.; Shimojima, K.; Mabuchi, M.; Nieh, T.G.;
Higashi, K.: Dynamic Compression of an Ultra-Low Density Aluminium Foam,
Materials Science and Engineering A 280, 2000, pp. 349-353.
[KES03] Kesler, O.; Crews, L.K.; Gibson, L.G.: Creep of Sandwich Beams with Metallic
Foam Cores, Material Science and Engineering A, 341, 2003, pp. 264-272.
[KOF88] Kofstad, P.: High Temperature Corrosion, London: Applied Science, 1988.
[KUC66] Kucheck, H.A.: US Patent 3236706, 1966.
[KUE92] Kueppenbender, I.: Verhalten der Oxidschicht auf Nickel bei Druckbelastung des
Verbundsystems, Ph.D thesis, RWTH-Aachen, 1992.
[KUL73] Kulkarni, S.B.; Ramakrishnan, P.: Foamed Aluminium, Int. J. Powder Met.,
Vol. 9, 1973, pp. 41.

Bibliography
149
[LEN80] Lenel, F.V.: Powder Metallurgy Principles and Applications, Metal Powder
Industries Federation, London, 1980.
[LEY97] Leyens, Ch.: Oxidationsverhalten und Oxidationsschutz von Titanlegierungen für
den Hochtemperatureinsatz in Flugtriebwerken, Dr.-Ing Dissertation, RWTH
Aachen, Shaker Verlag, 1997.
[MAR01] Markaki, A.E.; Clyne, T.W.: The Effect of Cell Wall Microstructure on the
Deformation and Fracture of Aluminium-Based Foams, Acta mater., Vol. 49,
2001, pp.1677-1686.
[MAR99] Markaki, A.E.; Clyne, T.W.: The Effect of Impact Velocity on the Deformation of
Layered Metal Foam / Ceramic Composites, Proceeding International
Conference on Metal foam and porous metal structures (ed. J. Banhart et al.),
Bremen, Germany, June 1999, pp. 359-364.
[MEM89] Memhard, D.: Festigkeits- und Zähigkeitsverhalten von ferritischen Baustählen im
Temperaturbereich zwischen 20°C und 400°C, Dr.-Ing Dissertation, RWTH
Aachen, 1989.
[MCD03] McDonald, S.A.; Mummery, P.M.; Johnson, G.: Characterisation of the 3-D
Structure and Compressive Deformation of Metallic Foams, Proceeding
International Conference on Cellular Metals and Metal Foaming Technology:
Manufacture, Properties, Applications (ed. J. Banhart et al.), Berlin, Germany,
June 2003, pp. 289-294.
[MIY99] Miyoshi, T.; Itoh, M; Akiyamy, S.; Kitahara, A.: Aluminium Foam (ALPORAS): The
Production Process, Properties and Applications, Proceeding International
Conference on Metal foam and porous metal structures, Bremen, Germany, June
1999, pp. 125-132.
[MIY99a] Miyoshi, T.; Itoh, M; Mukai, T.; Kanahashi, H.; Kohzu, H.; Tanabe, S.; Higashi, K.:
Enhancement of Energy Absorbtion in a Closed-Cell Aluminium by the
Modification of Cellular Structures, Scripta Materialia, Vol. 41, 1999,
pp. 1055-1060.

Bibliography
150
[MOH01] Mohr, U.; Scholz, P-F.; Bleck, W.: Production of SlipReactionFoam (SRF) and
Influence of Production Parameters on the Mechanical Properties, Proceeding
International Conference on Cellular Metals and Metal Foaming Technology (ed.
J. Banhart et al.), Bremen, Germany, 2001, pp. 209-214.
[MOH03] Mohr, U.: Herstellung und Characterisierung von offenporigem Stahlschaum,
Dr.-Ing. Dissertation. RWTH Aachen, 2003.
[MOS03] A statistic Approach to Estimate the Compression Strength of Aluminium Foams,
Proceeding International Conference on Cellular Metals, Manufacture,
Properties, Applications, Metfoam 2003 (ed. J. Banhart et al.), Berlin, Germany,
2003, pp. 387-392.
[MOT01] Motz, C.; Pippan, R.; Ableidinger, A.; Böhm, H.; Rammerstorfer, F.G.:
Deformation and Fracture Behaviour of Ductile Aluminium Foams in the
Presence of Notches under Tensile Loading, Proceeding International
Conference on Cellular Metals and Metal Foaming Technology (ed. J. Banhart et
al.), Bremen, Germany, 2001, pp. 299-304.
[MUK99] Mukai, T.; Kanahashi, H.; Miyoshi, T.; Mabuchi, M.; Nieh, T.G.; Higashi, K.:
Experimental Study of Energy Absorption in a Closed-Cell Aluminium Foam
Under Dynamic Loading, Scripta Materialia., Vol. 40, 1999, No. 8, pp. 921-927.
[NN] www.tec.plym.ac.uk
[NN96] Erscheinungsformen von Rissen und Brüchen metallischer Werkstoffe, Verlag
Stahleisen, Düsseldorf, 1996.
[OLU01] Olurin, O.B.; Fleck, N.A.; Ashby, M.F.:Tensile and Compressive Failure of
Noatched Cellular Foams, Advanced Engineering Materials, Vol. 3, 2001, No.1-2,
pp. 55-58.
[OUD83] Oudar, J.: in: High Temperature Corrosion, 1983.
[PAR00] Park, C.; Nutt, S.R.: PM Synthesis And Properties Of Steel Foams, Materials
Science and Engineering A 288, 2000, pp.111-118.
[PAU00] Paul, A.; Ramamurty, U.: Strain Rate Sensitivity of a Closed-Cell Aluminium
Foam, Materials Science and Engineering A 281, 2000, pp. 1-7.

Bibliography
151
[PER89] Perkins, R.A.; Chiang, K.T.; Meier, G.H.; Miller, R.: Effect of Alloying, Rapid
Solidification, and Surface Kinetics on the High Temperature Environmental
Resistance of Niobium AFOSR Contract F49620-86-C-0018. Washington,
DC: Bolling Air Force Base.
[RAU02] Raush, G.; Banhart; J.: Making Cellular Metals from Metals other than Aluminium,
"Handbook of Cellular Metals, Production, Processing, Applications", edited by
Hans-Peter Degischer and Brigitte Kriszt, WILEY-VCH Verlag GmbH, 2002.
[RIN71] Rinde, J.A.; Hoge, K.G.: Time and Temperature Dependence of the Mechanical
Properties of Polystyrene Bead Foam, Journal of Applied Polymer Science, Vol.
15, 1971, pp. 1377-1395.
[ROB01] Roberts, A.P.; Garboczi, E.J.: Elastic Moduli of Model Random Three
Dimensional Closed-Cell Cellular Solids, Acta Mater., Vol. 49, 2001, pp. 189-197.
[SÁE99] Saenz, E.; Villate, A.; Garuz, I; Irisarri, A.M.; Rausch, G; Weber, M.: Failure
Mechanisms of Aluminium Foams under Compressive Loads, Proceeding
International Conference on Metal foam and porous metal structures (ed. J.
Banhart et al.), Bremen (Germany), 1999, pp. 269-273.
[SAL03] Salvo, L.; Belestin, P.; Douillard, T.; Maire, E.; Jacquesson, M.; Vecchionacci, C.;
Boller, E.: Structure and Mechanical Properties of AFS Sandwiches Studied in
Compression Tests by In-situ X-ray Micro-tomography, Proceeding International
Conference on Cellular Metals and Metal Foaming Technology: Manufacture,
Properties, Applications (ed. J. Banhart et al.), Berlin, Germany, June 2003,pp.
319-324.
[SAN92] Sang, H.; Kenny, L.D.: Process and Apparatus for Producing Shaped Slabs of
Particle Stabilized Foamed Metal, European Patent EP 0587619B1, 1992.
[SAV61] Savitsky, E.M.: The Influence of Temperature on the Mechanical Properties of
Metals and Alloys, Stanfold, California, 1961.
[SCH00] Schuetz, M.: Corrosion and Environmental Degradation Vol. I, Materials Science
and Technology, Editors: Cahn; R.W., Hassen; P., Kramer; E.J., Wiley-VCH,
2000.
[SCH88] Schatt, W.: Pulvermetallurgie, Sinter- und Verbundwerkstoffe, 3. Auflage,
Deutscher Verlag für Grundstoffindustrie, Leipzig, 1988.

Bibliography
152
[SCH91] Schuetz, M.: Die Korrossionsschutzwirkung oxidischer Deckschichten unetr
thermisch-chemischer Werkstoffbeanspruchung, Materialkundliche Reihe 10,
G. Petzow und F. Jeglitsch (Hrsg.), Gebrüder Borntraeger, Berlin, Stuttgart,
1991.
[SCH97] P.-F. Scholz: Patent DE 197 16 514 C 1, Verfahren zum pulvermetallurgischen
Herstellen und damit hergestellte Bauteile, 1997.
[SHA94] Shapovalov, V.I.: Porous Metals, MRS Bulletin, Bd.19, 1994, Nr.4, pp. 24-28.
[SIM02] Simancik, F.: The Strange World of Cellular Metals, " Handbook of Cellular
Metals, Production, Processing, Applications", Ed. Hans-Peter Degischer, Brigitte
Kriszt, WILEY-VCH Verlag GmbH, 2002.
[SIM98] Simone, A.; Gibson, L.J.: The Effects Of Cell Face Curvature and Corrugations
on the Stiffness and Strength of Metallic Foams; Acta Mater., Vol. 11, 1998,
pp. 3929-3935.
[SIM98a] Simone, A.E.; Gibson, L.J.: Aluminium Foams by Liquid-State Processes, Acta
Metall., Vol. 46, 1998, pp. 3109-3123.
[SMI98] Smith, H.B.; Bastaworse, A.-F.; Mumm, D.R.; Evans, A.G.: Compression
Deformation and Yielding Mechanisms in Cellular Al Alloy Determined Using
X-Ray Tomography and Surface Strain Mapping, Acta Mater., Vol. 46, 1998,
No. 10, pp. 3583-3592.
[SOS48] Sosnik, A.:US patent 2434775, 1948.
[SUG97] Sugimara, Y.; Meyer, J.; He, M.Y.; Bart.Smith, H.; Grenestedt, J.; Evans, A.G.:
On the Mechanical Performance of Closed Cell Al Alloy Foams, Division of Eng.
and Applied Sci., Harvard University, Cambridge, 1997.
[THÜ93] Thümmler, F; Oberacker, R.: Introduction to Powder Metallurgy, The Institute of
Materials, London, 1993.
[VAY97] Vayman, S.; Guico, R.S.; Fine, M.E.; Manganello, S.J.: Estimation of
Atmospheric Corrosion of High-Strength, Low-Alloy Steels, Metallurgical and
Materials Transactions A: Physical Metallurgy and Materials Science, Vol. 28A.
No. 5, 1997.

Bibliography
153
[YAR66] Yarnton, D.: Eng. Mater. Des., 9, 83, 1966.
[YU98] Yu, C.-J; Eifert, H.H.; Banhart, J.; Baumeister, J.: Metal Foaming By a Powder
Metallurgy Method: Production, Properties and Applications, The first Innovations
in Materials Conference (Imn), Washington D.C., July 19-22, 1998.
[ZHA02] Zhang, P.; Haag, M; Kraft, O.; Wanner, A.; Arzt, E.: Microstructural Changes in
the Cell Walls of a Closed-Cell Aluminium Foam during Creep, Philosophical
Magazine A, Vol. 82, No. 16, 2002, p. 2895-2907.
[ZHU00] Zhu, H.X.; Hobdell, J.R.; Windle, A.H.: Effects Of Cell Irregularity on The Elastic
Properties of Open-Cell Foams, Acta Mater., Vol. 48, 2000, pp. 4893-4900.
[ZHU02] Zhu, H.X.; Windle, A.H.: Effects Of Cell Irregularity on the High Strain
Compression of Open-Cell Foams, Acta Mater., Vol. 50, 2002, pp. 4893-4900.

Mohamed Shehata Aly
Persönliche Daten:Familienstand: Verheiratet + 2 Kinder
Staatsangehörigkeit: ägyptischGeburtsdatum: 15.03.1975 in El-Giza, Ägypten
Ausbildung:1989 –1992 Gymnasium, (Abschluß: Abitur) El-Giza, Ägypten1992-1997 Faculty of Eng., Cairo Uni., Mining;
Petroleum and Metallurgical Dep.(Abschluß: B. Sc.)
El-Giza, Ägypten
Berufserfahrung:Sommer 1995 Praktikum in El-Nasr Casting
CompanyÄgypten
Sommer 1996 Auslandspraktikum am Institutfür Eisenhüttenkund (IEHK)
Aachen, Deutschland
1997 - 1998 Wissenschaftlicher Mitarbeiteram Central Metallurgical
Research and DevelopmentInstitut (CMRDI)
Helwan, Ägypten
Ende 1998 Stipendiat der ägyptischenRegierung für Promotion an der
RWTH Aachen University
Aachen, Deutschland
July1999 - October 1999 Deutsch Kurse am GoetheInstitut, Bonn
Bonn, Deutschland
October 1999 - Februar 2002 Masterstudiengang Metallurgieund Werkstofftechnik an der
RWTH Aachen University
Aachen, Deutschland
Februar 2002 Abschluß: M. Sc. in Metallurgieund Werkstofftechnik
Aachen, Deutschland
Ab März 2003 Stipendiat am Institut fürEisenhüttenkunde.
Aachen, Deutschland