Microstructure and mechanical properties of strip cast ...
22
University of Wollongong University of Wollongong Research Online Research Online Faculty of Engineering and Information Sciences - Papers: Part A Faculty of Engineering and Information Sciences 1-1-2016 Microstructure and mechanical properties of strip cast TRIP steel Microstructure and mechanical properties of strip cast TRIP steel subjected to thermo-mechanical simulation subjected to thermo-mechanical simulation Zhiping Xiong University of Wollongong, [email protected] Andrii Kostryzhev University of Wollongong, [email protected] Liang Chen University of Wollongong, [email protected] Elena V. Pereloma University of Wollongong, [email protected] Follow this and additional works at: https://ro.uow.edu.au/eispapers Part of the Engineering Commons, and the Science and Technology Studies Commons Recommended Citation Recommended Citation Xiong, Zhiping; Kostryzhev, Andrii; Chen, Liang; and Pereloma, Elena V., "Microstructure and mechanical properties of strip cast TRIP steel subjected to thermo-mechanical simulation" (2016). Faculty of Engineering and Information Sciences - Papers: Part A. 6056. https://ro.uow.edu.au/eispapers/6056 Research Online is the open access institutional repository for the University of Wollongong. For further information contact the UOW Library: [email protected]
Transcript of Microstructure and mechanical properties of strip cast ...

University of Wollongong University of Wollongong
Research Online Research Online
Faculty of Engineering and Information Sciences - Papers: Part A
Faculty of Engineering and Information Sciences
1-1-2016
Microstructure and mechanical properties of strip cast TRIP steel Microstructure and mechanical properties of strip cast TRIP steel
subjected to thermo-mechanical simulation subjected to thermo-mechanical simulation
Zhiping Xiong University of Wollongong, [email protected]
Andrii Kostryzhev University of Wollongong, [email protected]
Liang Chen University of Wollongong, [email protected]
Elena V. Pereloma University of Wollongong, [email protected]
Follow this and additional works at: https://ro.uow.edu.au/eispapers
Part of the Engineering Commons, and the Science and Technology Studies Commons
Recommended Citation Recommended Citation Xiong, Zhiping; Kostryzhev, Andrii; Chen, Liang; and Pereloma, Elena V., "Microstructure and mechanical properties of strip cast TRIP steel subjected to thermo-mechanical simulation" (2016). Faculty of Engineering and Information Sciences - Papers: Part A. 6056. https://ro.uow.edu.au/eispapers/6056
Research Online is the open access institutional repository for the University of Wollongong. For further information contact the UOW Library: [email protected]

Microstructure and mechanical properties of strip cast TRIP steel subjected to Microstructure and mechanical properties of strip cast TRIP steel subjected to thermo-mechanical simulation thermo-mechanical simulation
Abstract Abstract Instead of hot rolling and cold rolling followed by annealing, strip casting is a more economic and environmentally friendly way to produce transformation-induced plasticity (TRIP) steels. According to industrial practice of strip casting, rapid cooling in this work was achieved using a dip tester, and a Gleeble 3500 thermo-mechanical simulator was used to carry out the processing route. A typical microstructure of TRIP steels, which included ~0.55 fraction of polygonal ferrite with bainite, retained austenite and martensite, was obtained. The effects of deformation (0.41 reduction) above non-recrystallisation temperature, isothermal bainite transformation temperature and the size of second phase region on microstructure and mechanical properties were studied. The steel isothermally transformed at 400 °C had the best combination of ultimate tensile strength (UTS) and total elongation (TE), whether deformation was applied or not. The deformation resulted in the improvement of mechanical properties after holding at 400 °C: the UTS increased from 590 to 696 MPa and TE decreased from 0.27 only to 0.26. It was predominantly ascribed to grain size refinement and dislocation strengthening. The studied TRIP steel had comparable mechanical properties with TRIP 690 produced commercially.
Keywords Keywords trip, microstructure, steel, mechanical, subjected, thermo, simulation, properties, strip, cast
Disciplines Disciplines Engineering | Science and Technology Studies
Publication Details Publication Details Xiong, Z. P., Kostryzhev, A. G., Chen, L. & Pereloma, E. V. (2016). Microstructure and mechanical properties of strip cast TRIP steel subjected to thermo-mechanical simulation. Materials Science and Engineering A: Structural Materials: Properties, Microstructure and Processing, 677 356-366.
This journal article is available at Research Online: https://ro.uow.edu.au/eispapers/6056

Microstructure and mechanical properties of strip cast TRIP steel
subjected to thermo-mechanical simulation
Z.P. Xiong1*
, A.G. Kostryzhev1, L. Chen
1, E.V. Pereloma
1, 2
1School of Mechanical, Materials and Mechatronic Engineering, University of Wollongong,
Wollongong, NSW 2522, Australia 2Electron Microscopy Centre, University of Wollongong, Wollongong, NSW 2519, Australia
Abstract: Instead of hot rolling and cold rolling followed by annealing, strip casting is a more
economic and environmentally friendly way to produce transformation-induced plasticity
(TRIP) steels. According to industrial practice of strip casting, rapid cooling in this work was
achieved using a dip tester, and a Gleeble 3500 thermo-mechanical simulator was used to
carry out the processing route. A typical microstructure of TRIP steels, which included ~ 0.55
fraction of polygonal ferrite with bainite, retained austenite and martensite, was obtained. The
effects of deformation (0.41 reduction) above non-recrystallisation temperature, isothermal
bainite transformation temperature and the size of second phase region on microstructure and
mechanical properties were studied. The steel isothermally transformed at 400 °C had the
best combination of ultimate tensile strength (UTS) and total elongation (TE), whether
deformation was applied or not. The deformation resulted in the improvement of mechanical
properties after holding at 400 °C: the UTS increased from 590 to 696 MPa and TE decreased
from 0.27 only to 0.26. It was predominantly ascribed to grain size refinement and
dislocation strengthening. The studied TRIP steel had comparable mechanical properties with
TRIP 690 produced commercially.
Keywords: TRIP steel; Strip casting; Thermo-mechanical processing; Mechanical properties;
Carbon diffusion; Isothermal bainite transformation.
*Correspondence author email address: [email protected] (Z.P. Xiong)

1. Introduction
The development of advanced high strength steels (AHSSs) for the automotive industry is
driven by the request for weight reduction in order to improve the fuel economy [1, 2]. Low-
alloyed transformation-induced plasticity (TRIP) assisted steels are good AHSS candidates
due to their excellent ductility combined with high strength. TRIP steels have a multi-phase
microstructure, including polygonal ferrite, bainite, martensite and retained austenite (RA)
[3-9]. In fact, the key characteristic of these steels is the presence of stabilised austenite at
room temperature [4, 6, 10, 11]. This stabilised austenite can transform to martensite during
deformation, which contributes to an increase in ductility. The stability of RA is mainly
controlled through its carbon content and morphology, which offers a chance to tune the
microstructure through thermo-mechanical processing [4, 10]. The processing schedules
contain two important stages [12, 13]. The first stage is to form polygonal ferrite via cooling
through or holding for a certain time in the austenite-ferrite temperature region. The
polygonal ferrite provides ductility in this steel and leads to the carbon enrichment of
austenite; the austenite enriched with carbon is stable against martensitic transformation
during rapid cooling to isothermal bainite transformation (IBT) temperature [1, 12-14]. The
second stage is to form carbide-free bainite during holding at bainite formation temperature
following rapid cooling from the austenite-ferrite temperature region. At this stage, the
austenite is further enriched with carbon, which results in the RA preserved at room
temperature [1, 12-14].
The strip casting aims to directly produce strip steels from liquid metals [15]. Compared to
hot and cold rolling, the strip casting eliminates many procedures, such as rough rolling and
reheating, resulting in a decrease in gas emission, energy consumption and operation cost
[15]. However, the large prior austenite grain size (PAGS) (approximately 100 – 200 μm)
complicates tuning of the microstructure via the adjustment of heat treatment parameters [15,
16]. It is well known that the PAGS dictates the final microstructure of the transformation
products at room temperature such that refining the former leads to a fine grain size of the
latter [17-19]. For example, Cota et. al. reported that the average ferrite gain size increased
from 8 to ~ 40 μm when the PAGS increased from 9.5 to 100 μm [18]. In addition, PAGS
also affects the bainite transformation in such a way that a coarser PAGS leads to larger
bainite packet size and a decrease in bainite transformation rate [20-22].
At present, carbon steels, silicon steels and stainless steels are manufactured in industry by
the strip casting technology [23, 24]. Daamen et. al. reported a trial to obtain twinning-
induced plasticity (TWIP) steels using this technology in the laboratory [25]. The dual phase
steels were obtained by the present authors via the simulation of strip casting [26, 27]. For
TRIP steels, researchers focus on further development of hot rolling and cold rolling followed
by annealing. Except our previous paper, which presented the microstructure and mechanical
properties of TRIP steels obtained via the simulation of strip casting without deformation
[28], there is no other published study on the production of TRIP steels using strip casting
technology. This paper presents a further step in our investigation, namely the effect of
austenite deformation on the microstructure and mechanical properties. With an increase in
the amount of deformation the microstructure was refined and the mechanical properties were

enhanced. The strengthening mechanisms responsible for the properties improvement were
analysed; in particular, the effect of second phase region size on RA retention was discussed
based on the carbon distribution.
2. Experimental Detail
The chemical composition of studied steel mainly consisted of 0.172 C, 1.520 Si, 1.610 Mn,
0.0266 Al, 0.0153 Cu, 0.195 Cr and balance Fe (all in wt. %). It was similar to the chemical
composition of conventional TRIP steels [1, 2]. As-cast specimens of 36 × 36 mm2 and 1.2
mm thickness were produced at Deakin University using a dip tester [29]. The dip tester was
designed to simulate the initial contact conditions of a twin roll caster used in strip casting
technology [25, 30]. The copper substrates spot welded with R-type thermocouple were used
as contact surfaces between liquid metals and twin rollers, which was immersed into the
molten metal for a certain time in order to achieve different high cooling rates of up to ~ 1700
Ks-1
[25, 31] characteristic for the strip casting process. Then the copper substrates were
removed from the furnace and the solidified samples were then used in this study.
The thermo-mechanical schedule illustrated in Fig. 1 was carried out on a Gleeble 3500
thermo-mechanical simulator in hydrawedge mode. Samples of 20 x 15 x (0.9 – 1.2) mm3
were cut from the as-cast samples. Because of the small thickness beyond the movement
control capability of the Gleeble 3500 simulator, a sandwiched sample was designed [26].
The studied sample spot welded with a K-type thermocouple was clamped by two dummy
samples (2.5 mm thick; made of structural microalloyed steel). The sandwiched samples were
heated at 40 Ks-1
to 1000 °C, then at 20 Ks-1
to 1250 °C in order to avoid overshooting and
held for 300 s. This was followed by the cooling at 30 Ks-1
to 1050 °C, where the reduction
(Δ = 0.41±0.02) was applied at a strain rate of 0.5 s-1
and then by cooling at 10 Ks-1
to the
interrupted cooling temperature (TIC = 670, 690 and 710 °C). After this, the samples were
cooled at 50 Ks-1
to the IBT temperature (TIBT = 350, 400, 450 and 500 °C) and held for 900 s
in order to provide time for bainite transformation. Finally, the samples were water quenched
to room temperature. Some samples were directly water quenched from different TIC to room
temperature in order to study the effect of TIC on ferrite formation. Holding at 1250 °C for
300 s was determined in order to simulate the prior austenite grain structure (the average
grain size of 83±31 μm) inherent for strip casting, as described in the previous study [28].

Figure 1. The thermo-mechanical schedule to produce the microstructure of TRIP steels.
Plain strain compression during hot rolling was simulated in the thermo-mechanical
experiments. Thus, the coordinate of normal direction (ND), rolling direction (RD) and
transverse direction (TD) is used in this study. The deformed samples were cut parallel to the
RD-ND plane, and then were hot mounted, mechanically polished and etched using 2 vol. %
nital for optical microscopy (OM) and scanning electron imaging. The microstructures were
characterised using a Leica optical microscope (OM) and a JEOL JSM-7001F field emission
gun – scanning electron microscope (FEG – SEM) operating at 15 kV. All micrographs were
taken from the centre of samples’ cross-section. The fractions of ferrite and second phase
region were calculated based on the variation in grey scales in the optical micrographs using
Photoshop and Image Pro-Plus software. At least 260 ferrite grains or second phase regions
were used to calculate the equivalent circle diameter. It is noted that the RA fraction could
not be measured in the present study using X-ray diffraction due to small sample width (~ 2.5
mm) after deformation.
Simultaneous electron backscattering diffraction (EBSD) and energy dispersive X-ray
spectroscopy (EDS) mapping was undertaken on the same JEOL JSM-7001F FEG – SEM
operating at 15 kV accelerating voltage, 5 nA probe current and fitted with a Nordlys-II(S)
EBSD and an 80 mm2 X-Max EDS detectors interfacing with the Oxford Instruments Aztec
software suite. The sample preparation included mechanical polishing up to 1 µm followed
by electropolishing using an electrolyte of 330 ml methanol, 330 ml butoxyethanol and 40 ml
perchloric acid at 50 V, ~ 1.0 mA and 17 °C for ~ 90 s. EBSD-EDS mapping was conducted
at the centre of the sample cross section using a step size of 0.04 μm. The discs for
transmission electron microscopy (TEM) were cut parallel to the RD-TD plane using
electrical discharge machine, polished to 80 μm thickness using silicon papers, and twin-jet
electropolished with an electrolyte containing 10 vol. % perchloric acid in methanol. The
JEOL 2011 TEM and JEOL JEM-ARM200F operating at 200 kV were used to characterise
the microstructures.

The dog-bone shaped samples for tensile testing were cut through RD-TD plane; their gauge
length, width and thickness were 4.9, 2.1 and ~ 0.6 mm, respectively. The tensile tests were
carried out using an in-house modified 5 kN Kammrath and Weiss GmbH tensile stage at a
constant crosshead speed of 2 μm s-1
, corresponding to an initial strain rate of 4 × 10⁻⁴
s-1
. At
least two samples were tested for each condition.
3. Results
3.1 Effect of interrupted cooling temperatures on ferrite formation
As shown in Fig. 2, the ferrite fraction increased from 0.52±0.03 to 0.71±0.02 with a
decrease in TIC from 710 to 670 °C because the time for ferrite formation was extended. As
expected, it was consistent with many published results [32, 33]. The TIC = 710 °C was
chosen in the following experiments as this temperature assured formation of ~ 0.5 fraction
of ferrite. TRIP steels with 0.5 ferrite fraction were demonstrated to have a good combination
of mechanical properties [34, 35].
Figure 2. Effect of interrupted cooling temperature on ferrite fraction.
3.2 Effect of isothermal bainite transformation temperature on microstructure evolution
For comparison, the sample with a dual phase microstructure was produced by direct
quenching from 710 °C to room temperature (indicated via a dash line in Fig. 1) and referred
to as TD Q in the following sections. It displayed the microstructure consisting of polygonal
ferrite, second phase regions and a small amount of Widmänstatten ferrite (Fig. 3(a)). The
second phase regions included martensite and some bainite (Fig. 3(b)). In addition, a layer of
polygonal ferrite was observed near the sample surfaces (Fig. 3(a)).

Figure 3. (a) Optical and (b) SEM images of the sample directly quenched from 710 °C. PF is polygonal ferrite,
WF is Widmänstatten ferrite, SPR is second phase region, M is martensite and B is bainite.
After fast cooling from the ferrite formation temperature (710 °C), the samples were held at
350, 400, 450 and 500 °C for 900 s. They were denoted as TD 350, TD 400, TD 450 and TD
500, respectively. The optical microscopy of IBT samples showed a similar distribution of
second phase regions to those in the TD Q sample (Fig. 3(a)). All the IBT samples had ~ 0.55
ferrite fraction.
After holding at 350 °C (TD 350), the microstructure consisted of polygonal ferrite, bainitic
ferrite, granular bainite, martensite and RA in polygonal ferrite (Fig. 4). Bainitic ferrite
consists of ferrite laths separated by film RA; whereas, granular bainite includes irregular-
shaped ferrite with dispersed blocky martensite and/or retained austenite (M/RA) constituent
[36, 37]. Fig. 4(b) shows an example of a second phase region with a size of ~ 1.2 μm
included bainitic ferrite. On the contrary, as an example, the M/RA island with a size of
smaller than 1 μm after quenching to room temperature was observed in Fig. 4(c). Fig. 5 (a)
demonstrates film RA between bainitic ferrite laths in a small second phase region. Fig. 5 (b)
shows one example of martensite island adjacent to the interface between polygonal ferrite
and second phase region.
Figure 4. Selected SEM images of the sample after holding at 350 °C (TD 350): (a) overview; (b) bainitic ferrite;
(c) martensite and/or retained austenite island. PF is polygonal ferrite, GB is granular bainite, BF is bainitic
ferrite and M/RA is martensite and/or retained austenite.

Figure 5. TEM images of TD 350 sample: (a) film retained austenite between bainitic ferrite laths in a small
second phase region (the zone axis of inset is [112] ); (b) martensite island adjacent to polygonal ferrite (the
zone axis of insets is [111] and [011]α). PF is polygonal ferrite, BF is bainitic ferrite, M is martensite and RA is
retained austenite. Diffraction patterns were taken from circled areas.
With an increase in IBT temperature to 400 °C (TD 400), the phase balance in the TRIP steel
was similar to that in the TD 350 sample, as shown in Fig. 6. In addition, a little amount of
Widmänstatten ferrite was observed. Some small islands of granular bainite were observed
(Fig. 6(b)). The M/RA islands with sizes smaller than ~ 3.5 μm were preserved instead of
transforming to bainite during the IBT holding (Fig. 6(b)). Some second phase regions shown
in Fig. 6(c) included many bainite packets. The bright and dark field TEM imaging proved
the presence of RA between the bainitic ferrite laths (Figs. 7(a, b)). On the other hand, the
micrograph in Fig. 7(c) was taken from the centre of a large second phase region such that
file RA was not observed between bainitic ferrite laths due to lower carbon content as
discussed in Section 4.1.2. An example of a martensite island adjacent to the interface
between the polygonal ferrite and the second phase region is also given in (Fig. 7(d)).
Figure 6. Selected SEM images of the sample after holding at 400 °C (TD 400): (a) overview; (b) small second
phase regions; (c) large second phase regions. SPR is second phase region, PF is polygonal ferrite, WF is
Widmänstatten ferrite, GB is granular bainite, BF is bainitic ferrite and M/RA is martensite and/or retained
austenite.

Figure 7. TEM images of TD 400 sample: (a) bright and (b) dark (from (200)γ) field images of retained austenite
between bainitic ferrite laths (the zone axis of inset is [011]γ); the zone axis of inset in (c, d) is [111] and [001]α,
respectively. PF is polygonal ferrite, BF is bainitic ferrite, M is martensite and RA is retained austenite.
Diffraction patterns were taken from circled areas.
After holding at 450 °C (TD 400), the microstructure also consisted of polygonal ferrite,
bainitic ferrite, granular bainite, and M/RA islands in polygonal ferrite (Fig. 8). Some second
phase regions contained more of granular bainite than bainitic ferrite such as in Fig. 8(b). In
addition, some coarse M/RA islands adjacent to bainitic ferrite were observed in the large
second phase regions (Fig. 8(c)). Figs. 9 (a, b) show the RA and martensite formed near the
interface between polygonal ferrite and second phase region. The observed twins in
martensite, showed by arrows in Fig. 9 (b), indicate a relatively high carbon content, which is
responsible for this twinned martensite. Several cementite particles between bainitic ferrite
laths were observed via the selected area diffraction technique and dark field imaging (Figs. 9
(c, d)), indicating upper bainite formation. Similar formation of a limited upper bainite
amount together with carbide-free bainite morphologies was reported in thermo-mechanically
processed TRIP steel with IBT of 470 °C [38].

Figure 8. Selected SEM images of the sample after holding at 450 °C (TD 450). PF is polygonal ferrite, GB is
granular bainite, BF is bainitic ferrite and M/RA is martensite and/or retained austenite.
Figure 9. TEM images of TD 450 sample: (a) bright and (b) dark (from (121) ) field images of martensite
adjacent to the interface between polygonal ferrite and second phase region (the zone axis is near [113] ); (c)
bright and (d) dark (from (011)c) field images of cementite between bainitic ferrite laths (the zone axis of
bainitic ferrite laths and cementite is near [311] and [111]c, respectively). PF is polygonal ferrite, GB is
granular bainite, M is martensite and RA is retained austenite. Diffraction patterns were taken from circled areas.

With a further increase in the IBT temperature to 500 °C (TD 500), the microstructure was
changed significantly with appearance of many pearlite grains (Fig. 10). The pearlite
formation is known to be harmful to the TRIP steel properties, due to the carbon consumption
resulting in a decreased amount of RA [34, 39]. Thus, the further analysis of microstructure
and measurements of mechanical properties for this condition were not carried out.
Figure 10. Selected SEM images of the sample after holding at 500 °C (TD 500). PF is polygonal ferrite and P
is pearlite.
3.3 Detailed characterisation of the TD 400 sample
The distributions of ferrite grain size and the size of second phase region in TD 400 sample
are shown as a representative in Fig. 11; the other samples (TD Q, TD 350, TD 400 and TD
450) had similar distributions due to the similar ferrite fraction. The distributions are of
normal shape, i.e. they have a single maximum, however, a broaden one for the second phase
regions. In TD 400 sample, the average grain size of ferrite was 13±7 μm and the average
size of second phase regions was 18±16 μm; the maximum sizes for ferrite and second phase
regions were 48 and 95 μm, respectively.
In order to assess the deformation effect, three additional samples were produced in a
dilatometer using the same austenitising and cooling schedule in Fig. 1, which, instead of
deformation, contained a period of holding at 670 °C for 300 s in order to obtain 0.55 fraction
of ferrite. These samples are denoted as T 350, T 400 and T 450, corresponding to isothermal
holding temperatures of 350, 400 and 450 °C, respectively. They are discussed in details
elsewhere [28]. As shown in Table 1, deformation resulted in a decrease in the average ferrite
grain size from 17±10 to 13±7 μm and the average size of second phase regions from 21±24
to 18±16 μm, indicating a refined and more homogenised microstructure after deformation.

Figure 11. (a) The ferrite grain size distribution and (b) the size distribution of second phase region in the TD
400 sample.
Table 1. Summary of microstructure statistics.
Ferrite fraction
Average size, μm Maximum, μm Minimum, μm
Ferrite
Second
phase region Ferrite
Second
phase region Ferrite
Second
phase region
T 400 0.55±0.06 17±10 21±24 51 136 3 3
TD 400 0.52±0.03 13±7 18±16 48 95 3 3
Due to its largest product of ultimate tensile strength and total elongation (discussed in
Section 3.4 below) and in order to investigate the effect of second phase region size on the
RA fraction, the microstructure of TD 400 sample was further studied using EBSD (Fig. 12).
In Fig. 12 (a), the second phase region A transformed from one remaining austenite grain
after polygonal ferrite formation (referred to as remaining austenite) and the second phase
region B also transformed from one remaining austenite grain, which is demonstrated by the
pole figures in Figs. 12 (e) and (f), respectively. As can be seen in Fig. 12 (b), the smaller
second phase region A had a higher RA fraction than that in the larger second phase region B.
Most of the RA was distributed along the remaining austenite/polygonal ferrite interfaces
(Fig. 12 (b)). Whereas, only a small amount of RA retained inside the second phase regions,
i.e. film RA between bainitic ferrite laths and blocky RA between bainite packets (Fig. 12
(b)). The carbon enriched area corresponded to this RA distribution (Fig. 12 (c)). The
polygonal ferrite was depleted in carbon compared to the second phase regions. The
manganese distribution looks to be homogeneous (Fig. 12 (d)) due to the low diffusion rate of
substitutional alloying elements [40] and probably due to a difficulty to detect the small
variations in manganese content using this technique. On the other hand, the difference in
carbon content in polygonal ferrite and RA was detected (c.f. Figs. 12 (b) and (c)), which is a
result of more than an order of magnitude variation in the carbon content between ferrite and
RA [32].

Figure 12. EBSD maps in TD 400 sample of the (a) band contrast with grain boundaries (2 ° < low angle grain
boundaries < 15° = blue lines and high angle grain boundaries ≥ 15° = black lines) and (b) phase distribution
(FCC = red and BCC = blue), EDS elements maps of (d) carbon and (e) manganese, and (e, f) {001} pole
figures of the experimental orientation spread of the retained austenite grain corresponding to A and B second
phase regions marked in (a), respectively.

3.4 Mechanical properties
The engineering stress – engineering strain curves of different thermo-mechanically
processed samples are shown in Fig. 13, and corresponding mechanical properties are listed
in Table 2. The yield stress (YS) was determined using 0.2% offset because of continuous
yielding behaviour. As expected, TD Q sample had the largest YS and ultimate tensile
strength (UTS) with the lowest uniform elongation (UE) and total elongation (TE) due to its
ferrite-martensite microstructure. After holding at different IBT temperatures, the TD 400
sample showed the highest UTS of 696 MPa and TE of 0.26, resulting in the largest product
of UTS and TE, namely 18096 MPa%. With an increase or a decrease in the IBT temperature,
the UTS and TE decreased.
Figure 13. Engineering stress – engineering strain curves of different thermo-mechanically processed samples.
Table 2. Summary of mechanical properties for different processing schedules.
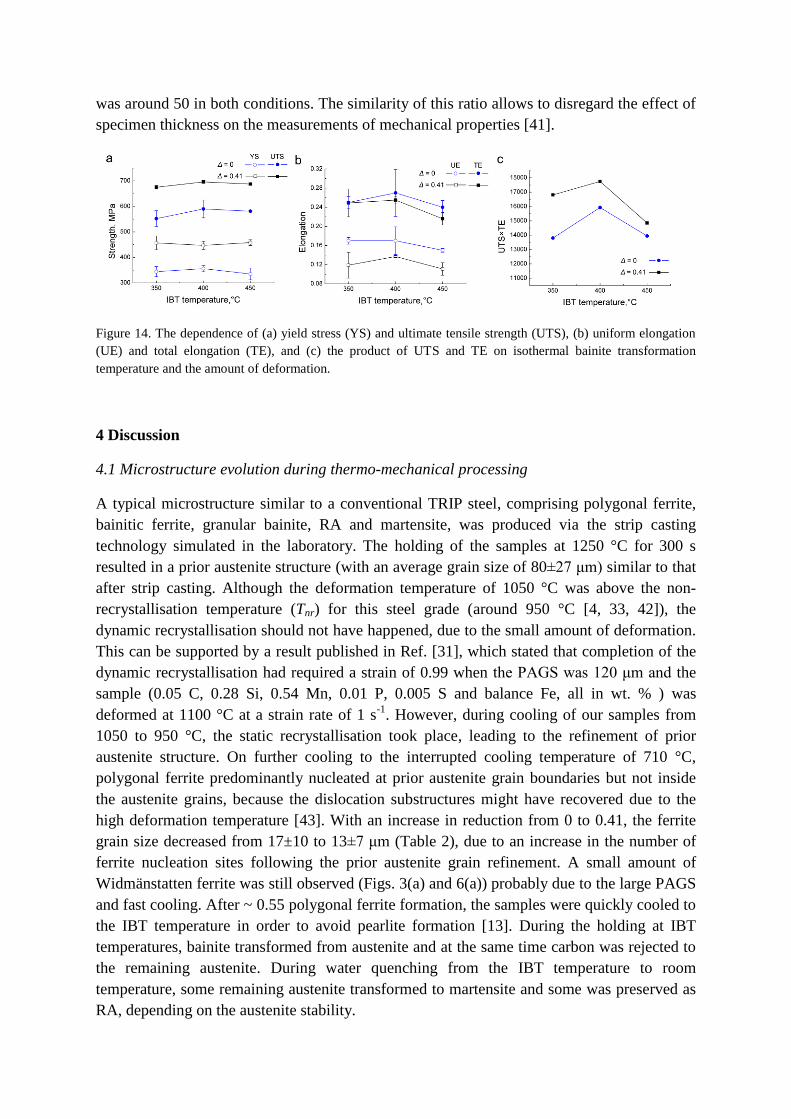
Compared to the samples produced using dilatometer without deformation, with an increase
in the amount of deformation the YS and UTS increased while the UE and TE decreased
(Figs. 14(a, b)). In addition, the product of UTS and TE also increased after deformation (Fig.
14(c)). For example, after holding at 400 °C the UTS increased by 106 MPa while the
elongation decreased by 0.01 with an increase in reduction from 0 to 0.41. As a result, the
product of UTS and TE increased from 159350 to 18096 MPa%. Although the difference in
thickness of non-deformed (~ 1 mm) and deformed samples (~ 0.6 mm) was not taken into
consideration for its effect on mechanical properties, the ratio of thickness to ferrite grain size
Deformation Ferrite
fraction
Yield
strength,
MPa
Ultimate
tensile
strength,
MPa
Uniform
elongation
Total
elongation
Product of
ultimate tensile
strength and total
elongation, MPa%
TD Q
0.41±0.02
0.53±0.05 535±13 791±30 0.11±0.017 0.18±0.023 14238
TD 350 0.54±0.01 457±27 675±7 0.12±0.027 0.25±0.029 16875
TD 400 0.52±0.03 447±16 696±6 0.14±0.002 0.26±0.008 18096
TD 450 0.56±0.01 458±11 688±5 0.11±0.020 0.22±0.013 15136
was around 50 in both conditions. The similarity of this ratio allows to disregard the effect of
specimen thickness on the measurements of mechanical properties [41].
Figure 14. The dependence of (a) yield stress (YS) and ultimate tensile strength (UTS), (b) uniform elongation
(UE) and total elongation (TE), and (c) the product of UTS and TE on isothermal bainite transformation
temperature and the amount of deformation.
4 Discussion
4.1 Microstructure evolution during thermo-mechanical processing
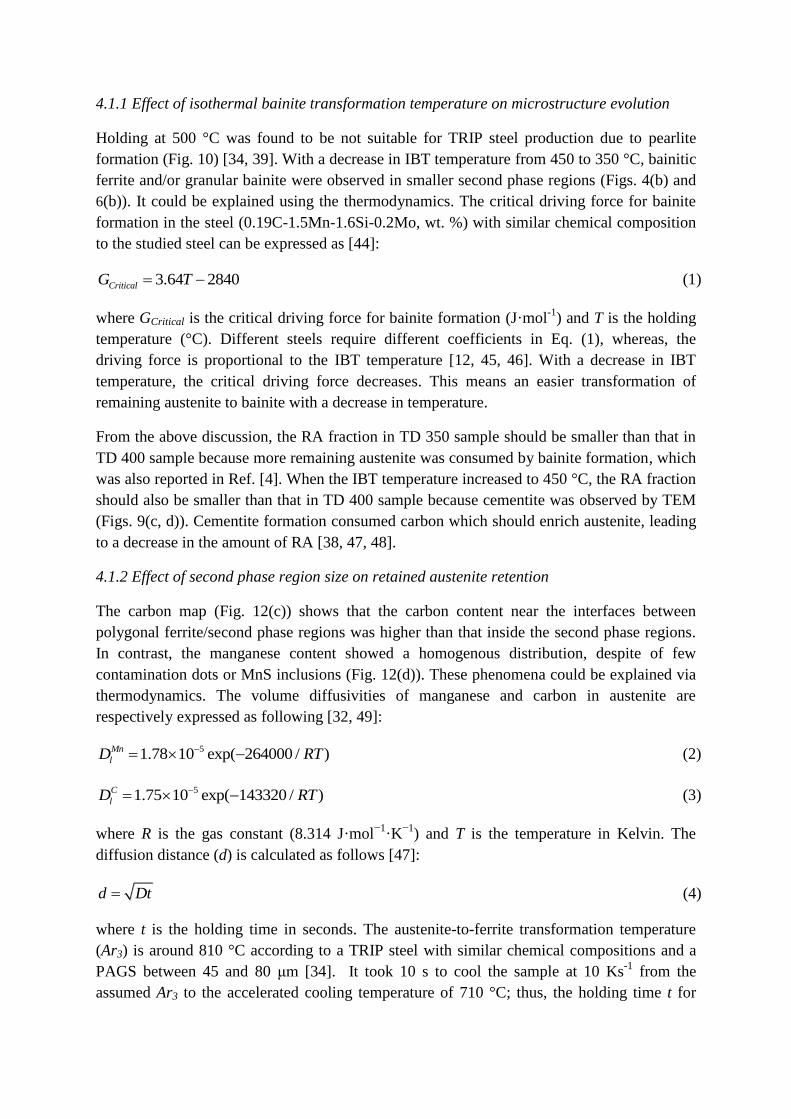
A typical microstructure similar to a conventional TRIP steel, comprising polygonal ferrite,
bainitic ferrite, granular bainite, RA and martensite, was produced via the strip casting
technology simulated in the laboratory. The holding of the samples at 1250 °C for 300 s
resulted in a prior austenite structure (with an average grain size of 80±27 μm) similar to that
after strip casting. Although the deformation temperature of 1050 °C was above the non-
recrystallisation temperature (Tnr) for this steel grade (around 950 °C [4, 33, 42]), the
dynamic recrystallisation should not have happened, due to the small amount of deformation.
This can be supported by a result published in Ref. [31], which stated that completion of the
dynamic recrystallisation had required a strain of 0.99 when the PAGS was 120 μm and the
sample (0.05 C, 0.28 Si, 0.54 Mn, 0.01 P, 0.005 S and balance Fe, all in wt. % ) was
deformed at 1100 °C at a strain rate of 1 s-1
. However, during cooling of our samples from
1050 to 950 °C, the static recrystallisation took place, leading to the refinement of prior
austenite structure. On further cooling to the interrupted cooling temperature of 710 °C,
polygonal ferrite predominantly nucleated at prior austenite grain boundaries but not inside
the austenite grains, because the dislocation substructures might have recovered due to the
high deformation temperature [43]. With an increase in reduction from 0 to 0.41, the ferrite
grain size decreased from 17±10 to 13±7 μm (Table 2), due to an increase in the number of
ferrite nucleation sites following the prior austenite grain refinement. A small amount of
Widmänstatten ferrite was still observed (Figs. 3(a) and 6(a)) probably due to the large PAGS
and fast cooling. After ~ 0.55 polygonal ferrite formation, the samples were quickly cooled to
the IBT temperature in order to avoid pearlite formation [13]. During the holding at IBT
temperatures, bainite transformed from austenite and at the same time carbon was rejected to
the remaining austenite. During water quenching from the IBT temperature to room
temperature, some remaining austenite transformed to martensite and some was preserved as
RA, depending on the austenite stability.
4.1.1 Effect of isothermal bainite transformation temperature on microstructure evolution
Holding at 500 °C was found to be not suitable for TRIP steel production due to pearlite
formation (Fig. 10) [34, 39]. With a decrease in IBT temperature from 450 to 350 °C, bainitic
ferrite and/or granular bainite were observed in smaller second phase regions (Figs. 4(b) and
6(b)). It could be explained using the thermodynamics. The critical driving force for bainite
formation in the steel (0.19C-1.5Mn-1.6Si-0.2Mo, wt. %) with similar chemical composition
to the studied steel can be expressed as [44]:
3.64 2840CriticalG T (1)
where GCritical is the critical driving force for bainite formation (J·mol-1
) and T is the holding
temperature (°C). Different steels require different coefficients in Eq. (1), whereas, the
driving force is proportional to the IBT temperature [12, 45, 46]. With a decrease in IBT
temperature, the critical driving force decreases. This means an easier transformation of
remaining austenite to bainite with a decrease in temperature.
From the above discussion, the RA fraction in TD 350 sample should be smaller than that in
TD 400 sample because more remaining austenite was consumed by bainite formation, which
was also reported in Ref. [4]. When the IBT temperature increased to 450 °C, the RA fraction
should also be smaller than that in TD 400 sample because cementite was observed by TEM
(Figs. 9(c, d)). Cementite formation consumed carbon which should enrich austenite, leading
to a decrease in the amount of RA [38, 47, 48].
4.1.2 Effect of second phase region size on retained austenite retention
The carbon map (Fig. 12(c)) shows that the carbon content near the interfaces between
polygonal ferrite/second phase regions was higher than that inside the second phase regions.
In contrast, the manganese content showed a homogenous distribution, despite of few
contamination dots or MnS inclusions (Fig. 12(d)). These phenomena could be explained via
thermodynamics. The volume diffusivities of manganese and carbon in austenite are
respectively expressed as following [32, 49]:
51.78 10 exp( 264000 / )Mn
lD RT (2)
51.75 10 exp( 143320 / )C
lD RT (3)
where R is the gas constant (8.314 J·mol−1
·K−1
) and T is the temperature in Kelvin. The
diffusion distance (d) is calculated as follows [47]:
d Dt (4)
where t is the holding time in seconds. The austenite-to-ferrite transformation temperature
(Ar3) is around 810 °C according to a TRIP steel with similar chemical compositions and a
PAGS between 45 and 80 μm [34]. It took 10 s to cool the sample at 10 Ks-1
from the
assumed Ar3 to the accelerated cooling temperature of 710 °C; thus, the holding time t for

element diffusion can be set as the maximum of 10 s. If a medium value of 760 °C is chosen
as the diffusion temperature T and the time is set between 5 and 10 s, the calculated diffusion
distances of carbon and manganese would be 2.2 – 3.1 µm and 2.0 – 2.8 nm, respectively.
This carbon diffusion range resulted in a layer of high carbon content adjacent to the
remaining austenite grain boundaries (Fig. 12(c)), which was also demonstrated in Refs. [47,
50]. Manganese diffused much shorter distances which led to its homogenous distribution
compared to carbon (c.f. Figs. 12(c) and (d)).
A higher carbon content near the remaining austenite grain boundaries, compared to that
inside the remaining austenite grains, led to more RA grains adjacent to the polygonal
ferrite/second phase region interfaces after quenching to room temperature from the IBT
temperatures. In addition, some tiny RA grains were inside the second phase region due to
the carbon enrichment during the bainite formation (Fig. 12(b)). As a result, the RA fraction
in a larger second phase region was lower than that in a smaller one (Fig. 12 (b)). This
corresponds to Hanzaki et. al. who also showed the RA fraction decreased from 0.071 to
0.051 when PAGS increased from 45 to 350 μm [17].
The second phase region was only refined from 21±24 to 18±16 μm with an increase in
reduction from 0 to 0.41. Based on the above discussion, it means that the RA fraction after
deformation may only change marginally in the studied TRIP steel; the RA fraction in the
non-deformed samples was reported to be between 0.02 and 0.05 [28].
4.2 Effect of isothermal bainite holding temperature and deformation on mechanical
properties
As shown in Fig. 14, the combination of strength and ductility after holding at 400 °C was the
highest, whether the deformation was applied or not. Without deformation, the best
combination of properties after holding at 400 °C was ascribed to the highest RA fraction in
the previous study [28]. This phenomenon after holding at different IBT temperatures was
reported by many researchers [1, 51, 52]. It was also explained by the largest fraction of RA
with suitable carbon content after holding at 400 °C [1, 51, 52]. Based on the discussion in
Section 4.1.1, it is probable that the largest RA fraction was also obtained in TD 400 sample
and this was responsible for the best combination of strength and ductility.
The strengthening with deformation, observed in this study (Fig. 14), could be predominantly
explained by grain refinement and dislocation strengthening. Due to the same processing
condition for polygonal ferrite formation, all three samples (TD 350, TD 400 and TD 450)
had similar average polygonal ferrite grain sizes. Besides, the dislocation densities for TD
350, TD 400 and TD 450 samples were similar because of low holding temperatures, namely
10.4±0.75×10¹³
, 9.8±0.56×10¹³
and 9.4±0.67×10¹³
m-2
, respectively, although the dislocation
recovery was different due to different IBT temperatures. Thus, as a representative example,
the TD 400 sample was used for the analysis of the strengthening mechanism. After holding
at 400 °C, with an increase in reduction from 0 to 0.41, the YS and UTS respectively
increased by 91 and 106 MPa, while the TE decreased by 0.01. This resulted in an increase in
the product of UTS and TE, which indicated an increase in formability [53]. Three aspects

should be considered for the strengthening. First of all, after deformation the ferrite grain size
decreased from 17±10 to 13±7 μm, which increased the grain refinement contribution to YS
by 52 MPa according to the Hall – Petch equation [54]:
1/2
0 kd (5)
where the σ0 and k are material constants, and k is equal to 1500 1/2MPa m based on ~
0.45 fraction of the second phases [55]. Secondly, the deformation increased the dislocation
density in the polygonal ferrite. As shown in Fig. 15, the dislocation density in the TD 400
sample (9.8±0.56×10¹³
m-2
) was higher than that in the T 400 sample (5.1±0.42×10¹³
m-2
).
This increase in dislocation density accounts for 58 MPa increase in YS according to the
Bailey – Hirsch relationship [56]:
1/2
dis M Gb
(6)
where M is the Taylor factor (M = 2.75 for random textured bcc metals), α is a constant (α =
0.38 in bcc iron), G is shear modulus (G = 81.6 GPa), b is the Burgers vector (b = 0.248 nm)
and ρ is the average dislocation density in polygonal ferrite. Thirdly, the size of the second
phase region was refined from 21±24 to 18±16 μm, which also could increase the strength:
the smaller second phase regions had more interfaces with polygonal ferrite, resulting in a
local increase in the dislocation density in ferrite, and a more pronounced interaction between
the polygonal ferrite and second phases during deformation [4]. Thus, the grain refinement
and dislocation strengthening was ascribed to be the main reason for the improvement of
mechanical properties after deformation. To this end, the variation in the RA contribution to
strength is expected to be low due to a marginal change in RA fraction after deformation (as
discussed in Section 4.1.2).
Figure 15. Dislocations in polygonal ferrite of (a) T 400 and (b) TD 400 samples. The zone axis in (a, b)
is[111] .
The mechanical properties of the investigated TRIP steel produced by strip casting were
compared with the ones commercially produced using hot rolling [57]. As can be seen in Fig.
16, the studied steels treated without deformation, especially the T 400 sample, exhibited the

comparable mechanical properties with TRIP 590. The studied deformed TRIP steels,
especially for the TD 400 sample, had comparable mechanical properties with TRIP 690. In
the future, the mechanical properties can be further improved by deformation in the non-
recrystallisation temperature region and micro-alloying with additions of molybdenum,
vanadium or niobium. Alternatively, the cold rolling and annealing following the strip casting
could be another route to improve the mechanical properties of TRIP steel.
Figure 16. Comparison of mechanical properties for the studied steels and hot rolled TRIP steels from Nippon
Steel & Sumitomo Metal Corporation’s brochure [57].
5. Conclusions
A conventional TRIP steel (0.17C-1.52Si-1.61Mn-0.03Al wt. %) was produced using the
strip casting technique simulated in the laboratory. The conclusions of the present study are
as follows:
(1) A typical microstructure of TRIP steels, consisting of ~ 0.55 fraction of polygonal ferrite
with bainitic ferrite, granular bainite, RA and martensite, was obtained. Noticeably, a very
little amount of Widmänstatten ferrite was also observed.
(2) The distribution of the RA was non-uniform. It was predominantly located at the
interfaces between the polygonal ferrite and second phase regions, while some RA grains, in
the form of films and blocky islands, located inside the second phase regions. These RA
locations corresponded to the carbon enriched areas identified using EDS.
(3) Larger second phase regions had a lower RA fraction than the smaller second phase
regions.
(4) As a result of deformation, the ultimate tensile strength increased by 106 MPa while the
total elongation decreased by 0.01 after holding at 400 °C. The strengthening was mainly
ascribed to the microstructure refinement.

(5) The mechanical properties of studied TRIP steels produced using simulated deformation
during strip casting were comparable to the industrially manufactured TRIP 690 steel.
Acknowledgements:
This project was supported by the Australian Research Council (DP130101887). The JEOL
JSM-7001F FEG-SEM and JEOL JEM-ARM200F were funded by the Australian Research
Council (LE0882613 and LE120100104, respectively). The authors thank Dr. A.A. Gazder
and Dr. A.A. Saleh University of Wollongong for modification of the tensile stage and EBSD
mapping, respectively. The authors also thank Associate Professor N.E. Stanford for casting
of the flat samples at Deakin University.
References:
[1] A. Mertens, E.M. Bellhouse, J.R. McDermid, Mater. Sci. Eng. A 608 (2014) 249-257.
[2] R. Kuziak, R. Kawalla, S. Waengler, Arch. Civ. Mech. Eng. 8 (2008) 103-117.
[3] A.F. Mark, X. Wang, E. Essadiqi, J.D. Embury, J.D. Boyd, Mater. Sci. Eng. A 576 (2013) 108-117.
[4] R. Ranjan, H. Beladi, S.B. Singh, P.D. Hodgson, Metall. Mater. Trans. A 46A (2015) 3232-3247.
[5] H.X. Yin, A.M. Zhao, Z.Z. Zhao, X. Li, S.J. Li, H.J. Hu, W.G. Xia, Int. J. Min. Metall. Mater. 22 (2015)
262-271.
[6] E.V. Pereloma, A.A. Gazder, I.B. Timokhina, Mater. Sci. Forum 738 (2013) 212-216.
[7] E.V. Pereloma, H. Beladi, L. Zhang, I.B. Timokhina, Metall. Mater. Tran. A 43 (2012) 3958-3971.
[8] I.B. Timokhina, P. Hodgson, E.V. Pereloma, Metall. Mater. Tran. A 35 (2004) 2331-2341.
[9] E.V. Pereloma, P. Hodgson, Mater. Sci. Eng. A 251 (1998) 30-39.
[10] K. Sugimoto, N. Usui, M. Kobayashi, S. Hashimoto, ISIJ Int. 32 (1992) 1311-1318.
[11] E.V. Pereloma, I.B. Timokhina, P. Hodgson, Mater. Sci. Eng. A 273 (1999) 448-452.
[12] S. Li, R. Zhu, I. Karaman, R. Arroyave, Acta Mater. 61 (2013) 2884-2894.
[13] S. Li, R. Zhu, I. Karaman, R. Arroyave, Acta Mater. 60 (2012) 6120-6130.
[14] P.J. Jacques, J. Ladriere, F. Delannay, Metall. Mater. Trans. A 32 (2001) 2759-2768.
[15] R. Nooning Jr, C. Killmore, H. Kaul, A. Phillips, D. Edelman, P. Campbell, J. Williams, in: Proceedings of
the International Conference on Microalloyed Steels, 2007, pp. 16-19.
[16] K. Mukunthan, P.D. Hodgson, L. Strezov, N. Stanford, ISIJ Int. 53 (2013) 2152-2159.
[17] A.Z. Hanzaki, P.D. Hodgson, S. Yue, Metall. Mater. Trans. A 28 (1997) 2405-2414.
[18] A.B. Cota, C.A.M. Lacerda, F.L.G. Oliveira, F.A. Machado, F.G.D. Araujo, Scr. Mater. 51 (2004) 721-725.
[19] M. Arribas, B. Lopez, J.M. Rodriguez-Ibabe, Mater. Sci. Eng. A 485 (2008) 383-394.
[20] S. Kang, S. Yoon, S.J. Lee, ISIJ Int. 54 (2014) 997-999.
[21] S.J. Lee, J.S. Park, Y.K. Lee, Scr. Mater. 59 (2008) 87-90.
[22] M. Umemoto, K. Horiuchi, I. Tamura, Tetsu-to-Hagane 22 (1982) 854-861.
[23] S. Ge, M. Isac, R.I.L. Guthrie, ISIJ Int. 52 (2012) 2109-2122.
[24] N. Zapuskalov, ISIJ Int. 43 (2003) 1115-1127.
[25] M. Daamen, C. Haase, J. Dierdorf, D.A. Molodov, G. Hirt, Mater. Sci. Eng. A 627 (2015) 72-81.
[26] Z.P. Xiong, A.G. Kostryzhev, N.E. Stanford, E.V. Pereloma, Mater. Sci. Eng. A 651 (2016) 291-305.
[27] Z.P. Xiong, A.G. Kostryzhev, N.E. Stanford, E.V. Pereloma, Mater. Des. 88 (2015) 537-549.
[28] Z.P. Xiong, A.G. Kostryzhev, A.A. Saleh, L. Chen, E.V. Pereloma, Mater. Sci. Eng. A 664 (2016) 26-42.
[29] T. Dorin, N. Stanford, A. Taylor, P. Hodgson, Metall. Mater. Tran. A 46 (2015) 5561-5571.
[30] L. Strezov, J. Herbertson, ISIJ Int. 38 (1998) 959-966.
[31] H.Y. Gao, Z.X. Xie, Y. Yu, Y. Fang, J. Wang, B.D. Sun, ISIJ Int. 49 (2009) 546-552.
[32] Z.D. Li, Z.G. Yang, C. Zhang, Z.Q. Liu, Mater. Sci. Eng. 527 (2010) 4406-4411.
[33] M. El Mehtedi, S. Spinarelli, J. Zrnik, Metall. Ital. (2010) 5-10.
[34] A. Zarei-Hanzaki, S. Yue, ISIJ Int. 37 (1997) 583-589.
[35] S.J. Kim, C.G. Lee, I. Choi, S. Lee, Metall. Mater. Trans. A 32 (2001) 505-514.
[36] A.A. Gazder, F. Al-Harbi, H.T. Spanke, D.R. Mitchell, E.V. Pereloma, Ultramicroscopy 147 (2014) 114-
132.
[37] M. Takahashi, H. Bhadeshia, Mater. Trans. JIM 32 (1991) 689-696.
[38] E.V. Pereloma, I.B. Timokhina, M.K. Miller, P.D. Hodgson, Acta Mater. 55 (2007) 2587-2598.
[39] S.M.K. Hosseini, A. Zaeri-Hanzaki, S. Yue, Mater. Sci. Eng. A 618 (2014) 63-70.
[40] S. Yoon, S.J. Lee, ISIJ Int. 54 (2014) 1453-1455.

[41] J. An, Y.F. Wang, Q.Y. Wang, W.Q. Cao, C.X. Huang, Mater. Sci. Eng. A 651 (2016) 1-7.
[42] S.M.K. Hosseini, A. Zarei-Hanzaki, E. Essadiqi, S. Yue, Mater. Sci. Technol. Lond. 24 (2008) 1354-1361.
[43] K. Park, M. Nishiyama, N. Nakada, T. Tsuchiyama, S. Takaki, Mater. Sci. Eng. A 604 (2014) 135-141.
[44] F. Fazeli, M. Militzer, ISIJ Int. 52 (2012) 650-658.
[45] F. Fazeli, T. Jia, M. Militzer, Solid State Phenom. 172-174 (2011) 1183-1188.
[46] D. Gaude-Fugarolas, P.J. Jacques, ISIJ Int. 46 (2006) 712-717.
[47] F. Fazeli, X. Wang, ISIJ Int. 47 (2007) 1341-1350.
[48] F.G. Caballero, M.K. Miller, S.S. Babu, C. Garcia-Mateo, Acta Mater. 55 (2007) 381-390.
[49] M. Kumar, R. Sasikumar, P.K. Nair, Acta Mater. 46 (1998) 6291-6303.
[50] N.M. Xiao, M.M. Tong, Y.J. Lan, D.Z. Li, Y.Y. Li, Acta Mater. 54 (2006) 1265-1278.
[51] Y. Zhao, Q. Yan, L. Chen, X. Yuan, Acta Metall. Sin. 27 (2014) 389-394.
[52] I.B. Timokhina, E.V. Pereloma, P.D. Hodgson, Mater. Sci. Technol. Lond. 17 (2001) 135-140.
[53] Z.Z. Zhao, T.T. Tong, J.H. Liang, H.X. Yin, A.M. Zhao, D. Tang, Mater. Sci. Eng. A 618 (2014) 182-188.
[54] S. Takaki, Mater. Sci. Forum 654-656 (2010) 11-16.
[55] P.H. Chang, A.G. Preban, Acta Metall. 33 (1985) 897-903.
[56] N. Kamikawa, K. Sato, G. Miyamoto, M. Murayama, N. Sekido, K. Tsuzaki, T. Furuhara, Acta Mater. 83
(2015) 383-396.
[57] http://www.nssmc.com/en/.