High Speed Truck - Market Analysis
56
U.S. Department of Transportation Federal Railroad Administration HIGHER SPEED FREIGHT TRUCK MARKET ANALYSIS Office of Research and Development Washington, DC 20590 DOT/FRA/ORD-13/32 Final Report July 2013
Transcript of High Speed Truck - Market Analysis

U.S. Department of Transportation
Federal Railroad Administration
HIGHER SPEED FREIGHT TRUCK MARKET ANALYSIS
Office of Research and Development Washington, DC 20590
DOT/FRA/ORD-13/32 Final Report July 2013

NOTICE
This document is disseminated under the sponsorship of the Department of Transportation in the interest of information exchange. The United States Government assumes no liability for its contents or use thereof. Any opinions, findings and conclusions, or recommendations expressed in this material do not necessarily reflect the views or policies of the United States Government, nor does mention of trade names, commercial products, or organizations imply endorsement by the United States Government. The United States Government assumes no liability for the content or use of the material contained in this document.
NOTICE
The United States Government does not endorse products or manufacturers. Trade or manufacturers’ names appear herein solely because they are considered essential to the objective of this report.

i
REPORT DOCUMENTATION PAGE Form Approved OMB No. 0704-0188
Public reporting burden for this collection of information is estimated to average 1 hour per response, including the time for reviewing instructions, searching existing data sources, gathering and maintaining the data needed, and completing and reviewing the collection of information. Send comments regarding this burden estimate or any other aspect of this collection of information, including suggestions for reducing this burden, to Washington Headquarters Services, Directorate for Information Operations and Reports, 1215 Jefferson Davis Highway, Suite 1204, Arlington, VA 22202-4302, and to the Office of Management and Budget, Paperwork Reduction Project (0704-0188), Washington, DC 20503.
1. AGENCY USE ONLY (Leave blank)
2. REPORT DATE July 2013
3. REPORT TYPE AND DATES COVERED Technical Report
4. TITLE AND SUBTITLE MARKET ANALYSIS: VALIDATION OF A 70-TON HIGHER SPEED FREIGHT TRUCK DESIGN FOR OPERATIONS UP TO 125 MPH
5. FUNDING NUMBERS BAA-2010-1
DTFR53-11-C-00009
6. AUTHOR(S) Sharma & Associates, Inc. 7. PERFORMING ORGANIZATION NAME(S) AND ADDRESS(ES) Sharma & Associates, Inc. 5810 S. Grant Street Hinsdale, Illinois 60521
8. PERFORMING ORGANIZATION REPORT NUMBER
9. SPONSORING/MONITORING AGENCY NAME(S) AND ADDRESS(ES) U.S. Department of Transportation Federal Railroad Administration Office of Railroad Policy and Development Office of Research and Development Washington, DC 20590
10. SPONSORING/MONITORING AGENCY REPORT NUMBER
DOT/FRA/ORD-13/32
11. SUPPLEMENTARY NOTES COTR: S. K. Punwani 12a. DISTRIBUTION/AVAILABILITY STATEMENT This document is available to the public through the FRA Web site at http://www.fra.dot.gov.
12b. DISTRIBUTION CODE
13. ABSTRACT (Maximum 200 words) A market analysis was conducted on behalf of FRA to determine the viability for implementation of higher speed freight rail service in anticipation of high-speed passenger rail service on upgraded freight rail corridors.
The analysis focused on the potential need for higher speed freight service in planned higher speed passenger rail corridors and other channels. The market analysis revealed additional unforeseen revenue potential for freight railroads in the form of dedicated train sets like refrigerator car trains, long distance produce shipments, and overnight city pairs, among others.
The potential additional rail revenue from higher speed freight that has been identified for freight railroads could exceed $4.6 billion annually. It is projected that that amount would add approximately $460 million to the freight railroads’ annual profit stream. Additionally, there is at least some percentage of another potential $28 billion annual market in long distance road transportation that could be converted to rail, if it included higher speed freight service. 14. SUBJECT TERMS Average freight train speed, economic analysis, breakeven analysis, high speed freight truck, high-speed passenger trains, highway truck, market analysis, intermodal traffic, operating railroads’ perspective, premium revenue rail network, reduced exhaust emission, refrigerated goods, shelf life sensitive and time-sensitive produce and commodities, team-driven truck
15. NUMBER OF PAGES 56
16. PRICE CODE
17. SECURITY CLASSIFICATION OF REPORT Unclassified
18. SECURITY CLASSIFICATION OF THIS PAGE Unclassified
19. SECURITY CLASSIFICATION OF ABSTRACT Unclassified
20. LIMITATION OF ABSTRACT
NSN 7540-01-280-5500 Standard Form 298 (Rev. 2-89) Prescribed by ANSI Std. 239-18
298-102

ii
METRIC/ENGLISH CONVERSION FACTORS
ENGLISH TO METRIC METRIC TO ENGLISH
LENGTH (APPROXIMATE) LENGTH (APPROXIMATE) 1 inch (in) = 2.5 centimeters (cm) 1 millimeter (mm) = 0.04 inch (in) 1 foot (ft) = 30 centimeters (cm) 1 centimeter (cm) = 0.4 inch (in)
1 yard (yd) = 0.9 meter (m) 1 meter (m) = 3.3 feet (ft) 1 mile (mi) = 1.6 kilometers (km) 1 meter (m) = 1.1 yards (yd)
1 kilometer (km) = 0.6 mile (mi)
AREA (APPROXIMATE) AREA (APPROXIMATE) 1 square inch (sq in, in2) = 6.5 square centimeters (cm2) 1 square centimeter (cm2) = 0.16 square inch (sq in, in2)
1 square foot (sq ft, ft2) = 0.09 square meter (m2) 1 square meter (m2) = 1.2 square yards (sq yd, yd2) 1 square yard (sq yd, yd2) = 0.8 square meter (m2) 1 square kilometer (km2) = 0.4 square mile (sq mi, mi2) 1 square mile (sq mi, mi2) = 2.6 square kilometers (km2) 10,000 square meters (m2) = 1 hectare (ha) = 2.5 acres
1 acre = 0.4 hectare (he) = 4,000 square meters (m2)
MASS - WEIGHT (APPROXIMATE) MASS - WEIGHT (APPROXIMATE) 1 ounce (oz) = 28 grams (gm) 1 gram (gm) = 0.036 ounce (oz) 1 pound (lb) = 0.45 kilogram (kg) 1 kilogram (kg) = 2.2 pounds (lb)
1 short ton = 2,000 pounds (lb)
= 0.9 tonne (t) 1 tonne (t)
= =
1,000 kilograms (kg) 1.1 short tons
VOLUME (APPROXIMATE) VOLUME (APPROXIMATE) 1 teaspoon (tsp) = 5 milliliters (ml) 1 milliliter (ml) = 0.03 fluid ounce (fl oz)
1 tablespoon (tbsp) = 15 milliliters (ml) 1 liter (l) = 2.1 pints (pt) 1 fluid ounce (fl oz) = 30 milliliters (ml) 1 liter (l) = 1.06 quarts (qt)
1 cup (c) = 0.24 liter (l) 1 liter (l) = 0.26 gallon (gal) 1 pint (pt) = 0.47 liter (l)
1 quart (qt) = 0.96 liter (l) 1 gallon (gal) = 3.8 liters (l)
1 cubic foot (cu ft, ft3) = 0.03 cubic meter (m3) 1 cubic meter (m3) = 36 cubic feet (cu ft, ft3) 1 cubic yard (cu yd, yd3) = 0.76 cubic meter (m3) 1 cubic meter (m3) = 1.3 cubic yards (cu yd, yd3)
TEMPERATURE (EXACT) TEMPERATURE (EXACT)
[(x-32)(5/9)] °F = y °C [(9/5) y + 32] °C = x °F
QUICK INCH - CENTIMETER LENGTH CONVERSION10 2 3 4 5
InchesCentimeters 0 1 3 4 52 6 1110987 1312
QUICK FAHRENHEIT - CELSIUS TEMPERATURE CONVERSIO -40° -22° -4° 14° 32° 50° 68° 86° 104° 122° 140° 158° 176° 194° 212°
°F
°C -40° -30° -20° -10° 0° 10° 20° 30° 40° 50° 60° 70° 80° 90° 100°
For more exact and or other conversion factors, see NIST Miscellaneous Publication 286, Units of Weights and Measures. Price $2.50 SD Catalog No. C13 10286 Updated 6/17/98

iii
Contents
Executive Summary ........................................................................................................................ 1
1. Historical Review .................................................................................................................... 4 1.1 Mail and Express................................................................................................................. 4 1.2 Perishables .......................................................................................................................... 5
2. Over-the-Road Trucking ......................................................................................................... 6 2.1 Driver Hours-of-Service Regulations Determine Average Speed ...................................... 6 2.2 Own Account or Private Trucking ...................................................................................... 7
3. Situation ................................................................................................................................... 8 3.1 Rail Market Share ............................................................................................................... 8 3.2 Short Distance Intermodal .................................................................................................. 9 3.3 Long Distance Intermodal................................................................................................. 11 3.4 Comparison of Transit Time by Mode.............................................................................. 11 3.5 Current Priority or Higher Speed Freight Train Services ................................................. 13 3.6 Developing Higher Speed Services .................................................................................. 14 3.7 Other Current Services ...................................................................................................... 14 3.8 Current Situation Summary .............................................................................................. 14
4. Potential Revenue from Higher Speed Freight Trains .......................................................... 16 4.1 Food Products ................................................................................................................... 17
4.1.1 Fresh produce—fruits and vegetables ................................................................ 18
4.1.2 The logistics for shipment of fruits and vegetables ........................................... 20
4.1.3 Other food products ........................................................................................... 24
4.1.4 Potential railroad revenue from produce (shifting transport modes) ................. 24
4.2 Package and Courier Service ............................................................................................ 25 4.3 Less than Truck Load Freight ........................................................................................... 29 4.4 Intermodal ......................................................................................................................... 32
4.4.1 Short distance intermodal .................................................................................. 32
4.4.2 Short distance intermodal overnight .................................................................. 33
4.4.3 Longer distance intermodal (more than 700 miles) ........................................... 35
5. Considerations in Developing Higher Speed Freight Trains ................................................. 36 5.1 Line Capacity Considerations ........................................................................................... 36 5.2 Relationship to Higher Speed Passenger Services ............................................................ 36
5.2.1 Federal and State high-speed rail programs ....................................................... 37
5.2.2 Higher speed freight trains on high-speed corridors .......................................... 38
5.2.3 Sharing infrastructure costs with intercity passenger trains .............................. 39
5.2.4 The Costs of Operating Higher Speed Freight Trains ....................................... 39
5.2.5 Breakeven Train Revenue .................................................................................. 41

iv
5.3 Computerized Dispatching................................................................................................ 41 5.4 Spillover Improvements in Standard Truck Design.......................................................... 42 5.5 The Basic Argument in Favor of Higher Speed Freight Trains ........................................ 42
5.5.1 Operating Issues ................................................................................................. 43
6. Technical Characteristics Of Higher Speed Freight Truck ................................................... 44
7. Conclusions ........................................................................................................................... 45
Abbreviations and Acronyms ....................................................................................................... 47

v
Illustrations
Figure 1. Average truck speeds ....................................................................................................... 6
Figure 2. U.S. rail and truck tons by length of haul ........................................................................ 8
Figure 3. U.S. rail and truck ton-miles by length of haul ............................................................... 9
Figure 4. Total transit time for short distances at various average train speeds (mph) .................. 9
Figure 5. Total transit time for long distances at various average train speeds (mph) ................. 11
Figure 6. Los Angeles to Chicago Transit Times ......................................................................... 12
Figure 7. Package and Courier Services, tons and ton-miles ........................................................ 25
Figure 8. Conventional and container-on-flat-car freight train resistance .................................... 39

vi
Maps
Map 1. Current Amtrak passenger and primary potential higher-speed freight routes ................ 16
Map 2. Service standards for shipment from Los Angeles (Source: FedEx)................................ 30
Map 3. Major U.S. Population Centers ......................................................................................... 35
Map 4. Proposed higher- and true high-speed passenger corridors .............................................. 37

vii
Tables
Table 1. U.S. consumption of food and beverages with rail share of transportation .................... 17
Table 2. Estimate of annual tonnage of fruits and vegetables consumed by location .................. 18
Table 3. Typical retail prices in New York................................................................................... 20
Table 4. Comparison of Field to Distribution Center for California to Northeast for Rail and Road ...................................................................................................................................... 21
Table 5. Current Train Transit Time and Average Speed in MPH ............................................... 22
Table 6. Estimated Prorated Revenue per Car Based on Cost of Alternative Modes ................... 22
Table 7. Estimate of the Value to Shipper of Higher Speed Mode of Transportation .................. 23
Table 8. Possible Annual Revenue from the Operation of Higher Speed Produce Freight Trains24
Table 9. Estimate Value of Retail Shelf Life Gained by Higher Speed Trains ............................ 25
Table 10. UPS Packages by Class of Service ............................................................................... 26
Table 11. Packages tons per Day by Class of Service and Distance ............................................ 26
Table 12. Estimate of Potential UPS Trucks or Containers a Day by Corridor ............................ 27
Table 13. Estimate of Hours for Rail and Trucks for SW to NE Transportation of 53’ Containers............................................................................................................................................... 28
Table 14. Higher Speed Package Train Revenue.......................................................................... 29
Table 15. Time and cost estimate to provide line haul cost from Los Angles to New York ........ 31
Table 16. Traffic Lanes ................................................................................................................. 31
Table 17. Higher-speed intermodal train revenue, NE-SW traffic ............................................... 32
Table 18. Estimated Time and Cost for 400 miles at Various Rail Speeds .................................. 33
Table 19. Higher Speed will Create Additional Overnight Intermodal Service ........................... 34
Table 20. Estimating the increase in operating cost for higher speed .......................................... 41

1
Executive Summary
The purpose of the market research was to determine the viability for implementation of higher speed freight rail service, considering the benefits of the promulgation of high-speed passenger service. Sharma & Associates, Inc. (SA) conducted a comprehensive market survey and economic analysis that focused on the potential need for higher speed freight service in projected higher speed passenger rail corridors and other channels. The market analysis revealed additional unforeseen revenue potential in the form of dedicated train sets like refrigerator car trains, long distance produce shipments, and overnight city pairs. The overall potential for additional rail revenue from higher speed freight that has been identified, to date, for freight railroads could exceed $4.6 billion annually. It is projected that that amount would add approximately $460 million to the freight railroads’ annual bottom line. Additionally, there is at least some percentage of another potential $28 billion annual market in long distance road transportation that could be converted to rail, if higher speed freight service were included (not included in the table below).
Currently Identified Product Added Revenue
Produce $3.1 billion
Produce shelf life extension $602 million
Other temp-controlled product 10 to 15% of produce ($370 to $555 million)
Parcel (UPS, FedEx, etc.) $54 million
Intermodal overnight $150–250 million
Less than truck load $375 million
TOTAL $4.651–$4.936 billion
According to the 2010 Census Bureau survey, in the next 25 years, the U.S. population will grow from 297 million to 364 million. At the same time, according to U.S. Department of Transportation (U.S. DOT) estimates, railroad freight tonnage will grow by 88 percent. These two factors will create opportunities for moving time-sensitive shipments of consumer goods and necessities in the congested rail network with increased speed and improved efficiency. To realize the revenue potential identified, the average freight train speed will have to increase from the current average speed of 38 mph to between 55 and 60 mph in order to manage high-priority shipments (double stack and TOFC/COFC). Such average train speeds can be achieved with a truck with stable dynamic performance at maximum operating speeds in the range of 90–110 mph. Potentially, this higher average speed will allow railroads to offer competitive

2
schedules to team-driven trucks, which command premium revenue for transporting shelf life sensitive and time-supersensitive produce and commodities. Perishable produce is one of the most easily identifiable products for which shipment time is of the essence. Produce has high potential because most produce is grown in the West and Southwest and the majority of the consumption is in the East and Midwest, 2,300 to 3,200 miles away. Produce falls into three categories: short shelf life 6–10 days (berries, processed lettuce, and herbs—shipped by team-driven trucks); medium shelf life 10–28 days (leaf vegetables, some citrus fruits—shipped by single driver truck); and long shelf life 28 days or more (root vegetables, apples—usually shipped by truck, but increasingly by rail). A railroad freight car has the advantage of being able to carry three to four truckloads in a single car. If trains contain all three produce categories, then rail not only has the advantage of speed over truck, it also has the advantage of being able to carry more weight. This makes possible revenue of about $350 per train-mile for a 55-car train, which is about three times the average rail revenue collected today for general freight. Further, by transferring a portion of the West to East traffic to rail, approximately 1,000 trucks a day will be removed from highways and roads which would be environmentally and economically beneficial for the country. With the increased demand for more shipping of freight by rail to meet future population growth, this number is projected to be much higher in the future. Removing trucks from a severely congested highway system would create very real tangible public benefits as far as reduced over-the-road fatalities, reduced dependency on oil and diesel, and greatly reduced exhaust emissions which will reduce public health risks caused by exhaust pollutants. There is also a market for overnight freight rail, which can be logistically significant over distances of between 400 and 600 miles. There are about six city pairs that fall into this distance band, and based on the success of Canadian Pacific’s (CP) Expressway service, implementing overnight freight rail services in those regions could increase rail revenue by $150 to $250 million a year. Operating a higher speed passenger train requires investment in infrastructure and signaling systems. Currently, railroads are reluctant to make this investment because they would only be able to recover their cost on an incremental basis and faster trains consume line capacity. Therefore, our analysis has concluded that higher speed freight would be operated as a second section, just ahead or behind, the passenger train. Such an arrangement would significantly reduce the line capacity concerns and would enable the railroads to operate very profitable freight trains, fully or at least partially offsetting the costs of providing capacity for the passenger train. In other words, freight railroads would actually profit from the operation of premium service, higher speed freight trains on the high-speed passenger routes they support. A preliminary breakeven analysis shows that in comparison with the revenue per train-mile of $118 and operating income of $29 per train-mile for existing freight trains, a produce train could

3
have revenue in the range of $340 per train-mile—even in the worst case scenario there could be an approximately $70 per train-mile contribution to overhead and profit. In the past, railroads made use of higher speed trains for handling mail and express. The additional revenue generated from that service was able to significantly improve the financial viability of the passenger train. The current interest in developing higher speed passenger trains that make use of that public infrastructure investment has created similar opportunities for higher speed freight. The views and perspectives of operating railroads were sought on the observations and conclusions reached through this market analysis effort. Two major (Class 1) North American railroads were approached and were given a presentation on the market analysis work. Both railroads were interested in the approach taken for the market analysis, the underlying assumptions made, and the opportunities and challenges addressed. The railroads were very receptive to the work and expressed interest in furthering the research that would lead to development of higher speed freight technology. One of the railroads provided a written letter (attached at the end of this document) as a statement of encouragement and testament to its interest in the effort.

4
1. Historical Review
When railroads were the universal mode of ground transportation in the United States, a few classes of freight traffic required expedited handling because of the generally slow and variable speed of ordinary freight car movement. This “time-sensitive” traffic was composed of: • Mail,
• Express,
• Perishables, and
• Less-than-carload (LCL) shipments. Over time, all general merchandise traffic became more time-sensitive because of the increasing speed of highway transport; this change led to the development of rail intermodal service to improve competitiveness. Historical railroad experience with these classes of traffic is described below, along with lessons learned that are applicable to the viability of a higher speed freight train operation.
1.1 Mail and Express Mail and Express by rail in the passenger train era Until the advent of Amtrak 40 years ago, the passenger business of a North American railroad included a sizable Mail and Express component. With specialized equipment suitable for operation in passenger trains, this traffic was handled on the head end of regular passenger trains or in dedicated Mail and Express trains operating at passenger-train speeds on specific schedules. In the year 1926 (when rail passenger service revenues last exceeded direct and apportioned expenses), Mail and Express business accounted for 18 percent of passenger service revenues1. As late as World War II, the Railway Express Agency (REA) was handling 97 percent of all express freight in the United States2. The ever-shrinking passenger train network forced the U. S. Postal Service (USPS) and REA to turn increasingly to highway transportation. Once initiated, this shift took on a life of its own. Since two overlapping networks generally cost more than one universal network, there was now a financial incentive to push all Mail and Express traffic onto the highway system, the only universal network available. Mail and Express in the Amtrak era Once Amtrak assumed operation of U.S. intercity passenger trains in 1971, it became apparent that the economics of the highway system were only modestly better than they had been with the previous system. One attempt to increase per-train-mile revenue involved adding storage mail cars to the head end of some of the passenger trains. After the supply of baggage cars available
1 Passenger Traffic Report of the Federal Coordinator of Transportation, January 17, 1935 2 Railway Prototype Cyclopedia, Volume 6 (2001), p.9

5
for this service was exhausted, 140 so-called Material Handling Cars (MHCs) were constructed by Thrall Car Manufacturing Company in 1986 and 1988. The MHCs were short-lived and were embargoed in 2003 and eventually retired. A more extensive effort was made with the Amtrak Express service (though the definition of “express” was much more like “freight” than in the Railway Express era). Specially modified freight cars were attached to the end of Amtrak’s long distance passenger trains. Amtrak Express had a partnership with ExpressTrak LLC for movement of time and temperature sensitive cargo, leading to an order by the latter of 109 refrigerator cars in February 2001. While the Express service operated, it attracted produce, live chickens, mail, and express parcel services. In addition, the service was able to attract a limited amount of general freight as backhaul with what was essentially a subsidized freight rate. Amtrak Express and the storage mail services were terminated in October 2004 because of a variety of mechanical (truck design), operational, financial, and legal issues. Both the mail and Amtrak Express services compromised the reliability and convenience of the passenger part of the operation (Amtrak’s raison d'être) and suffered from the limitations of current nonpassenger car truck designs in high-speed service. They did, however, demonstrate the existence of a market for higher speed, high-priority rail freight service. The size of the market has yet to be determined based on service quality and competitiveness.
1.2 Perishables North American railroads once operated high-priority, faster freight trains for perishable traffic (fruits, vegetables, and meat) requiring en route refrigeration. There was also a sizable movement of livestock, and of other perishables not requiring refrigeration, such as watermelons and bananas. Special stock cars were used to handle cattle and hogs, and insulated boxcars were used to provide stable shipping temperatures for the nonrefrigerated produce, if required.

6
2. Over-the-Road Trucking
Over-the-road trucking is the universal mode of transporting intercity freight in North America. The speed, flexibility, convenience, and reliability of highway transport have relegated the other ground transportation modes to niches for shippers who value lower prices more than they dislike slower and sometimes less reliable rail service. The principal competitive characteristics of highway transport are the effective average speed at various distances, the amount of freight that can be carried in a single vehicle, and the cost per truck-mile.
2.1 Driver Hours-of-Service Regulations Determine Average Speed Over-the-road trucking is usually performed by solo drivers. Under current hours-of-service (HOS) regulations, a solo driver can usually cover 500 miles before taking a mandatory 10-hour rest break. The HOS regulations in effect mean that a solo driver on a long haul can cover at most 1,350 miles every 48 hours3. A full coast-to-coast run takes approximately 5 days. Dock-to-dock average speed declines with distance as the driver is forced to take a rest break after every 11 hours of driving; it may fall to 25 mph on the longest runs. In the case of high-priority (time-sensitive) freight going more than 500 miles, a team of two drivers can cover approximately 2,250 miles in 48 hours (e.g., 2 days from Los Angeles to Chicago) and complete a coast-to-coast run in less than 3 days4. The dock-to-dock average speed for high-priority freight under favorable driving conditions is approximately 47 mph to any destination in the country. Parcel and less-than-truck load (LTL) carriers operating regular routes among terminals in their service areas can sometimes use relay drivers as an alternative to team-driven trucks. Relays combine the speed of a team-driven truck with the economy of a solo driver.
3 Con-way Truckload Transit Time Chart, at https://www.con-way.com/en/truckload/Tools-TransitTimeChart 4 Con-way Truckload, op. cit.

7
Figure 1. Average truck speeds
The effect of the HOS regulations on average over-the-road speed at various distances is depicted in Figure 1 (for both solo drivers and teams). This chart represents a “best case” scenario based on fully rested drivers and favorable driving conditions. Once past the single-day driving radius, a solo driver’s average speed collapses to between 25 and 30 mph, whereas the team continues on at about 47 mph.
2.2 Own Account or Private Trucking According to the 2007 Commodity Flow Survey5, “own account” trucking (shippers using their own highway trucks) comprises approximately 53 percent of all highway freight movement in terms of tons. In terms of ton-miles, it only comprises approximately 22 percent because the average “own account” distance in the United States is only 57 miles. The U.S. average for for-hire trucking haul is 599 miles and the average U.S. rail haul is 728 miles. This suggests that U.S. for-hire truckers are competing almost directly with railroads in terms of distance. It also indicates that railroads are not providing the service that many small-volume shippers need and are therefore losing market share to long distance trucking, which includes freight rates that are typically 20 to 25 percent higher.
5 U.S. Department of Transportation, Research and Innovative Technology Administration, Bureau of Transportation Statistics and U.S. Census Bureau, 2007 Commodity Flow Survey.

8
3. Situation
3.1 Rail Market Share The 2007 Commodity Flow Survey data for road and rail show that, overall, railroads transport 21 percent of the tonnage shipped in the United States (see Figure 2). Because 87 percent of the total tonnage is transported less than 500 miles, it would derive limited benefit from higher speed freight trains. Rail in effect handles more than 59 percent of freight being transported 500 miles or more. This scenario should be viewed in light of the pressures on the national highway and railway infrastructure to handle an 88 percent increase in freight tonnage over the current levels6 due to the forecasted population increase. The limited space available for adding new and larger highways, the probability of congested rail lines, and the need for increased throughput will require higher freight rail speeds. Rail networks with current relatively low average operating speeds should be better equipped to meet those demands by raising operating speeds.
Figure 2. U.S. rail and truck tons by length of haul
Source: 2007 Commodity Flow Survey
In terms of overall ton-miles, rail handles approximately 40 percent (see Figure 3). However, about 50 percent of these ton-miles are from coal production in which there is little or no competition because of the number of locations of coal mines and points of consumption. Of the total national road and rail ton-miles, rail handles 11.5 percent of the traffic of less than 500 miles, and only 4.6 percent of the ton-miles moving less than 250 miles. Traditionally, railroad
6 National Rail Freight Infrastructure Capacity and Investment Study prepared for the Association of American Railroads by Cambridge Systematics, Inc. 2007

9
revenue is based on ton-miles and has been generated by long distance hauls of more than 500 miles. Railroads handle most of the large volume train load business and essentially none of the remaining 40 percent of lower volume traffic. Using an assumed freight rate of $0.03 per ton-mile, the longer distance freight that could definitely benefit from higher speed represents $28 billion worth of traffic if it can be switched to rail.
Figure 3. U.S. rail and truck ton-miles by length of haul
Source: 2007 Commodity Flow Survey
3.2 Short Distance Intermodal Frequent reports in the trade press demonstrate an increased interest from trucking companies in using intermodal trains for “shorter” hauls. But the largest truck line using rail intermodal, J.B. Hunt Transport, still has an average haul of more than 1,700 miles in its intermodal unit7. It is very difficult for existing intermodal services to be service-competitive door-to-door within the solo driver’s single-day driving radius of approximately 500 miles when drayage and ramp times are added to the train schedules. Given the time and cost factors involved, it is no accident that the only currently successful short distance intermodal train in North America is CP “Expressway,” discussed later in the report.
7 J.B. Hunt Annual Report on Form 10-K, 2010.

10
Total Time at Various Average Speeds and Distances
0
5
10
15
20
25
30
35
40
45
0 200 400 600 800 1000Distance (Miles)
Tota
l Tim
e (H
ours
)
35MPH
50MPH
75MPH
100MPH
125MPH
1 Driver
2 Drivers
Figure 4. Total transit time for short distances at various average train speeds (mph)
As shown in Figure 4, once the solo truck driver has to take a rest break, current high-priority intermodal trains are relatively competitive, as far as speed is concerned, in the 500 to 1,000 mile distance band. But time penalties during drayage and at the ramps, as well as the line haul cost considerations, are what determine whether traffic can move by intermodal service. Currently, the breakeven distance is thought to be around 750 miles. Intermodal trains are now reliable enough to support a new effort to capture some of the highway traffic at lengths of haul of 600 miles8. The potential of higher speed, short distance intermodal trains is further discussed in the following sections.
8 “Rails try new route to intermodal growth” by Mark B. Solomon, July 4, 2011 on dcvelocity.com.

11
3.3 Long Distance Intermodal When rail is competing for long distance highway traffic, driver HOS regulations give rail a distinct advantage over solo-driven trucks, but not necessarily over team-driven ones. Figure 5 shows that for a typical Class 1 intermodal train with an average speed of 35 mph, the transit time is faster than for a single truck driver for long distances. In addition, it shows that against a team of drivers, the average rail speed needs to be near 60 mph.
Total Time at Various Average Speeds and Distances
0
20
40
60
80
100
120
140
0 500 1000 1500 2000 2500 3000 3500
Distance (Miles)
Tota
l Tim
e (H
ours
)
35MPH
50MPH
75MPH
100MPH
125MPH
1 Driver
2 Drivers
Figure 5. Total transit time for long distances at various average train speeds (mph)
3.4 Comparison of Transit Time by Mode From readily available transit data for rail, there are significant modal differences between the following: Maximum train speed—typically 60 or 70 mph for priority freight
Average train speed—average over the route speed (originating terminal to destination terminal), typically 30 to 35 mph for priority freight
Intermodal average speed—average speed for a container entering originating terminal to pick up at destination, typically 28 to 32 mph for priority freight on long distances
Passenger trains on the same or similar priority freight routes have maximum speeds in the 60 to 80 mph range and, depending on the route, most average 50 to 58 mph. The advertised schedule times for BNSF Railway (BNSF) intermodal indicate that priority freight trains bypass the terminals, but are still significantly slower than passenger trains, with a difference much greater than maximum speeds would indicate. This further indicates that intermodal trains are not given the same priority as passenger trains.

12
A comparison of door-to-door times for Los Angeles to Chicago shows that BNSF services are competitive with single-driver trucks (see Figure 6). The time is 50 percent longer than with a team of drivers. Note that a freight train operating on a passenger train schedule would be similar, as far as time is concerned, to a team-driven truck.
Figure 6. Los Angeles to Chicago Transit Times
This chart encourages an investigation of why the fastest TOFC trains average a 50 percent longer door-to-door time than team-driven trucks. One possible reason is the dispatching priority of the trains. This issue should be studied to determine if there is significant time spent waiting or running under slow orders. Current Amtrak average passenger train speeds, including stops are as follows:
• Southwest Chief—53 mph
• Texas Eagle—40 mph
• City of New Orleans—48 mph
• Empire Builder—50 mph
• California Zephyr—57 mph (Chicago Denver only)
• Lake Shore Limited—53 mph
For scheduling purposes, Amtrak operates up to 79 mph on the Western routes, although 90 mph is legally possible on certain stretches. Note that there are also some 90 mph sections outside of the Northeast Corridor in the East.

13
3.5 Current Priority or Higher Speed Freight Train Services Today there are only a few freight trains operated by railroads at significantly higher-than-average speeds. Most are operated at speeds that are only 10 to 20 mph faster than general manifest or intermodal trains. More importantly, they are given higher operating priority, which allows their average train speed to reach the upper 30 mph level (which is not necessarily faster than Amtrak). There are a few trains, primarily those transporting produce and express packages, that are operated on a priority basis; the relevant ones are described below:
Tropicana Juice Train Starting in 1971, railroads have handled, as a priority train or service, Tropicana orange juice from Florida to warehouses in Jersey City, NJ, City of Industry, CA, and Cincinnati, OH.
There are currently 458 mechanical refrigerator cars bearing Tropicana’s TPIX reporting mark assigned to the service. The 109 older cars are rated at 263,000 pound (lb) gross rail load (GRL) and are restricting to a maximum speed of 65 mph. The 369 newer cars are longer and wider and rated at 286,000 lb GRL. Their cubic capacity was increased by moving to externally mounted refrigeration units. The method of packaging orange juice is changing and it is expected that they will only load to about 260,000 lb gross weight. The New Jersey train schedule is 43 hours with an average overall speed of 28 mph. Deducting the 11 hours used for switching in Jacksonville, FL, the average road speed for the New Jersey train is 38 mph. Northbound, the train is usually operated as an extra section of sorts to ‘The Carolinian’ passenger train, but is significantly slower than Amtrak’s 53 mph average on this route. If higher speed trucks were used, a 24-hour schedule could possibly be achieved. Southbound, the cars are currently consolidated into manifest freight trains.
Railex Railex is a relatively new company that specializes in the shipment and distribution of fruits and vegetables. The company has contracted with Union Pacific (UP) and CSX to operate dedicated unit trains of refrigerated cars traveling from a single-point origin to a single-point destination. Their logistics subsidiary company picks up produce in short haul trucks, brings it to a strategically located warehouse in Southern California, loads it into refrigerated boxcars, moves it across the country in 5 days, and then distributes it to destination again by short-haul truck. The shippers have flexibility in that they can move anywhere from 10 pallets to 10,000 pallets. Railex leases the refrigerated 64-foot cars from a UP subsidiary, sufficient to equip 8 train sets of 55 cars. Currently, they offer four services weekly from the West Coast to Rotterdam, NY. The services originate in Delano, CA, and in Wallula, WA. The railroad guarantees a 5-day service and the transit time is usually 4.5 days.

14
Initially, shippers only entrusted Railex with long shelf life produce such as carrots and potatoes, but as confidence in the quality and reliability of the service improved, the shippers added leafy vegetables. A limited amount of short shelf life produce is now being shipped until the transit time is reduced to approximately 3 days. The company estimates that with higher speed freight trucks and a transit time reduced to 3 days, it might double revenues.
Green Zephyr Green Zephyr negotiated an agreement with BNSF to deliver a block of refrigerated cars carrying produce from Fresno, CA, to a distribution facility in Bethlehem, PA, within 75 hours. Between California and Chicago, the cars are attached to a priority TOFC train. In Chicago, the block is transferred to the Norfolk Southern yard where the block is attached to a manifest train. The company is currently negotiating with the railroads to operate a dedicated train.
3.6 Developing Higher Speed Services In the three examples discussed above, the effort to develop these priority rail services was largely initiated by the user organizations themselves and not the railroads. Currently, railroads do not seem to regard priority freight as having significant revenue potential. The revenue potential based on promulgation of the high-speed passenger plans and this study’s newfound higher speed freight possibilities are rather significant and might be the beginning of a change in that perception.
3.7 Other Current Services UPS TOFC service offers climate-controlled trailers for perishable products such as produce, flowers, poultry, beverages, and other nonhazardous materials that need protection from the heat or cold. ‘Cold Train’ or Pacific Northwest-Chicagoland Express Cold Train Intermodal Service – Cold Train is a relatively new company that is shipping produce from the Pacific Northwest to the Midwest. Five days a week, containers of fresh or frozen produce destined for the Midwest are shipped on intermodal trains that reach Chicago in 4 days. C.R. England’s ‘TempStack’ is a newly formed division of a well-known freight company that currently has a fleet of 300 refrigerated containers. The containers are shipped on mixed customer double stack trains. All these containers are equipped with remote monitoring.
3.8 Current Situation Summary This section has addressed the current state of unique and higher speed freight service in this country. Section 4 will discuss the potential revenue from future unique and higher speed freight trains based on the following currently identified products and channels of transport:

15
• Food Products
• Package and Courier Service
• Less than Truck Load Freight
• Intermodal

16
4. Potential Revenue from Higher Speed Freight Trains
Most U.S. mainline track is maintained in Class 4 condition (60 mph for freight and 80 mph for passenger) and signaled for no more than 79 mph. There is some Class 5 track (90 mph for passenger and 80 mph for freight) where priority freight trains are operated—usually at 70 mph because of equipment limitations. Above Class 5, FRA rules accept freight operations at passenger speeds—provided that the static and dynamic loads are no greater than those of the passenger locomotive. In addition, the freight train must be capable of stopping within the signaling distances for that specific track. For the purposes of this study, it is assumed that higher speed freight trains would be operated primarily on the existing Amtrak passenger train routes shown on Map 1, which have been upgraded for higher speeds.
Map 1. Current Amtrak passenger and primary potential higher speed freight routes

17
Some segments of the proposed high-speed corridors could potentially be part of long distance higher speed freight routes. Delivering freight faster cannot be justified simply by the time value of the money invested in the product being shipped. A few hours or even a few days saved will not usually justify the extra cost of the fuel for higher speed freight. However, there are a number of products that have a short shelf life or specific delivery requirements that can justify significant additional costs. These products are primarily food products such as produce, seafood, dairy, and time-sensitive mail and express goods.
4.1 Food Products Many food products deteriorate in quality with age, and some products become inedible or unacceptable after relatively short periods of time. Those products with rapid deterioration of quality and short shelf lives could benefit from higher speed freight trains. Altogether, the United States consumes approximately 275 million tons of food and 100 million tons of beverages per year, as shown in Table 1 below. Of this amount, rail transports only approximately 16 percent of the food and 10 percent of the beverages, so there is considerable opportunity for increased rail transportation.
Table 1. U.S. consumption of food and beverages with rail share of transportation
Domestic
Usage
Exports Railroad Tonnage
Railroad Share by Car Type
Boxcar Covered Hopper
Refrig. Boxcar
TOFC/ COCF Tank
Total RR
Percent Food Group tons million
Red Meat 16.35 2.86 1.29 3.0% 0.8% 2.9% 6.7% Poultry 9.90 2.75 0.80 5.6% 0.5% 0.2% 6.3%
Fish 2.15 0.13 3.9% 2.1% 6.0% Dairy Products 85.89 0.94 0.3% 0.6% 0.2% 1.1% Fats and Oils – 13.28 2.9 11.04 0.3% 0.1% 0.6% 67.3% 68.2%
Fruit, Fresh 18.40 0.62 0.5% 0.1% 2.3% 0.5% 3.4% Fruit, Processed 20.85 0.78 0.5% 2.0% 1.2% 3.8%
Veg., Fresh 28.19 1.95 1.1% 1.1% 1.4% 3.3% 6.9% Veg., Processed 32.35 0.26 0.0% 0.2% 0.4% 0.2% 0.0% 0.8% Flour and Cereal 28.01 10.84 5.3% 29.4% 1.7% 2.3% 0.0% 38.7%
Caloric Sweeteners 20.54 0.5 15.73 1.2% 17.6% 1.3% 0.5% 54.0% 74.8% Sub Total 275.91 44.37 16.1%
Beverages Beer 25.30 7.28 10.3% 14.6% 1.8% 2.1% 28.8% Wine 2.40 0.3 1.79 2.4% 31.1% 32.8% 66.3%
Liquor 1.41 0.2 0.71 33.0% 11.2% 44.2% Soda 69.22 0.44 0.6% 0.6%
Sub Total 98.33 10.22 10.4% Source: U.S. Department of Agriculture 2004 and STB Carload Waybill Sample

18
The primary products that could benefit are some categories of fresh fruit and vegetables, fresh seafood and poultry, and some dairy products. In addition, fresh flowers, nursery plants, and live baby chickens could quite possibly justify the additional cost of higher speed rail operation.
4.1.1 Fresh produce—fruits and vegetables
Production volumes U.S. Department of Agriculture (USDA) publishes data on production and shipment by origin (State, country, product, and mode of transportation). On average, Americans consume approximately 300 lb per capita or approximately 46 million tons of fresh fruit and vegetables a year. Although there is variation in consumption, it is reasonable to assume that regional consumption is directly proportional to population. Because of climate and soil conditions, approximately 73 percent of produce is grown in the Western and Southwestern States, Mexico, and Florida. That produce requires long distance, rail-based transportation to the major population centers of the Northeast and the Midwest, which account for 23 and 17.5 percent, respectively, of the U.S. population.
Fresh produce requiring rail-distance transportation The fresh produce from the Southwest (including Mexico) and west coast areas amounts to approximately 21.3 million tons or 46 percent of the total relevant production. Additionally, approximately 7 million tons are from Idaho and Colorado; these are not included because the majority of the produce is not time-sensitive. Based on population distribution data, there are 5.1, 3.9, and 4.7 million tons of produce that need transportation to the Northeast, Midwest, and Southeast, respectively. Based on an average of 20 tons per truckload, this equates to approximately 730, 550, and 680 equivalent truckloads per day to the Northeast, Midwest, and Southeast, respectively, from the West and Southwest. Fresh produce from Florida is shipped in approximately 70 and 55 truckloads to the Northeast and Midwest, respectively. There is also a considerable amount of Florida juice currently shipped to California (see Table 2).
Table 2. Estimate of annual tonnage of fruits and vegetables consumed by location
Percent Annual Tonnage
Destination Locations Population West & SW Florida Northeast 23.0 5,092,706 552,161 Midwest 17.5 3,874,885 420,123 Southeast 21.4 4,738,431
Total Daily ‘Truck’ Loads Consumed
Northeast
728 79 Midwest
554 60
Southeast
677
Currently, rail transport handles 6 to 10 percent of the fresh produce from the areas listed in Table 2. This indicates that there are currently approximately 600 truckloads a day shipped from

19
the West and Southwest, which compares favorably with estimates provided by producers and processing companies.
Transport requirements for fresh produce The handling of fresh produce is so complex that it is taught as a university-level science course called Postharvest Engineering. There are approximately 200 different fresh produce products and almost all require specific handling and shipping conditions. The variations can even extend to subspecies within a given species. Each has a rate of ethylene production or sensitivity that must be considered, and, most importantly, each product has a maximum storage life. Storage or shelf life can range from 2 to 3 days to 6 to 8 months. For the purposes of this analysis, the following categories of produce, based on shelf life, are considered:
• Category 1, berries, prepared lettuce, herbs, cherries (but seasonal), etc. ~6 days
• Category 2, celery, French beans, citrus, etc. ~14 days
• Category 3, potatoes, root vegetables, etc. ~28 days
• Category 4, frozen, meat, 28+ days For short transit times of a few hours, mixed produce can be shipped in the same trailer or container; however, for more than a few hours, the products in the same vehicle must be compatible.
Need to consolidate shipments For longer distances and days of transit, it is critical that all produce shipped in a single freight car, container, or trailer be compatible. To generate the volume to do this, it is usually necessary to consolidate shipments because a single producer or shipper seldom generates sufficient volume going to the same destination to fill a freight car. For the volumes necessary, particularly for a unit train, there is a need for facilities to unload trucks, store the produce in the appropriate environment, and load it into refrigerator cars. The reverse is also required at destinations where a trans-loading facility is required for shipment to distribution centers. All this has to be undertaken in an unbroken cold chain. Some produce could be shipped with a higher speed intermodal train. This mode could eliminate the need for a consolidation and transloading facility, assuming the volumes and product compatibility are sufficient to fill a refrigerated container. Costco’s and Sam’s Club’s produce is sufficient in volume not to require distribution centers. This underscores the need for higher speed intermodal trains.
20
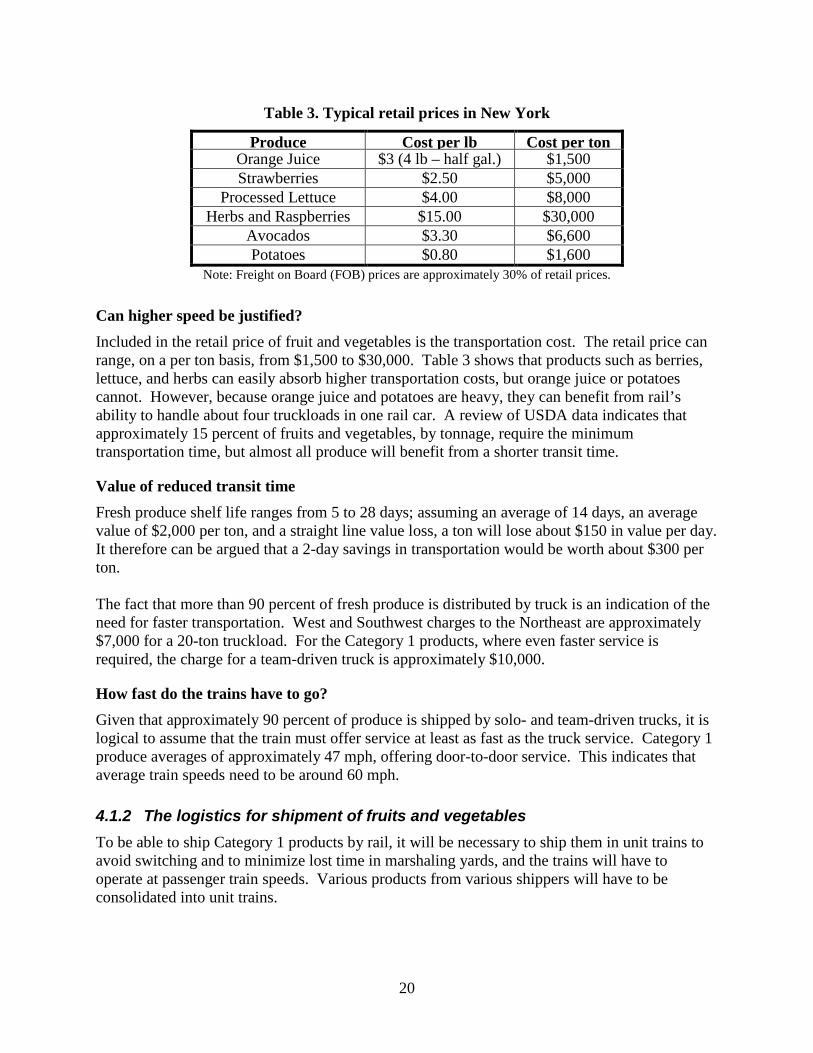
Table 3. Typical retail prices in New York
Produce Cost per lb Cost per ton Orange Juice $3 (4 lb – half gal.) $1,500 Strawberries $2.50 $5,000
Processed Lettuce $4.00 $8,000 Herbs and Raspberries $15.00 $30,000
Avocados $3.30 $6,600 Potatoes $0.80 $1,600
Note: Freight on Board (FOB) prices are approximately 30% of retail prices.
Can higher speed be justified? Included in the retail price of fruit and vegetables is the transportation cost. The retail price can range, on a per ton basis, from $1,500 to $30,000. Table 3 shows that products such as berries, lettuce, and herbs can easily absorb higher transportation costs, but orange juice or potatoes cannot. However, because orange juice and potatoes are heavy, they can benefit from rail’s ability to handle about four truckloads in one rail car. A review of USDA data indicates that approximately 15 percent of fruits and vegetables, by tonnage, require the minimum transportation time, but almost all produce will benefit from a shorter transit time.
Value of reduced transit time Fresh produce shelf life ranges from 5 to 28 days; assuming an average of 14 days, an average value of $2,000 per ton, and a straight line value loss, a ton will lose about $150 in value per day. It therefore can be argued that a 2-day savings in transportation would be worth about $300 per ton. The fact that more than 90 percent of fresh produce is distributed by truck is an indication of the need for faster transportation. West and Southwest charges to the Northeast are approximately $7,000 for a 20-ton truckload. For the Category 1 products, where even faster service is required, the charge for a team-driven truck is approximately $10,000.
How fast do the trains have to go? Given that approximately 90 percent of produce is shipped by solo- and team-driven trucks, it is logical to assume that the train must offer service at least as fast as the truck service. Category 1 produce averages of approximately 47 mph, offering door-to-door service. This indicates that average train speeds need to be around 60 mph. 4.1.2 The logistics for shipment of fruits and vegetables To be able to ship Category 1 products by rail, it will be necessary to ship them in unit trains to avoid switching and to minimize lost time in marshaling yards, and the trains will have to operate at passenger train speeds. Various products from various shippers will have to be consolidated into unit trains.

21
Time comparison of logistics chain alternatives Table 4 shows the total estimated time for using rail between California and the Northeast to be as low as 4.8 days with an average of just under 8 days. This means that a minimum of 4.8 days of shelf life would have been used. Given that some Category 1 products have shelf lives of 6 to 8 days, a maximum 70 mph freight train speed is unacceptable.
Table 4. Comparison of Field to Distribution Center for Rail and Road—California to
Northeast
Operations Element Current times (hours) Passenger Priority Single Team
Low High Ave Train Train 65
mph Driver Drivers Field to Packing Shed 0.5 3 1.5 1.5 1.5 1.5 1.5 Packing Shed 3 2160 8 4 4 4 4 Transport to Consolidation Facility 1 36 8 8 4
Consolidation Facility 5 36 24 12 5 Rail Transit 100 124 112 60 50 129 69
Rail Transloading 5 36 24 12 5 Transit to Distribution Center 0.25 48 8 8 8 Wholesale Distribution Center 4 24 8 8 4 Total Hours (after packing shed) 115 304 184 108 76 134.5 74.5
Total Days (after packing shed) 4.8 12.7 7.7 4.5 3.2 5.6 3.1
To compete with team-driven trucks, a priority higher speed train would need to average 65 mph with a peak operating speed of 90 mph. This means, purely based on time, for rail to transport Category 1 products and get down to 3.2 total days of equivalent transit time, average train speeds would have to be approximately 65 mph, with a maximum speed of 90 mph.
Current train schedule The current refrigerated unit train from California to the Northeast requires 12 crew changes, 2 inspections, and 3 to 5 hours for interchange between railroads (see Table 5). The total time between origin and destination is between 100 and 124 hours, which means the average speed from terminal to terminal is between 32 and 38 mph. These numbers are comparable to priority TOFC train speeds, but are only about 65 percent of the speed of a passenger train operating on the same or similar route.

22
Table 5. Current Train Transit Time and Average Speed in MPH
Total Low High Low High 12 crew changes 0.5 1 6 12 Inspection x 2
6 6
Interchange
3 5 Nonrunning time
15 23
Total time
100 124 Running time
85 101
Average operating speed mph
38.2 32.2
Average overall speed mph
32.5 26.2
The current overall average rail speed (comparable to truck speed), including consolidation and trans-loading, is 26 to 32 mph. A single driver and team-driven trucks average 25 and 46 mph, respectively.
Estimating revenue per train The short shelf life products, Category 1, can justify team-driven trucks, or in some cases, even air transportation, but there is not sufficient volume to fill a unit train, so the train must also carry Category 2 and Category 3 products. Single driver service is usually used for Category 2 products (celery, citrus, etc.). Category 3 products (potatoes and root vegetables) are often shipped in manifest trains. Using average percent by weight and taking specific weight into consideration, the revenue for a 55-car train is shown in Table 6.
Table 6. Estimated Prorated Revenue per Car Based on Cost of Alternative Modes
Average shelf life
% by weight
Road trucking charge $
Handling discount
Truck loads per
freight car
Revenue for a 55 car
train Category 1 (berries, lettuce, etc.) 8 days 15% 10,000 20% 2.5 $165,000 Category 2 (leaf vegetables, oranges, etc.) 14 days 45% 7,500 20% 3.5 $519,750 Category 3 (root vegetables, apples, etc.) 28 days 40% 6,000 20% 4.0 $422,400 Potential average revenue per car $
$20,130
Revenue/55 car train $
$1,107,150

23
Revenue for percentages by weight is based on USDA data for all Western and Southwestern grown produce. The potential revenue is based on current typical truck charges with an estimated discount to cover the additional handling over and above door-to-door by truck. Table 6 indicates that the average revenue per car would be approximately $20,000 and per train would be approximately $1 million. This table shows that truckload per car is critical to the viability of shipping by rail. In other words, the amount of road truckloads that can fit into a rail freight car is critical to profitability for higher speed freight service.
Value of produce shelf life savings Using the logic that producers and shippers are prepared to pay the extra cost of shipping by a faster mode, going from manifest rail to single driver and team-driven trucks, it is clear that savings in shelf life is worth approximately the difference in cost. Based on this, it can be concluded that a 2-day difference in transit time between a single and team driver must be worth at least $2,500 per truck load and $1,500 between single driver and manifest rail.
Potential additional revenue from savings in shelf life The shelf life value gain can be estimated by what the customer is prepared to pay for a faster mode of transportation. Using this approach, an estimate of the value of higher speed trains has been developed (see Table 7).
Table 7. Estimate of the Value to Shipper of Higher Speed Mode of Transportation
Freight cars per train
Truck loads per train
Potential additional $
Potential revenue/train
Category 1 (berries, package lettuce) 8.25 20.6
None – same as team trucks $0
Category 2 (leaf vegetables, oranges, etc.) 24.75 86.6 $1,500 $129,938 Category 3 (root vegetables, apples, etc.) 22 88.0 $1,000 $88,000 Additional revenue from 55-car train $ $217,938
For the train to carry Category 1 products, it must match the speed of a team-driven truck. Since the train will be carrying Category 2 and Category 3 products, these products will gain from an additional shelf life of 2 days and possibly 8 days, respectively, the latter as compared with a manifest train. Table 7 indicates that there is product value of approximately $218,000 that can be attributed to the priority train that would have a maximum speed of 90 mph. This value could be charged to the shipper to offset the extra cost of higher speed.

24
4.1.3 Other food products Fifty-two million tons of processed fruit and vegetables, 26 million tons of meat and poultry, and large amounts of seafood and dairy products (originating in California) can certainly benefit from shipping via higher speed freight railcars. Medicine, flowers and nursery plants, and wine spirits requiring a controlled temperature environment and limited shelf lives are also good candidates for shipping by higher speed freight railcars.
4.1.4 Potential railroad revenue from produce (shifting transport modes) Based on the above data and logic, higher speed freight trains running 10 percent faster than current passenger trains would permit the transportation of Category 1 produce and would essentially be in direct competition with team-driven trucks. Category 1 produce alone is insufficient to justify the daily operation of unit trains, and given the short shelf life of this produce, a daily train is almost a necessity. However, if the unit trains also carried Category 2 and Category 3 products, at truck and manifest train competitive prices, then it is estimated that there could be 200 freight carloads a day from the West and Southwest to the Northeast, as shown in Table 8. At average revenue of $20,000 per car, this would amount to railroad revenues of approximately $1.4 billion a year. This means that for the three basic rail routes from the West and Southwest, to Northeast, Midwest, and Southeast, the overall railroad revenue could be approximately $3.1 billion.
Table 8. Possible Annual Revenue from the Operation of Higher Speed Produce Freight Trains
Average Car Rev/Car Annual Total Daily ‘Truck’ Loads Consumed
From West and SW
From Florida Loads/Day
Rev (m)
Northeast 728 79 205 20,000 $1,435 Midwest 554 60 156 14,000 $764 Southeast 677 0 191 14,000 $934 Total
$3,133
Given the train schedule to meet the transport requirement for Category 1 produce, Categories 2 and 3 produce will benefit from the additional retail shelf life generated by reduced transportation time—a value of approximately $600 million (see Table 9).

25
Table 9. Estimate Value of Retail Shelf Life Gained by Higher Speed Trains
Average Car Average Value Annual $
Loads/Day Time
Savings/Car for Shelf Life
(million) Northeast 205 4000 287 Midwest 156 2600 142 Southeast 191 2600 174 TOTAL 602
Other food products, and head and back haul requiring temperature-controlled transportation, could add at least 10 to 15 percent to the revenue. It should be noted that higher speed transportation of fruit and vegetables is complex. Achieving the level of service needed for Category 1 products will require considerable development by the railroads and the produce handling companies. However, the use of a quality, track friendly, low maintenance, higher speed freight car truck could result in the level of mode transfer described above.
4.2 Package and Courier Service Mail, express, and courier services manage 34 million tons of shipment a year, according to the 2007 Commodity Flow Survey. Of this amount, 53 percent is within the range of a single driver truck. The tons decline as distances increase, but the total ton-miles increase with distance. See Figure 7—Package and Courier Services, tons and ton-miles.
Figure 7. Package and courier services, tons and ton-miles
Source: Commodity Flow Index

26
There are three basic services: next day air, ‘deferred’, and ground. The respective 2010 volumes are shown in Table 10. Based on publicly available data, UPS has about 50 percent of the U.S. parcel and courier service market. In 2010, that was approximately 13.3 million packages per day, 7 percent of which were packages shipped as ‘Deferred’— generally considered to be second day air or truck and the logical service to be replaced by higher speed freight trains.
Table 10. UPS Packages by Class of Service
Packages
Service Type (X1000) % Next Day Air 1,205 9%
Deferred 941 7% Ground 11,140 84%
Total Daily Volume 13,286
If these percentages are transferred to the 2007 Commodity Flow Survey data, they show that national totals in terms of tons per day are limited (see Table 11).
Table 11. Packages tons per Day by Class of Service and Distance
Tons per Day
Next day delivery
Deferred or 2nd day Ground
Less than 50 miles 1,366 1,062 12,746 50–99 miles 719 559 6,712 100–249 miles 1,551 1,206 14,473 250–499 miles 1,712 1,331 15,974 500–749 miles 1,322 1,028 12,340 750–999 miles 971 755 9,058 1,000–1,499 miles 1,082 842 10,102 1,500–2,000 miles 723 562 6,745 More than 2,000 miles
725 564 6,770 Total 6,535 5,082 60,990
Note: Assumes 300 days per year
The tonnages include other routes, so the data show that the obvious service that could benefit from higher speed rail is insufficient to justify a dedicated train at this time. Given that package service is relatively lightweight, it will be volume limited; so, unlike with produce, the weight capacity would not be able to offset the cost of handling the packages in a higher speed train.

27
UPS is the only courier that uses rail: UPS has recently announced the purchase of 3,500 53-foot containers to replace a portion of its trailer fleet; so, clearly, they are interested in increasing the use of rail and using double stacks. FedEx does not currently use rail at all, but has been working with several railroads to develop intermodal service. They recently signed an agreement with Norfolk Southern Railway and BNSF for line haul movements for their economy or LTL (FedEx Freight) service.
Revenue potential Depending on the distance, service is delivered by air, rail, or truck. The difference between single driver trucks and team-driven trucks appears to be only approximately $300 per ton. If rail could offer a team truck competitive time service, there is at least some potential revenue to cover the additional transportation costs. This service would probably be in intermodal containers, but could possibly be in trailers, especially in corridors where there is insufficient clearance for double stack. There appear to be four basic long distance corridors for package and courier service; they are identified in Table 12. When compared with the Commodity Flow Survey, these long distance corridors interestingly fall into four mileage categories. For example, SW-MW-NE serves 27 percent of the traffic, transportation distances are more than 2,000 miles, and according to the survey, it handles 571 tons daily (based on 7 percent of package traffic and 300 days per year). From an approximate 1,500 packages per truck (53’ trailer) at an average weight of 7 lb each, there are approximately 54 trucks per day on the California-Chicago-New York route. However, in each distance category, there are other traffic lanes, so an assumption has to be made that this accounts for at most 75 percent of the traffic.
Table 12. Estimate of Potential UPS Trucks or Containers a Day by Corridor
Corridors % Population of Corridor Traffic %
Distance in Miles
National Tons per Day
Trucks/ Day UPS only Comments
NE-SE 44.4 23% 750–999 764 55
Tunnels will restrict to single stack and will not go through Atlanta
MW-SE 38.9 20% 1,000–1499 852 61
SW-SE 34.8 18% 1,500–2,000 569 41
Will not go through Dallas
SW-MW-NE 53.9 27% <2,000 571 41
Must go through Chicago
It is reasonable to assume that a percentage of ‘deferred’ packages are shipped by air on a space available basis. In fact, there is evidence that possibly 50 percent is shipped by air, except during the Christmas season. This would indicate that on the most promising higher speed corridor,

28
SW-MW-NE, there are, on a typical day, only about 20 team-driven trucks on this route. If the fact is included that some of the SW includes San Francisco, there may be as few as 15 trucks.
How fast will the higher speed train need to be? Most package sorting facilities are located some distance from the appropriate intermodal terminal, so there is a drayage time and a wait and loading time, whereas the truck can leave as soon as loaded.
Table 13. Estimate of Hours for Rail and Trucks for SW to NE Transportation of 53’ Containers
Passenger Priority Single Team
Low Average High Train Train 65
mph Driver Drivers Drayage 0.25 0.5 2.5 0.5 0.25 Wait 0.1 0.5 3 0.5 0.1 Load 0.1 0.25 0.5 0.25 0.1 Transit 60 55 129 61 Unload Average 0.1 0.5 0.5 0.5 0.1 Drayage 0.25 0.5 2.5 0.5 0.25 Total Time hrs 62.25 55.8 129 61
Using average times for handling and waiting, and running on a passenger train schedule, the SW to NE travel time would be approximately 62 hours, compared with the team-driven truck travel time of 61 hours (see Table 13). Using a priority passenger train schedule or a schedule that can result from investment in higher speed passenger trains, it could be about 56 hours.
Cost comparison Single driver trucks typically cost $8,000 for Los Angeles to New York where double stack railroad rates are approximately 20 percent less—and with a contracted rate could be approximately $6,000 per 53-foot trailer. Rates for team driven trucks for the same distance are approximately $10,000. This indicates that for higher speed trains, the railroad revenue could be $2,000 to $3,000 higher than what is charged for a single driver competitive service. The railroad is not going to operate a train of only 20 containers, so the train will have to be filled with other service containers. The problem is that the larger the train, the slower the speed and the longer the time to load it. For a train length of 25 cars (double stack), the train would generate revenue in the range of $110/train-mile, which is below the current average revenue and hardly sufficient to generate interest, especially considering the extra costs and attention required to operate a higher speed train. If the train were increased to 75 cars, approximately 60 percent of the typical package train, then the revenue could be approximately $295/train-mile (see Table 14).

29
Table 14. Higher Speed Package Train Revenue
Train Distance (miles) 3,250
Revenue/Container Differed $ 9,000
Ground $ 6,000
Train Length (cars) 25 50 75 Containers 50 100 150 Deferred 20 20 20 Ground 30 80 130 Deferred Revenue $180,000 $180,000 $180,000 Ground Revenue $180,000 $480,000 $780,000 Train Revenue $360,000 $660,000 $960,000 $ per train-mile $111 $203 $295
Unfortunately, at the moment, it is not possible to determine value added by delivering ‘Ground’ packages 1 day or possibly 2 days earlier. Therefore, the additional revenue to the railroad would be at least the revenue that the railroad would get for handling what would have been team-driven truck transportation. At a maximum, for the 3,200-mile SW-MW-NE service, the additional revenue would be approximately $180,000 per day or $54 million a year. This number does not take into account the added value of customers paying small premiums to get ‘Ground’ packages to destinations 1 or 2 days sooner.
4.3 Less than Truck Load Freight Express and package services are usually limited to 150 lb per item. Items larger than this are considered to be Less than Truck Load (LTL) and are usually shipped using a different logistics chain mechanism. The ‘trucks for hire’ data from the Commodity Flow Survey indicate that about 6 percent of the total freight tonnage shipped by truck are in packages of less than 5 tons and could be considered LTL (the average for LTL being approximately 1200 lb)9. Of the total tonnage transported by ‘trucks for hire’, approximately 4.5 percent is being transported more than 1,000 miles, a distance that could benefit from a higher speed freight train. LTL shippers are currently using trucks and/or intermodal. Based on the transit times shown in Map 2, it appears that FedEx is using relay trucks, which have an average speed somewhere below team driven trucks but above solo driven trucks or intermodal. To meet the priority
9 2007 U.S. Department of Transportation, Research and Innovative Technology Administration, Bureau of Transportation Statistics and U.S. Census Bureau, 2007 Commodity Flow Survey.

30
service schedule, they are using a more expensive mode, and it can be assumed that it is costing approximately 15 percent more to provide the service. If railroads can provide a service speed equivalent to team driven trucks between large centralized hubs at a cost lower than solo drivers or relay trucks, they can attract LTL carriers. Instead of operating trucks directly between a series of smaller hubs, the faster rail time to the centralized hub would permit truck redistribution to local centers while still meeting the schedule in Map 2. If the line haul cost by rail is sufficiently lower than the cost of relay or team driven trucks, the overall cost will be lower and the system more energy efficient.
Map 2. Service standards for shipment from Los Angeles (Source: FedEx)
As an illustration, Table 15 shows estimates of the time required to provide the service, as well as the cost of line haul transportation between Los Angeles and New York. Based on the time required for the economy service, a proportion of the transportation is likely intermodal.

31
Table 15. Time and cost estimate to provide line haul service from Los Angles to New York
Current Truck Service Service Class Economy Premium
Service Standard Hours 120 96 Service Times: Collection 4 4 Consolidation 8 8 Sort 8 8 Delivery 4 4 Long Distance Transport 96 72 Transport Mode or Number of Drivers
Single Driver or Intermodal
Relay or Team Driven
Cost/Mile $1.50 $2.00 Line Haul Transport Cost $4,875 $6,500
Note: Line haul transport cost estimated by an LTL road carrier.
It is estimated, based on BNSF published data, that the current container charge for a similar distance is $3,500 for standard intermodal service and approximately $4,100 for expedited service (which is still, despite its name, slower than LTL economy). If the LTL carrier paid a higher speed freight tariff to the railroad similar to the economy truck rate, the railroads would be getting at least a 20 percent premium over current expedited service. Given that 36.4 percent of the national population is located in the Northeast and Southwest, it is reasonable to assume an equivalent amount of the potential rail LTL business could travel on this traffic lane. Based on double stack 55-car trains, with 25-ton containers, Table 16 shows that on this traffic lane there could be 2.5 trains per day in each direction.
Table 16. Traffic Lanes
Traffic Lane
Population % Tons/Year Tons/Day
Tons/Day/ Direction
Train Loads/Day/Dir
ection NE-SW 36.4 4,157,694 13,859 6,929 2.5 NE-SE 21.4 2,444,359 8,148 4,074 1.5
Using similar logic, the Northeast-Southeast traffic lane could support 1.5 trains per day. In addition, there are other major traffic lanes to the Midwest. Based on package and express company data, the demand for premium service is approximately 15 percent of total demand. Given a demand for 2.5 trains per day each way for the longest traffic lane, if one train per day were a higher speed train, 40 percent of the train would be at the premium tariff. This would generate revenue of approximately $320 million per year for the Northeast-Southwest traffic lane using 55-car double-stack trains, as shown in Table 17.

32
Table 17. Higher-speed intermodal train revenue, NE-SW traffic
LTL Service Class Economy Premium Proposed Higher speed tariff per container $4,500 $5,300 Revenue/train, 40% Premium, 60% Economy, 110 containers/train $297,000 $233,200
Total Revenue per train
$530,200 Annual Revenue (6 trains/week each way) $318,120,000
Assuming 25 percent of the Economy LTL traffic is already using intermodal, the net annual increase in rail revenue could be about $275 million in the Northeast-Southwest traffic lane. Using those long distance traffic lanes that have direct passenger service, the Northeast-Southeast traffic lane could add $50 million in LTL intermodal revenue, and the Southwest-Midwest and Midwest-Northeast lanes could add an additional $50 million.
4.4 Intermodal Starting in the mid-1950s, many thought intermodal was the railroad’s answer to the truck and the interstate highway system. As discussed in earlier sections of this report, intermodal is much more difficult to organize and operate successfully than it appears. Even with all the emphasis on intermodal, if the international trade, which is conducted in containers, is removed from the calculation, rail intermodal service only handles approximately 2 percent of the tons and 6 percent of the freight ton-miles10. Railroads consider solo driven trucks their competition, so an average speed of 35 mph for longer distances and a 15 to 25 percent cost savings is considered sufficient to attract business. At shorter distances, the drayage and waiting times and costs do not offset the line haul cost savings. The possibilities can be divided into the three categories discussed below. 4.4.1 Short distance intermodal Because rail ton-miles are lower cost than road ton-miles, there should be a market for short distance intermodal. But rail requires time and cost for drayage, loading and unloading, plus there is a wait time for the next train. When these times and costs are added, rail is generally not considered for service under 400 miles.
Table 18 shows that at 400 miles a truck always takes less time than a train. At 100 mph the overall time is about the same as trucking, but the rail cost is significantly more.
10 2007 Commodity Flow Survey (40 and 20’ containers are not included as they are considered international)

33
Table 18. Estimated Time and Cost for 400 miles at Various Rail Speeds
Average Train mph 35 50 75 100 Drayage 1.25 1.25 1.25 1.25 Wait 1.00 1.00 1.00 1.00 Load 0.50 0.50 0.50 0.50 Line Haul 11.43 8.00 5.33 4.00 Unload 0.50 0.50 0.50 0.50 Drayage 1.25 1.25 1.25 1.25 Train Total Hours 15.93 12.50 9.83 8.50 Cost/ton-mile $ 0.03 0.035 0.045 0.065 Train Costs $ 684 738 846 1,062 Truck Time Hours 7.7 Truck Cost $ $638
Higher speed time savings and cost advantages improve after approximately 500 miles when there is a 10-hour rest period for the single truck driver or the need to use the more expensive team-driven truck. Future restrictions on drivers may create a very good market in the 450 to 600 mile range, especially if the train can average 75 mph.
4.4.2 Short distance intermodal overnight There are many businesses that do not operate overnight and often this time is used to transfer goods between facilities and between warehouses of the same company. This is common practice for distributors and creates business opportunities for overnight intermodal service. The company’s local delivery driver’s last delivery of the day is to the intermodal terminal, and the first job in the morning is to collect a trailer from the intermodal terminal. This way, the company does not need to employ overnight drivers, which is not only a cost saving measure but also makes the driver’s job more attractive by avoiding night work. This aspect of the work can make intermodal an integral part of the logistics or manufacturing chain. The CP Expressway, with a maximum speed of 70 mph, has proven successful using this model between Montreal and Toronto (approximately 320 miles). Typically, close of business to opening of business the next day is 13 to 14 hours. Allowing for drayage, waiting and loading and unloading (approximately 4.5 hours), approximately 9 hours are left for travel. As shown in Table 19, the ability to operate overnight intermodal services at higher speed will enable such service to be offered for city pairs up to 600 miles apart.

34
Table 19. Higher Speed Will Create Additional Overnight Intermodal Service
Maximum Train Speed mph 70 80 90 100 Average Train Speed mph 42 50 58.5 67.5 9 hr. travel miles 378 450 526.5 607.5
Referring to Map 3 and using CP’s experience as a guide for viable market size, higher speed would make overnight delivery possible between at least the following city pairs:
San Francisco-Los Angeles
Atlanta-Central Florida
Atlanta-Richmond/Washington
Chicago-Minneapolis
Chicago-Kansas City
Chicago-Pittsburgh
Washington-Boston (likely not feasible because of the limitations of the North and East River Tunnels at Penn Station New York)

35
Map 3. Major U.S. population centers
One of these corridors, San Francisco-Los Angeles, can likely justify multiple daily trains. Montreal-Toronto train handles approximately 100 trailers a day each way. Based on CP’s traffic, a rough estimate is at least 1,400 trailers per day of additional rail traffic. This could result in increased revenue to the railroads of $150 to $250 million a year.
4.4.3 Longer distance intermodal (more than 700 miles) A recent publication stated that railroads have identified approximately 6 million truckloads that can be attracted to intermodal. The majority of this traffic is single driver and is well suited for double stack trains; also, the standard 33 to 38 mph average speed is competitive for distances of more than 700 miles.

36
5. Considerations in Developing Higher Speed Freight Trains
While a market is essential, the potential revenue estimates in Section 4 must be balanced with other considerations that add to or detract from the desirability of developing a higher-speed freight train service. These other factors include:
• Effects of higher speed trains on line capacity,
• Impact of current plans for higher speed passenger service,
• Higher cost of going faster,
• Limitations of existing computer-aided dispatching systems, and
• Spillover opportunities to improve existing freight-car trucks. After considering these matters, we conclude by summarizing the basic cases for and against the higher speed freight trains.
5.1 Line Capacity Considerations Insertion of a higher speed freight train into the schedule will have some effect on line capacity. If operated randomly, these trains will reduce lower speed train capacity by a ratio of around 3 to 1 (slow to fast) on single track. On double track, the situation is not as amenable to formulaic solution because of the many possible track and signal configurations, so simulation is required. On “standard” CTC-equipped double track with 90 mph faster trains, the ratio is probably between 3 to 1 and 4 to 111. If the faster freight trains are operated as second sections of the preset passenger schedules, the ratios will be much reduced (probably less than 1 to 1).
5.2 Relationship to Higher Speed Passenger Services Amtrak is the sole operator of intercity passenger trains in the 48 contiguous United States. Its 21,200 route-mile system is shown on Map 1 (see page 16). Amtrak’s train frequencies outside the Northeast Corridor and its branches generally vary from thrice-weekly to five trains per day in each direction. Maximum passenger train speeds on freight-railroad-owned track vary from 60 to 80 mph. In the last few years, State governments have expressed increased interest in developing faster and more frequent rail passenger service in short- to medium-distance corridors across the United States. Supported by the Federal government’s high-speed rail and economic stimulus programs, track and signal upgrades have already been made in the first few of these corridors. Because the current effort (with one exception in California) does not yet include building entirely new tracks like the Japanese Shinkansen or the French Lignes à Grand Vitesse dedicated to very high-speed passenger trains, the faster and more frequent passenger trains in North
11 Note that in negotiations for higher passenger train speeds on the former New York Central between Schenectady and Buffalo, CSX claimed (based on proprietary simulations) a six-to-one ratio if the higher speed were 110 mph.

37
America will, in nearly all cases, continue to share tracks with freight trains already operated in these corridors by the railroad companies that own the rights-of-way.
5.2.1 Federal and State high-speed rail programs Starting in 1991, U.S. DOT established “Designated High-Speed Rail Corridors” as authorized by the Intermodal Surface Transportation Efficiency Act (ISTEA) and Transportation Equity Act for the 21st Century (TEA-21) legislation. Today, there are 11 designated corridors, as shown on Map 4.
Map 4. Proposed higher speed and true high-speed passenger corridors
Source: FRA
The High-Speed Intercity Passenger Rail (HSIPR) Program was instituted by FRA in 2009 to distribute funds from the American Recovery and Reinvestment Act (ARRA) and subsequent appropriations, in accordance with a framework laid down by Congress in the Passenger Rail Investment and Improvement Act of 2008 (PRIIA). The HSIPR Program further divides the 11 corridors into 3 types:
“Core Express” corridors (125 to 250 mph) 1. Northeast Corridor, Washington D.C. to Boston (250 miles)
2. California High-Speed Rail System (800 miles)

38
“Regional” corridors (90 to 125 mph) 3. California Corridor, San Diego to San Francisco/San Jose and Sacramento, via
both Coast Line and San Joaquin Valley routes, also Los Angeles to Las Vegas
4. Pacific Northwest Corridor, Vancouver, BC, to Eugene, OR (466 miles)
5. Chicago Hub Network, segments Chicago to a) St. Louis; b) Detroit; and c) Milwaukee only (650 miles)
6. Empire Corridor, New York City to Buffalo, NY (435 miles)
7. Northern New England Corridor, segment New Haven to Springfield only (63 miles)
8. Keystone Corridor, segment Philadelphia to Harrisburg only (104 miles)
9. Southeast Corridor, segment Washington, DC, to Charlotte, NC, only
“Emerging” corridors (up to 90 mph) 10. South Central Corridor, Dallas/Ft. Worth to a) San Antonio; b) Tulsa via
Oklahoma City; and c) Little Rock
11. Gulf Coast Corridor, New Orleans to a) Houston; b) Mobile; c) Atlanta via Birmingham (Southern Railway Route)
12. Southeast Corridor, segments Richmond to Hampton Roads, Charlotte to Atlanta; Raleigh to Jacksonville; Atlanta to Jacksonville (shares with Raleigh to Jacksonville south of Jesup, GA)
13. Florida Corridor, Tampa to Miami via Orlando
14. Keystone Corridor, segment Harrisburg to Pittsburgh (approximately 250 miles)
15. Northern New England Corridor, segments Boston to a) Montreal; b) Portland, ME; and c) Albany, NY
16. Chicago Hub Network, segments Milwaukee to Minneapolis; St. Louis to Kansas City; Chicago to Cleveland; Chicago to Cincinnati via Indianapolis; Indianapolis to Louisville; and Cleveland to Cincinnati
The Regional corridors are initially upgraded to FRA Class 5 (90 mph) or Class 6 (110 mph) track and may be upgraded to Class 7 (125 mph) once higher speed locomotives are developed and grade crossing security is improved. The Emerging corridors will operate at speeds ranging from present-day conditions to 90 mph (FRA Class 5).
5.2.2 Higher speed freight trains on high-speed corridors With regard to operation of higher speed freight trains, the Core Express routes will be dedicated to passenger trains only, though the legacy freight situation in the Northeast Corridor is quite complex and may take some time to sort out. On the Regional and Emerging routes, Class 5 track allows a maximum freight train speed of 80 mph.

39
If freight trains are to be operated at speeds of more than 80 mph on Regional Class 6 or 7 tracks, the equipment must undergo qualification testing as described in the FRA Track Safety Standards12. Its vehicle-track performance must equal that of the passenger equipment, and this performance must not be adversely affected by the lading (or lack thereof) in the freight cars. Freight train axle loads must be uniform within a car and may not exceed those of the passenger locomotives used on the line13.
The maximum usefulness of the higher speed freight equipment will be found in operation as a second section of a passenger train at speeds up to 80 mph, specifically in the operation of empty cars at these speeds, a problem that has vexed many attempts at higher speed freight service. Within these parameters, the higher speed freight trains can be useful on any track, whether part of the Amtrak system or not, that is maintained at FRA Class 5 or above.
5.2.3 Sharing infrastructure costs with intercity passenger trains To facilitate the operation of more and faster passenger trains on the HSIPR lines, specific improvements are being made to existing track. These improvements include a higher standard of track maintenance allowing higher top speeds, removal or relaxation of some permanent speed restrictions, changes to the signal system to accommodate longer braking distances, and the addition of track (main tracks, sidings, and crossovers) to increase capacity. Many of these improvements will benefit freight trains that share the track.
5.2.4 The Costs of Operating Higher Speed Freight Trains The costs of operating trains at higher speeds include increases in fuel usage, mechanical improvements (cars and locomotives), and infrastructure improvements. A brief description of these costs follows:
12 49 CFR 213, Subpart G, §213.307, §213.329 and §213.345, available online at http://ecfr.gpoaccess.gov 13 Uniform loading of a multiplatform double stack well car is practically impossible: the trucks at the ends are always more lightly loaded than those under the articulated couplings between platforms. This implies that a higher speed double stack car would have to be single platform.

40
Figure 8. Conventional and container-on-flat-car freight train resistance
Source: Illinois—Railroad Engineering
Fuel for operations: As the speed of the train increases, the total resistance also increases (mostly because of air), as shown in figure 8. Equipment—Locomotives: A locomotive costs approximately $3 per mile for maintenance; additional locomotives may be required. Capital costs should largely be offset by an increase in utilization. Infrastructure: A recent study14 shows that in the worst case scenario, operating a limited number passenger train at 110 mph on a quality freight railroad track will increase track costs by approximately 25 percent. General and Administrative: It is uncertain whether operating higher speed freight will increase G&A costs, especially in the long term. Using the national average percentage of costs by department as the base, it is possible to estimate the increase in train-mile costs of operating freight trains from an average of 70 mph to an average of 50 mph, for box cars and double stack containers (see Table 20).
14 ESTIMATING MAINTENANCE COSTS FOR MIXED HIGHER SPEED PASSENGER AND FREIGHT RAIL CORRIDORS, Allan M. Zarembski, Ph.D., PE, FASME and Pradeep Patel, ZETA-TECH: A Harsco Rail Business Unit
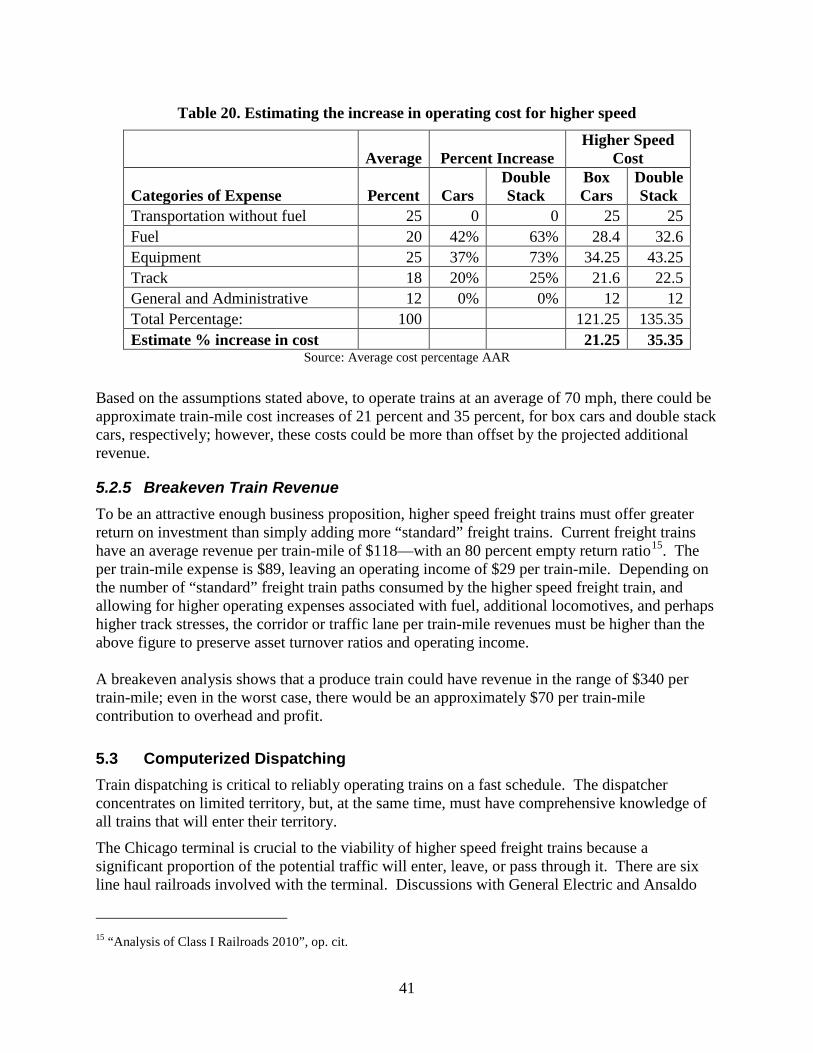
41
Table 20. Estimating the increase in operating cost for higher speed
Average Percent Increase Higher Speed
Cost
Categories of Expense Percent Cars Double Stack
Box Cars
Double Stack
Transportation without fuel 25 0 0 25 25 Fuel 20 42% 63% 28.4 32.6 Equipment 25 37% 73% 34.25 43.25 Track 18 20% 25% 21.6 22.5 General and Administrative 12 0% 0% 12 12 Total Percentage: 100
121.25 135.35
Estimate % increase in cost
21.25 35.35 Source: Average cost percentage AAR
Based on the assumptions stated above, to operate trains at an average of 70 mph, there could be approximate train-mile cost increases of 21 percent and 35 percent, for box cars and double stack cars, respectively; however, these costs could be more than offset by the projected additional revenue.
5.2.5 Breakeven Train Revenue To be an attractive enough business proposition, higher speed freight trains must offer greater return on investment than simply adding more “standard” freight trains. Current freight trains have an average revenue per train-mile of $118—with an 80 percent empty return ratio15. The per train-mile expense is $89, leaving an operating income of $29 per train-mile. Depending on the number of “standard” freight train paths consumed by the higher speed freight train, and allowing for higher operating expenses associated with fuel, additional locomotives, and perhaps higher track stresses, the corridor or traffic lane per train-mile revenues must be higher than the above figure to preserve asset turnover ratios and operating income. A breakeven analysis shows that a produce train could have revenue in the range of $340 per train-mile; even in the worst case, there would be an approximately $70 per train-mile contribution to overhead and profit.
5.3 Computerized Dispatching Train dispatching is critical to reliably operating trains on a fast schedule. The dispatcher concentrates on limited territory, but, at the same time, must have comprehensive knowledge of all trains that will enter their territory.
The Chicago terminal is crucial to the viability of higher speed freight trains because a significant proportion of the potential traffic will enter, leave, or pass through it. There are six line haul railroads involved with the terminal. Discussions with General Electric and Ansaldo
15 “Analysis of Class I Railroads 2010”, op. cit.

42
and with representatives of Norfolk Southern concluded that within 5 years the railroads will probably have the necessary dispatching systems to give the necessary priority to higher speed freight trains.
5.4 Spillover Improvements in Standard Truck Design The standard three-piece truck is economical and gives excellent all-around performance up to 60 mph. Given that the average freight car speed on a 24-hour basis is approximately 2.8 mph, the capital costs of the freight car (and the trucks) are significant. The proposed higher speed freight cars will have an average speed of 35 to 40 mph; therefore, the capital cost of the higher speed freight car will be less important. Any higher speed truck should be as good as or better for the track and car body than a conventional truck simply because of the fact that it is designed for premium service. Additionally, technology developed for higher speed trucks will most likely be applicable to conventional trucks and, therefore, will provide a long term financial benefit to the industry as a whole.
5.5 The Basic Argument in Favor of Higher Speed Freight Trains The existing time-sensitive traffic moving by highway could be advantageously diverted to rail if the speed and reliability disadvantage of the latter were eliminated or reduced. There are positive arguments for rail transport based on reduced highway congestion and wear-and-tear. There are arguments based on fuel economy and reduced air pollution. However, the commercial success of these trains will mainly depend on transportation economics. The U.S. DOT study cited in AAR Report16 shows that over the next 25 years, railroad freight tonnage will increase by 88 percent. In that same period, the U.S. population will grow from the current level of 297 to 370 million17
. The need to move goods, food, and other daily necessities for the growing population will put pressure on the existing highway and freight networks. Given the increasing highway congestion and continuously increasing oil and diesel prices, the railroads have an incentive to capture a larger and larger share of freight and freight growth.
• Railroads can leverage the low energy consumption per ton-mile. Further, a larger share of freight traffic growth can be gained by running freight trains at incrementally higher speeds.
• Greater freight movement by rail offers other tangible public benefits. Removing a significant amount of highway trucks from congested roadways will lead to reduced over-the-road traffic fatalities, reduced national energy consumption, and reduced dependency on oil.
• Furthermore, any decrease in the number of highway trucks on the road will contribute to increased public health and safety due to reduced exhaust and noise emissions.
16 National Rail Freight Infrastructure Capacity and Investment Study – Cambridge Systematics, Inc., 2007. 17 http://www.census.gov/population/projections/data/national/2012/summarytables.html.

43
5.5.1 Operating Issues There are economic and technical constraints that must be considered in the operation of higher speed trains.
Although unit and intermodal trains (and truck competition) have taken away much of the “loose car” traffic, the remaining freight yards are often too small or ill-suited to today’s trains. This traffic change results in the time consuming need to double trains in and out of too-short yard tracks, tying up the yard and sometimes the mainline in the process. Therefore, to ensure the success of implementing higher speed, a faster, more reliable freight train must be planned to bypass these yards and operate as a “main tracker” from origin to destination.
44
6. Technical Characteristics Of Higher Speed Freight Truck
Current three-piece trucks are safe up to approximately 55 mph and are relatively track friendly and low maintenance. At speeds in the range of 55 to 70 mph, truck hunting becomes a significant issue, especially for empty cars. This analysis indicates that higher speed freight trains will likely operate at peak speeds of around 90 mph for the foreseeable future. The loaded car weight will range from 220,000 to 263,000 (more likely) or even 286,000 lb. To allow for a safety margin for 90+ mph operations, the trucks should be designed and tested up to at least 110 mph under both loaded and empty car conditions. It is likely that higher speed freight trains will be operated on passenger train routes, probably as add-on second sections in passenger trains to minimize impact on freight operations and route capacity and to help in cost sharing between modes.
To avoid having to change signal systems to accommodate higher speed freight trains, higher speed freight cars should be equipped so that braking characteristics and stopping distances are similar to those of passenger cars. Because, in the near term, higher speed freight cars will most likely be operated in captive or unit trains, there is potential for the use of electro-pneumatic brakes.
The effect of Hours of Service (HOS) regulations on average over-the-road speed at various distances is depicted in Figure 1 for both solo drivers and teams. This chart represents a “best case” starting with fully rested drivers and favorable driving conditions. Once past the single-day driving radius, a solo driver’s average speed collapses to between 25 and 30 mph, while the team continues on at around 47 mph.

45
7. Conclusions
The study and analysis reported herein conclude that there is a need for higher speed freight car trucks that are proven safe to operate at least up to 110 mph in both loaded and empty car conditions. The truck must be track friendly, low maintenance, suitable for up to 286,000-pound service and, above all, safe. Currently, there is no proven freight car truck that meets these conditions. The market analysis for a higher speed truck indicates that operating a limited number of trains at an average speed of 55 to 60 mph, with a likely peak speed of around 90 mph, could generate at least $4.6 billion of annual additional revenue for the railroads and take hundreds, if not thousands, of trucks off the roads. One of the greatest potential benefits of a higher speed freight truck is that it would make possible the sharing of infrastructure and signaling costs for some of the nation’s intercity passenger trains (because of profitable freight trains sharing their lines). This partnership would most likely improve Class 1 railroads’ perceptions of supporting passenger trains and possibly even make them enthusiastic about higher speed passenger train implementation because of the anticipated increase in revenue and profit. A preliminary breakeven analysis shows that in comparison with the revenue per train-mile of $118 and operating income of $29 per train-mile for existing freight trains, a produce train could generate revenue in the range of $340 per train-mile, and, even in the worst case scenario, there could be approximately $70 per train-mile of contribution to overhead and profit. Over the last 20 years, shippers such as Railex and Amtrak have promoted higher speed freight trains, but have been restricted in their logistics chain development by the lack of a suitable freight truck for speeds higher than 70 mph. As a part of this market analysis effort, operating railroads were invited to review the observations and conclusions made to develop the market potential of higher speed freight service. Two major North American railroads were approached and given a presentation on the market analysis work. Both railroads were interested in the approach taken for the market analysis, the underlying assumptions made, and the opportunities and challenges addressed. The railroads were receptive to the work and expressed interest in furthering the research and development of higher speed freight technology. One of the railroads provided a written letter (attached at the end of this document) as a testament to their support and encouragement.

46

47
Abbreviations and Acronyms
ARRA American Recovery and Reinvestment Act BNSF Burlington Northern and Santa Fe Railway CFS Commodity Flow Survey COFC Container On Flat Car CP Canadian Pacific Railway CTC Centralized Traffic Control ECP Electronically Controlled Pneumatic brakes GRL Gross Rail Load HOS Hours Of Service HSIPR High-Speed Intercity Passenger Rail ISTEA Intermodal Surface Transportation Efficiency Act LCL Less than Carload LTL Less than Truckload MHCs Material Handling Cars PRIIA Passenger Rail Investment and Improvement Act of 2008 SA Sharma & Associates, Inc. TEA-21 Transportation Equity Act for the 21st Century TOFC Trailer On Flat Car UPS United Parcel Service USDA United States Department of Agriculture U.S. DOT United States Department of Transportation USPS United States Postal Service