High School Essentials CAO Meeting February 2013 Dr. Andrews Chief Academic Officer.
254
High School Essentials CAO Meeting February 2013 Dr. Andrews Chief Academic Officer
-
Upload
betty-hunter -
Category
Documents
-
view
212 -
download
0
Transcript of High School Essentials CAO Meeting February 2013 Dr. Andrews Chief Academic Officer.

High School Essentials
CAO MeetingFebruary 2013
Dr. AndrewsChief Academic Officer

2
HIGH SCHOOL ACCOUNTABILITY
Mark Howard, DirectorResearch, Evaluation and Assessment

3
How many changes to the FDOE Accountability system in 2012?
A.9B. 17C. 23D.34
Correct Answer
34!

4
HIGH SCHOOL GRADING MATRIXStatewide Assessment Components – 50% “Other” Components – 50%
Reading
Math (Algebra,
Geometry) Writing Science
(Biology 1) Acceleration Grad Rate College
Readiness Performance
Participation(150 points)
Overall(200 points)
100 - Federal100 – Mod 5-Yr
Reading(100 points)FCAT 2.0, FAA
(100 points)EOCs, FAA
(100 points)FCAT, FAA
(100 points)EOC, FAA
(100 points)
Learning Gains All Students Performance(150 points)
At-Risk(100 points)50 – Federal
50 – Mod 5 Yr
Math(100 points)FCAT 2.0, FAA
(100 points)EOCs, FAA
(100 points)
Low 25% Learning Gains FCAT 2.0
(100 points)EOCs
(100 points)
(300 points) (300 points) (100 points) (100 points) (300points) (300 points) (200 points)

5
HIGH SCHOOL GRADING MATRIXStatewide Assessment Components – 50%
Reading Math
(Algebra, Geometry)
Writing Science (Biology 1)
Performance FCAT 2.0, FAA(100 points)
EOCs, FAA(100 points)
FCAT, FAA(100 points)
EOC, FAA(100 points)
Learning Gains All Students FCAT 2.0, FAA(100 points)
EOCs, FAA(100 points)
Low 25% Learning Gains FCAT 2.0
(100 points)EOCs
(100 points)
(300 points) (300 points) (100 points) (100 points)

6
HIGH SCHOOL GRADE ACCOUNTABILITYPERFORMANCE, LOWEST 25% LEARNING GAINS
FY2013• Reading Performance Penalty• Math – Algebra 1 and Geometry EOC
• Geometry Achievement Levels• Science – Biology 1 EOC
• Biology Achievement Levels• Writing – 3.5 Score, 60 Minutes• Lowest 25% Adequate Progress Penalty Reinstated
POINTS
A At least 1,050
B 990 to 1,049
C 870 to 989
D 790 to 869
F Fewer than 790
I Below 90% tested
Grade Scale for High Schools(Based on a 1600-Point Scale)

7
PERFORMANCE
Includes• ELLs with at least 365 calendar days from initial
day of entry into U.S. school* • FCAT 2.0
• Reading • Writing • Science
• EOCs• Algebra 1 • Geometry • Biology 1
*365 days: Initial day of entry to first day of
FCAT 2.0 Writing testing – February 26, 2013

8
READING PERFORMANCE (100 pts)
• One (1) point for each percent of eligible students scoring• FCAT 2.0 Achievement Scale Levels 3+• FAA Scale Levels 4+
Emergent
1 2 3
Achieved
4 5 6
Commended
7 8 9
At least 30
students with
valid reading
scores

9
Reading Performance Threshold PenaltySchool grade lowered one letter grade if 25%
Reading Performance threshold not met
Schools that have their grade lowered for not meeting other targets (e.g., Adequate Progress of the Lowest 25%, At-risk Graduation Rate) will not have their grade lowered further.
READING PERFORMANCE (100 pts)

10
Reading: Percent ProficientFY12 Spring to FY13 Winter Diag Difference
All Students Tested
-15.0
-10.0
-5.0
0.0
5.0
10.0
15.0
98
7 6 6 54
2 2
-1 -2 -2 -2 -3
-7 -7-8
-13

11
MATH PERFORMANCE (100 pts)
• One (1) point for each percent of eligible students scoring• Algebra 1 Levels 3+
• Grad requirement for into 9th in FY12
• Geometry Levels 3+• Grad requirement for into 9th in FY13
• FAA Scale Levels 4+
At least 20
students with
valid math
scores
Florida EOC Assessment Scale Scores (325 to 475) for each Achievement Level:Level 1 Level 2 Level 3 Level 4 Level 5
Geometry 325-369 370-395 396-417 418-433 434-475
Geometry Achievement Levels

12
MATH PERFORMANCE (100 pts)Algebra 1 & Geometry EOC
• First EOC in HS counts toward Performance• Grade 9 students bank M.S. EOC scores
• Level 3+ included in high school Performance numerator and denominator
• Not included in participation rate• Participation
• Students enrolled in Algebra 1, Geometry• Survey 2 and 3 & 4 and 1 (most recent summer)
(October 2012, February 2013, June 2012, July 2012)• FAA tested students

13
Algebra 1 EOC: Percent ProficientFY12 Spring to FY13 Winter Diag Difference
All Students Tested
Se-ries
1
-20.0
-15.0
-10.0
-5.0
0.0
5.0
10.0
15.0
20.017 16
11 11 11
7 6 6 5 5 5 4 42
1 1 0
-1 -1 -2-4
-10
-16

14
Geometry EOC: Percent ProficientFY12 Spring to FY13 Winter Diag Difference
All Students Tested
Se-ries
1
-20
-15
-10
-5
0
5
10
15
20
25
3026
15
5 5 5 41 0
-1 -2 -2 -2 -3 -3 -5-6 -6 -7 -7 -7 -9
-15-17

15
SCIENCE PERFORMANCE (100 pts)
• One (1) point is accrued for each percent of eligible students scoring• Biology 1 EOC Levels 3.0+
• Grad requirement for into 9th in FY13
• FAA Scale Levels 4.0+
Florida EOC Assessment Scale Scores (325 to 475) for each Achievement Level:Level 1 Level 2 Level 3 Level 4 Level 5
Biology 1 325-368 369-394 395-420 421-430 431-475
Biology 1 Achievement Levels

17
Biology 1 EOC: Percent ProficientFY12 Spring to FY13 Winter Diag Difference
All Students Tested
-20
-10
0
10
20
30
40
50
60
49
17
104
2 2 2 2 2 1
-1 -2 -2 -4 -5 -5 -6 -7 -7 -8 -9 -10-13

18
WRITING PERFORMANCE (100 pts)
• One (1) point for each percent of eligible students scoring• FCAT Writing Levels 3.5+• FAA Scale Levels 4.0+
• 60 minutes

19
FY12 Grade 10 FCAT 2.0 WritingPercent Scoring 3.5 and 3.0 Difference
Series1
-25
-20
-15
-10
-5
0
-4
-8
-10
-12-13 -13
-15 -15-16 -16
-17 -17 -17-18
-19 -19 -19-20 -20 -20
-21 -21-22 -22
-23

20
READING LEARNING GAINS (100 pts)
• FCAT 2.0 (1 point)• Maintain same proficient level• L1 to L2, L1 to L3, or L2 to L3
• Remain L1 & increase Required scale points• Remain L2 & increase Required scale points
Minimum FCAT 2.0 Scale Increases Required to Demonstrate Learning Gains
Reading Grade 8-9 Grade 9-10
Level 1 6 8
Level 2 5 7
Retained students make learning gains by
maintaining a proficiency level, increasing a level, or
increasing a scale score

21
READING LEARNING GAINS (100 pts)
• FCAT 2.0 Weighted (1.1 or 1.2 point)• (1.1) Prior year level 1 or 2 & gain Required
plus 33% or more scale points see example• (1.1) Move from lower level into L4• (1.2) Move from lower level into L5
Level 4
1.1
Level 5
1.2Retained students make
learning gains by
maintaining a proficiency
level, increasing a level,
or increasing a scale score

22
READING LEARNING GAINS (100 pts)
• Weighted Learning Gain for retained and non-retained students prior year in FCAT 2.0 L1 or L2
Learning Gain of 1.1 = Required growth + 33% or more
Example: Current ninth grader, prior year level 1 eighth graderRequired growth (6) points + 33% (2 points)
6 + 2 = 8 scale points
Minimum FCAT 2.0 Scale Increases Required to Demonstrate Learning Gains
Reading Grade 8-9 Grade 9-10
Level 1 6 8
Level 2 5 7

23
READING LEARNING GAINS (100 pts)
• FAA (1 point)• Maintain proficient (Levels 4-9)• Improve from prior Level
• Remain Levels 1-3 & gain 5 or more scale points (Required)
• FAA Weighted (1.1 point)• Prior year levels 1-3 & gain Required
plus 33% or more (7+) scale points

24
MATH LEARNING GAINS (100 pts)
• FAA (1 point)• Maintain proficient (Levels 4-9)• Improve from prior Level • Remain Levels 1-3 & gain 5 or more
scale points (Required)
• FAA Weighted (1.1 point)• Prior year levels 1-3 & gain Required
plus 33% or more (7+) scale points

25
MATH LEARNING GAINS (100 pts)
• Algebra 1/Geometry EOC (1 point)• Maintain proficient (L3-L5)• Improve from L1 to L2, L1 to L3, or L2 to L3• Remain L1 & increase common scale score• Remain L2 & increase common scale score
FDOE will use a common scale for comparisons
• Compare 9th grade students’ prior year FCAT 2.0 Math score to Algebra 1 scores
• Compare prior year Algebra 1 score to Geometry EOC score

26
MATH LEARNING GAINS (100 pts)
• Algebra 1 /Geometry EOC Weighted (1.1 or 1.2 point)• (1.1) Move from lower level into L4• (1.2) Move from lower level into L5
Level 4
1.1
Level 5
1.2

27
LOWEST 25% LEARNING GAINS (200 pts)
Calculating Lowest 25% - Reading• Only students in prior year L1 or L2• Calculate for each student group• The sum of all groups plus other retained students
in prior year L1 and L2
Grade Grade Grade Grade
7 to 9* 8 to 98 to 10*
9 to 99 to 10 10 to 10
TotalGroup
+Total
Group+
TotalGroup
+Total
Group=
Groups Total
+
Other Retained students
in prior-year Levels 1 and 2
=SchoolTotalL25%
*Students who skip a grade will show Learning Gains by moving up a level or maintaining L3+
Fewer than 30 students L2 or
below, reading and mathematics
gains of all students substituted
28
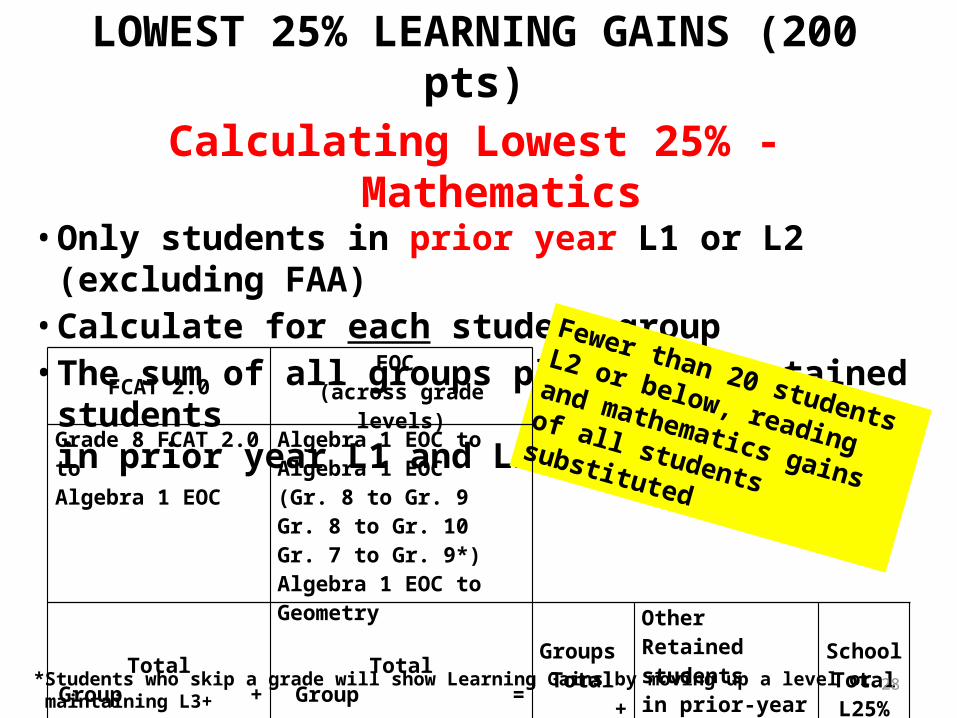
LOWEST 25% LEARNING GAINS (200 pts)
Calculating Lowest 25% - Mathematics• Only students in prior year L1 or L2 (excluding FAA)• Calculate for each student group• The sum of all groups plus other retained students
in prior year L1 and L2
*Students who skip a grade will show Learning Gains by moving up a level or maintaining L3+
Fewer than 20 students L2 or
below, reading and mathematics
gains of all students substituted
FCAT 2.0 EOC (across grade levels)
Grade 8 FCAT 2.0 toAlgebra 1 EOC
Algebra 1 EOC toAlgebra 1 EOC(Gr. 8 to Gr. 9Gr. 8 to Gr. 10Gr. 7 to Gr. 9*)Algebra 1 EOC to Geometry
TotalGroup +
TotalGroup =
Groups Total +
Other Retained studentsin prior-year Levels 1 and 2 =
SchoolTotalL25%

29
LOWEST 25% LEARNING GAINS (100 pts)
Lowest 25% Adequate Progress• At least 50 percent of the Lowest 25% (50% in Reading
and 50% in Mathematics) make Learning Gains or show improvement from the prior year:
• Lowest 25% Adequate Progress Penalty
Lowest 25% Learning Gains
School Grade Related Action
50% + No Grade Reduction
40% - 49%Reduced unless improvement of 1% or more is made over the prior year.
39% and BelowReduced unless improvement of 5% or more is made over the prior year

30
0
10
20
30
40
50
60
70
80
90
100
8076
69 67 66 64 6358 58
55 54 54 54 53 53 52 51 50 50 4944 43
4034 33 33
29 28 28 27
Lowest 25% Math Learning GainsAll High Schools
A C C A A B B A A F A B B

31
SDPBC Algebra 1 EOC Pass Rates
FY10/11 SPRING FCATMATH
FY2012 SPRING ALG 1 EOC(no retakers)
Taking PassingPct
Passing
TOTAL 11608 6745 58% L 1 959 53 6% L 2 1736 279 16% L 3 3754 2085 56% L 4 2362 2247 95% L 5 1438 1432 100% No Lvl 1359 649 48%
LEVEL 16%
LEVEL 216%

32
SDPBC Algebra 1 EOC Passing Rates
FY10/11 SPRING FCATMATH
FY2012 SPRING ALG 1 EOC(no retakers)
Taking PassingPct
Passing
TOTAL 11608 6745 58%L 1 959 53 6%L 2 1736 279 16%L 3 3754 2085 56%L 4 2362 2247 95%L 5 1438 1432 100%No Lvl 1359 649 48%
TAKING11,608
FAILURES4,863

33
SDPBC Algebra 1 EOC Passing Rates
FY10/11 SPRING FCATMATH
FY12 SUMMER ALG 1 EOC(retakers)
Taking PassingPct
Passing
TOTAL 1919 481 25%L 1 292 13 4%L 2 584 77 13%L 3 753 305 41%L 4 46 30 65%L 5 2 2 100%No Lvl 242 54 22%
FAILURES4,863
PASSING481
REMAINING4,382

34
SDPBC Algebra 1 EOC Passing Rates
FY10/11 SPRING FCATMATH
FY13 WINTER ALG 1 EOC(retakers)
Taking PassingPct
Passing
TOTAL 2742 678 25%L 1 488 41 8%L 2 908 159 18%L 3 957 365 38%L 4 50 28 56%L 5 2 2 100%No Lvl 337 83 25%
FAILURES4,382
PASSING678
REMAINING3,704

35
SUMMMARY OF CHANGES STATEWIDE ASSESMENT COMPONENTS
FY2013
• Math – Geometry EOC• New Achievement Levels
• Science – Biology 1 EOC• New Achievement Levels
• Writing – 3.5 Score, 60 Minutes
• Reading Performance Penalty• Lowest 25% Progress Penalty Reinstated

36
STRATEGIES AND RESOURCES
Keith Oswald, Assistant SuperintendentCurriculum and Instruction

“THE ESSENTIALS” HIGH SCHOOL
INSTRUCTION BEFORE THE ASSESSMENTCAO
February 5, 2013

Essentials for High School Reading

39
High School Resources for ELALesson plans that focus on tested benchmarks, contain on grade level text, and text-dependent questions are located on each grade level ELA calendar in Learning Village.
It is important to continue instruction. Two of the most difficult benchmarks (as determined by percentage correct on the winter diagnostic) are 6.1.1 and 6.2.2. The scope and lesson plans on Learning Village instruct on these benchmarks in January and February.
Additional lesson plans that focus on tested benchmarks are available for small groups.

40
These lessons are not located on the calendar, so they are fresh lessons for students.
There is also access to the Florida Achieves site for additional testing practice and links to released practice tests.

41
High School Resources for Reading
Lesson plans that focus on tested benchmarks, contain a variety of text levels, and text-dependent questions are located on each grade level reading calendar in Learning Village.
Every week, an informational passage with vocabulary activities, reading strategies, and FCAT-style questions is included for each grade level.

42
SpringBoard Resources Available on TrainU
SpringBoard ELA and Math Resources available:
Pacing Guides,Benchmark
Correlations, Graphic Organizers, Sample Bellringers and Mini-Lessons,
CCSS and PARCC Connections,
Marzano Crosswalk
Reading and Writing Supports:Links to 10 SB Writing
Workshops per grade level, Sample FCAT stem questions
based on SB reading

43
Reader and TaskTen Guiding Principles
1. Make close reading and rereading of texts central to lessons.
2. Provide scaffolding that does not preempt or replace text.
3. Ask text dependent questions from a range of question types.
4. Emphasize students’ supporting answers based upon evidence from the text.
5. Provide extensive research and writing opportunities (claims and evidence).

44
Reader and TaskTen Guiding Principles
6. Offer regular opportunities for students to share ideas, evidence, and research.
7. Offer systematic instruction in vocabulary.
8. Ensure wide reading from complex text that varies in length.
9. Provide explicit instruction in applied grammar and conventions.
10. Cultivate students’ independence.
The most important concept to remember: it is not about the program; it is about the teacher.

45
Administrative Considerations
• Capitalize on teachers’ strengths.• Utilize data to monitor progress.
– Classroom Assessments– Core K12– Diagnostics
• Focus on the curriculum and the resources available in Learning Village.
• Maintain a balance between instruction and test preparation.

High School Essentials for Writing

47
Best Practices for Test Readiness• Students write every day.
• Provide prescriptive feedback to students and monitor progress.
• Teach strategic minilessons based on class needs.
• Pull students together for small group instruction based on similar need.

48
Best Practices for Test Readiness
• Confer with individual students.
• Ensure that 11th grade students marked as 10th graders in TERMS are receiving writing instruction. These students will take FCAT 2.0 Writing again.
• Utilize lesson plans in Learning Village as needed.
• Utilize the tutorial lessons and Saturday lessons as needed.

49
SpringBoard Writing Workshops
• Expand everyday writing opportunities already available within the regular SpringBoard curriculum.
• Integrate SpringBoard Writing Workshops into regular instruction.– 10 Writing Workshops available for each grade level.– Use as support, extension, or intensive practice.

50
FY12 FCAT 2.0 Writing High School
FY12 Palm Beach County
FY12 State
Mean Score
Uns 1 1.5 2 2.5 3 3.5 4 4.5 5 5.5 6 % 3 & above
% 3.5 & above
% 4 & above
3.4 0 1 1 5 8 24 22 26 8 3 1 0 84 60 38
Mean Score
Uns 1 1.5 2 2.5 3 3.5 4 4.5 5 5.5 6 % 3 & above
% 3.5 & above
% 4 & above
3.6 0 1 1 3 6 17 23 34 11 4 1 0 89 72 49
The minimum goal for students needs to remain a 4 as at least one scorer needs to believe the essay is a 4 in order to earn a 3.5.
Note: In Palm Beach County, there was a 17 point difference between 3s a 3.5s last year.

51
Qualities of Good WritingFocus
(Meaning & Structure)• Staying on the thread of
the topic that was chosen to write about.– Planning (various methods)
Organization (Structure)• The order of ideas
presented in the essay.• Using transitions that help
the essay flow
• Ordering ideas
• Having a thesis statement
52
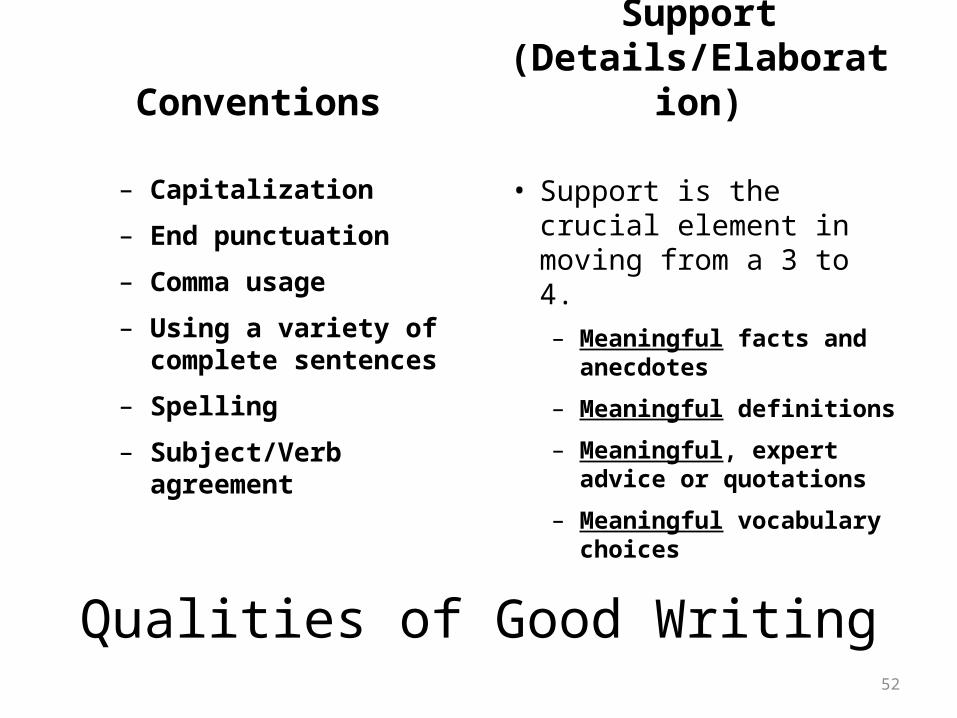
Qualities of Good Writing
Conventions
– Capitalization
– End punctuation
– Comma usage
– Using a variety of complete sentences
– Spelling
– Subject/Verb agreement
Support (Details/Elaboration)
• Support is the crucial element in moving from a 3 to 4.– Meaningful facts and
anecdotes
– Meaningful definitions
– Meaningful, expert advice or quotations
– Meaningful vocabulary choices

53
Using Data to Drive Instruction
If the writer is a Level 1, I could teach…
• Focusing closely on the topic of the prompt.
• Focusing closely on the topic of daily writing.
• Organizing by introducing the topic, supplying one or more reasons, ways, or kinds of, and concluding the writing.
• Adding facts or examples to elaborate.
• Writing sentences with a “who” & a “did what.”
If the writer is a Level 2, I could teach…
• Focusing closely on the topic of the prompt.
• Organizing by introducing the topic, supplying one or more reasons, ways, or kinds of, and concluding the writing.
• Adding support to elaborate.• Writing sentences with a
“who” & a “did what.”• Using end punctuation.

54Using Data to Drive Instruction
If the writer is a Level 3, I could teach…
• Taking away any extraneous parts.• Organizing with 3 reasons, ways or
kinds of.• Making a clearer beginning &
ending.• Adding support to elaborate.
◦ Examples with elaboration◦ Anecdotes carefully crafted to
show how it fits with the idea• Writing sentences with simple and
compound construction.• Spelling word wall words correctly.• Using end punctuation correctly.• Choosing stronger verbs/specific
nouns.
If the writer is a Level 4, I could teach…
• Crafting a strong introduction that previews the ideas to be addressed.
• Crafting a concluding paragraph that includes the writer’s thoughts or feelings about the topic.
• Eliminating extraneous parts.• Organizing ideas by importance.• Using effective transitions between
and within paragraphs.• Including anecdotes that are angled
to match the thesis, and provide sufficient elaboration to create a strong connection.
• All of the conventions from level 3.

55Using Data to Drive Instruction
If the writer is a Level 5, I could teach…
• Further development of support and elaboration. Each reason, way, or kind of could be supported in multiple ways (definitions, anecdotes, facts, quotations, etc.).
• Purposeful vocabulary use.• Various sentence structures.• More purposeful use of
punctuation.
If the writer is a Level 6, I could teach…
• Strengthening all of the level 5 components.
• The piece leaves the reader without unanswered questions.

56
English Language Learners
All English Language Learners must have a word to word heritage dictionary from the beginning of the year to use in class and on assessments.
Testing Accommodations
Classroom Accommodations

Essentials – HS Mathematics

58
EOC Resources for Algebra 1 and Geometry Students
• Resources are sorted by EOC Benchmark, instructional focus, and textbook lesson.
• Instructional resources include Florida EOC sample test items, publisher resources, and district-developed EOC test item benchmark practice.

59
Algebra 1 LV Landing Page

60
Algebra 1 LV Landing Page

61
Algebra 1 LV Landing Page

62
Algebra 1 LV Landing Page

63
Algebra 1 LV Landing Page

64
Algebra 1 EOC Resources by Benchmark

65
Algebra 1 EOC Resources by Benchmark

66
ePat Guided Practice Worksheet

67
Algebra 1 EOC Practice Worksheet

68
Geometry LV Landing Page

69
Geometry LV Landing Page

70
Geometry LV Landing Page

71
Geometry EOC Resources by Benchmark

72www.AlgebraNation.com

73

74

75

76

77
Algebra Nation• EOC aligned• Content created in collaboration with FLDOE• Additional EOC prep resources forthcoming• Student access outside of school
– Platform for additional support– Access to resources– Opportunity to receive personal support

78
What Works in Algebra I• Algebra Nation• Differentiate lessons to meet needs of all students.• Provide lowest 25% in Algebra 1 with additional support opportunities. • Attend content trainings by K-12 Curriculum.• Ensure teachers’ knowledge of the revised Item Specifications.• Teach foundational skills during the first month.• Utilize progress monitoring logs/benchmark seminars/data chats.• Have no more than two preps for Algebra I teachers.• Use
– Wylie’s Warm-ups (Everglades book)– EOC-like problems for every benchmark– Core K12 assessments for tracking and remediation– Florida Achieves– Spiral review of benchmarks

79
What Works in Geometry• Group 9th grade students together in the same class.• Differentiate lessons to meet needs of all students.• Attend content trainings by K-12 Curriculum.• Ensure teachers’ knowledge of the revised Item Specifications• Utilize progress monitoring logs.• Use
– Hands-on/manipulatives/virtual tools/activities– EOC-like problems for every benchmark– Practice proofs– Geogebra– Cornell notes– Flashcards (for theorems, postulates, vocabulary, etc.)– Gizmos– Constant spiral review of benchmarks

80
What Works for Retakers • Identify students for the retake immediately after results
are available.• Find and fill the “holes.”• AM/PM/Lunch Bunch tutoring with Algebra teachers.• Utilize individual progress monitoring logs.• Double block grade 10 students in Algebra 1 and Geometry
OR Liberal Arts and Geometry.• Use Inside Algebra. (Title 1 schools used these materials last
summer in the JumpStart Program.)• “Boot Camp”• Conference with students. (“Step Into My Office.”)• Connect with the student individually as a motivational tool.

Science ResourcesSound Instruction for the
Biology I EOC

Plan for Success
Provide students with exposure to FCAT-style questions (a few per day).
• FCAT Explorer
• FOCUS Mini-Assessments

FCAT Explorer and Context-Dependent Sets
Plan for SuccessFCAT-Style Questions

Plan for SuccessSimulations and Virtual Labs
Utilize simulations and virtual labs to reinforce science concepts.

Plan for SuccessSimulations and Virtual Labs
Utilize simulations and virtual labs to reinforce science concepts.

Plan for SuccessSimulations & Virtual Labs
Utilize simulations and virtual labs to reinforce science concepts.

Plan for SuccessSimulations & Virtual Labs
Utilize simulations and virtual labs to reinforce science concepts.

88
Learning Village ResourcesSecondary Science – Biology 1
NEW!

89
Learning Village ResourcesBiology 1 Resource Chart

Other Resourcese2020 Virtual Tutor
Utilize e2020 Virtual Tutor to remediate biology benchmarks.

91
What Works in Biology 1
• Differentiate lessons to meet the needs of all students
• Utilize resources from content trainings conducted by K-12 Curriculum
• Incorporate hands-on learning experiences, virtual labs, and simulations into lessons
• Use – Florida Achieves/FCAT Explorer (FCAT-style questions)
– Biology I Benchmark Labs– Biology I Resource Chart– Supplemental Tutorial Lessons

Academic Success Begins With You
A study conducted by Hoy, Sweetland and Smith (2002) found that efficacy “was more important in
explaining student achievement than socio-economic status.”
If you can answer “yes” to the following questions, you are building teacher
efficacy.

93
1. Do you believe that your teachers are capable of successfully teaching Level 1 and Level 2 students?
2. Do you identify and celebrate the individual accomplishments and successes of each teacher?
3. Do you provide appropriate feedback to address weaknesses in a non-threatening way?
4. Are you sure that your feedback to teachers has impacted instructional practices at your school?
Academic Success Begins With You

94
• According to Goddard, Hoy and Hoy, principals must intentionally help teachers develop a sense of efficacy.
• Model the efficacious behaviors that you want to see teachers utilizing in the classroom with their students.
Academic Success Begins With You

95
ContactsLiteracy• Diana Fedderman, Program Planner 357- 5989 (PX 25989)
Mathematics• Nancy Kinard, Manager 434-8250 (PX 48250)• Diana Snider, Program Planner 357-5943 (PX 25943)
Science• Wendy Spielman King, Manager 357-1152 (PX 21152)• Greg Goebel, Program Planner 357-1128 (PX 21128)

96
MONITORING FOR SUCCESS IN EDW
Dr. Sandra Raymond-Roberts, ManagerEducational Data Warehouse

Essentials Training 2013
Educational Data Warehouse

98
Purpose
• Identify accountability data in the Educational Data Warehouse
• Determine specific monitoring tools relative to school and student performance.
99
How did your school’s tested population
perform on the 2013 Winter Diagnostics–FCAT 2.0,
Algebra 1 EOC, Geometry EOC, and Biology EOC?
100
What assessments are used to measure student performance?
• Winter Diagnostics–Reading – Algebra 1 Florida EOC, Geometry
EOC, and Biology EOC

101
Who are the accountable students in the Performance categories?
• Students reported in Survey 2 (October FTE), Survey 3 (February FTE), and first day of FCAT Writing test
• Students attending public schools– ELL students with at least 365 calendar days in a
U.S. school

102
BIG PICTURE

103
MONITORING PROGRESS TOWARD A PLUS GOALS FOR HIGH SCHOOLS-RTOOA0445

Monitoring Progress Toward A Plus Goals for High Schools-RTOOA0445

105
Fall and Winter Diagnostic Results
106
Diagnostic Diamond Report-RTODA0173EOC Diagnostic Diamond Report-RTSDA0474

107
Step 1: Sort By Benchmark
Question
Focus
Benchmarkss
Diff

108
Step 2: Sort By Gridded Response

109
Step 3: Sorted by BenchmarkT1
T2
Similar Patterns

110
Step 3: Sorted by BenchmarkT1
T2
Dissimilar Patterns

111
READING MATHEMATICS WRITING SCIENCE
PERFORMANCE
Accountability Reading Profile
Accountability Mathematics ProfileCurrent Algebra 1 Students
Accountability Writing ProfilePalm Beach Writes
Accountability Science Profile
LEARNING GAINS – ALL STUDENTS
Accountability Reading ProfileDiagnostic Reading Gains
Accountability Mathematics ProfileDiagnostic Math Gains
LEARNING GAINS – LOWEST 25%
Accountability Reading ProfileDiagnostic Reading Gains
Accountability Mathematics ProfileDiagnostic Math Gains
TOTAL POINTS – 800 Points Possible
300 points 300 points 100 points 100 points

112
PERFORMANCE

113
READING MATHEMATICS WRITING SCIENCE
PERFORMANCE
Accountability Reading Profile
Accountability Mathematics ProfileCurrent Algebra 1 Students
Accountability Writing ProfilePalm Beach Writes
Accountability Science Profile
LEARNING GAINS – ALL STUDENTS
Accountability Reading ProfileDiagnostic Reading Gains
Accountability Mathematics Profile
LEARNING GAINS – LOWEST 25%
Accountability Reading ProfileDiagnostic Reading Gains
Accountability Mathematics ProfileDiagnostic Math Gains
TOTAL POINTS – 800 Points Possible
300 points 300 points 100 points 100 points

114
Accountability Reading Profile-RTSFR0280

115
READING MATHEMATICS WRITING SCIENCE
PERFORMANCE
Accountability Reading Profile
Accountability Mathematics ProfileCurrent Algebra 1 Students
Accountability Writing ProfilePalm Beach Writes
Accountability Science Profile
LEARNING GAINS – ALL STUDENTS
Accountability Reading ProfileDiagnostic Reading Gains
Accountability Mathematics Profile
LEARNING GAINS – LOWEST 25%
Accountability Reading ProfileDiagnostic Reading Gains
Accountability Mathematics ProfileDiagnostic Math Gains
TOTAL POINTS – 800 Points Possible
300 points 300 points 100 points 100 points

116
Accountability Math Profile– RTSFM0281

117
Current Algebra 1 Students-RGSYM0462
Have your Algebra 1 students improved?

118
READING MATHEMATICS WRITING SCIENCE
PERFORMANCE
Accountability Reading Profile
Accountability Mathematics ProfileCurrent Algebra 1 Students
Accountability Writing ProfilePalm Beach Writes
Accountability Science Profile
LEARNING GAINS – ALL STUDENTS
Accountability Reading ProfileDiagnostic Reading Gains
Accountability Mathematics Profile
LEARNING GAINS – LOWEST 25%
Accountability Reading ProfileDiagnostic Reading Gains
Accountability Mathematics ProfileDiagnostic Math Gains
TOTAL POINTS – 800 Points Possible
300 points 300 points 100 points 100 points

119
Accountability Writing Profile—RTSFW0282
Window 5 Performance on the Palm Beach Writes

120
READING MATHEMATICS WRITING SCIENCE
PERFORMANCE
Accountability Reading Profile
Accountability Mathematics ProfileCurrent Algebra 1 Students
Accountability Writing ProfilePalm Beach Writes
Accountability Science Profile
LEARNING GAINS – ALL STUDENTS
Accountability Reading ProfileDiagnostic Reading Gains
Accountability Mathematics Profile
LEARNING GAINS – LOWEST 25%
Accountability Reading ProfileDiagnostic Reading Gains
Accountability Mathematics ProfileDiagnostic Math Gains
TOTAL POINTS – 800 Points Possible
300 points 300 points 100 points 100 points

121
Accountability Science Profile—RTSFS0332

122
LEARNING GAINS

123
READING MATHEMATICS WRITING SCIENCE
PERFORMANCE
Accountability Reading Profile
Accountability Mathematics ProfileCurrent Algebra 1 Students
Accountability Writing ProfilePalm Beach Writes
Accountability Science Profile
LEARNING GAINS – ALL STUDENTS
Accountability Reading ProfileDiagnostic Reading Gains
Accountability Mathematics Profile
LEARNING GAINS – LOWEST 25%
Accountability Reading ProfileDiagnostic Reading Gains
Accountability Mathematics ProfileDiagnostic Math Gains
TOTAL POINTS – 800 Points Possible
300 points 300 points 100 points 100 points

124
Accountability Reading Profile—RTSFR0280

125
Diagnostic Reading Gains-RTSDR0095

126
READING MATHEMATICS WRITING SCIENCE
PERFORMANCE
Accountability Reading Profile
Accountability Mathematics ProfileCurrent Algebra 1 Students
Accountability Writing ProfilePalm Beach Writes
Accountability Science Profile
LEARNING GAINS – ALL STUDENTS
Accountability Reading ProfileDiagnostic Reading Gains
Accountability Mathematics Profile
LEARNING GAINS – LOWEST 25%
Accountability Reading ProfileDiagnostic Reading Gains
Accountability Mathematics ProfileDiagnostic Math Gains
TOTAL POINTS – 800 Points Possible
300 points 300 points 100 points 100 points

127
Accountability Math Profile—RTSFR0281

128
LOW 25% LEARNING GAINS

129
READING MATHEMATICS WRITING SCIENCE
PERFORMANCE
Accountability Reading Profile
Accountability Mathematics ProfileCurrent Algebra 1 Students
Accountability Writing ProfilePalm Beach Writes
Accountability Science Profile
LEARNING GAINS – ALL STUDENTS
Accountability Reading ProfileDiagnostic Reading Gains
Accountability Mathematics Profile
LEARNING GAINS – LOWEST 25%
Accountability Reading ProfileDiagnostic Reading Gains
Accountability Mathematics ProfileDiagnostic Math Gains
TOTAL POINTS – 800 Points Possible
300 points 300 points 100 points 100 points

130
Accountability Reading Profile—RTSFR0280Performance of the Low 25% in Reading Population

131
Accountability Math Profile—RTSFR0281
Performance of the Math Low 25% Population

132
Participant’s Discussion• How has your school performed over time (Gains,
Lowest 25%, Math, Reading, Science, Writing)? At each grade level?
• What are the significant changes between Fall and Winter Diagnostic Results?
• What are your school’s strengths?
• What weaknesses do you need to address as a principal prior to FCAT and EOC administrations?

133

134
ACTIVITY
Dr. Janis AndrewsChief Academic Officer

135

136

137
Activity
• Review school data• Identify opportunities for improvement• Review strategies and resources• Pair and share

138
BREAK

139
HIGH SCHOOL ACCOUNTABILITY
Mark Howard, DirectorResearch, Evaluation and Assessment

140
HIGH SCHOOL GRADING MATRIX
“Other” Components – 50%
Acceleration Grad Rate College Readiness
Participation(150 points)
Overall(200 points)
100 points - Federal100 points – Mod 5 Yr
Reading(100 points)
Performance(150 points)
At-Risk(100 points)
50 points – Federal50 points – Mod 5 Yr
Math(100 points)
300 points 300 points 200 points

141
ACCELERATED COURSEWORK PERFORMANCE & PARTICIPATION (300 pts)
Includes:• Advanced Placement (AP)• International Baccalaureate (IB)• Advanced International
Certification of Education (AICE)• Dual Enrollment (DE)*• Industry Certification (IC)
AcceleratedCoursework
Participation Rate +Growth/Decline
150 Possible PointsSurvey 2 & 3
Performance Rate +Growth/Decline
150 Possible PointsSurvey 2 & 3
Total Acceleration Points = 300 * Student must receive a grade

142
ACCELERATED COURSEWORK (150 pts)
ParticipationNumerator Denominator
All 9th - 12th graders who took an accelerated course/exam (weighted)
All 11th and 12th graders (excludes FAA students)and any grade 9-10 students in the numerator
PerformanceNumerator Denominator
Number of successful completions in accelerated coursework (weighted) by students in grades 9-12
All 9th through 12th graders who took an accelerated exam/dual enrollment course

143
ACCELERATED COURSEWORK (150 pts)
ParticipationNumerator Denominator
All 9th - 12th graders who took an accelerated course/exam (weighted)
All 11th and 12th graders (excludes FAA students)and any grade 9-10 students in the numerator
PerformanceNumerator Denominator
Number of successful completions in accelerated coursework (weighted) by students in grades 9-12
All 9th through 12th graders who took an accelerated exam/dual enrollment course

144
Percent of AP Tests Passed by Race/Ethnicity in the SDPBC
FY2008 FY2009 FY2010 FY2011 FY20120%
20%
40%
60%
80%
100%
AsianBlackHispanicIndianWhiteSDPBC

145
AP Test Participation Rate by Race/Ethnicity in the SDPBC
FY2008 FY2009 FY2010 FY2011 FY20120%
20%
40%
60%
80%
100%
AsianBlackHispanicIndianWhiteSDPBC
146
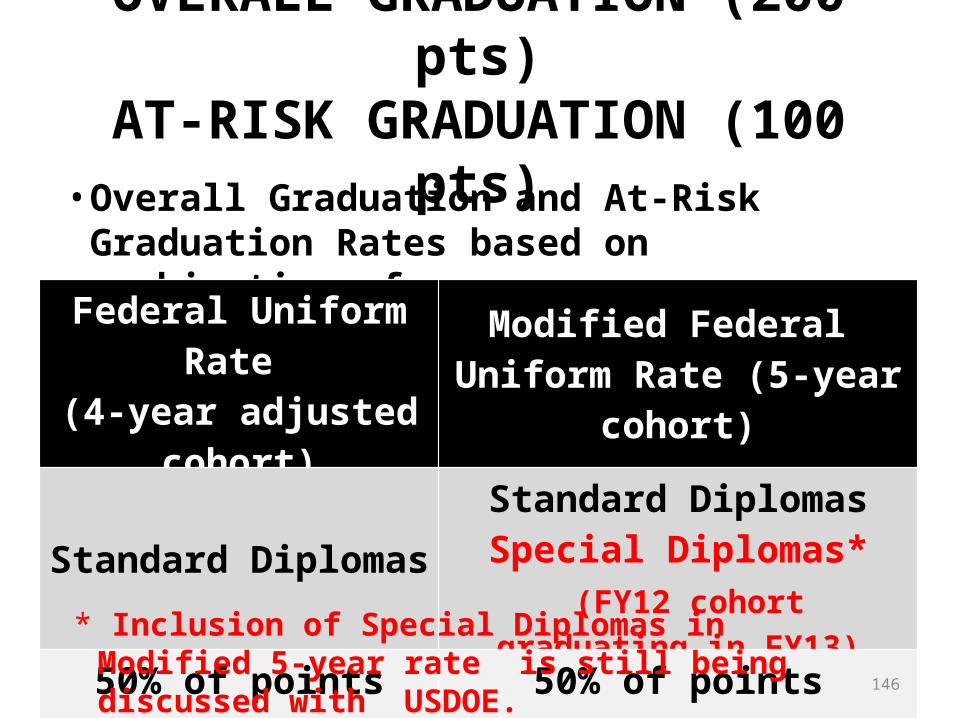
OVERALL GRADUATION (200 pts)AT-RISK GRADUATION (100 pts)
• Overall Graduation and At-Risk Graduation Rates based on combination of:
Federal Uniform Rate (4-year adjusted cohort)
Modified Federal Uniform Rate (5-year cohort)
Standard DiplomasStandard DiplomasSpecial Diplomas*
(FY12 cohort graduating in FY13)
50% of points 50% of points
* Inclusion of Special Diplomas in Modified 5-year rate is still being discussed with USDOE.

147
AT-RISK GRADUATION (100 pts)
• At-Risk Threshold 65% to earn “A”• Based only on 4-year Federal Rate
Consequences for “A” schoolsAt-Risk Rate Consequence
65% + No Reduction (“A” is maintained)
55% - 64% “A” reduced to “B” unless improvement of 1% or more made over the prior year
54% and Below “A” reduced to “B” unless improvement of 5% or more made over the prior year

148
COLLEGE READINESS (200 pts)
Numerator Denominator
Number of students (from denominator) scoring
“ready” on SAT, ACT, CPT, P.E.R.T. any time during high
school
All on-time (4-year) graduates
Highest Score
by Subtest
P.E.R.T. Writing scores are NOT part of school grading

149
HIGH SCHOOL GRADING MATRIX
Statewide Assessment Components – 50% “Other” Components – 50%
Reading Math
(Alg & Geo) Writing Science
(Biology) Acceleration Grad Rate College
Readiness US
History
Performance
Learning Gains All Students
Low 25% Learning Gains
POINTS POINTS POINTS POINTS POINTS POINTS POINTS POINTS
BONUS
GROWTH/DECLINE
calculated for each sub-component
then added together for total-
points adjustment

150
OTHER COMPONENTGROWTH/DECLINE POINTS
GROWTH• For each component, schools may earn up to 10 additional
points for growth based on increase over the prior year according to the following measures:
DECLINE• For each component, schools who drop 10 percentage points,
lose 5 points for decline
Points Increased over Prior Year
Growth Points Earned
0 to 4 None
5 to 9 5
10 + 10

151
OVERALL GRADUATION & AT-RISK GRADUATION
GROWTH/DECLINE calculated separately for each rate then added together OR subtracted for total-points adjustment
Federal Uniform Rate (4-year adjusted cohort) Growth Decline
Modified Federal Uniform Rate (5-year cohort) Growth Decline
Adjustment AdjustmentTotal Adjustment
OTHER COMPONENTGROWTH/DECLINE POINTS

152
HIGH SCHOOL GRADE ACCOUNTABILITYACCELERATED COURSEWORK, GRADUATION,
COLLEGE READINESS
• Accelerated Coursework Participation/Performance• Equally weighted (150 pts each)• 9th and 10th graders TAKING in numerator and denominator
• Graduation and At-Risk Graduation Rates• 50% Federal Uniform Rate
(4-year cohort)• 50% Modified Federal Uniform Rate
(5-year cohort)
• College Readiness• Includes all on time graduates
• Growth Points limited to 10 points

153
For Additional Support
ContactMark Howard, DirectorPX: 48781
Nancy Brito, SpecialistPX: 47521
http://www.palmbeachschools.org/assessment/SchoolGrade.asp

154
GRADUATION RATES
PJ D’Aoust, DirectorFTE & Student Reporting

Graduation Rate and Requirements Essential Training
FTE & Student Reporting/Single School Culture Initiatives
PJ D’AoustJason SmithEunice Vivar GreenfieldAmy Mazzocco

156
Graduation Requirements Into 9th FY2010
• 24 Credits– 4 English– 4 Math (including Algebra 1)– 3 Science (Biology, Phys. Sci., Sci. Elec.)– 3 Social Studies (US Hist., World Hist., Econ., Gov.)– 1 Fine/Performing Art– 1 PE– 8 Electives
• 2.0 GPA• FCAT Reading and Math• 20 Community Service Hours

157
FCAT ConcordanceAssessment Reading Mathematics
2009-2010 2010-2011 and beyond
2009-2010 and earlier
FCAT N/A N/A 1889 (scale score of 300)
FCAT 2.0 241* 245 N/ASAT 420 430 340ACT 18 19 15
*Students who participated in the Spring 2011 Grade 10 FCAT 2.0 Reading assessment received scores called FCAT Equivalent Scores that were reported on the FCAT score scale, and the passing score was 1926 (scale score of 300). This is concordant (or comparable) to a score of 241 on the FCAT 2.0.

158
Looking Forward
• Into 9th 2011 (current 11th graders) – Need a full credit of Geometry to graduate
• Into 9th 2012 (current 10th graders) – Must pass Algebra 1 EOC to earn credit in the class. Need a full credit of Geometry to graduate
• Into 9th 2013 (current 9th graders) – Must pass Algebra 1, Geometry and Biology EOCs to earn credit in the class. Need a full credit of Algebra 2 to graduate

159
NCAA
• 15.3% of students enrolled in college for the 09-10 SY would not meet the new 2016 standards.
• 35.2% of football players enrolled in college for the 09-10 SY would not meet the new 2016 standards.
• 43.1% of men’s basketball players enrolled in college for the 09-10 SY would not meet the new 2016 standards.

160
NCAA Changes for 2016 Eligibility
• Full Qualifiers must:– GPA greater than or equal to 2.3– Sliding Scale change (see handout)– Ten core courses required BEFORE beginning of 7th
semester (beginning of Senior year)– 7 of the 10 must be in English, math or science– Those 10 courses become locked in for GPA
calculation

161
NCAA Eligibility Resources
• Bulletin # HSP-1964-CLS/K12C
• NCAA Eligibility Website www.eligibilitycenter.org
• Quick Reference Sheet

162
Grading Issues
• Grade Forgiveness• Duplicate Courses• Missing Grades
– Incompletes– Improper W/D or Schedule Change Procedure– Blank Grades

163
Cohort Info
• First Year in District Sets Cohort
• Set at End of Year (Survey 5)
• IE…Last Day of School Sets Cohort!

164
Grade Classification Change
• Starting with 2013 we now handle grade classification by Needed Credit instead of Earned
• Example – Student who completed three years of high school in another district enters the SDPBC with 20 earned credits, but needs 10. This student would be an 11th grader for their 4th year of high school with us.

165
Withdrawal CodesHow they affect the Graduation Rate (Federal Uniform Rate)
Completers (these students are the numerator if code is within 4 years from entering 9th grade)
• WFA GRAD STD DIPL-18 CRD CO/ALT ASSMT• WFB GRAD STD DIPL-18 CRD CAR/ALT ASSM• WFT STD GRAD FCAT WAIVER/ALT ASSMT• WFW STD GRAD ESE W/FCAT WAIVER• W06 GRADUATE WITH STANDARD DIPLOMA• W6A STD DIPLOMA 18 – CRDT COL PREP• W6B STD DIP 18 CRDT CAREER PREP• W43 HIGH SCHOOL DIPLOMA THROUGH ADULT ED• W52 HS DIPLOMA THRU ADULT ED/ALT ASSMT

166
Withdrawal CodesHow they affect the Graduation Rate (Federal Uniform Rate)
Left District (these students removed from grad cohort – the cohortis the denominator)
• W3A WD TO ANOTHER DIST IN STATE• W3B WD OUT-OF-STATE• W04 WD PRIVATE SCHOOL • W12 WITHDRAWN DUE TO DEATH• W24 WD HOME EDU PROGRAM

167
Withdrawal CodesHow they affect the Graduation Rate (Federal Uniform Rate)
Dropout (these students are the numerator for the District Dropoutrate (grades 9-12) and remain in the grad cohort)
• W05 OVER COMPULSORY AGE, NO RETURN• W13 WD DUE TO COURT ACTION• W15 WD DUE TO NON-ATTENDANCE• W18 WD FOR MEDICAL REASON• W21 WD DUE TO EXPEL SCHL• W22 WD-WHEREABOUTS UNKNOWN• W23 WD EXCPT W01, W22, W24-W26

168
Withdrawal CodesHow they affect the Graduation Rate (Federal Uniform Rate)
Non-Grad (not a Dropout but remains in grad cohort – these studentsleft the district and did not re-enter a district school)
• W01RETURN TO SAME SCHL (CREDIT DEFICIENT)• W02XFER DIFF SCHL SAME DISTRICT (CRED DEFICIENT)• W07GRAD/SPECIAL DIPOLMA-1MASTERY• W08CERTIFICATE OF COMPLETION (GPA DEFICIENT)• W8AGRAD ELIG FOR CPT W/O MASTERY (TEST DEFICIENT)• W09SPECIAL CERTIFICATE COMPLETION • W10GED –ST OF FL HIGH SCHL DIPLOMA• W27GRAD/SPECIAL DIPLOMA-2MASTERY• W26ENTER ADLT PROG, NOT GRAD• W45STUDENT LEFT SCHOOL WITH GED• WGA GED EXIT OPTION/ALT ASSMT• WGD WITHDRAWAL – GED EXIT OPTION

169
Cohort Scenarios
• Where’s Waldo?
• Student registering in May
• Private School Students
• Transfers to Adult Education
• ELL Students

170
Gatekeeper (Grad Contact)
Monitors the Following:
• Point Person Between Dept and School• Dropout Reports Faxed, Notification to Principal• Entrance into Cohort• Non-Attendance• Mid-Year Promotes (promoting ahead of cohort)
• Dropouts (including Adult Ed Non-Completers)

171
Cleaning up Your Dropout ReportLocating Dropouts
• Phone Calls• Ask a Friend• Facebook• Relatives • Teachers
• IE: Beat the Bushes!
Goal: Back in School or Report as Left Cohort

172
Left Cohort Students
Documentation is Kept at School Site!
• W/D Form
• Transcript Request
• Non-Completer Form (PBSD 2377)

173
5 Year Graduation Cohort
• Based on Previous Year’s 4 Year Cohort
• Students can not enter or leave the cohort
• Any student who graduates before the next school year counts in the numerator (including the 4 year graduates)
• Includes Special Diplomas (W07, W27)
• Student can graduate from ANY school in SDPBC, but will count toward the school they were attached to in the 4 Year Cohort

174
Questions?
• Jason Smith – 434-7390 px 47930
• Eunice Vivar Greenfield–434-8820 px 48820
• Amy Mazzocco – 432-6348 px 86348
• PJ D’Aoust – 434-8824 px 48824

175
RESOURCES AND SUPPORT
Becky Youngman, ManagerSingle School Culture Initiatives
Pete Licata, DirectorChoice and Career Options

Essentials Training:Accelerated Coursework and College Readiness
Janis Andrews, Assistant SuperintendentCurriculum & Learning [email protected]
Keith Oswald, Assistant SuperintendentCurriculum & Learning [email protected]

Accelerated Coursework
Participation and
Performance

Preparation for Success in College
A 1999 U.S. Department of Education study found that the strongest predictor of college graduation is something students do before they ever go to college:participate in rigorous, college-level courses in high school - and AP courses in particular.
(Clifford Adelman, Answers in the Tool Box: Academic Intensity, Attendance Patterns, and Bachelor’s Degree Attainment, 1999, U.S. Department of Education)

Scheduling Students for Accelerated Course Work
• Check AP Potential report.
• Contact students and parents to discuss options (AP vs. Dual
Enrollment).
• Counselors should work closely with administrative team in
developing the master schedule.
• Consider minimizing the amount of “No-Class” or “Senior Privilege.”
• Emphasize the importance of seniors taking core subject courses
during senior year.

Dual Enrollment
– Students need a minimum 3.0 GPA.
– Students must meet the college ready test scores in
ALL subject areas of either the SAT, ACT, or PERT.
– Students are advised by counselor that ALL dual
enrollment coursework is shown on their high
school and college transcript.

AICE
Advanced International Certificate of Education (AICE) Diploma
• University of Cambridge• Fourteen schools have approved AICE
programs.• Exams held in a series of components (papers)
from April – June.• Success on exams can earn students college
credit similar to AP and IB.

Score Comparison
AP Cambridge
Passing5 A
4 B, C
3 D, E
2 F
Not Passing1 G
U = Ungraded

AICE Funding
• Teacher bonus of $50 per AS exam passed.
• Weighted FTE of .16 to district for each AICE exam passed with CIE grade E or higher AND .30 per AICE Diploma awarded
• Florida Bright Future FL Academic Scholarship for AICE Diploma recipients with 100 hours community service

AICE Diploma
• A student may earn an AICE diploma as a result of earning 6 exam credits.– AS Level exam = one exam credit if passed– A Level exam = two exam credits if passed
• At least one of those exam credits must be earned on a language exam (e.g., AICE English).
• In addition to language, at least one credit must be earned in two additional disciplines, such as social science, art, science, or math.

Advanced Placement• Thirty-four (34) AP courses and exams are
offered in 19 subject areas• A committee of college faculty and
experienced AP teachers develops each course and exam.
• Passing scores = 3, 4 or 5• College recognition/placement• Submission of syllabi to AP Course Audit for
approval (Jan. 31 final deadline)

AP and College Success™
Students who take AP courses and exams are much more likely than their peers to complete a bachelor’s degree in
four years or less.Source: Camara, Wayne (2003). College Persistence, Graduation, and Remediation. College Board Research Notes (RN-19). New York, NY: College Board.
0
10
20
30
40
50
60
70
29
45
61
No APOne APTwo+ AP

AP Helps Students Graduate on Time
• Only 1 in 4 students who enter college will complete their bachelor’s degree in 4 years.
• Research consistently shows that students taking AP courses and exams have a much higher likelihood of earning their college degree in 4 years.
• Students who take 5 years or more typically spend $18,000-$29,000 more each year to complete their degree.
www.collegeboard.com/research

AP and Traditionally Underserved Students• African American and Hispanic
students who took AP courses and exams earned higher grades in college than other African American and Hispanic students from the same SAT® range and the same socioeconomic background who had taken only regular high school courses or dual enrollment courses.
• African American, Latino, and low-income students scoring 3+ experience much higher college graduation rates than comparable non-AP students.
“College Outcomes Comparison by AP and Non-AP High School Experiences.” Barbara G. Dodd, Linda Hargrove, Donn Godin (2008). Full study can be found at: www.collegeboard.com/research

Participation & PerformancePalm Beach County AP Exam Score Summary
School Year Number of Exams
#1+2 1+2% #3+4+5 3+4+5%
2005-06 14,570 7,310 50.2% 7,260 49.8%
2006-07 16,467 8,181 49.7% 8,286 50.3%
2007-08 16,874 8,306 49.2% 8,568 50.8%
2008-09 17,972 8,578 47.7% 9,394 52.3%
2009-10 24,087 12,533 52.03% 11,554 47.96%
2010-11 25,473 12,590 49.4% 12,883 50.6%
2011-12 25,573 11,557 45.2% 14,016 54.8%

Create your first workbook

Participation: Open Access
Parent Night • Student testimonials• Guest speakers• Course brochures• Bulletin for AP Students and
Parents (download – AP Central)• Explore AP site
• Expand course offerings– Student interest surveys– AP Potential
• AP Potential– PSAT for all 10th graders– Expand pool of candidates for
diversity and size.– Generate personalized letters.– Whole school awareness
• Targeted Recruitment– Administration/teachers personally
recruit students.– Identify classes for recruitment.– Peer recruitment
• Work with feeder middle schools

Professional Development Opportunity
AP Potential® and My College QuickStart® (half day training)
AP Potential® is a highly effective tool for identifying and recruiting students to increase participation in Advanced Placement courses, as well as identifying which courses should be considered for expansion of your AP program.
My College QuickStart® is an online college and career planning tool available free of charge to all students who take the PSAT/NMSQT. It provides personalized information that helps students take their next steps toward college.
Register through TrainU to attend the morning or afternoon session on February 7, 2013.

Supporting Teacher Success• Professional Development
– AP Roundtables, AP Summer Institutes, Subject area one-day seminars, Pre-AP and Vertical Team workshops, AICE online and face-to-face trainings
• AP department with a lead teacher
• Common planning• Peer mentors• Online resources
– AP Central; AICE Teacher Support site
– Sharepoint, TrainU
• Data Chats– AP Instructional Planning Reports– Mock exam results to drive
instruction– Course grade distribution vs. exam
results
• Ongoing monitoring of instruction – Use course descriptions to identify
‘look fors’ and analyze syllabi.
• Encourage teachers to become AP Readers.

Supporting Student Success
• Promote extended learning opportunities– Tutorials – after school, lunch, Saturday, pull out– Free online tutoring (PrepU, Hippocampus, Sparknotes, FLVS)– Peer study groups– AVID/study strategies for all students
• Prepare students for AP/AICE/IB exam/format– Mock exams– Review/use rubrics, exemplars– Use practice exams to focus instruction or tutoring– Pre-grid answer sheets (identify sections)
Summer enrichment/preparatory programs Recognize success

Supporting Program Success
• Guarantee rigorous instruction• Monitor grades and provide timely support• Consider non-traditional course groupings• Establish incentive programs• Use online tools:
– AP Potential– AP Central– You Can Go!– My NMSI Story
• Use data:– School Score Summary Report– Five Year School Score Summary Report– Instructional Planning Reports for each subject– EDW Reports

Scheduling to Promote Accelerated Participation and Performance
• Course progression – Create four-year plans at freshman orientation.
• Rigorous pipeline – Encourage student placement in accelerated courses earlier. – Algebra I, Geometry– World Languages– SpringBoard®
• Identify gateway courses appropriate for underclassmen as well as seniors.
• Identify alternate pathways for underserved students.

Scheduling to Promote Accelerated Participation and Performance
• Stretch course by pairing AP with honors– Examples:
• Economics, government stretch to a year course by pairing with honors first semester;
• Honors English with AP English Language – same teacher loops with students for a two-year block of preparation.
• Calculus/Physics Block for periods 4 & 5 (same teacher – sees students every day)
• Algebra II teacher loops up to AP Statistics with students.
• Multiple teachers for same course– Team teaching– Common planning
• Run honors section parallel to AP.

College Readiness
Participation and
Performance

School Day SAT
• Wednesday, February 27, 2013• All juniors should now be registered.• Online Test Center Supervisor Training mandatory
(complete by Feb. 13th)• TrainU site• SAT School Day Microsite

Train U: SAT School Day Site

201
NEW! Online Microsite for Palm Beach County School Day SAT

202
Administrator Microsite

Communication Strategies
– Edline– ParentLink– Parent information
sessions– Newsletters– Flyers – hallways, front
office, counselor offices, bus loop, community locations
– Marquee
– Announce in classes – Morning
announcements– School website– SAC meetings– Send test reminders via
automated phone system before test day
– Email– SAT School Day Microsite

Additional Opportunities
SAT testing sessions
• March 9 (Register by Feb. 8) • May 4 (Register by April 5) • June 1 (Register by May 2)• College Board Photo Policy
ACT testing sessions
• April 13 (Register by March 8) • June 8 (Register by May 3)

Participation Strategies for Seniors
• Identify seniors who have not yet achieved college ready status.
• Counselors provide whole class, small group, or one-on-one sessions to register students.
• Graduation coaches or other designated staff provide individual assistance to register students.
• Utilize computer/mobile lab setting to assist students in setting up web accounts to register for the SAT/ACT.

English IV: Fl College Prep
• A group of 12th grade students were placed into English IV: Fl College Prep because they were not college ready (non-proficient score on PERT; no concordant SAT or ACT scores).
• The curriculum for this course was developed with officials from state colleges to ensure students are prepared for credit-bearing college courses.
• These 12th grade students will retake the PERT this year. If they have been remediated in the course and pass the test, they are now college-ready.

Create your first workbook
A scope, daily lesson plans, and textbooks are available to support teachers of this course.

Learning Village: Literacy College Readiness Lessons
Lessons are available for test preparation for PSAT, ACT, and SAT.

Lessons and resources are available for all aspects of the SAT, including the essay portion.

In all 11th grade English lessons, SAT practice/activities are available every Monday and Friday; ACT practice is available every Monday.

Math For College Readiness• 12th grade students were placed into Math for College Readiness
because they were not college-ready (non-proficient score on PERT; no concordant SAT or ACT scores).
• The curriculum for this course was developed with officials from state colleges and high school mathematics educators to ensure students are prepared for credit-bearing mathematics college courses.
• These 12th grade students will retake the PERT this year. If they have been remediated in the course and pass the test, they are now college-ready.


Performance Strategies•All juniors have free access to official SAT Online Course until October 2013.-Encourage student use.-Review student progress with online course reports.
$69.95 value: FREE!

Performance Strategies• Orient students to the many resources available to
them for practice and support:– Question of the Day (Register online for email notification
or phone app.)– Free online practice tests– SAT Skills Insight– My College Quickstart for personalized practice– Learning Village

Free SAT Practice Tools
All students have access to free SAT practice tools at sat.collegeboard.org/practice:
Official SAT Question of the Day
Official SAT Practice Test
Practice Questions
My SAT Study Plan
Math Content review
Effective Writing Review
SAT Skills Insight

SAT and ACT Online Resources
• ACT Home Page
• iTunes Address
• SAT Home Page
• iTunes Address

SAT Student Practice: Winter Packets

SAT Student Practice: Winter Packets

E2020 ACT/SAT Virtual TutorEnroll all juniors and seniors in E2020 to take the SAT/ACT preparation Virtual Tutor modules.
School Use• Can be used in diagnostic/prescriptive self-study mode with students• Teachers can monitor student progress online.• May also be accessed by teachers for small/whole group instruction as well
as pull-out, after-school, or Saturday tutorial classes
Enrollment• Whole grade levels may be programmatically assigned courses by having the
school’s e2020 administrator email the request to Heidi Putre.• If the school chooses to have specific classes or individual students assigned
to the VT course(s), this needs to be requested via the school’s guidance counselor.

Motivation Strategies• Offer incentives.
– School privileges– Special activities– Refreshments– Monetary prizes
• Provide students with opportunities to review their college readiness data.– Review ACT/SAT and appropriate EDW reports individually.– Help students to develop an action plan to achieve college
readiness goals.• Schedule college readiness awareness assemblies to provide
information on SAT/ACT/PERT exams.

Contacts
• Curriculum and Resources: – Nancy Kinard, Mathematics Manager 434-8250 (PX 48250)– Diana Fedderman, Secondary Literacy Program Planner 357-5989 (PX
25989)
• ACT/SAT and Advanced Placement/AICE:– Becky Youngman, College Readiness Manager 982-0945 (PX 50945)
• E2020:– Heidi Putre, Assistant Principal Palm Beach Virtual 752-1238 (PX 41238)
• Counseling and Dual Enrollment– Eunice Greenfield, School Guidance Specialist 434-8820 (PX48820)– Judy Thomas, School Guidance Program Planner 434-8456 (PX 48456)

Additional Resources• College Board
– “Opening Classroom Doors: Strategies for Expanding Access to AP”– “Portrait of AP Teacher Practices”– “Teacher Practices and Student AP Exam Performance”– AP Planning Calendar– AP Coordinator’s Guide– Free AP brochures– AP Central (teacher resources)– 8th Annual AP Report to the Nation (to be released Feb. 8, 2012)– Online Score Reports
• Broad Foundation – “Expanding Access to AP”

Career & Technical Education
Engage, Educate, Empower…
School District of Palm Beach CountyHS Principal Training

What is the Purpose of anIndustry Certification (IC) Exam?
• Demonstration of ability or mastery of knowledge/content based on curriculum taught to the student—Validation!
• Stamp of approval from a professional organization, trade organization, or IT vendor.
• Preparing the student for further education and eventual employment. “College and Career Readiness”.

228
Industry Certification Facts
• In FY2010, FY2011 and FY2012 39 Industry Certifications Offered
(33 in FY 12) Top Five Industry Certifications
Earned Microsoft Office Specialist
(MOS) Bundle Adobe Certified Associate
(Photoshop) Certified Medical
Administrative Assistant (CMAA)
Certified EKG Technician (CET) Adobe Certified Associate
(Dreamweaver)FY2010 FY2011 FY2012
0
1000
2000
3000
4000
5000
6000
7000
8000
9000
10000
7201
8916
6430
3288
45844923 Taken
Pass
Why the decrease in participation in FY’12?

229
Industry Certification Passage Rate Increases
• The pass rate increased from 51% in FY2011 to 77% in FY2012.
FY2010 FY2011 FY20120
1000
2000
3000
4000
5000
6000
7000
8000
9000
10000
7201
8916
6430
3288
45844923 Taken
Pass

Career Themed Course (CTC)
• A “career themed course” ‐ is a course, or a course in a series of courses, that leads to an industry certification identified in the Industry Certification Funding List pursuant to rules adopted by the State Board of Education. Career themed ‐courses have industry specific curriculum aligned directly to ‐priority workforce needs established by the regional workforce board or the Department of Economic Opportunity.
• CTC’s must meet the same statutory requirements as a CAPE academy
• Registration process for CTC will go through the coordinator at your school.

Statutory Requirements (s.1003.493)
Each Career and Professional Academy and Secondary School offering a “Career themed ‐Course” must:
Provide a rigorous standards based ‐ academic curriculum integrated with a career theme;
Include one or more partnerships with postsecondary institutions, businesses, industry, employers, economic development organizations, or other appropriate partners from the local community;
Promote and provide opportunities for students to earn at a minimum Florida Gold Seal Vocational Scholars awards;
Provide instruction in high skill, high wage, and high demand careers; Deliver instruction relevant to the applicable career, including intensive reading and mathematics intervention; Offer applied courses that combine academic content with technical skills; Provide instruction resulting in competency, certification, or credentials in workplace
skills;

232
Future Implications• Cause/Effect to Industry Certification passage rates• Compliance with Perkins requirements for use of funded
equipment on non-CTE courses• Emphasize the importance of Career & Technical Education by
ensuring students follow the proper sequence of courses outlined in the curriculum frameworks and appropriate Program of Study
• Provide additional learning experiences outside of the classroom for students to gain more hands-on knowledge
• Pre-test (where applicable) students prior to taking industry certifications to determine the best candidates to sit for actual industry exams
• Middle school industry certifications are being explored to have the least affect on high school industry certifications

233
Long Term PlanFollow the Program of Study for Each Student - Sample
*in process of confirming with state

234
Final Thoughts
• Preparing for SY ‘14 • Individual School technical assistance with CTE
specialists.– Maximize the potential of students earning IC, acceleration
points, and program benefits
THANK YOUContact: Peter B. Licata, Director
Email: [email protected] or PX -45820

235
EDW REPORTS
Dr. Sandra Raymond-Roberts, ManagerEducational Data Warehouse

High School Accountability Actions
Educational Data Warehouse (EDW) Reports and Summaries

Purpose
Relate New EDW reports and summaries to each of the high school rule components.
Provide user information to increase Accelerated Participation and Performance.
Provide user information to increase College Reading Readiness and College Math Readiness.
Illustrate related reports or summaries.

High School Accountability
Grade Scale: A >= 1050 B 990 to 1049 C 870 to 989 D 790 to 869 F < 790
Pathway: FAMILIES>>HIGH SCHOOL ACCOUNTABILITY: GRADUATION, ACCELERATION , AND READINESS
GRADUATION ACCELERATION READINESS GROWTH/DECLINE
Overall Rate200
Survey 5
Participation 150 (in 2013)
Survey 2 and 3
Performance on Reading
100Survey 5
School gains one point for each annual percentage increased from prior year
For each component, schools may earn up to 20 additional points for GROWTH
(40 points for factors worth 200 points)All components are capped at their maximum
value.
At-Risk Rate100
Survey 5
Performance 150 (in13)
Survey 2 and 3
Performance on Math100
Survey 5
School loses 5 points if a component DECLINES by at least 10 percentage points from prior year
(10 points for factors worth 200 points)
Total Graduation Points
300
Total Acceleration Points 300
Total Readiness Points 200
Total NEW HIGH SCHOOL Points Possible800

OVERALL RATE
Graduation
Four-Year Graduate: Students who entered 9th grade in 2010 or transferred into your school in the appropriate grade level meet the graduation criteria.
Five-Year Graduate: FY12 Cohort Graduates which includes students with Special Diplomas, plus, students from FY12 cohort who graduate in FY13 with Standard Diplomas and Special Diplomas.

Potential Students for High School Graduation Rate-RXSOA0438
Who is monitoring these students?

Graduation Status - RSSOA0034
Where are your 5-year graduates?

AT RISK RATE
Graduation
NOTE: Law stipulates that in order for a school that earns enough points for an “A” to be awarded an “A”, the school’s at-risk graduation rate must meet a certain threshold to ensure “adequate progress.”
Students who earned a Level 1 or 2 on both the Grade 8 FCAT 2.0 Reading and Mathematics (including scores for repeaters in sequential years and Special Diploma students who have Grade 8 FCAT 2.0 results)

Potential Students for At-Risk Graduation Rate-RXSOA0437
Notice the current grade and withdrawal categories—Active and Dropouts

PARTICIPATION
ACCELERATION
Numerator: All students in grades 9 through 12 who took an accelerated exam and/or dual enrollment course.
Denominator: All students in grades 11 and 12 at the same school in surveys 2 and 3 (each student counts only once) and all grades 9 and 10 students who took accelerated exam and/or dual enrollment course reported on Survey 5 (SWDs in grades 11 and 12 who took the FAA will not be included.)

What are Your School’s Participation Percentages for Advance Placement
Courses?

Accelerated Participation in AP-RTSUA0405
•Met PSAT probability of success•Met FCAT success•Currently enrolled in the course•Passed the course

Current and Potential Course Rosters
Accelerated Participation in AP-RTSUA0405

Accelerated Participation in AP-RTSUA0405
Potential rosters of courses not taught in school

ACCELERATION
Performance
Numerator: A weighted count of successful completions for students in the denominator
Denominator: All unweighted and unduplicated count of students in grades 9 through 12 who took at least one AP, IB, AICE, or Industry Certification examination or at least one dual enrollment course. Students in survey 2 and 3, exam results reported on Survey 5.

PERFORMANCE ON READING
Readiness
“On-time” high school graduates who scored “ready” on the SAT, ACT, PERT, and/or CPT any time during their high school careers.

POTENTIAL STUDENTS IN POSTSECONDARY READINESS REPORT-RESQA0440
Identifies students meeting college readiness in reading.
SAT ACT CPTPERT

PERFORMANCE ON MATHEMATICS
Readiness
“On-time” high school graduates who scored “ready” on the SAT, ACT, PERT, and/or CPT any time during their high school careers.

POTENTIAL STUDENTS FOR POST SECONDARY READINESS REPORT-RESQA0440
Identifies students meeting college readiness in Math
SAT ACT CPTPERT

MONITORING PROGRESS TOWARD A PLUS GOALS FOR HIGH SCHOOLS - RTOOA0445
Fall Winter