Middle School Essentials CAO Meeting February 2013 Dr. Andrews Chief Academic Officer.
133
Middle School Essentials CAO Meeting February 2013 Dr. Andrews Chief Academic Officer
-
Upload
breana-rumley -
Category
Documents
-
view
213 -
download
0
Transcript of Middle School Essentials CAO Meeting February 2013 Dr. Andrews Chief Academic Officer.

Middle School Essentials
CAO MeetingFebruary 2013
Dr. AndrewsChief Academic Officer

2
MIDDLE SCHOOL ACCOUNTABILITY
Mark Howard, DirectorResearch, Evaluation and Assessment

3
How many changes to the FDOE Accountability system in 2012?
A.9B. 17C. 23D.34
Correct Answer
34!

4
MIDDLE SCHOOL GRADING MATRIXReading Math Writing Science Acceleration
Performance
High School EOCs,
Industry Certifications(100 points)
FCAT 2.0, FAA(100 points)
FCAT 2.0, FAA, EOCs
(100 points)
FCAT, FAA(100 points)
FCAT, FAA(100 points)
Learning Gains All Students
FCAT 2.0, FAA(100 points)
FCAT 2.0, FAA EOCs
(100 points)
Low 25% Learning Gains FCAT 2.0
(100 points)FCAT 2.0
(100 points
(300 points) (300 points) (100 points) (100 points) (100 points)

5
MIDDLE SCHOOL GRADE ACCOUNTABILITYPERFORMANCE, LOWEST 25% LEARNING GAINS
FY2013• Reading Performance Penalty• Math – FCAT 2.0, Algebra 1
and Geometry EOC• Geometry Achievement Levels
• Science – FCAT 2.0• FCAT 2.0 Achievement Levels
• Writing – 3.5 Score, 60 Minutes• Lowest 25% Adequate Progress Penalty Reinstated
POINTS
A At least 590
B 560 to 589
C 490 to 559
D 445 to 489
F Fewer than 445
I Below 90% tested
Grade Scale for Middle Schools(Based on a 900-Point Scale)
6
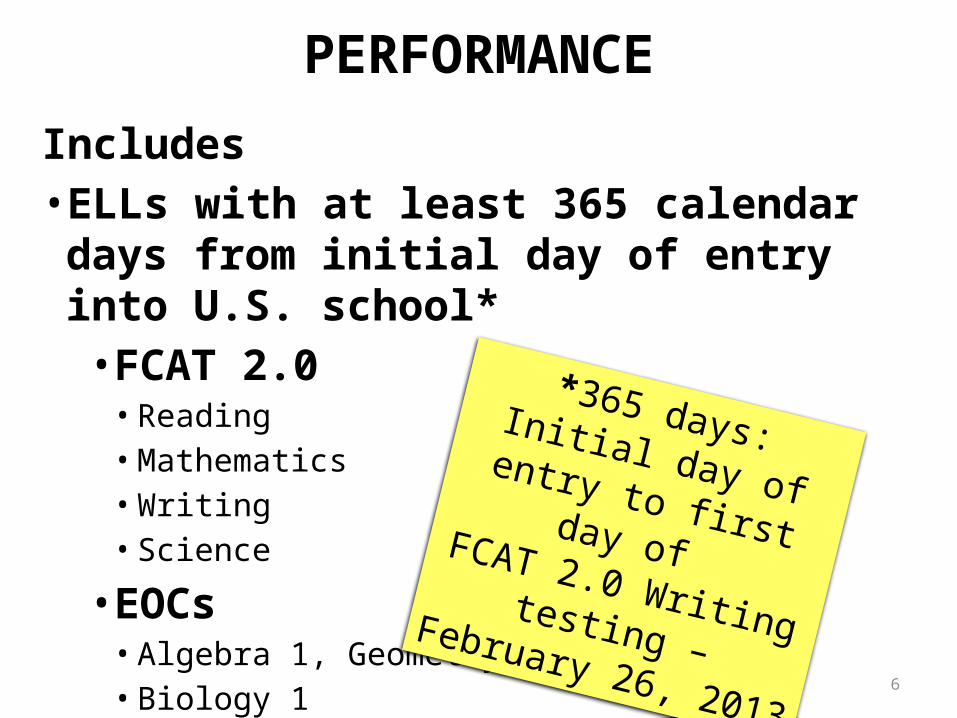
PERFORMANCE
Includes• ELLs with at least 365 calendar days from initial
day of entry into U.S. school* • FCAT 2.0
• Reading • Mathematics• Writing • Science
• EOCs• Algebra 1, Geometry • Biology 1
*365 days: Initial day of entry to first day of
FCAT 2.0 Writing testing – February 26, 2013

7
READING PERFORMANCE (100 pts)
•One (1) point for each percent of eligible students scoring
• FCAT 2.0 Achievement Scale Levels 3+• FAA Scale Levels 4+
Emergent
1 2 3
Achieved
4 5 6
Commended
7 8 9
At least 30
students with
valid reading
scores

8
Reading Performance Threshold PenaltySchool grade lowered one letter grade if 25%
Reading Performance threshold not met
Schools that have their grade lowered for not meeting other targets (e.g., Adequate Progress of the Lowest 25%, At-risk Graduation Rate) will not have their grade lowered further.
READING PERFORMANCE (100 pts)

9
Reading: Percent ProficientFY12 Spring to FY13 Winter Diag Difference
All Students Tested
-14.0
-12.0
-10.0
-8.0
-6.0
-4.0
-2.0
0.0
2.0
4.0
6.0 54 4 4
3
1 1 1 1
-1-1 -1 -1 -2 -2 -3
-3 -3 -4 -4-5
-6 -6 -6-7
-9 -9
-11

10
MATH PERFORMANCE (100 pts)
• One (1) point for each percent of eligible students scoring• FACT 2.0 Level 3+• Algebra 1 Levels 3+ • Geometry Levels 3+• FAA Scale Levels 4+
Florida EOC Assessment Scale Scores (325 to 475) for each Achievement Level:Level 1 Level 2 Level 3 Level 4 Level 5
Geometry 325-369 370-395 396-417 418-433 434-475
Geometry Achievement Levels
At least 30
students with valid
mathematics
scores
Student with both, an FCAT 2.0 Mathematics scores and one or more EOC scores, the higher/highest scores in a Mathematics subject will be used.
11
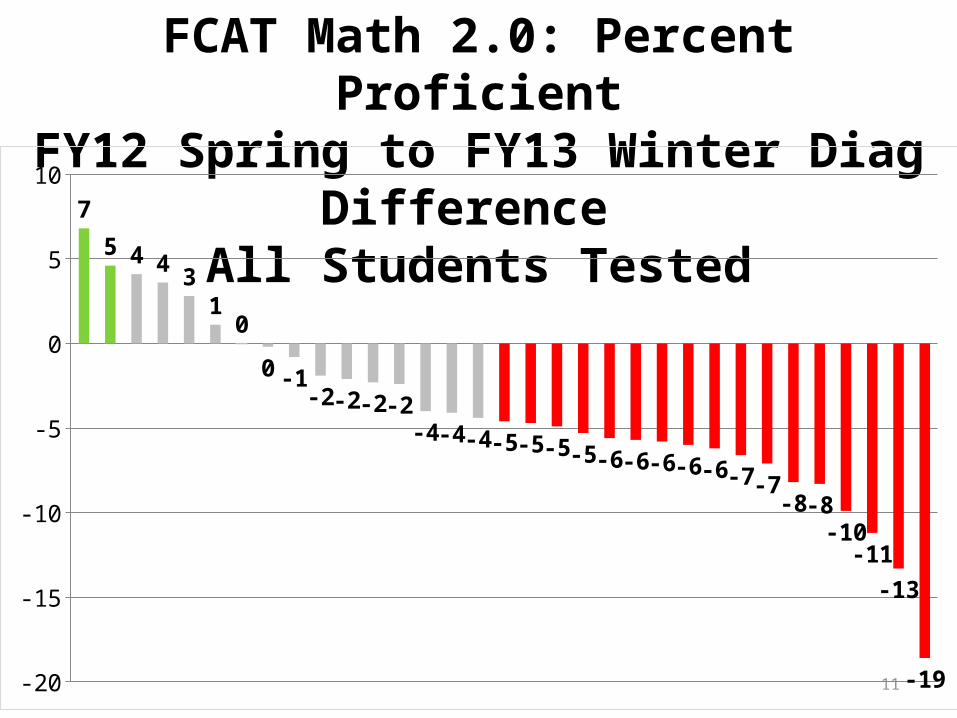
FCAT Math 2.0: Percent ProficientFY12 Spring to FY13 Winter Diag Difference
All Students Tested
-20
-15
-10
-5
0
5
10
7
5 4 4 31
00 -1
-2 -2 -2 -2-4 -4 -4 -5 -5 -5 -5 -6 -6 -6 -6 -6 -7 -7
-8 -8-10
-11-13
-19

12
Algebra 1 EOC: Percent ProficientFY12 Spring to FY13 Winter Diag Difference
All Students Tested
-35.0
-30.0
-25.0
-20.0
-15.0
-10.0
-5.0
0.0
5.0
10.0
15.010
1 0 0 00 0 -2 -3 -3 -3 -4 -5 -5 -5 -5 -5 -6 -7 -8
-9-10-10-11-14
-16-17-18
-22-23
-28

13
SDPBC Algebra 1 EOC Pass Rates
FY10/11 SPRING FCATMATH
FY2012 SPRING ALG 1 EOC(no retakers)
Taking PassingPct
Passing
TOTAL 11608 6745 58% L 1 959 53 6% L 2 1736 279 16% L 3 3754 2085 56% L 4 2362 2247 95% L 5 1438 1432 100% No Lvl 1359 649 48%
LEVEL 16%
LEVEL 216%
14
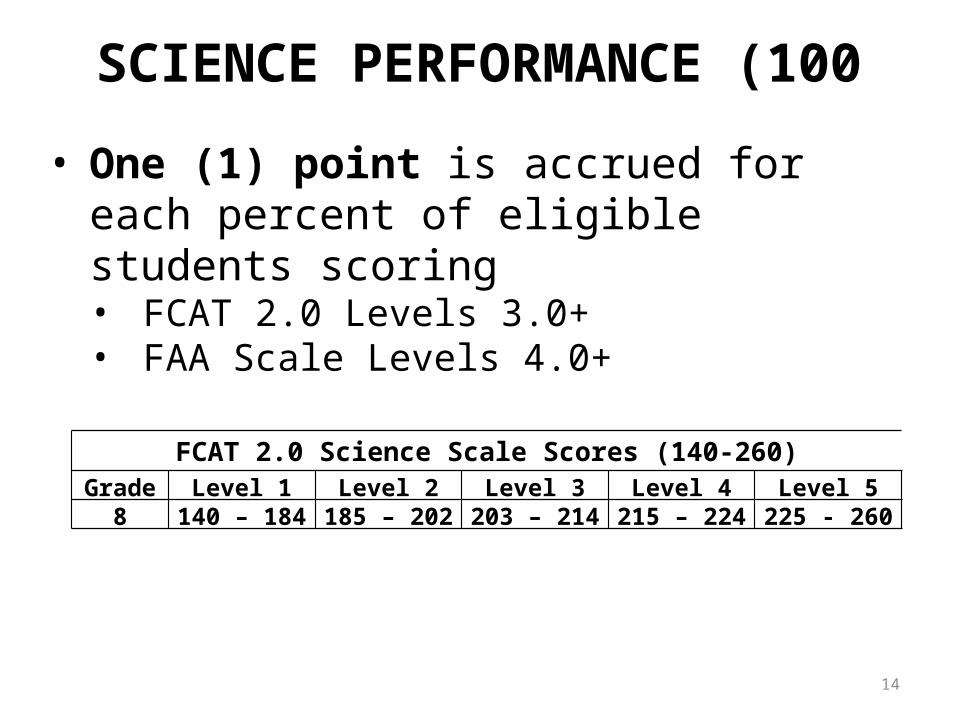
SCIENCE PERFORMANCE (100 pts)
• One (1) point is accrued for each percent of eligible students scoring• FCAT 2.0 Levels 3.0+• FAA Scale Levels 4.0+
FCAT 2.0 Science Achievement Levels FCAT 2.0 Science Scale Scores (140-260)
Grade Level 1 Level 2 Level 3 Level 4 Level 58 140 – 184 185 – 202 203 – 214 215 – 224 225 - 260

15
Grade 8 Science FCAT 2.0: Percent ProficientFY12 Spring to FY13 Winter Diag Difference
All Students Tested
-10.0
-5.0
0.0
5.0
10.0
15.0
20.0
14
109 8
6 64 4 4 4 4 3
2 2 2 1 1 1 0
-1 -1-3 -3 -3 -3 -3 -3 -4
-5-6 -7 -7 -8

16
WRITING PERFORMANCE (100 pts)
• One (1) point for each percent of eligible students scoring
• FCAT Writing Levels 3.5+• FAA Scale Levels 4.0+
• 60 minutes

17
FY12 Grade 8 FCAT 2.0 WritingPercent Scoring 3.5 and 3.0 Difference
-35
-30
-25
-20
-15
-10
-5
0
-8
-11
-14-14-15-16-17-17-18-19-19-20-21-22-23-23-23-24-24-25-25-26-27-27-27-27-28-29-30-30-30-30-31-32-33

18
READING LEARNING GAINS (100 pts)
• FCAT 2.0 (1 point)• Maintain same proficient level• L1 to L2, L1 to L3, or L2 to L3
• Remain L1 & increase Required scale points• Remain L2 & increase Required scale points
Retained students make learning gains by maintaining a proficiency level, increasing a level, or increasing a scale score
Minimum FCAT 2.0 Scale Increases Required to Demonstrate Learning Gains
Reading Grade 5-6Grade 6-6
Grade 6-7Grade 7-7
Grade 7-8Grade 8-8
Level 1 9 8 7
Level 2 8 7 6

19
READING LEARNING GAINS (100 pts)
• FCAT 2.0 Weighted (1.1 or 1.2 point)• (1.1) Prior year level 1 or 2 & gain Required
plus 33% or more scale points see example• (1.1) Move from lower level into L4• (1.2) Move from lower level into L5
Level 4
1.1
Level 5
1.2Retained students make
learning gains by
maintaining a proficiency
level, increasing a level, or
increasing a scale score

20
READING LEARNING GAINS (100 pts)
• Weighted Learning Gain for retained and non-retained students prior year in FCAT 2.0 L1 or L2
Learning Gain of 1.1 = Required growth + 33% or more
Example: Current sixth grader, prior year level 1 eighth graderRequired growth (9) points + 33% (3 points)
9 + 3 = 12 scale points
Minimum FCAT 2.0 Scale Increases Required to Demonstrate Learning Gains
Reading Grade 5-6Grade 6-6
Grade 6-7Grade 7-7
Grade 7-8Grade 8-8
Level 1 9 8 7
Level 2 8 7 6

21
READING LEARNING GAINS (100 pts)
• FAA (1 point)• Maintain proficient (Levels 4-9)• Improve from prior Level • Remain Levels 1-3 & gain 5 or more
scale points (Required)
• FAA Weighted (1.1 point)• Prior year levels 1-3 & gain Required
plus 33% or more (7+) scale points

22
MATH LEARNING GAINS (100 pts)
• FCAT 2.0/Algebra 1/Geometry EOC (1 point)• Use higher of FCAT 2.0 Math or EOC
• Maintain proficient (L3-L5)• Improve from L1 to L2, L1 to L3, or L2 to L3• Remain L1 & increase common scale score• Remain L2 & increase common scale score
FDOE will use a common scale for comparisons

23
MATH LEARNING GAINS (100 pts)
• FCAT 2.0 Weighted (1.1 or 1.2 point)• (1.1) Prior year level 1 or 2 & gain Required
plus 33% or more scale points see example• (1.1) Move from lower level into L4• (1.2) Move from lower level into L5
Level 4
1.1
Level 5
1.2
Retained students make
learning gains by
maintaining a proficiency
level, increasing a level, or
increasing a scale score

24
MATH LEARNING GAINS (100 pts)
• FAA (1 point)• Maintain proficient (Levels 4-9)• Improve from prior Level • Remain Levels 1-3 & gain 5 or more
scale points (Required)
• FAA Weighted (1.1 point)• Prior year levels 1-3 & gain Required
plus 33% or more (7+) scale points

25
MATH LEARNING GAINS (100 pts)
• Algebra 1 EOC with Prior FCAT 2.0 Math (1 point) • Maintain same proficient level• Improve from L1 to L2, L1 to L3, or L2 to L3• Remain L1 & increase common scale score• Remain L2 & increase common scale score
• Algebra 1 EOC Weighted (1.1 or 1.2 point)• (1.1) Move from lower level into L4• (1.2) Move from lower level into L5
• FDOE will use a common scale for comparisons• Compare Algebra 1 EOC with prior year FCAT 2.0 Math

26
LOWEST 25% READING LEARNING GAINS (100 pts)
Calculating Lowest 25% - Reading• Only students in prior year L1 or L2• Calculate for each student group• The sum of all groups plus other retained students
in prior year L1 and L2
*Students who skip a grade will show Learning Gains by moving up a level or maintaining L3+
Grade Grade Grade Grade
5 to 65 to 7*
6 to 66 to 76 to 8*
7 to 77 to 8
8 to 8
GroupTotal
+GroupTotal
+GroupTotal
+GroupTotal
=Groups
Total+
Other Retainedstudentsin prior-yearLevels 1 and 2
=
SchoolTotalL25%
Fewer than 30 students L2
or below, reading gains of
all students substituted
27
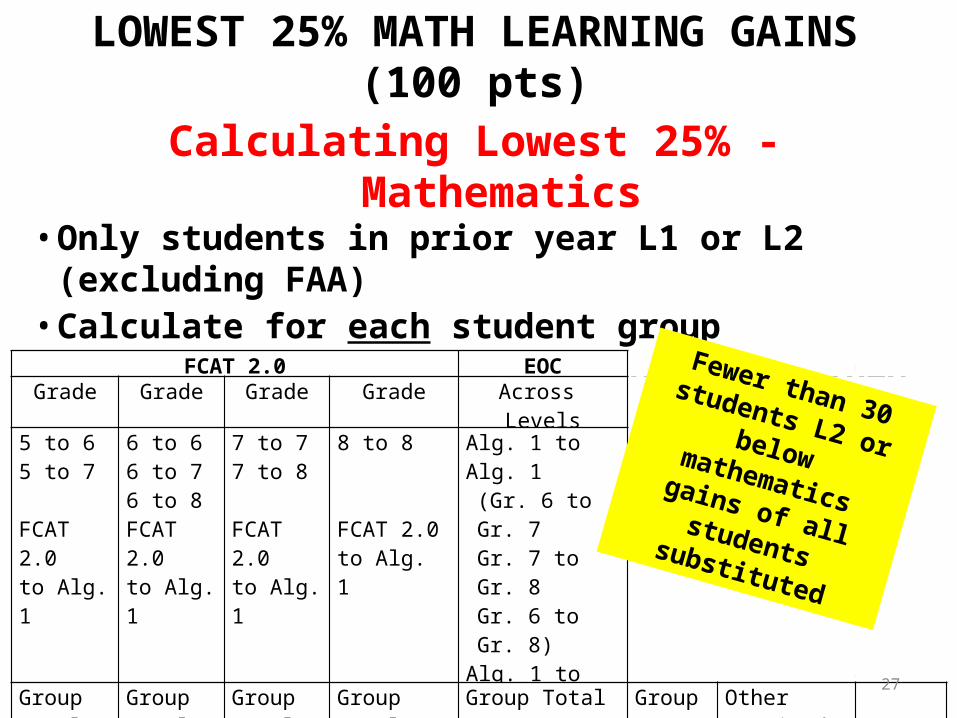
LOWEST 25% MATH LEARNING GAINS (100 pts)
Calculating Lowest 25% - Mathematics• Only students in prior year L1 or L2 (excluding FAA)• Calculate for each student group• The sum of all groups plus other retained students
in prior year L1 and L2
*Students who skip a grade will show Learning Gains by moving up a level or maintaining L3+
FCAT 2.0 EOC Grade Grade Grade Grade Across
Levels
5 to 65 to 7 FCAT 2.0 to Alg. 1
6 to 66 to 76 to 8FCAT 2.0 to Alg. 1
7 to 77 to 8 FCAT 2.0 to Alg. 1
8 to 8 FCAT 2.0 to Alg. 1
Alg. 1 to Alg. 1(Gr. 6 to Gr. 7Gr. 7 to Gr. 8Gr. 6 to Gr. 8)
Alg. 1 to Geo
Group Total +
Group Total +
Group Total +
Group Total +
Group Total = Groups Total +
Other Retained sts.in prior-year Lvls. 1 & 2 =
SchoolTotalL25%
Fewer than 30 students L2 or below
mathematics gains of all students substituted

28
LOWEST 25% LEARNING GAINS
Lowest 25% Adequate Progress• At least 50 percent of the Lowest 25% (50% in Reading
and 50% in Mathematics) make Learning Gains or show improvement from the prior year:
• Lowest 25% Adequate Progress Penalty
Lowest 25% Learning Gains
School Grade Related Action
50% + No Grade Reduction
40% - 49%Grade reduced unless improvement of 1% or more is made over the prior year.
39% and BelowGrade reduced unless improvement of 5% or more is made over the prior year

29
ACCELERATION PERFORMANCE & PARTICIPATION (100 pts)
• High School Level EOC Assessments and Industry Certifications
• Participation – 50 points• Performance – 50 points
Schools without grade 8 will NOT have this component included in their school grade calculation. (e.g., K-7 school)

30
ACCELERATION PERFORMANCE & PARTICIPATION (100 pts)
PARTICIPATION CALCULATION
The denominator is adjusted to remove any grade 8 student who previously took (or passed) the EOC in a prior year or who otherwise met their graduation requirement for Algebra 1 prior to the current year.
Numerator DenominatorWeighted count of students from denominator who took:• Algebra 1, Geometry• Industry Certification
Exam(s)
• Unduplicated/Unweighted count of students in grades 6, 7, 8, who took EOC Assessments or Industry Certification Exams and
• All other grade 8 students who scored Level 3 or higher on Grade 7 FCAT 2.0 Mathematics

31
ACCELERATION PERFORMANCE & PARTICIPATION (100 pts)
PARTICIPATION CALCULATION
The denominator is adjusted to remove any grade 8 student who previously took (or passed) the EOC in a prior year or who otherwise met their graduation requirement for Algebra 1 prior to the current year.
Numerator DenominatorWeighted count of students from denominator who took:• Algebra 1, Geometry• Industry Certification
Exam(s)
• Unduplicated/Unweighted count of students in grades 6, 7, 8, who took EOC Assessments or Industry Certification Exams and
• All other grade 8 students who scored Level 3 or higher on Grade 7 FCAT 2.0 Mathematics

32
ACCELERATION PERFORMANCE & PARTICIPATION (100 pts)
PERFORMANCE CALCULATION
Numerator Denominator
Weighted count of students from denominator who:• score at Level 3 or higher
on EOC Assessment(s), or• Passed Industry
Certification Exam(s)
Unduplicated/Unweighted count of students in Grades 6, 7, 8 who took and have valid• EOC Assessment scores• Industry Certification Exams

33
SUMMMARY OF CHANGES: PERFORMANCE, LOWEST 25% LEARNING GAINS
FY2013• Math – Geometry EOC
• New Achievement Levels• Science – FCAT 2.0
• New Achievement Levels• Writing – 3.5 Score, 60 Minutes
• Reading Performance Penalty• Lowest 25% Progress Penalty Reinstated

For Additional Support
ContactMark Howard, DirectorPX: 48781
Nancy Brito, SpecialistPX: 47521
http://www.palmbeachschools.org/assessment/SchoolGrade.asp

35
MONITORING FOR SUCCESS IN EDW
Dr. Sandra Raymond-Roberts, ManagerEducational Data Warehouse

Essentials Training 2013
Educational Data Warehouse

Purpose
• Identify accountability data in the Educational Data Warehouse
• Determine specific monitoring tools relative to school and student performance.

How did your school’s tested population
perform on the 2013 Winter Diagnostics– FCAT 2.0,
Algebra 1 EOC and Geometry EOC?

What assessments are used to measure student performance?
• Winter Diagnostics–Reading – Algebra 1 Florida EOC and
Geometry EOC

Who are the accountable students in the Performance categories?
• Students reported in Survey 2 (October FTE), Survey 3 (February FTE), and first day of FCAT Writing test
• Students attending public schools– ELL students with at least 365 calendar days in a
U.S. school

BIG PICTURE

MONITORING PROGRESS TOWARD A PLUS GOALS FOR MIDDLE SCHOOLS-RTOOA0530

Monitoring Progress Toward A Plus Goals for Middle Schools-RTOOA0530

Fall and Winter Diagnostic Results

Acceleration Participation and Performance

Diagnostic Diamond Report-RTODA0173EOC Diagnostic Diamond Report-RTSDA0474

Step 1: Sort By Benchmark
Question
Focus
Benchmarkss
Diff

Step 2: Sort By Gridded Response

Step 3: Sorted by BenchmarkT1
T2
Similar Patterns

Step 3: Sorted by BenchmarkT1
T2
Dissimilar Patterns

READING MATHEMATICS WRITING SCIENCE
PERFORMANCE
Accountability Reading Profile
Accountability Mathematics ProfileCurrent Algebra 1 Students
Accountability Writing ProfilePalm Beach Writes
Accountability Science Profile
LEARNING GAINS – ALL STUDENTS
Accountability Reading ProfileDiagnostic Reading Gains
Accountability Mathematics Profile
LEARNING GAINS – LOWEST 25%
Accountability Reading ProfileDiagnostic Reading Gains
Accountability Mathematics ProfileDiagnostic Math Gains
TOTAL POINTS – 800 Points Possible
300 points 300 points 100 points 100 points

PERFORMANCE

READING MATHEMATICS WRITING SCIENCE
PERFORMANCE
Accountability Reading Profile
Accountability Mathematics ProfileCurrent Algebra 1 Students
Accountability Writing ProfilePalm Beach Writes
Accountability Science Profile
LEARNING GAINS – ALL STUDENTS
Accountability Reading ProfileDiagnostic Reading Gains
Accountability Mathematics Profile
LEARNING GAINS – LOWEST 25%
Accountability Reading ProfileDiagnostic Reading Gains
Accountability Mathematics ProfileDiagnostic Math Gains
TOTAL POINTS – 800 Points Possible
300 points 300 points 100 points 100 points

Accountability Reading Profile-RTSFR0280

READING MATHEMATICS WRITING SCIENCE
PERFORMANCE
Accountability Reading Profile
Accountability Mathematics ProfileCurrent Algebra 1 Students
Accountability Writing ProfilePalm Beach Writes
Accountability Science Profile
LEARNING GAINS – ALL STUDENTS
Accountability Reading ProfileDiagnostic Reading Gains
Accountability Mathematics Profile
LEARNING GAINS – LOWEST 25%
Accountability Reading ProfileDiagnostic Reading Gains
Accountability Mathematics ProfileDiagnostic Math Gains
TOTAL POINTS – 800 Points Possible
300 points 300 points 100 points 100 points
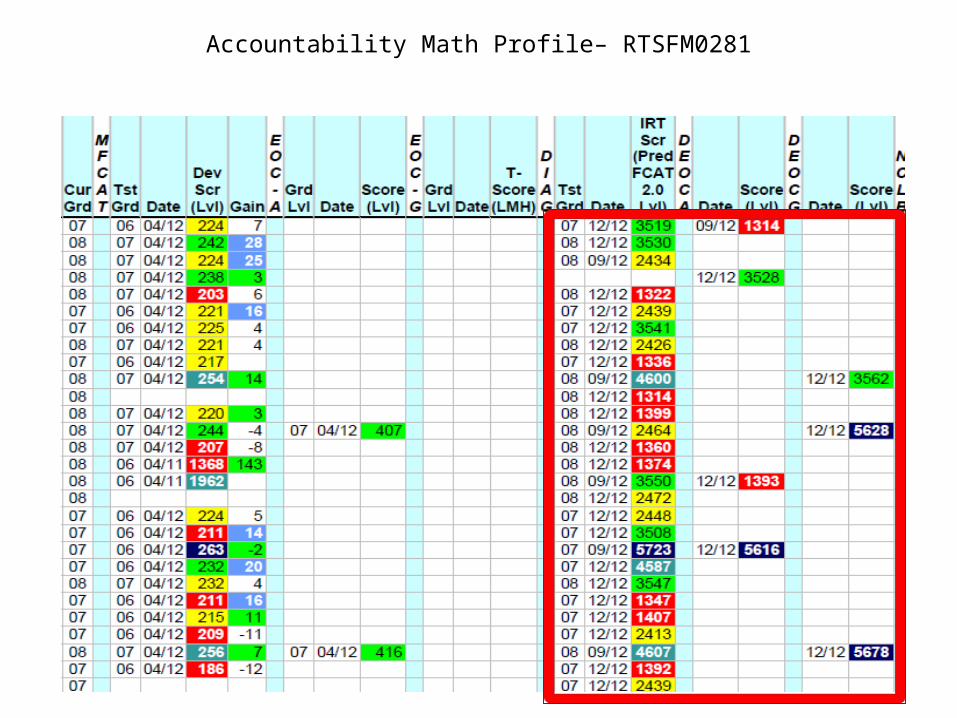
Accountability Math Profile– RTSFM0281

Current Algebra 1 Students-RGSYM0462

READING MATHEMATICS WRITING SCIENCE
PERFORMANCE
Accountability Reading Profile
Accountability Mathematics ProfileCurrent Algebra 1 Students
Accountability Writing ProfilePalm Beach Writes
Accountability Science Profile
LEARNING GAINS – ALL STUDENTS
Accountability Reading ProfileDiagnostic Reading Gains
Accountability Mathematics Profile
LEARNING GAINS – LOWEST 25%
Accountability Reading ProfileDiagnostic Reading Gains
Accountability Mathematics ProfileDiagnostic Math Gains
TOTAL POINTS – 800 Points Possible
300 points 300 points 100 points 100 points

Accountability Writing Profile—RTSFW0282
Window 5 Performance on the Palm Beach Writes

READING MATHEMATICS WRITING SCIENCE
PERFORMANCE
Accountability Reading Profile
Accountability Mathematics ProfileCurrent Algebra 1 Students
Accountability Writing ProfilePalm Beach Writes
Accountability Science Profile
LEARNING GAINS – ALL STUDENTS
Accountability Reading ProfileDiagnostic Reading Gains
Accountability Mathematics Profile
LEARNING GAINS – LOWEST 25%
Accountability Reading ProfileDiagnostic Reading Gains
Accountability Mathematics ProfileDiagnostic Math Gains
TOTAL POINTS – 800 Points Possible
300 points 300 points 100 points 100 points
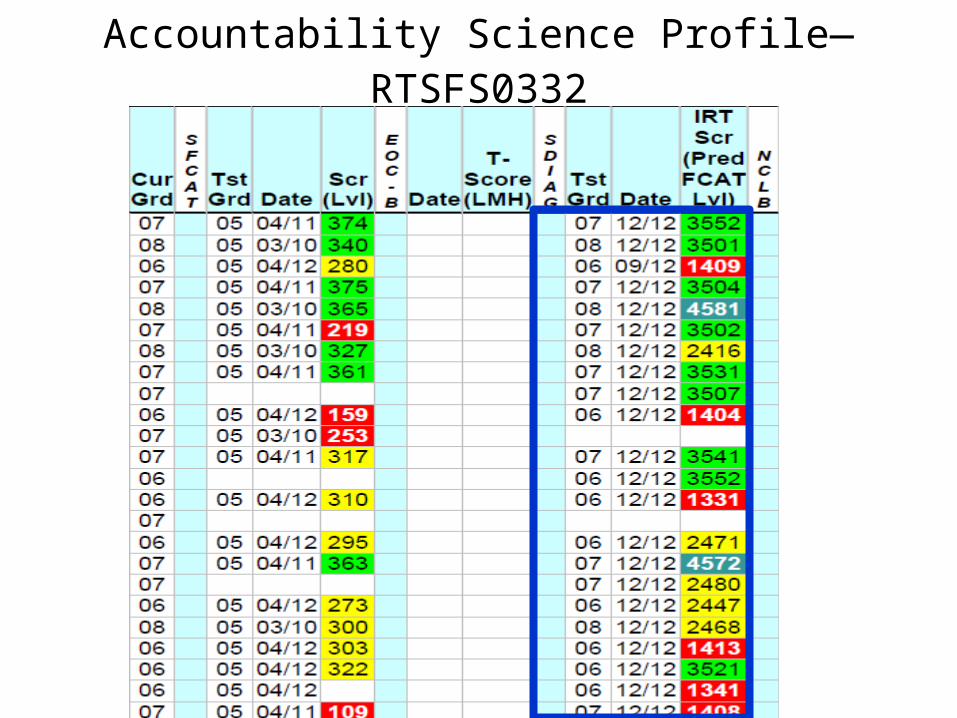
Accountability Science Profile—RTSFS0332

LEARNING GAINS

READING MATHEMATICS WRITING SCIENCE
PERFORMANCE
Accountability Reading Profile
Accountability Mathematics ProfileCurrent Algebra 1 Students
Accountability Writing ProfilePalm Beach Writes
Accountability Science Profile
LEARNING GAINS – ALL STUDENTS
Accountability Reading ProfileDiagnostic Reading Gains
Accountability Mathematics Profile
LEARNING GAINS – LOWEST 25%
Accountability Reading ProfileDiagnostic Reading Gains
Accountability Mathematics ProfileDiagnostic Math Gains
TOTAL POINTS – 800 Points Possible
300 points 300 points 100 points 100 points

Accountability Reading Profile—RTSFR0280

Diagnostic Reading Gains-RTSDR0095

READING MATHEMATICS WRITING SCIENCE
PERFORMANCE
Accountability Reading Profile
Accountability Mathematics ProfileCurrent Algebra 1 Students
Accountability Writing ProfilePalm Beach Writes
Accountability Science Profile
LEARNING GAINS – ALL STUDENTS
Accountability Reading ProfileDiagnostic Reading Gains
Accountability Mathematics Profile
LEARNING GAINS – LOWEST 25%
Accountability Reading ProfileDiagnostic Reading Gains
Accountability Mathematics ProfileDiagnostic Math Gains
TOTAL POINTS – 800 Points Possible
300 points 300 points 100 points 100 points

Accountability Math Profile—RTSFR0281

Diagnostic Math Gains-RTSDM0096

LOW 25% LEARNING GAINS

READING MATHEMATICS WRITING SCIENCE
PERFORMANCE
Accountability Reading Profile
Accountability Mathematics ProfileCurrent Algebra 1 Students
Accountability Writing ProfilePalm Beach Writes
Accountability Science Profile
LEARNING GAINS – ALL STUDENTS
Accountability Reading ProfileDiagnostic Reading Gains
Accountability Mathematics Profile
LEARNING GAINS – LOWEST 25%
Accountability Reading ProfileDiagnostic Reading Gains
Accountability Mathematics ProfileDiagnostic Math Gains
TOTAL POINTS – 800 Points Possible
300 points 300 points 100 points 100 points

Accountability Reading Profile—RTSFR0280Performance of the Low 25% in Reading Population

Accountability Math Profile—RTSFR0281
Performance of the Math Low 25% Population

73
Participant’s Discussion• How has your school performed over time (Gains,
Lowest 25%, Math, Reading, Science, Writing)? At each grade level?
• What are the significant changes between Fall and Winter Diagnostic Results?
• What are your school’s strengths?
• What weaknesses do you need to address prior to FCAT and EOC administrations?


75
STRATEGIES AND RESOURCES
Keith Oswald, Assistant SuperintendentCurriculum and Instruction

“THE ESSENTIALS” MIDDLE SCHOOL
INSTRUCTION BEFORE THE ASSESSMENTCAO
February 5, 2013

Essentials for Writing

78
Best Practices for Test Readiness
• Students write every day.
• Provide prescriptive feedback to students and monitor progress.
• Teach strategic minilessons based on class needs.
• Pull children together for small group instruction based on similar need.
• Confer with individual students.
• Utilize lesson plans in Learning Village as needed.
• Utilize the tutorial lessons and Saturday lessons as needed.

79
SpringBoard Writing Workshops
• Expand everyday writing opportunities already available within the regular SpringBoard curriculum.
• Integrate SpringBoard Writing Workshops into regular instruction.
– 10 Writing Workshops are available for each grade level.– Use as support, extension, or intensive practice.

80
FY12 FCAT 2.0 Writing Middle School
FY12 Palm Beach County
FY12 State
Mean Score
Uns. 1 1.5 2 2.5 3 3.5 4 4.5 5 5.5 6 % 3 & abov
e
% 3.5 & above
% 4 & above
3.3 1 2 1 8 10 26 19 23 6 3 1 0 78 52 33
Mean Score
Uns. 1 1.5 2 2.5 3 3.5 4 4.5 5 5.5 6 % 3 & abov
e
% 3.5 & above
% 4 & above
3.4 0 1 1 6 8 23 21 27 8 3 1 0 84 61 40
Note: In Palm Beach County, there was a 23 point difference between 3s a 3.5s last year.
The minimum goal for students needs to remain a 4 as at least one scorer needs to believe the essay is a 4 in order to earn a 3.5.

81
Qualities of Good WritingFocus
(Meaning & Structure)
• Staying on the thread of the topic that was chosen to write about.– Planning (various
methods)
Organization (Structure)
• The order of ideas presented in the essay.
• Using transitions that help the essay flow
• Ordering ideas
• Having a thesis statement
82
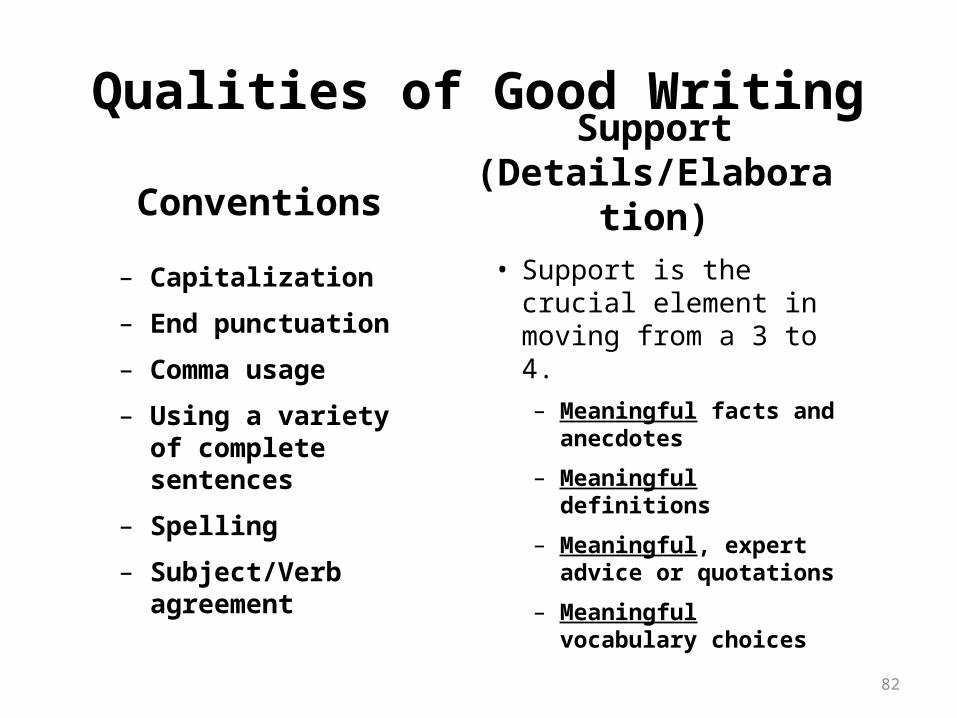
Qualities of Good Writing
Conventions
– Capitalization
– End punctuation
– Comma usage
– Using a variety of complete sentences
– Spelling
– Subject/Verb agreement
Support (Details/Elaboration)• Support is the crucial
element in moving from a 3 to 4.– Meaningful facts and
anecdotes
– Meaningful definitions
– Meaningful, expert advice or quotations
– Meaningful vocabulary choices

83
Using Data to Drive InstructionIf the writer is a Level 1,
I could teach…• Focusing closely on the
topic of the prompt.• Focusing closely on the
topic of daily writing.• Organizing by introducing
the topic, supplying one or more reasons, ways, or kinds of, and concluding the writing.
• Adding facts or examples to elaborate.
• Writing sentences with a “who” & a “did what.”
If the writer is a Level 2, I could teach…
• Focusing closely on the topic of the prompt.
• Organizing by introducing the topic, supplying one or more reasons, ways, or kinds of, and concluding the writing.
• Adding support to elaborate.• Writing sentences with a
“who” & a “did what.”• Using end punctuation.

84
Using Data to Drive InstructionIf the writer is a Level 3,
I could teach…• Taking away any extraneous parts.• Organizing with 3 reasons, ways or
kinds of.• Making a clearer beginning & ending.• Adding support to elaborate.
◦ Examples with elaboration◦ Anecdotes carefully crafted to
show how it fits with the idea• Writing sentences with simple and
compound construction.• Spelling word wall words correctly.• Using end punctuation correctly.• Choosing stronger verbs/specific
nouns.
If the writer is a Level 4, I could teach…
• Crafting a strong introduction that previews the ideas to be addressed.
• Crafting a concluding paragraph that includes the writer’s thoughts or feelings about the topic.
• Eliminating extraneous parts.• Organizing ideas by importance.• Using effective transitions between
and within paragraphs.• Including anecdotes that are
angled to match the thesis, and provide sufficient elaboration to create a strong connection.
• All of the conventions from level 3.
85
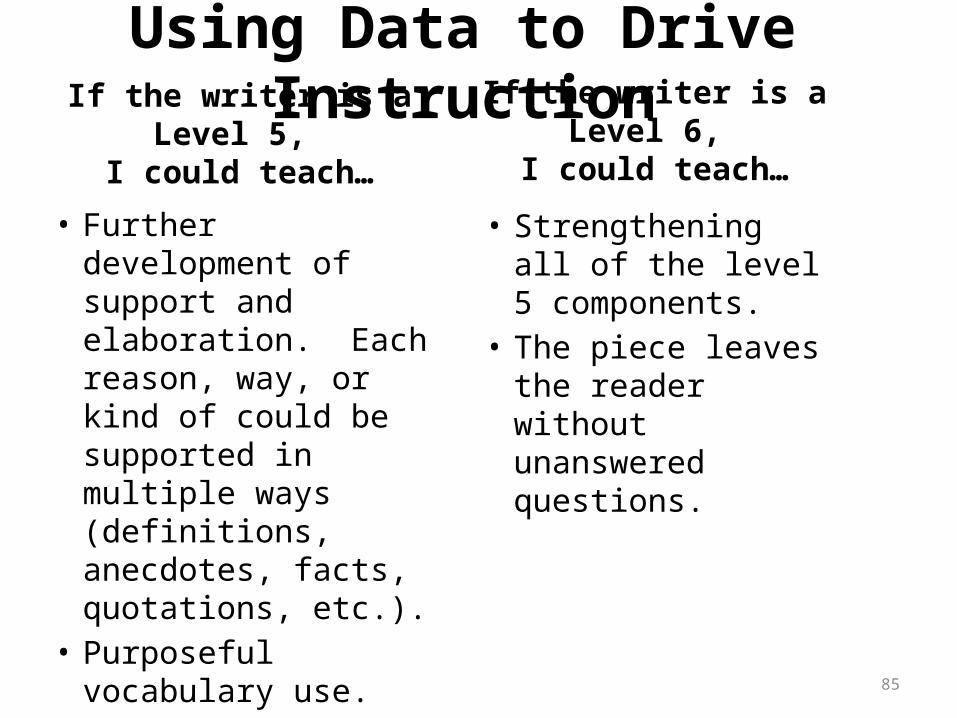
Using Data to Drive InstructionIf the writer is a Level 5,
I could teach…
• Further development of support and elaboration. Each reason, way, or kind of could be supported in multiple ways (definitions, anecdotes, facts, quotations, etc.).
• Purposeful vocabulary use.• Various sentence
structures.• More purposeful use of
punctuation.
If the writer is a Level 6, I could teach…
• Strengthening all of the level 5 components.
• The piece leaves the reader without unanswered questions.

Essentials for Reading

87
Middle School Resources for ELALesson plans that focus on tested benchmarks, contain on grade level text, and text-dependent questions are located on each grade level ELA calendar in Learning Village.
Additional lesson plans that focus on tested benchmarks are available for pull-outs or tutorials.
It is important to continue instruction. Two of the most difficult benchmarks (as determined by percentage correct on the winter diagnostic) are 6.1.1 and 6.2.2. The scope and lesson plans on Learning Village instruct on these benchmarks in January and February.

88
These lessons are not located on the calendar, so they are fresh lessons for students.
There is also access to the Florida Achieves site for additional testing practice and links to released practice tests.

89
Middle School Resources for Reading
Lesson plans that focus on tested benchmarks, contain a variety of text levels, and text-dependent questions are located on each grade level reading calendar in Learning Village.

90
SpringBoard Resources Available on TrainU
SpringBoard ELA and Math Resources available:
Pacing Guides,Benchmark
Correlations, Graphic Organizers, Sample Bellringers and Mini-Lessons,
CCSS and PARCC Connections,
Marzano Crosswalk
Reading and Writing Supports:Links to 10 SB Writing
Workshops per grade level, Sample FCAT stem questions
based on SB reading

91
Reader and TaskTen Guiding Principles
1. Make close reading and rereading of texts central to lessons.
2. Provide scaffolding that does not preempt or replace text.
3. Ask text dependent questions from a range of question types.
4. Emphasize students’ supporting answers based upon evidence from the text.
5. Provide extensive research and writing opportunities (claims and evidence).

92
Reader and TaskTen Guiding Principles
6. Offer regular opportunities for students to share ideas, evidence, and research.
7. Offer systematic instruction in vocabulary.
8. Ensure wide reading from complex text that varies in length.
9. Provide explicit instruction in applied grammar and conventions.
10. Cultivate students’ independence.
The most important concept to remember: it is not about the program; it is about the teacher.

93
Administrative Considerations
• Capitalize on teachers’ strengths.• Utilize data to monitor progress.
– Classroom Assessments– Core K12– Diagnostics
• Focus on the curriculum and the resources available in Learning Village.
• Maintain a balance between instruction and test preparation.

94
English Language Learners
All English Language Learners must have a word to word heritage dictionary from the beginning of the year to use in class and on assessments.
Testing Accommodations
Classroom Accommodations

Essentials for Mathematics

96
FCAT 2.0 Resources for Grades 6 – 8 Algebra 1 Students
• Algebra 1 instruction that encompasses the grade-level benchmarks will support FCAT 2.0 preparation.
• Select grade-level FCAT 2.0 benchmarks not addressed in Algebra 1 need additional instructional support.
• Alignment charts and instructional resources are provided on Learning Village.

97
Algebra 1 Honors LV Landing Page

98
Algebra 1 Honors LV Landing Page

99
Algebra 1 Honors LV Landing Page

100
FCAT 2.0 Resources for Algebra 1 Students
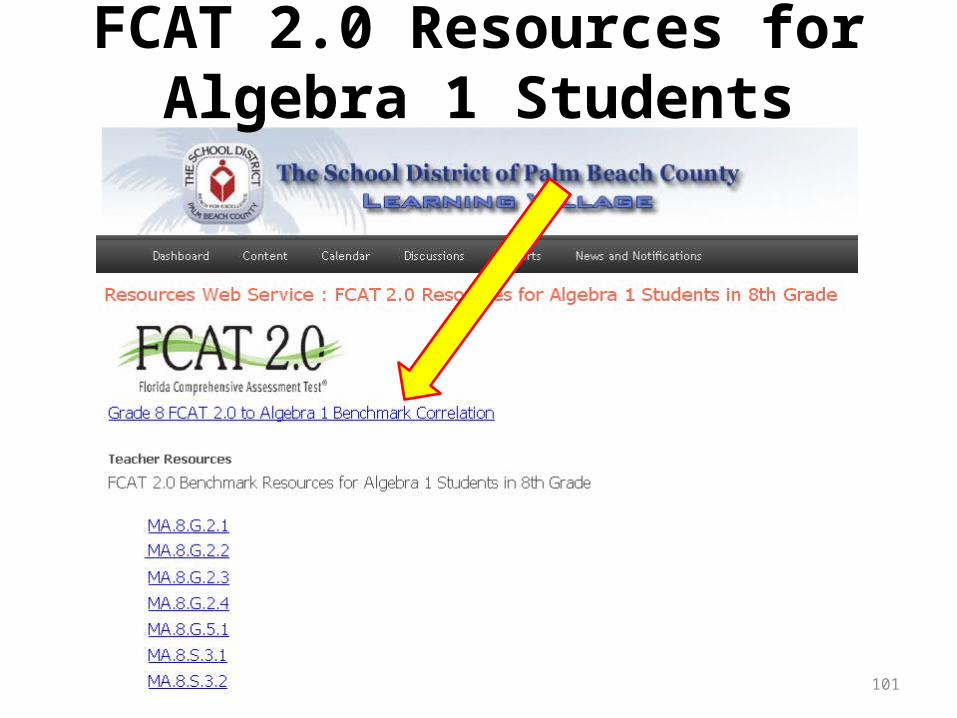
101
FCAT 2.0 Resources for Algebra 1 Students

102
Grade 8 FCAT 2.0 to Algebra 1 EOC Benchmark Correlation

103
Grade 8 FCAT 2.0 Benchmarks Not Addressed in Algebra 1
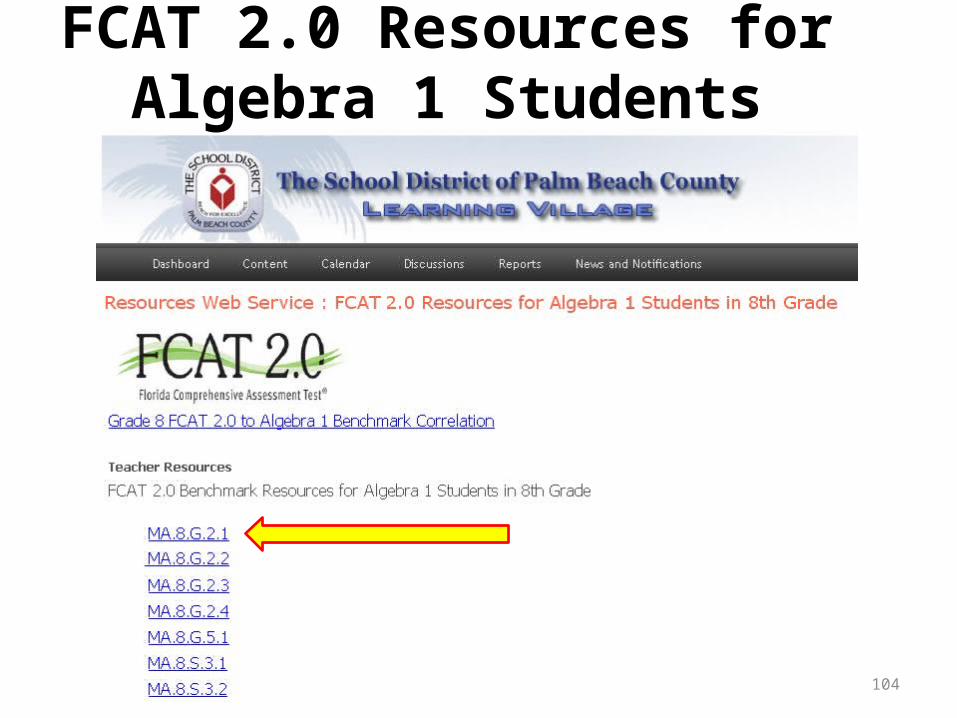
104
FCAT 2.0 Resources for Algebra 1 Students

105
Grade Level Benchmark-Specific Resources for Students in Algebra 1

106www.AlgebraNation.com

107

108

109

110

111
Algebra Nation• EOC aligned• Content created in collaboration with FLDOE• Additional EOC prep resources forthcoming• Student access outside of school
– Platform for additional support– Access to resources– Opportunity to receive personal support

112
What Works in Algebra 1• Algebra Nation• Differentiate lessons to meet needs of all students.• Provide lowest 25% in Algebra 1 with additional support
opportunities. • Attend content trainings by K-12 Curriculum.• Ensure teachers’ knowledge of the revised Item
Specifications.• Teach foundational skills during the first month.

113
What Works in Algebra 1• Utilize progress monitoring logs/benchmark
seminars/data chats.• Having no more than two preps for Algebra I teachers.• Use
– Wylie’s Warm-ups (Everglades book)– EOC-like problems for every benchmark– Core K12 assessments for tracking and remediation– Florida Achieves– Spiral review of benchmarks

Science ResourcesSound Instruction for FCAT 2.0 Science
Essentials for Science

Plan for Success
Review tested benchmarks taught in 6th and 7th grades.

Plan for SuccessFCAT-Style Questions
Provide students with exposure to FCAT-style questions (a few per day).
• FCAT Explorer
• FOCUS Mini-Assessments

FCAT Explorer and Context-Dependent Sets
Plan for SuccessFCAT-Style Questions

Plan for SuccessFCAT-Style Questions
Provide students with exposure to FCAT-style questions (a few per day).
FCAT 2.0 Science(Grade 8)
Sample Test

Plan for SuccessFCAT-Style Questions
Provide students with exposure to FCAT-style questions and review previously taught concepts.
BellringersGrade 8

Plan for SuccessSimulations and Virtual Labs
Utilize simulations and virtual labs to reinforce science concepts.

Plan for SuccessSimulations and Virtual Labs
Utilize simulations and virtual labs to reinforce science concepts.

122
Learning Village ResourcesSecondary Science – Middle Grades
Content Training Materials

123
Learning Village ResourcesSecondary Science – Grade 8
NEW!

124
Learning Village ResourcesGrade 8 Resource Chart

125
What Works for Grade 8 Science
• Differentiate lessons to meet the needs of all students.• Utilize resources from content trainings conducted by
K-12 Curriculum.• Incorporate hands-on learning experiences, virtual
labs, and simulations into lessons.• Review 6th and 7th grade tested benchmarks as needed.• Use
– Bellringers– Sample Test – FOCUS Mini-Assessments/FCAT Explorer (FCAT-style questions)
– Science Resource Chart– Pearson SuccessNet Resources

Academic Success Begins With You
A study conducted by Hoy, Sweetland and Smith (2002) found that efficacy “was more important in
explaining student achievement than socio-economic status.”
If you can answer “yes” to the following questions, you are building teacher
efficacy.

127
1. Do you believe that your teachers are capable of successfully teaching Level 1 and Level 2 students?
2. Do you identify and celebrate the individual accomplishments and successes of each teacher?
3. Do you provide appropriate feedback to address weaknesses in a non-threatening way?
4. Are you sure that your feedback to teachers has impacted instructional practices at your school?
Academic Success Begins With You

128
• According to Goddard, Hoy and Hoy, principals must intentionally help teachers develop a sense of efficacy.
• Model the efficacious behaviors that you want to see teachers utilizing in the classroom with their students.
Academic Success Begins With You
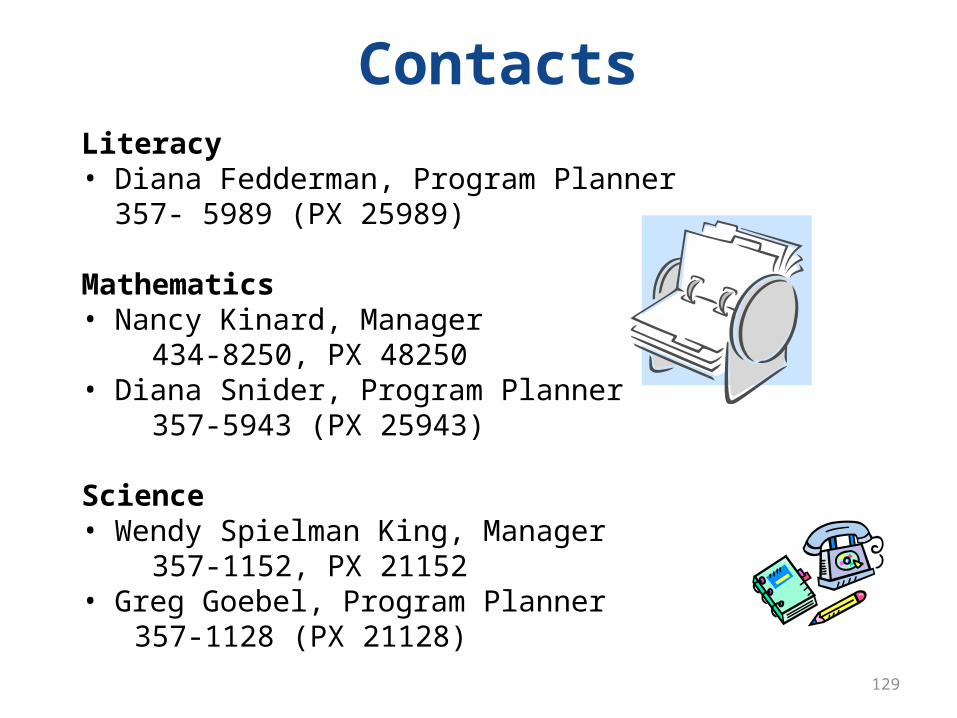
129
ContactsLiteracy• Diana Fedderman, Program Planner 357- 5989 (PX 25989)
Mathematics• Nancy Kinard, Manager 434-8250, PX 48250• Diana Snider, Program Planner 357-5943 (PX 25943)
Science• Wendy Spielman King, Manager 357-1152, PX 21152• Greg Goebel, Program Planner 357-1128 (PX 21128)

130
ACTIVITY
Dr. Janis AndrewsChief Academic Officer

131

132
Activity
• Review school data• Identify opportunities for improvement• Review strategies and resources• Pair and share

133
EOC & CBT ASSESSMENT ISSUES
Dr. Frank Rodriguez, Assistant SuperintendentQuality Assurance