Tapered Rolled Bearings and Parts Thereof, and Certain Housings Incorporating Tapered Rollers

Rochester Institute of Technology Rochester Institute of Technology
RIT Scholar Works RIT Scholar Works
Theses
7-2021
High Heat Flux Dissipation Using Innovative Dual Tapered High Heat Flux Dissipation Using Innovative Dual Tapered
Manifold in Pool Boiling, and Thermosiphon Loop for CPU Cooling Manifold in Pool Boiling, and Thermosiphon Loop for CPU Cooling
in Data Centers in Data Centers
Aranya Chauhan [email protected]
Follow this and additional works at: https://scholarworks.rit.edu/theses
Recommended Citation Recommended Citation Chauhan, Aranya, "High Heat Flux Dissipation Using Innovative Dual Tapered Manifold in Pool Boiling, and Thermosiphon Loop for CPU Cooling in Data Centers" (2021). Thesis. Rochester Institute of Technology. Accessed from
This Dissertation is brought to you for free and open access by RIT Scholar Works. It has been accepted for inclusion in Theses by an authorized administrator of RIT Scholar Works. For more information, please contact [email protected].

1
R.I.T
High Heat Flux Dissipation Using Innovative Dual
Tapered Manifold in Pool Boiling, and Thermosiphon
Loop for CPU Cooling in Data Centers
by
Aranya Chauhan
A dissertation submitted in partial fulfilment of the requirements for the
degree of Doctor of Philosophy in Engineering
Engineering PhD Program
Kate Gleason College of Engineering
Rochester Institute of Technology
Rochester, New York
July, 2021
2
High Heat Flux Dissipation Using Innovative Dual Tapered Manifold in Pool
Boiling, and Thermosiphon Loop for CPU Cooling in Data Center
by
Aranya Chauhan
Committee Approval:
We, the undersigned committee members, certify that we have advised and/or supervised
the candidate on the work described in this dissertation. We further certify that we have
reviewed the dissertation manuscript and approve it in partial fulfillment of the
requirements of the degree of Doctor of Philosophy in Engineering.
Dr. Satish G. Kandlikar (Advisor)
Date
James E.Gleason Professor, Mechanical Engineering
Dr. Kathleen Lamkin-Kennard
Date
Associate Professor, Mechanical Engineering
Dr. Michael Schertzer
Date
Associate Professor, Mechanical Engineering
Dr. Santosh Kurinec
Date
Professor, Electrical and Microelectronic Engineering
Certified by:
Dr. Edward Hensel
Date
Director, PhD in Engineering Program
3
Abstract Kate Gleason College of Engineering
Rochester Institute of Technology
Degree: Doctor of Philosophy Program: Engineering PhD
Author: Aranya Chauhan Advisor: Satish G. Kandlikar
Dissertation Title: High Heat Flux Dissipation Using Innovative Dual Tapered Manifold
in Pool Boiling, and Thermosiphon Loop for CPU Cooling in Data Center
The current trend of electronics miniaturization presents thermal challenges which limit
the performance of processors. The high heat fluxes in CPUs are affecting the reliability
and processing ability of the servers. Due to these thermal limitations, large amount of
energy is required to cool the servers in data centers. The advanced two-phase boiling heat
transfer systems are significantly more efficient than currently used single phase coolers.
In the current work, a novel approach is adopted by using a dual tapered microgap over the
heated boiling surface for enhanced heat transfer. The theoretical work has identified the
role of two-phase pressure recovery effect induced by the expanding bubbles in the tapered
microgap configuration that leads to a self-sustained flow over the heater surface. This
effectively transforms the pool boiling into a pumpless flow boiling system. Additionally,
the tapered microgap introduces a bubble squeezing effect that pushes the liquid along the
expanding taper direction. High fluid velocities are generated through this mechanism thus
creating the pumpless flow boiling process in a conventional pool boiling system. Using
water as the working fluid, a critical heat flux (CHF) of 288 W/cm2 was achieved at a wall
superheat of 24.1°C. The baseline configuration without any tapered manifold resulted in
a CHF of 124 W/cm2 at a wall superheat of 23.8°C. This represents the largest enhancement
ever reported for water on a plain surface without incorporating any surface modifications
during pool boiling. For dielectric liquid as the working fluid, the dual tapered micogap
obtained ~2X enhancement in the heat transfer coefficient (HTC) compared to the
configuration with the baseline configuration. This dual tapered microgap design is also
implemented in a thermosiphon loop for CPU cooling where no pumping power is required
for fluid circulation in a closed loop. The loop contains an evaporator with a dual tapered
microgap and was able to dissipate heat from an actual CPU (i7-930 processor, TDP 130
4
W) more efficiently as compared to air, or water-based coolers during thermal stress tests.
This dual taper evaporator configuration will be able to mitigate the hotspots generated on
the CPU surface and improve the efficiency and mechanical integrity of the processor.
Such boiling heat transfer systems can significantly reduce the cooling water temperature
requirement thereby reducing the operational cost of data centers.

5
Acknowledgement
I would like to sincerely express my gratitude to my advisor Dr. Satish G Kandlikar for his
continuous guidance and support throughout this work. I would like to thank him for giving
me this opportunity to develop the understanding of the subject and express my ideas at
various platforms. His enthusiasm and sincerity inspired me at every step and helped me
in achieving my goals.
I would like to thank my committee members – Dr. Kathleen Lamkin-Kennard, Dr.
Michael Schertzer, and Dr. Santosh Kurinec for providing helpful suggestions during the
course of study. I am grateful to all TAMFL lab members – Dr. Arvind Jaikumar, Dr.
Alyssa Owens, Dr. Pruthvik Raghupathi, Dr. Travis Emery, Dr. Isaac Perez-Raya, Dr. Jose-
Luis Gonzalez-Hernandez, Aniket Rishi, Akshat Negi, and Maharshi Shukla for their
continuous support and assistance without which this work would not have been possible.
I would sincerely like to thank Craig Arnold for the fabrication of parts for test assembly,
and Emilio Del Plato and William Finch for their help in setting up the server for testing.
I would like to thank my parents for their blessings and always believing in me. I am
grateful to them for providing the constant support at every stage of my life, there are no
words to express the sacrifices they have made.
6
Dedication
To
Sadhana Singh and Pradeep Singh
7
Table of Contents Abstract .............................................................................................................................. 3
Acknowledgement ............................................................................................................. 5
List of Figures .................................................................................................................. 11
List of Tables ................................................................................................................... 16
Nomenclature .................................................................................................................. 17
1.0 Introduction ............................................................................................................... 20
1.1 Electronics Thermal Management .......................................................................... 20
1.2 Data Center Cooling Techniques ............................................................................ 22
1.1.1 Air Cooling ....................................................................................................... 22
1.1.2 Water Cooling................................................................................................... 24
1.3 Two Phase Heat Transfer ........................................................................................ 26
1.3.1 Pool Boiling ...................................................................................................... 26
1.3.2 Flow Boiling ..................................................................................................... 29
1.3.3 Thermosiphon Loop ......................................................................................... 31
2.0 Literature Review ..................................................................................................... 33
2.1 Pool Boiling............................................................................................................. 33
2.1.1 Surface Enhancements ...................................................................................... 33
2.2.2 Separate Liquid-Vapor Pathways ..................................................................... 35
2.2 Flow Boiling ............................................................................................................ 37
2.3 Thermosiphon Loop ................................................................................................ 45
3.0 Research Approach ................................................................................................... 48
3.1 Research Need ......................................................................................................... 48
3.2 Methodology ........................................................................................................... 49
3.3 Research Layout ...................................................................................................... 51
4.0 Theoretical Model for Pressure Drop and HTC Prediction in Pool Boiling ....... 54
4.1 Homogeneous Flow Model for Pressure Drop ........................................................ 56
4.2 Heat Transfer Correlation ........................................................................................ 58
4.3 Results of Pressure Drop Analysis for Water .......................................................... 59
4.4 Results of Pressure Drop Analysis for HFE7000 .................................................... 63
4.5 Major Outcomes of the Theoretical Analysis ......................................................... 70
5.0 Pool Boiling Performance of Dual Tapered Manifold with Water ...................... 72
8
5.1 Experimental Setup ................................................................................................. 72
5.2 Experimental Procedure .......................................................................................... 74
5.3 Data Reduction ................................................................................................... 75
5.4 Experimental Results for Enhancement on Plain Surface ....................................... 77
5.4.1 Effect of Taper Angle on Critical Heat Flux (CHF) ......................................... 77
5.4.2 Effect of Taper Angle on Heat Transfer Coefficient (HTC) ............................ 78
5.4.3 Two-Phase Flow Mechanism Created by Dual Tapered Manifold Block ........ 79
5.5 Theoretical HTC Results and Experimental Validation .......................................... 81
5.6 Major Outcomes from Experimental Study and Theoretical Analysis ................... 82
6.0 Pool Boiling Performance of Dual Tapered Manifold with HFE7000 ................. 84
6.1 Experimental Setup ................................................................................................. 84
6.2 Experimental Procedure .......................................................................................... 86
6.3 Data Reduction ........................................................................................................ 87
6.4 Experimental Results for Enhancement on Plain Surface ....................................... 89
6.4.1 Effect of Taper Angle on Heat Transfer Parameters ........................................ 89
6.4.2 Effect of Inlet Gap on Heat Transfer Parameters ............................................. 93
6.4.3 Discussion on Observed Heat Transfer Performance ....................................... 94
6.5 Theoretical HTC Results and Experimental Validation .......................................... 95
6.6 Major Outcomes from Experimental Study and Theoretical Analysis ................... 97
7.0 Thermosiphon Loop with Dual Tapered Manifold for CPU Cooling .................. 99
7.1 Methodology ......................................................................................................... 100
7.2 Benchtop Thermosiphon Loop on a Mock CPU Heater ....................................... 101
7.2.1 Experimental Setup of the Standalone Loop .................................................. 101
7.2.2 Experimental Procedure ............................................................................ 104
7.2.3 Data Reduction.......................................................................................... 105
7.2.4 Heat Transfer Results ..................................................................................... 106
7.2.5 Thermal Simulation of Mock CPU in ANSYS Static Thermal ...................... 109
7.3 Thermosiphon Loop on an actual CPU under Thermal Stressful Conditions ....... 113
7.3.1 Experimental Setup......................................................................................... 113
7.3.2 Experimental Procedure ................................................................................. 115
7.3.3 Data Reduction ............................................................................................... 116
7.3.2 Heat Transfer Results - Comparison Study of Water Cooler, Air Cooler, and
Thermosiphon Loop ................................................................................................ 118

9
7.4 Comparison of Thermosiphon Loop, Air Cooler, and Water Cooler under High
Heat Flux Conditions .................................................................................................. 121
7.4.1 Experimental Setup......................................................................................... 121
7.4.2 Heat Transfer Results ..................................................................................... 122
7.5 Major Outcomes from the Experimental Thermosiphon Loop Study ................... 123
7.6 Design Guidelines ................................................................................................. 125
8.0 High Speed Visualization and Theoretical Analysis of Bubble Squeezing
Mechanism ..................................................................................................................... 128
8.1 Experimental Setup ............................................................................................... 128
8.2 Experimental Procedure ........................................................................................ 130
8.3 Stable Bubble Expansion in Tapered Microgap .................................................... 130
8.3.1 10° taper angle with 0.8 mm inlet gap: ........................................................... 131
8.3.2 10° taper angle with 1.2 mm inlet gap: ........................................................... 132
8.4 Unstable Bubble Expansion in Tapered Microgap ............................................... 133
8.4.1 10° taper angle with 0.35 mm inlet gap: ......................................................... 134
8.4.2 2° taper angle with 1 mm inlet gap: ................................................................ 135
8.5 Advancing and Receding Interface Motion .......................................................... 136
8.6 Force Balance during Bubble Squeezing .............................................................. 139
8.7 Major Outcomes from the High-Speed Imaging Study ........................................ 141
9.0 Conclusion ............................................................................................................... 142
9.1 Major Contributions .............................................................................................. 142
9.2 Theoretical Model for Pressure Drop and HTC Prediction in Pool Boiling ......... 142
9.3 Pool Boiling Performance of Dual Tapered Manifold on Plain Surface ............... 144
9.4 Thermosiphon Loop with Dual Tapered Manifold for CPU Cooling ................... 144
9.5 High Speed Visualization and Theoretical Analysis of Bubble Squeezing
Mechanism .................................................................................................................. 146
10.0 References .............................................................................................................. 147
Appendix ........................................................................................................................ 154
Air, and Water Based Coolers ..................................................................................... 154
MATLAB code for calculating net pressure drop in tapered microgap ...................... 156
Uncertainty Calculation ............................................................................................... 158
Derivation of Heat Flux Uncertainty ....................................................................... 159
Derivation of Chip Surface Temperature (Ts) Uncertainty ..................................... 160
10
Derivation of Heat Transfer Coefficient (HTC) Uncertainty .................................. 162
11
List of Figures
Figure 1: The trend of miniaturization in electronics [1] .................................................. 20
Figure 2: Distribution of total power consumption in a data center according to Cool IT
Systems ............................................................................................................................. 22
Figure 3: The air cooling mechanism in a raised floor layout for data center cooling. .... 23
Figure 4: The schematic of water-cooling loop in a dielectric direct immersion cooling
setup. ................................................................................................................................. 25
Figure 5: Pool boiling curve showing different boiling regimes. ..................................... 27
Figure 6 : Schematic showing different regimes during flow boiling in a closed channel.
........................................................................................................................................... 29
Figure 7: The schematic of thermosiphon loop with evaporator and condenser. ............. 32
Figure 8: (a) Surface topography showing various roughness[10]; (i) 0.027 µm, (ii) 1.08
µm, (iii) 2.22 µm, and (iv) 5.89 µm, (b) Varying HTC with respect to heat flux for
different roughness surfaces with FC-77[15] ................................................................... 34
Figure 9: Various surface enhancements; tall porous structures [20,21], bi conductive
configuration [19], nano micro ridges [14,22,23], and wicking microstructures [17,18] . 35
Figure 10: Schematic of the countered fin and the trajectory of a bubble nucleating the
base of the fin [26] ............................................................................................................ 36
Figure 11: Schematics of separate liquid vapor pathways in (a) selectively sintered
microchannels [27], and (b) NRFC configuration [28-31] ............................................... 37
Figure 12: Different microchannels configuration - open and closed type ...................... 38
Figure 13: Flow boiling study conducted by Balasubramanian, (a) expanding
microchannels configuration, (b) pressure drop comparison for expanding and straight
microchannels [36]. ........................................................................................................... 39
Figure 14: Expanding microchannels, (a) stepped wall microchannels [37], (b) smooth
wall microchannels [38] .................................................................................................... 40
Figure 15: Different microchannels, (a) uniform, (b) diverging, (c) segmented studied by
Prajapati et al. [40] ............................................................................................................ 41
Figure 16: Tapered manifold on microchannels chip studied by Kalani and Kandlikar
[34,41] ............................................................................................................................... 41
Figure 17: The bubble departure in tapered manifold and nucleation under a fully grown
departed bubble [45] ......................................................................................................... 43
Figure 18: HTC variation with heat flux for different flow rates [44] .............................. 44
12
Figure 19: (a) Parallel cooling of Intel Xeon E560 processors, (b) Variation in mean chip
temperatures for unbalanced heat load conditions [49] .................................................... 45
Figure 20: The integrated thermosiphon loop unit studied by Noie et al. [51] ................. 46
Figure 21: Schematic of the thermosiphon loop used for microprocessor cooling using
metallic porous coatings at the interface [55] ................................................................... 47
Figure 22: Schematic of dual tapered manifold block on a heated boiling surface. ......... 49
Figure 23: Schematic showing the bubble expansion and departure mechanism in a
tapered microgap section. ................................................................................................. 50
Figure 24: The flow chart representation of the approach adopted for theoretical model. 55
Figure 25: The pressure drop curves at various heat fluxes for 15° taper angle (α) and
1.27 mm inlet gap height (hi). The colored numbers represent the heat flux in W/cm2. .. 61
Figure 26: The pressure drop curves at various heat fluxes for 10° taper angle (α) and
1.27 mm inlet gap height (hi). The colored numbers represent the heat flux in W/cm2. .. 62
Figure 27: The estimated mass flux values at different heat fluxes for 15° taper angle with
1.27 mm inlet gap height. ................................................................................................. 63
Figure 28: The pressure drop curves at various heat fluxes for 5°, and 10° taper angles
with 0.8 mm inlet gap height. The colored numbers represent the heat flux in W/cm2. No
stable operating points were obtained for these cases. ..................................................... 64
Figure 29: The pressure drop curves at various heat fluxes for 15°, 20°, and 25° taper
angles with 0.8 mm inlet gap height. The colored numbers represent the heat flux in
W/cm2. .............................................................................................................................. 66
Figure 30: The pressure drop curves at various heat fluxes for 5°, 10°, and 15° taper
angles with 1.27 mm inlet gap height. The colored numbers represent the heat flux in
W/cm2. No stable operating points were obtained for these cases. .................................. 67
Figure 31: The pressure drop curves at various heat fluxes for 20°, and 25° taper angles
with 1.27 mm inlet gap height. The colored numbers represent the heat flux in W/cm2. 69
Figure 32: The predicted mass flux values at 'stable operating points' for different
geometric configurations. ................................................................................................. 70
Figure 33: Schematic representations of (a) boiling test section with dual tapered
manifold block, and (b) pool boiling experimental setup with water. (Schematics are not
to scale) ............................................................................................................................. 73
Figure 34: Heat flow in copper heater block in the pool boiling setup with water. .......... 76
Figure 35: The temperature variation at different heat fluxes along the copper heater
block for 15° dual taper angle. .......................................................................................... 77
13
Figure 36: Pool boiling curves showing the performance of 10° and 15° dual taper angle
and comparison with 'no manifold block' configuration. .................................................. 78
Figure 37: The variation in heat transfer coefficient (HTC) at different heat fluxes for 15°
dual taper, 10° dual taper, and 'no manifold block’ configurations. ................................. 79
Figure 38: The image showing the establishment of two vapor columns with a central
liquid inlet at 140 W/cm2 for 15° dual tapered manifold block. ....................................... 80
Figure 39: The predicted HTC values and the comparison with experimental results. .... 81
Figure 40: Schematic showing the experimental setup and boiling test section used for
pool boiling study with dual tapered manifold bock and HFE7000. ................................ 85
Figure 41: Heat transfer in 1D along the copper heater block and copper test chip. ........ 88
Figure 42: The temperature variation at different heat fluxes along the copper heater
block for 25° dual taper angle and 0.8 mm inlet gap height. ............................................ 89
Figure 43: Pool boiling results for 0.8 mm inlet gap height and different dual taper angles
(5°-25°), (a) Variation in heat flux with respect to wall superheat, (b) Variation in heat
transfer coefficient (HTC) with respect to heat flux. ........................................................ 90
Figure 44: Pool boiling results for 1.27 mm inlet gap height and different dual taper
angles (5°-25°), (a) Variation in heat flux with respect to wall superheat, (b) Variation in
heat transfer coefficient (HTC) with respect to heat flux. ................................................ 92
Figure 45: Pool boiling curves for 5°, 10°, 15°, 20°, and 25° taper angles comparing the
effect of 0.8 mm and 1.27 mm inlet gap heights. ............................................................. 94
Figure 46: The predicted HTC values and the comparison with the experimental results
for different geometric configurations. ............................................................................. 96
Figure 47: The schematic of benchtop thermosiphon loop with dual-tapered manifold in
the evaporator and mock CPU. ....................................................................................... 101
Figure 48: The 3D CAD exploded model of the evaporator assembly. .......................... 103
Figure 49: Heat flow in copper block in benchtop thermosiphon loop. ......................... 106
Figure 50: Boiling curve showing the variation in heat flux with respect to wall superheat
for different dual taper angles in benchtop thermosiphon loop. ..................................... 107
Figure 51:Maximum heat fluxes dissipated for different dual taper angles in benchtop
thermosiphon loop. ......................................................................................................... 108
Figure 52: Variation in heat transfer coefficient (HTC) with respect to heat flux for
different dual taper angles in benchtop thermosiphon loop. ........................................... 109
Figure 53: The 3D CAD model of mock CPU used in the benchtop thermosiphon loop
study. ............................................................................................................................... 110
14
Figure 54: An unstructured mesh consisting of tetrahedral elements for simulation study
in ANSYS static thermal. ................................................................................................ 111
Figure 55: (a) The temperature contours obtained from the 3D simulation study of mock
CPU heater, (b) A 2D schematic of mock CPU heater showing the thermocouple
locations during experimental study. .............................................................................. 112
Figure 56: Schematic of experimental setup for actual CPU cooling using dual tapered
evaporator in the thermosiphon loop. ............................................................................. 114
Figure 57: An actual image of evaporator containing dual tapered manifold mounted on
the motherboard in direct contact with the CPU (i7-930 processor). ............................. 115
Figure 58: Schematic of temperature drops between CPU - air, and air - chiller for air
based, and water based coolers. ...................................................................................... 117
Figure 59: Schematic of temperature drops at the CPU-refrigerant, and refrigerant-chiller
interfaces for thermosiphon loop. ................................................................................... 117
Figure 60: Plot showing the thermal performance of thermosiphon loop, air cooler, and
water during thermal tests on the CPU (i7-930 processor). ............................................ 119
Figure 61: Plot showing the thermal performance of single taper and dual taper manifolds
in thermosiphon during thermal tests on the CPU. ......................................................... 120
Figure 62: Schematic of the mock CPU heater and actual pictures of different coolers
used in the study. 'H' represents the height of each cooler mounted on the top of mock
CPU. ................................................................................................................................ 122
Figure 63: Plot showing the thermal performance of thermosiphon loop, air cooler, and
water during thermal tests on the mock CPU under varying heat flux conditions. ........ 123
Figure 64: Schematic of the experimental setup used for obtaining high-speed imaging of
bubble squeezing mechanism in the tapered microgap. .................................................. 129
Figure 65: Bubble squeezing mechanism in tapered microgap with 10º taper angle and
0.8 mm inlet gap height. ................................................................................................. 132
Figure 66: Bubble squeezing mechanism in tapered microgap with 10º taper angle and
1.2 mm inlet gap height. ................................................................................................. 133
Figure 67: Bubble squeezing mechanism in tapered microgap with 10º taper angle and
0.35 mm inlet gap height. ............................................................................................... 135
Figure 68: Bubble squeezing mechanism in tapered microgap with 2º taper angle and 1
mm inlet gap height. ....................................................................................................... 136
Figure 69: High speed images of bubble squeezing mechanism in a 10° tapered microgap
to track the advancing and receding interface velocities along the downstream direction.
......................................................................................................................................... 137

15
Figure 70: Plot showing the advancing and receding interface velocities with respect to
time for a 10° taper angle. ............................................................................................... 138
Figure 71: Schematic of forces acting on a squeezed bubble in the tapered microgap. . 139
Figure 72: The actual images of air based cooler used in this study. ............................. 154
Figure 73: The actual images of water-based cooler used in this study. ........................ 155

16
List of Tables Table 1: Flow boiling performance of uniform and tapered manifolds [34,41]. .............. 42
Table 2: Comparison between the theoretical and experimental HTC values for 15° dual
taper and 1.27 mm inlet gap height with water. ................................................................ 82
Table 3: Pool boiling results for 0.8 mm inlet gap and different dual taper angles with
HFE7000. .......................................................................................................................... 91
Table 4: Pool boiling results for 1.27 mm inlet gap and different dual taper angles with
HFE7000. .......................................................................................................................... 93
Table 5: Comparison between the theoretical and experimental HTC values at CHF for
different geometric configurations for 1.27 mm inlet gap with HFE7000. ...................... 97
Table 6: The temperature comparison between experimental and numerical results at T1,
T2, and T3 during benchtop thermosiphon loop study. ................................................... 113
Table 7: The comparison of average θJ-CW values for air cooler, water cooler, and
different thermosiphon loop configurations. ................................................................... 119
17
Nomenclature q" heat flux, W/cm2
dT dx⁄ temperature gradient, °C/m
kCu thermal conductivity of copper, W/(m°C)
Ts surface temperature, °C
∆Tsat wall superheat, °C
T1 top thermocouple temperature, °C
T2 middle thermocouple temperature, °C
T3 bottom thermocouple temperature, °C
T4 chip thermocouple temperature, °C
Tsat saturation temperature of liquid, °C
∆x distance between successive thermocouples, m
x1 distance between surface and T4 thermocouple, m
TCPU average temperature of the four cores of CPU, °C
ΘJ-CW temperature difference between CPU and chiller water, °C
By bias error
Py precision error
Uy total uncertainty
dP dz⁄ pressure drop per unit length, Pa/m
dz length along flow direction, m
𝐿𝑡𝑝 two phase flow length, m
𝑓𝑡𝑝 two phase friction factor (-)
𝐺 mass flux, kg/(m2s)
m mass flow rate, kg/s
𝐷ℎ hydraulic diameter, m
𝑥 exit quality (-)
hfg latent heat of vaporization, J/kg

18
𝐴𝑐 cross section area, m2
𝐶𝑜 convection number (-)
𝐵𝑜 boiling number (-)
𝐶1 − 𝐶4 constants (-)
ℎ𝑓 liquid phase heat transfer coefficient, W/(m2°C)
𝐹𝑓 liquid dependent parameter (-)
𝑅𝑒𝑓 liquid Reynolds number (-)
𝑃𝑟𝑓 liquid Prandtl number (-)
𝑘𝑓 liquid thermal conductivity, W/(m°C)
Fσ force due to surface tension, N/m
Fp force due to pressure difference, N/m
Fem evaporation momentum force, N/m
Fnet net force at bubble interface, N/m
Greek Symbols
𝑣𝑓 specific volume of the liquid, m3/kg
𝑣𝑔 specific volume of the vapor, m3/kg
𝑣𝑓𝑔 difference in the specific volumes of the liquid and vapor phases, m3/kg
Ɵ angle of inclination from the horizontal plane, °
µ𝑡𝑝 two phase viscosity, Pas
µ𝑔 dynamic viscosity of vapor, Pas
µ𝑓 dynamic viscosity of liquid, Pas
𝜌𝑓 liquid density, kg/m3
𝜌𝑔 vapor density, kg/m3
∆𝑃𝑔𝑒𝑜 pressure drop due to geometry - entrance and exit losses, Pa

19
Subscript
Cu copper
s surface
sat saturation
tp two phase
h hydraulic
c cross section
f liquid
g vapor
geo geometry
Abbreviation
HTC heat transfer coefficient, W/(m2°C)
CHF critical heat flux, W/m2 or W/cm2
20
Chapter 1
1.0 Introduction
1.1 Electronics Thermal Management
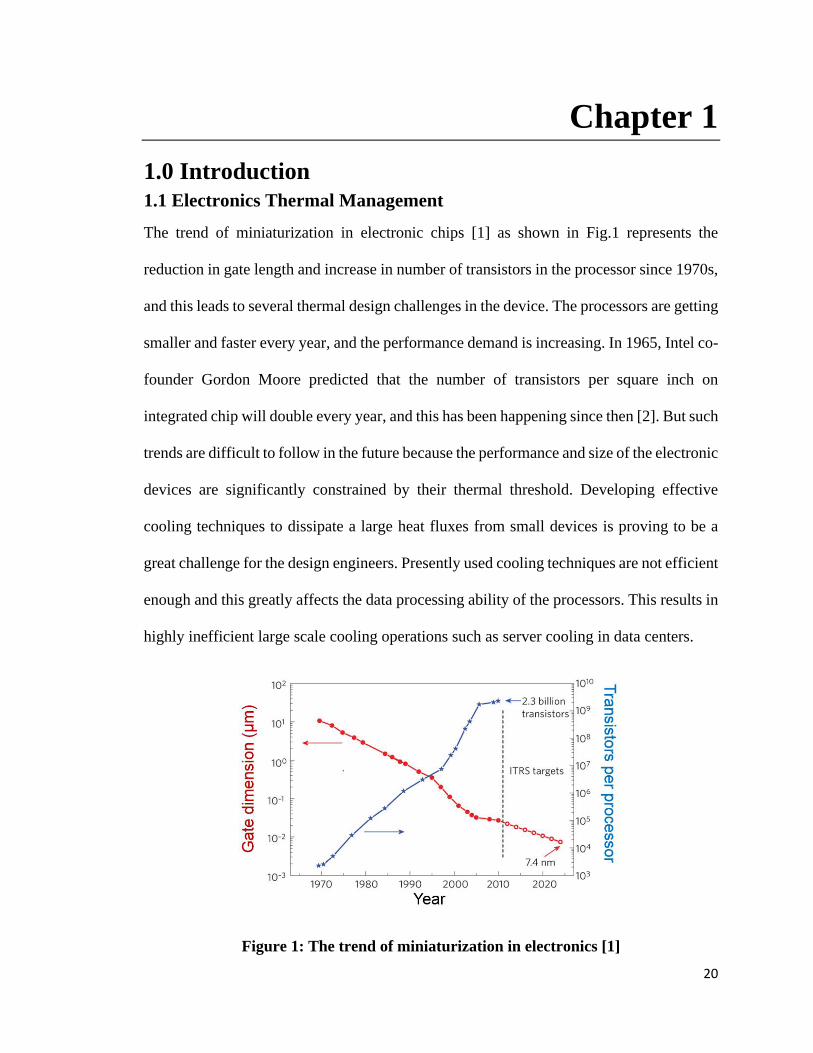
The trend of miniaturization in electronic chips [1] as shown in Fig.1 represents the
reduction in gate length and increase in number of transistors in the processor since 1970s,
and this leads to several thermal design challenges in the device. The processors are getting
smaller and faster every year, and the performance demand is increasing. In 1965, Intel co-
founder Gordon Moore predicted that the number of transistors per square inch on
integrated chip will double every year, and this has been happening since then [2]. But such
trends are difficult to follow in the future because the performance and size of the electronic
devices are significantly constrained by their thermal threshold. Developing effective
cooling techniques to dissipate a large heat fluxes from small devices is proving to be a
great challenge for the design engineers. Presently used cooling techniques are not efficient
enough and this greatly affects the data processing ability of the processors. This results in
highly inefficient large scale cooling operations such as server cooling in data centers.
Figure 1: The trend of miniaturization in electronics [1]

21
A data center is a building used to house computer systems for the storage, distribution,
and processing of large quantity of data. Data centers manage the internet connectivity
across the globe acting as the backbone of information transfer around the globe. It contains
large number central processing units (CPUs) installed in the servers generating high heat
fluxes under stressful working conditions. A data center may have multiple server rooms,
each room contains several server racks arranged in an array.
Due to enormous energy consumption during server cooling, a significant cost is spent on
data center management annually. Based on the findings of Cool IT Systems, in an air-
based cooled data center, 60% of the total power consumption is used for networking,
server, storage etc., and the remaining 40% power is used for cooling operations as shown
in Fig.2. Based on the report by Natural Resources Defense Council in partnership with
Anthesis, in 2013 nearly 3 million computer rooms in data centers used electricity
equivalent to the annual output of 34 large coal-fired power plants. The US based data
centers have the potential to reduce the electricity consumption by 40 percent[3], this
estimates to an energy saving of 39 billion kilowatt-hours equivalent to $3.8 billion.
Currently used CPU cooling techniques based on air, and water as the cooling medium are
discussed in the following section.

22
Figure 2: Distribution of total power consumption in a data center according to
Cool IT Systems.
1.2 Data Center Cooling Techniques
The two major types of currently used data center cooling processes are air, and water-
based techniques. These two strategies are discussed in this section.
1.1.1 Air Cooling
In an air-based cooling system, a computer room air conditioner (CRAC) or computer room
air handler (CRAH) unit is installed in the server room. The cold air is supplied from the
CRAC unit to the inlet of racks. The cold air flow is driven through each server by a fan
arrangement installed in the server, and hot air from the outlet of the racks is supplied back
to the CRAC unit. The CRAC unit is connected to an external water chiller outside the data
center. The water chiller extracts the heat from CRAC and dumps it in the open atmosphere.
The two types configurations based on air flow from the CRAC to the racks’ inlet are, (a)
non raised floor design, and (b) raised floor layout [4]. In a non raised floor design, the
cold air is supplied into the server room through diffusers. In a raised floor design as shown
in Fig.3, the cold air is supplied through the raised floor which is constructed under the

23
server room. The cold air is eventually supplied in the room via perforated floor design
using tiles.
The major thermal challenge in the air-based cooling system is hot air recirculation. The
hot air from the outlet of the racks is recirculated in the room and is supplied into the server
inlet resulting in high server temperatures. The servers towards the top of the rack receive
hot air due to recirculation compared to the servers placed near the floor. The processing
load on the rack is limited by the air temperature at the hot end, and this results in efficient
rack processing.
The air flow segregation approach can be adopted to minimize the hot air recirculation.
This can be accomplished by developing hot-cold aisle containments [5]. In such
configuration, the designated aisles are constructed, and the cold air from the perforated
tiles is supplied in the cold aisle. The cold air flows through the front end of the servers
along the rack height and the hot air from the rear end of the servers is expelled in the hot
aisle. The segregation aisles can be constructed using Plexiglas, and this design offers a
low-cost approach. The plexiglass walls are nonstructural in nature and therefore can be
modified easily based on the design requirements.
Figure 3: The air cooling mechanism in a raised floor layout for data center
cooling.
24
The air cooling has reached its maximum heat dissipation limit. Air offers low heat transfer
coefficient, and this results in high convection based thermal resistances. The specific heat
capacity of air is also low, therefore, to mitigate these effects high temperature differences
between cooling air and the servers are needed for required heat dissipation. This results in
the demand of unnecessary low air temperature supply. In a conventional server, the
required temperature of the air at the inlet of the server is 27 °C but the air supplied in the
server room is at 15°C or lesser. Hence effective cooling solutions are required for efficient
CPU cooling in servers.
1.1.2 Water Cooling
The water-based cooling configuration is generally used to dissipate heat from high density
servers. In present air-based cooling systems, the heat from CRAC units is dissipated by a
water-cooled external chiller. Therefore, cooling processing equipment using water as the
coolant is an extension of the currently used water-cooling loops closer to the server. The
two levels of water-based cooling systems are, (a) rack level cooling, and (b) server level
cooling.
The two configurations of rack level cooling are, (i) liquid-cooled door, and (ii) closed-
liquid rack. In liquid-cooled door, the liquid is supplied to the door of the rack, and the
door is constructed as an air-liquid heat exchanger. The hot air expelled from the rack
passes through the door heat exchanger and cold air from the heat exchanger is resupplied
to the rack inlet. Two other types of rack level cooling methods similar to liquid-cooled
door configuration are overhead liquid coolers, and in-row liquid coolers. In closed-liquid
rack system, the rack is completely sealed, and a liquid-cooled heat exchanger is installed
below the rack. The room air enters the sealed rack from the bottom into the heat exchanger,

25
and cold air from the heat exchanger flows along the rack height towards the multiple
server inlets. These configurations eliminate the need of developing hot-cold aisles.
In server level cooling, the working cooling liquid is supplied to the CPU in the server, and
heat dissipation takes place through a cold plate attached on the top on CPU. The heat
dissipation efficiency of server level cooling is much higher than the rack level cooling
system. Reduced thermal resistance is obtained in server level cooling due to smaller heat
transfer path between the cooling liquid and CPU [6,7]. The server level cooling does not
eliminate the need of air as cooling medium since several other components in the server
require cooling. The transition from rack level to server level cooling adds more design
complexity and cost, and it is suggested to adopt server level cooling for high power density
CPU applications.
Immersion cooling: Another configuration of liquid cooling is immersion cooling. In this
configuration, the server is completely immersed in a dielectric cooling liquid. The heat
from the electronic components is dissipated into the dielectric liquid by natural
convection. This server-dielectric system is enclosed, and an external water loop is used to
transfer heat from the dielectric liquid outside the enclosure. A schematic of immersion
cooling setup is shown in Fig. 4.
Figure 4: The schematic of water-cooling loop in a dielectric direct
immersion cooling setup.
26
1.3 Two Phase Heat Transfer
The efficient high heat flux dissipation and hot-spot mitigation demands from the CPUs in
a data center are beyond the capability of previously discussed single-phase cooling
mechanisms. The two-phase heat transfer (boiling heat transfer) is the futuristic approach
for reliable thermal management of the processing equipment. The two main categories of
boiling heat transfer systems are, (a) pool boiling, and (b) flow boiling.
1.3.1 Pool Boiling
In a pool boiling system, a stagnant pool of liquid is converted into vapor phase at the
saturation temperature of liquid due continuous heat supply from a heated surface where
the heating surface’s temperature is greater than the saturation temperature of the liquid.
The degree of wall superheat (ΔTsat) is defined as the temperature difference between the
heating surface and the saturation temperature of liquid. Heat flux is defined as the amount
of heat dissipated from the heated surface per unit area and it is measured in W/cm2 or
W/m2. For electronics cooling application, heat flux is generally represented in W/cm2
since the electronic equipment have small dimensions.
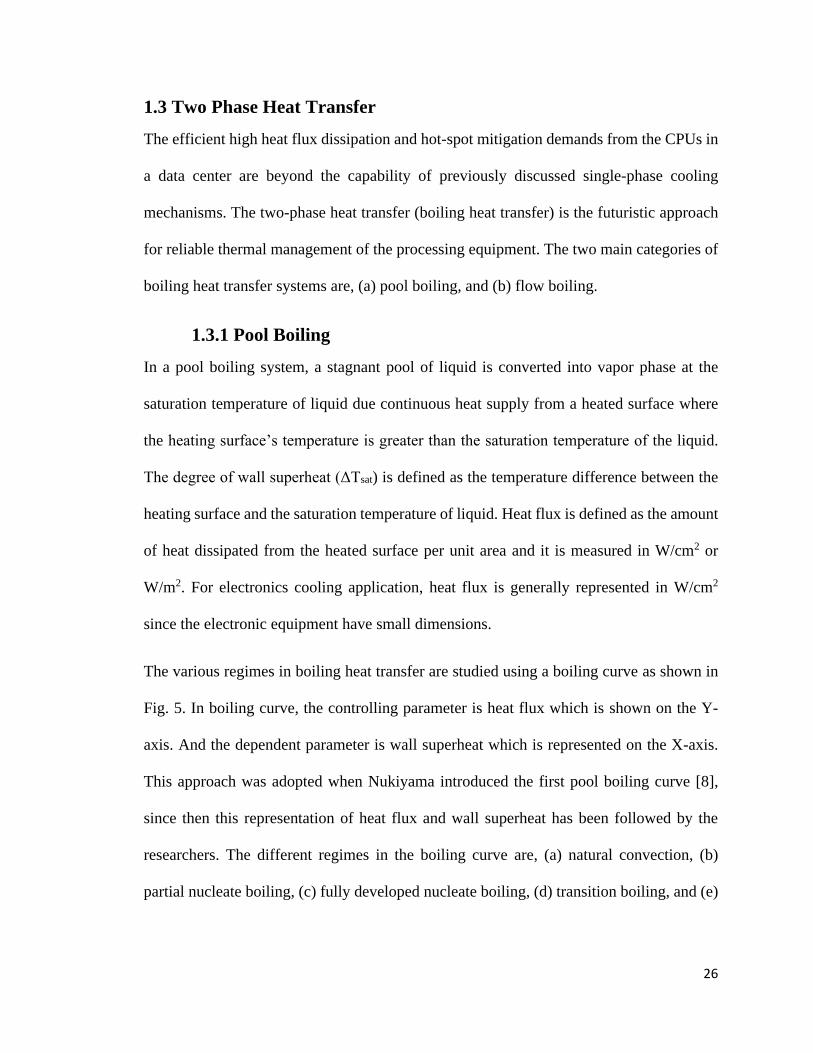
The various regimes in boiling heat transfer are studied using a boiling curve as shown in
Fig. 5. In boiling curve, the controlling parameter is heat flux which is shown on the Y-
axis. And the dependent parameter is wall superheat which is represented on the X-axis.
This approach was adopted when Nukiyama introduced the first pool boiling curve [8],
since then this representation of heat flux and wall superheat has been followed by the
researchers. The different regimes in the boiling curve are, (a) natural convection, (b)
partial nucleate boiling, (c) fully developed nucleate boiling, (d) transition boiling, and (e)
27
film boiling. The exact nature of the boiling curve is dependent on the working liquid and
the morphology of the heating surface.
Natural convection (Region 1): The natural convection region is defined from the origin
of the curve to point ‘a’. At low heat fluxes, the wall superheat is small and liquid near the
heated surface is at higher temperature compared to the bulk liquid. This temperature
gradient in the liquid volume creates a density difference along the height. The hot liquid
near the heated surface is less dense hence rises upwards, and cold denser liquid from the
bulk replaces the hot liquid near the heated surface. This develops a natural convection
flow, and this mode of heat transfer sustains till point ‘a’.
Partial nucleate boiling (Region 2): At point ‘a’ the bubble starts nucleating from the
heated surface and this point of first bubble occurrence is called onset of nucleate boiling
(ONB). The partially developed nucleate boiling region is defined from point ‘a’ to point
Figure 5: Pool boiling curve showing different boiling regimes.

28
‘b’. In this region, the bubbles nucleate from various active nucleation sites, and the bubble
nucleation frequency increases with continuous increase in the heat flux.
Fully developed nucleate boiling (Region 3): The transition from partial to fully developed
nucleate boiling is shown by point ‘b’. At point ‘b’, the bubbles begin coalescing in the
vertical direction to form continuous vapor jets. The fully developed nucleate boiling
region is defined from point ‘b’ to point ‘c’. In this region, the bubbles begin coalescing
horizontally along the heated surface to form mushroom like vapor structures with several
stems attached on the heated surface. As the heat flux increases, at point ‘c’ critical heat
flux (CHF) condition is achieved. At CHF a sudden jump in the surface temperature is
observed as shown by the dashed line from point ‘c’ to point ‘e’.
Film boiling (Region 5): At CHF, the bubble nucleation frequency is highest, and bubbles
coalesce on the heated surface to form a stable insulating vapor film. This increases the
surface temperature, and the dominant mode of heat transfer is radiation. By reducing the
heat flux, the boiling curve is traced from point ‘e’ to ‘d’. At point ‘d’, minimum heat flux
is achieved, and this point is called Leidenfrost point. Further reducing the heat flux results
in sudden drop in the wall superheat value and the nucleate boiling is attained.
Transition boiling (Region 4): The transition boiling region is from point ‘d’ to point ‘c’.
This boiling region can be obtained by controlling the wall superheat. The previously
discussed regions were achieved by controlling the heat flux. In transition boiling, the
bubbles occupy significant area on the heated surface.
A significant heat transfer enhancement is obtained in the nucleate boiling region; hence
this region (point ‘a’ to point ‘c’) defines the desired operating range for a two-phase
29
system. The steep nature of the boiling curve in the partial nucleate boiling and fully
developed nucleate boiling regions suggest high heat fluxes can be dissipated with small
increase in the wall superheat. Therefore, high heat transfer coefficient (HTC) can be
obtained in this region. HTC is the ratio of heat flux and the wall superheat, and it defines
the heat dissipation efficiency of the system.
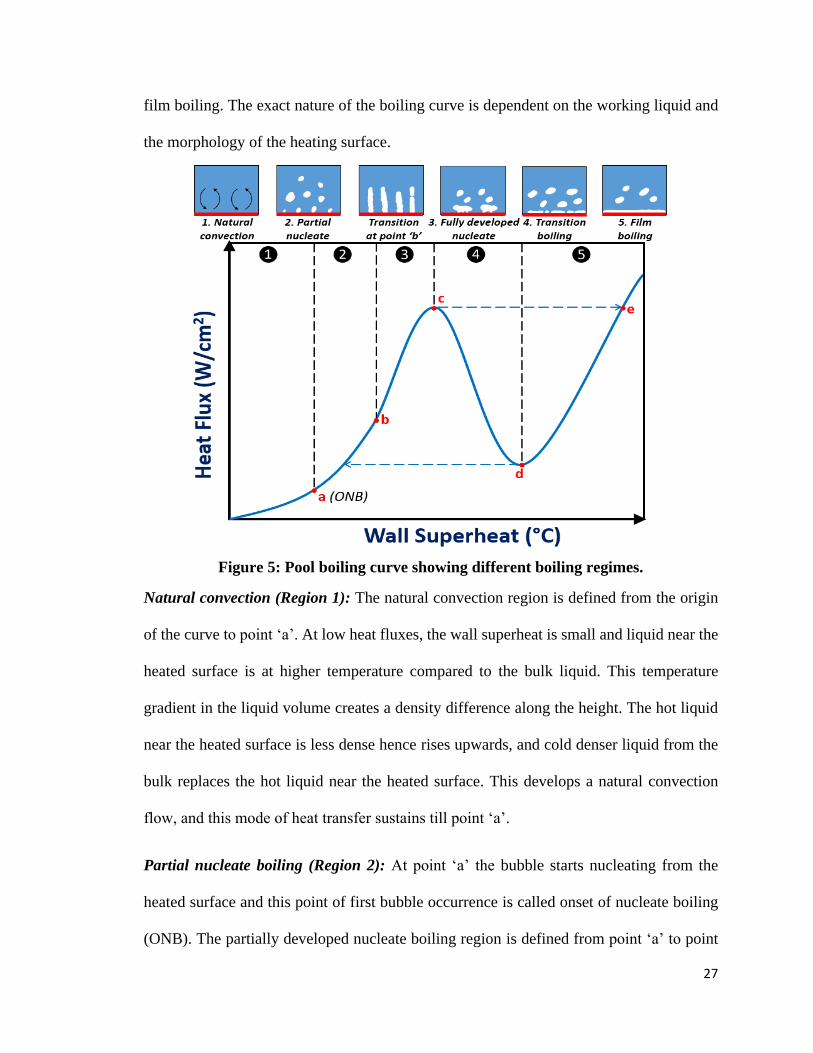
1.3.2 Flow Boiling
In flow boiling, the desired liquid flow rate on the heated surface is achieved by using an
external pump. The bubbles are forced to move along the boiling domain due to high liquid
inertia, unlike pool boiling where bubble motion was significantly driven by the buoyancy.
The different boiling regimes in a flow boiling channel are characterized based on the
relative liquid-vapor volumes in the channel. These boiling regimes in a flow boiling
system are shown in Fig.6.
The various regimes as shown in Fig.6 are described below.
Forced Convection with liquid flow (Region 1): The liquid is forced into the channel by
an external pump and forced convection occurs along the heated walls as liquid travels
through region 1.
Figure 6 : Schematic showing different regimes during flow boiling in a closed channel.
30
Bubbly Flow (Region 2): The liquid is continuously heated along the surface and this
initiates bubble nucleation at the saturation condition. The bubbles move along the heated
surface due to forced fluid flow and begin to move towards the core due to buoyancy.
Slug Flow (Region 3): As the liquid is further heated along the surface, the fluid core also
heats up and the temperature of the liquid in the core increases resulting in bubble
expansion due to evaporation and coalescence to form large bubbles.
Annular Flow (Region 4): Due to continuous bubble expansion and coalescence in the
core, a large vapor space is created confining liquid in the smaller spaces along the heated
surface.
Transition Flow (Region 5): The liquid region is restricted to minimal spaces close to the
heater and eventually disappears due to continuous evaporation and expansion of vapor
space in the core. Small drops of liquid are also observed in the core of the channel.
Mist Flow (Region 6): In this region, the liquid flows in the vapor dominated space in the
form of mist.
Forced Convection with Vapor Flow (Region 7): Towards the end of the channel, the
mist completely evaporates, and the channel space is entirely occupied by the vapor phase.
31
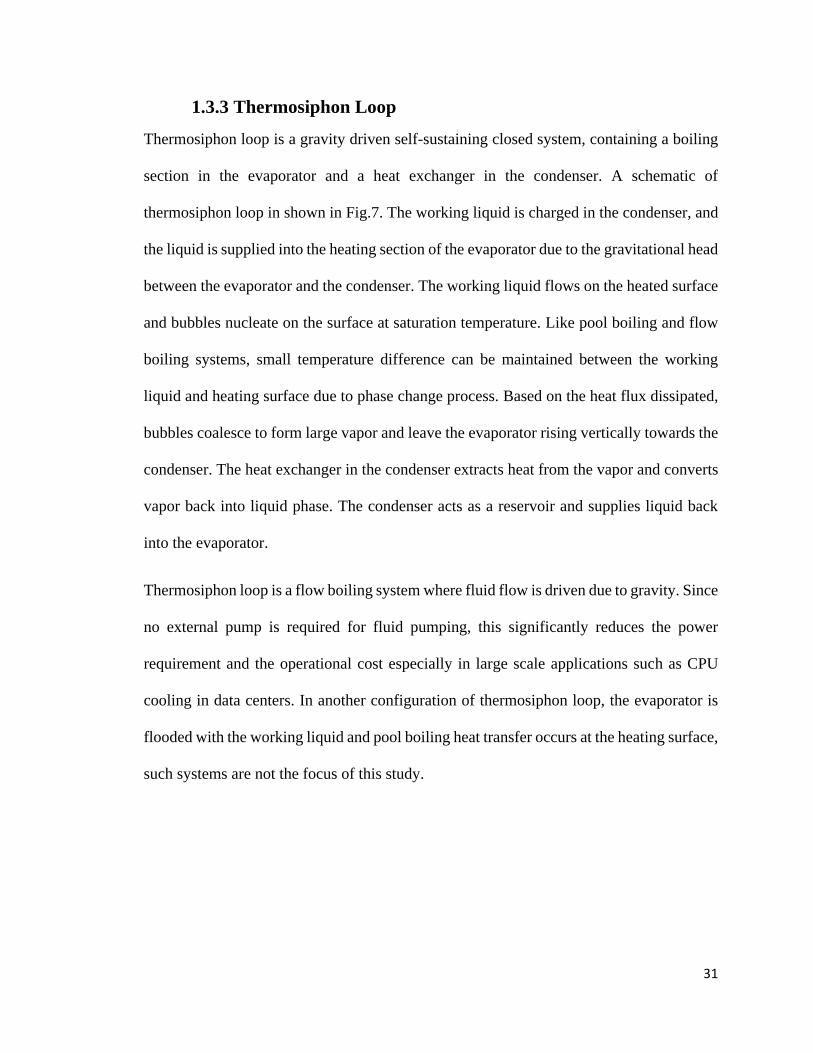
1.3.3 Thermosiphon Loop
Thermosiphon loop is a gravity driven self-sustaining closed system, containing a boiling
section in the evaporator and a heat exchanger in the condenser. A schematic of
thermosiphon loop in shown in Fig.7. The working liquid is charged in the condenser, and
the liquid is supplied into the heating section of the evaporator due to the gravitational head
between the evaporator and the condenser. The working liquid flows on the heated surface
and bubbles nucleate on the surface at saturation temperature. Like pool boiling and flow
boiling systems, small temperature difference can be maintained between the working
liquid and heating surface due to phase change process. Based on the heat flux dissipated,
bubbles coalesce to form large vapor and leave the evaporator rising vertically towards the
condenser. The heat exchanger in the condenser extracts heat from the vapor and converts
vapor back into liquid phase. The condenser acts as a reservoir and supplies liquid back
into the evaporator.
Thermosiphon loop is a flow boiling system where fluid flow is driven due to gravity. Since
no external pump is required for fluid pumping, this significantly reduces the power
requirement and the operational cost especially in large scale applications such as CPU
cooling in data centers. In another configuration of thermosiphon loop, the evaporator is
flooded with the working liquid and pool boiling heat transfer occurs at the heating surface,
such systems are not the focus of this study.
32
Figure 7: The schematic of thermosiphon loop with evaporator and condenser.

33
Chapter 2
2.0 Literature Review
The literature review on different boiling systems, (a) pool boiling, (b) flow boiling, and
(c) thermosiphon loop are discussed in this chapter. In pool boiling, the different surface
enhancement techniques and separate liquid-vapor pathways mechanism are discussed. In
flow boiling, the different channel designs and tapered gap geometry were reviewed for
heat dissipation enhancement. And finally, the potential of thermosiphon loop was also
reviewed for electronics cooling application.
2.1 Pool Boiling
2.1.1 Surface Enhancements
Surface enhancement techniques have been studied by researchers to dissipate large heat
fluxes efficiently by delaying the CHF and improving the HTC. The region near the heated
surface affects the enhancement mechanisms such as contact line augmentation. The
enhancements based on contact line augmentation include wicked surfaces [9], roughness
augmentation [10–12], and microlayer partioning [13]. Raghupathi et al.[14] presented the
effect of microgrooves on the departure diameter and bubble dynamics. The bubble gets
pinned in 100 µm deep groves hence CHF was reduced but enhanced CHF was obtained
using the 200 µm wide and 10-20 µm deep groves. Zou and Maroo [13] significantly
improved the CHF by increasing the bubble frequency using nano-micro ridges for the
partition of microlayer into slabs. Rahman et al.[9] reported that increase in liquid
wickability of the boiling surface leads to linear increment in the CHF. Chu et al. [10]
increased the effective contact line dimension using micropillar roughness augmented
surfaces, and this increased the CHF.

34
Figure 8: (a) Surface topography showing various roughness[10]; (i) 0.027 µm, (ii)
1.08 µm, (iii) 2.22 µm, and (iv) 5.89 µm, (b) Varying HTC with respect to heat flux
for different roughness surfaces with FC-77[15]
Jones et al. [15] studied the effect of surface roughness on HTC for FC-77 and water as the
working fluids. For FC-77 fluid, a continuous improvement in HTC was observed for
surface roughness higher than 1.08 µm as shown in Fig.8. For water, the HTC increased
significantly for roughness greater than 10 µm. Betz et al.[16] obtained improved CHF and
HTC values using biphilic surfaces compared to the surface with uniform wettability. In
biphilic configuration, the lateral bubble coalescence is prevented by the hydrophilic
regions, and hydrophobic regions increase the number of active nucleation sites. Nam et
al.[12] studied Si based hydrophilic and copper based superhydrophilic surfaces. It was
observed that the performance enhancement can be achieved using superhydrophilic
surfaces since the bubble departure diameter was reduced by a factor of 2.5 and the bubble
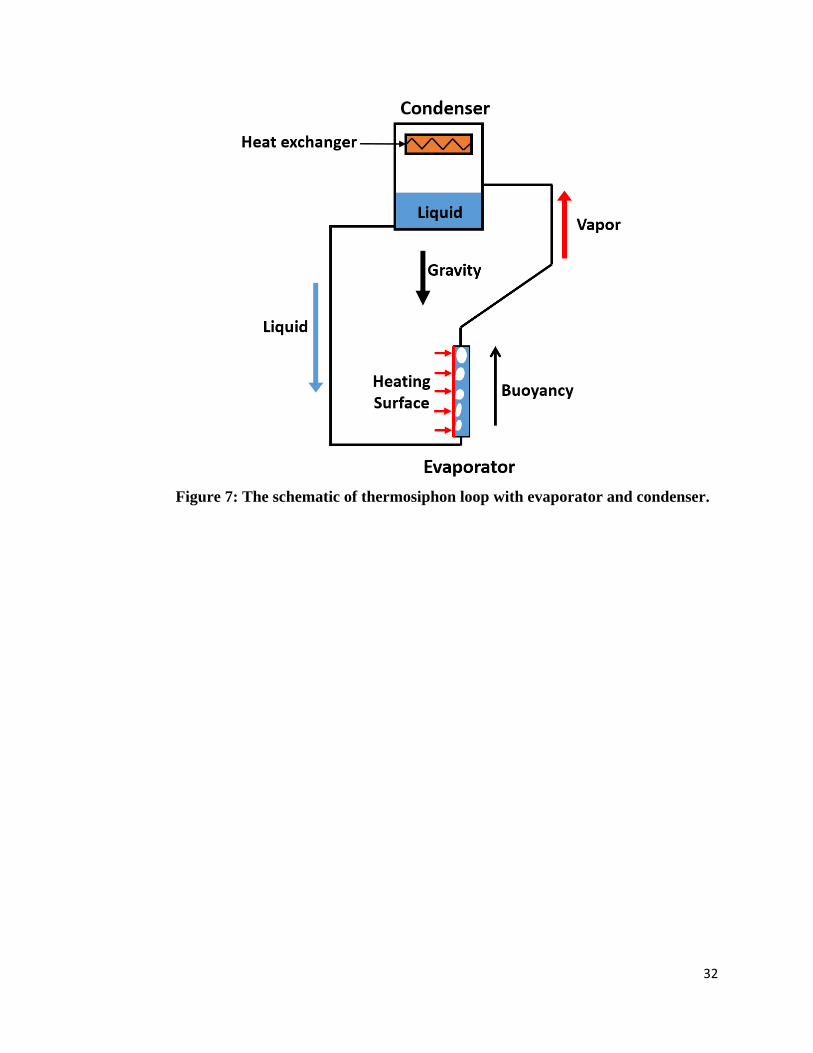
growth duration was reduced 4 times. Figure 9 shows the various surface enhancements
developed for the efficient heat flux dissipation. These enhancements are, wicking
microstructures[17,18], bi-conductive configuration[19], tall porous structures[20,21],
nano-micro ridges[14,22,23], and pores and tunnels[24].
35
Figure 9: Various surface enhancements; tall porous structures [20,21], bi
conductive configuration [19], nano micro ridges [14,22,23], and wicking
microstructures [17,18].
2.2.2 Separate Liquid-Vapor Pathways
The efficient removal of vapor bubbles from the boiling surface, and continuous surface
rewetting by developing effective liquid resupply are critical phenomena for CHF and HTC
enhancement. Liter and Kaviany [25] used porous projections to develop vapor pathways
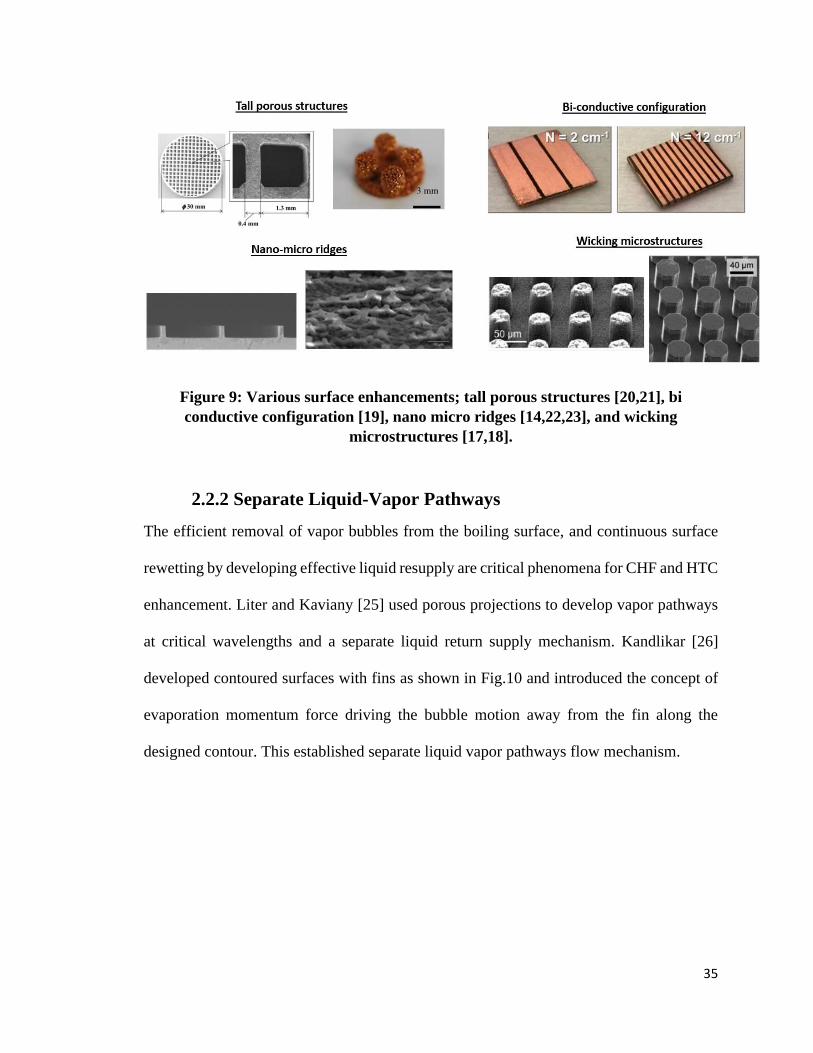
at critical wavelengths and a separate liquid return supply mechanism. Kandlikar [26]
developed contoured surfaces with fins as shown in Fig.10 and introduced the concept of
evaporation momentum force driving the bubble motion away from the fin along the
designed contour. This established separate liquid vapor pathways flow mechanism.
36
Figure 10: Schematic of the countered fin and the trajectory of a bubble nucleating
the base of the fin [26].
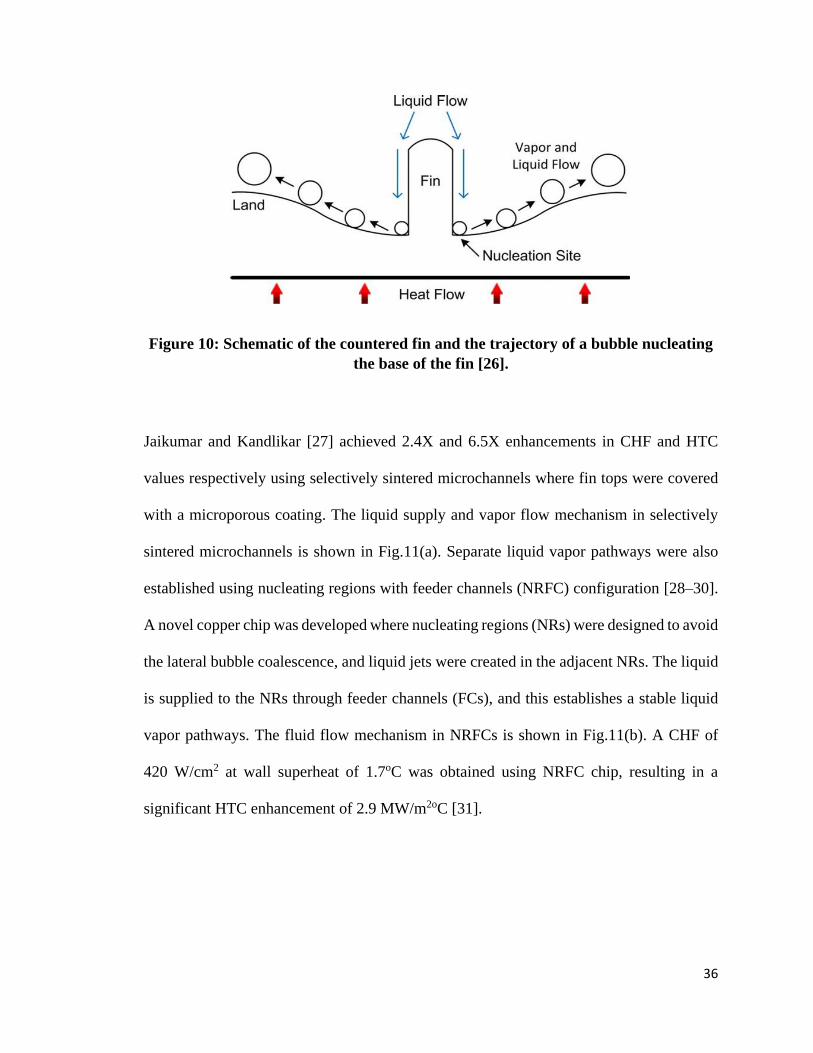
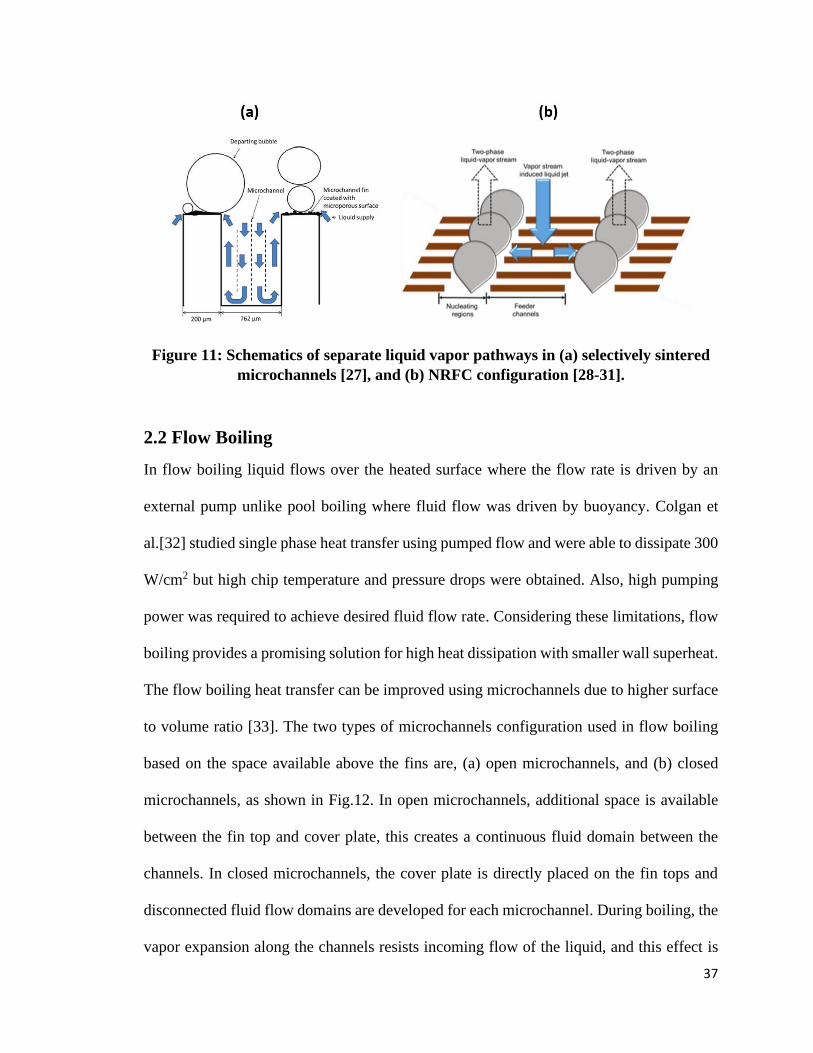
Jaikumar and Kandlikar [27] achieved 2.4X and 6.5X enhancements in CHF and HTC
values respectively using selectively sintered microchannels where fin tops were covered
with a microporous coating. The liquid supply and vapor flow mechanism in selectively
sintered microchannels is shown in Fig.11(a). Separate liquid vapor pathways were also
established using nucleating regions with feeder channels (NRFC) configuration [28–30].
A novel copper chip was developed where nucleating regions (NRs) were designed to avoid
the lateral bubble coalescence, and liquid jets were created in the adjacent NRs. The liquid
is supplied to the NRs through feeder channels (FCs), and this establishes a stable liquid
vapor pathways. The fluid flow mechanism in NRFCs is shown in Fig.11(b). A CHF of
420 W/cm2 at wall superheat of 1.7oC was obtained using NRFC chip, resulting in a
significant HTC enhancement of 2.9 MW/m2oC [31].
37
Figure 11: Schematics of separate liquid vapor pathways in (a) selectively sintered
microchannels [27], and (b) NRFC configuration [28-31].
2.2 Flow Boiling
In flow boiling liquid flows over the heated surface where the flow rate is driven by an
external pump unlike pool boiling where fluid flow was driven by buoyancy. Colgan et
al.[32] studied single phase heat transfer using pumped flow and were able to dissipate 300
W/cm2 but high chip temperature and pressure drops were obtained. Also, high pumping
power was required to achieve desired fluid flow rate. Considering these limitations, flow
boiling provides a promising solution for high heat dissipation with smaller wall superheat.
The flow boiling heat transfer can be improved using microchannels due to higher surface
to volume ratio [33]. The two types of microchannels configuration used in flow boiling
based on the space available above the fins are, (a) open microchannels, and (b) closed
microchannels, as shown in Fig.12. In open microchannels, additional space is available
between the fin top and cover plate, this creates a continuous fluid domain between the
channels. In closed microchannels, the cover plate is directly placed on the fin tops and
disconnected fluid flow domains are developed for each microchannel. During boiling, the
vapor expansion along the channels resists incoming flow of the liquid, and this effect is
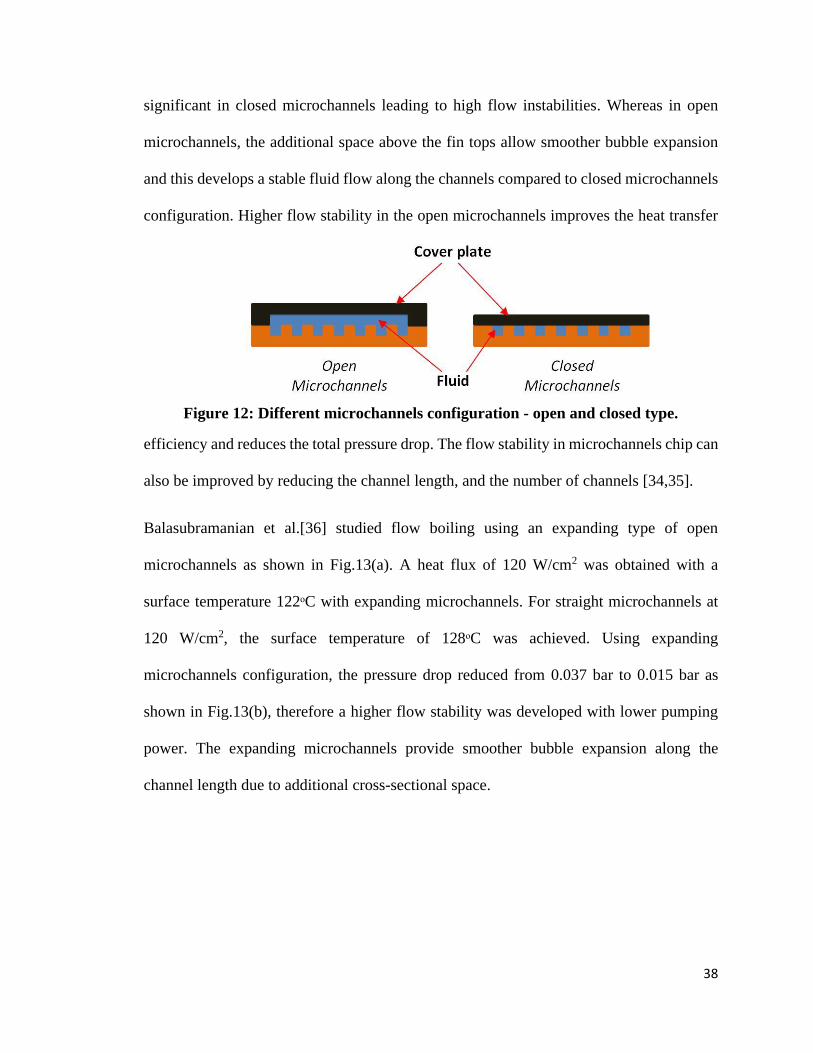
38
significant in closed microchannels leading to high flow instabilities. Whereas in open
microchannels, the additional space above the fin tops allow smoother bubble expansion
and this develops a stable fluid flow along the channels compared to closed microchannels
configuration. Higher flow stability in the open microchannels improves the heat transfer
efficiency and reduces the total pressure drop. The flow stability in microchannels chip can
also be improved by reducing the channel length, and the number of channels [34,35].
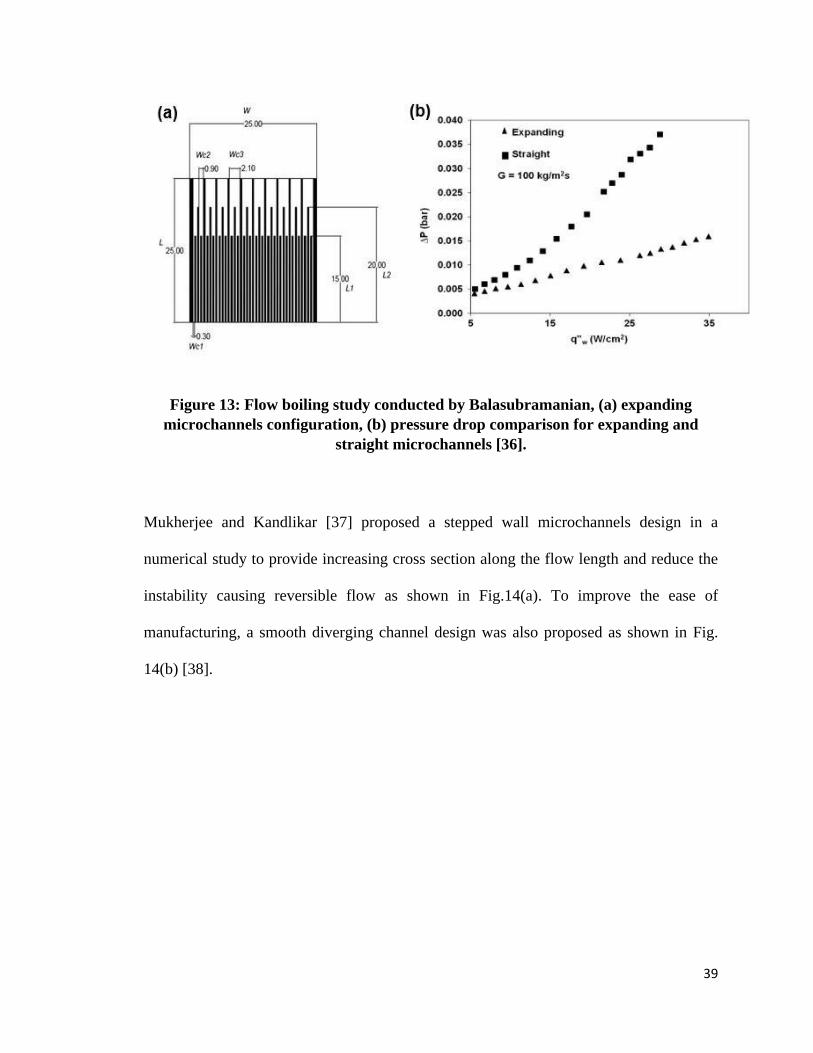
Balasubramanian et al.[36] studied flow boiling using an expanding type of open
microchannels as shown in Fig.13(a). A heat flux of 120 W/cm2 was obtained with a
surface temperature 122ᵒC with expanding microchannels. For straight microchannels at
120 W/cm2, the surface temperature of 128ᵒC was achieved. Using expanding
microchannels configuration, the pressure drop reduced from 0.037 bar to 0.015 bar as
shown in Fig.13(b), therefore a higher flow stability was developed with lower pumping
power. The expanding microchannels provide smoother bubble expansion along the
channel length due to additional cross-sectional space.
Figure 12: Different microchannels configuration - open and closed type.
39
Figure 13: Flow boiling study conducted by Balasubramanian, (a) expanding
microchannels configuration, (b) pressure drop comparison for expanding and
straight microchannels [36].
Mukherjee and Kandlikar [37] proposed a stepped wall microchannels design in a
numerical study to provide increasing cross section along the flow length and reduce the
instability causing reversible flow as shown in Fig.14(a). To improve the ease of
manufacturing, a smooth diverging channel design was also proposed as shown in Fig.
14(b) [38].

40
Lu and Pan [39] conducted an experimental study with diverging cross sections and 10
microchannels. The depth of each channel was 76 µm with a mean hydraulic diameter of
120 µm, and diverging angle of 0.5°. It was observed that diverging microchannels were
able to achieve higher flow stability compared to uniform cross section channels.
Prajapati et al.[40] studied single phase heat transfer in diverging microchannels and
evaluated the thermal performance of diverging, segmented, and uniform channels
configuration as shown in Fig.15. The number of channels in each configuration was 12
with hydraulic diameter 522 µm. The highest HTC observed was ~ 14 kW/m2K for
segmented microchannels configuration at the mass flux of 130 kg/m2s. The heat transfer
parameters were recorded at various mass fluxes, 130 kg/m2s, 194.7 kg/m2s, 260 kg/m2s
and 324.5 kg/m2s.
Figure 14: Expanding microchannels, (a) stepped wall microchannels [37], (b)
smooth wall microchannels [38].

41
Figure 15: Different microchannels, (a) uniform, (b) diverging, (c) segmented
studied by Prajapati et al. [40].
Kalani and Kandlikar [34,41] conducted flow boiling study with tapered manifold in an
open microchannels configuration as shown in Fig.16 and obtained lower pressure drop
and wall superheat compared to uniform manifold design. Three different tapered
configurations 2%, 4%, and 6% were studied and HTC of 278 W/cm2 was obtained with a
pressure drop of 3.3 kPa for 6% taper. The performance of different tapered manifold
configurations and uniform manifold are shown in Table 1.
Figure 16: Tapered manifold on microchannels chip studied by Kalani and
Kandlikar [34,41].

42
Table 1: Flow boiling performance of uniform and tapered manifolds [34,41].
The tapered manifold design was used on a microchannels chip with fin width, fin height,
and channel width 200 µm, since the microchannels design achieves lower pressure drop
along the flow length compared to plain chip design [42]. The heat transfer performance
increases and pressure drop reduces using a tapered manifold compared to a uniform
manifold design, but no heat flux or HTC enhancement is obtained by increasing the taper
height on a plain copper chip. At low heat fluxes, the tapered manifold shows similar heat
transfer performance compared to uniform manifold [34,41], but at high heat fluxes, the
superior performance is obtained with tapered manifold [41,43].
Bubble expansion in tapered manifold: In a uniform manifold, the vapor bubble expands
on the microchannels surface leading to dry out, this results in high pressure drop, low
HTC, and early CHF [44,45]. In the tapered manifold, the increasing cross section allows
bubble expansion in the vertical additional space along the flow direction, this delays the
dry out to large extents. The vapor in tapered manifold flows above the microchannels due
to buoyancy and allows effective continuous surface rewetting compared to uniform
manifold. The bubble departure in the overhead space in the tapered manifold provides
Manifold Heat Flux
(W/cm2)
Wall Superheat
(ᵒC)
Pressure Drop
(kPa)
Uniform 283.2 13 62.1
Taper A (2%) 265 14 7.5
Taper B (4%) 239.1 8.6 6
Taper C (6%) 281.2 10.1 3.3

43
nucleating sites under the fully grown departed bubbles as shown in Fig.17, thus enhancing
the heat transfer from microchannels surface to the working liquid [45].
Figure 17: The bubble departure in tapered manifold and nucleation under a fully
grown departed bubble [45].
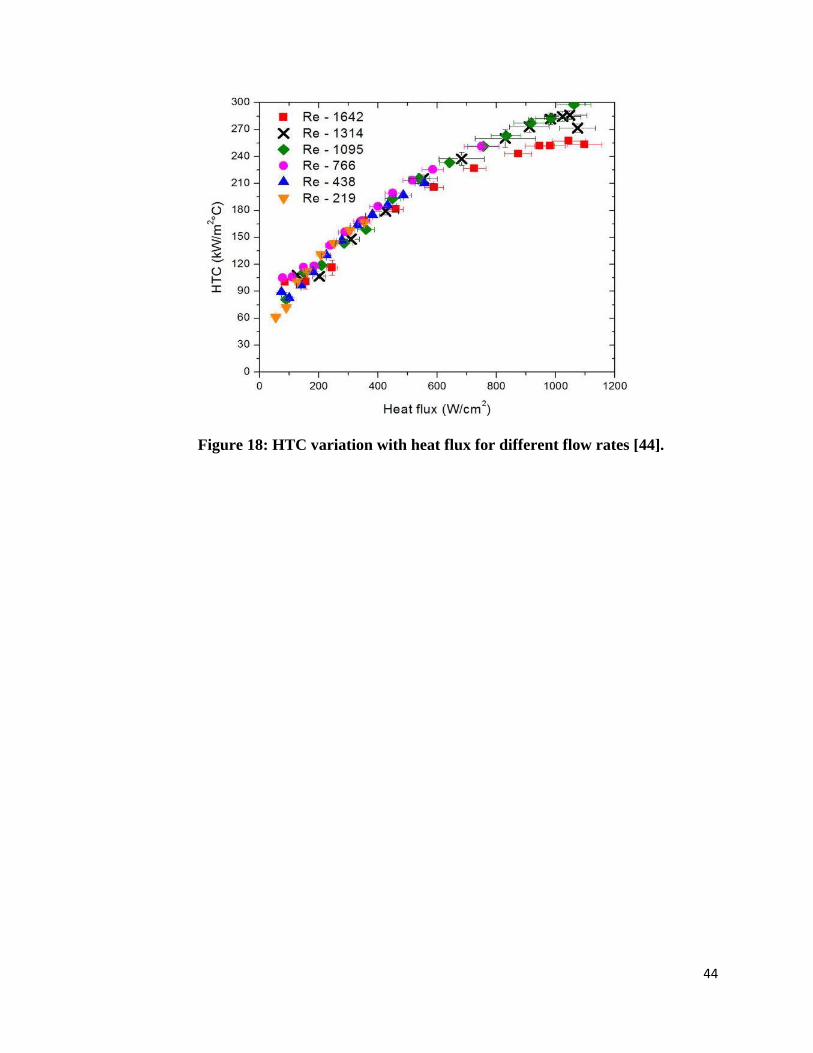
Effect of flow rate in tapered manifold configuration: Kalani and Kandlikar [44,45]
explained that the vapor bubbles can be removed effectively by increasing the Reynolds
number (Re). At higher Re, the bubbles are carried away from the boiling domain due to
high liquid inertia. For Re 1642, a CHF of 1.1 kW/cm2 was obtained at a wall superheat of
43°C using a 6% taper manifold with microchannels. The tapered manifold design becomes
essential at high Re since pressure drop also increases with increase in mass flow rate, and
tapered design provides a pressure recovery effect. But at very high Re, the liquid inertia
forces bubbles onto the heater surface leading to poor heat transfer performance as shown
in Fig.18, and this phenomenon is called vapor blanketing.
44
Figure 18: HTC variation with heat flux for different flow rates [44].
45
2.3 Thermosiphon Loop
The thermosiphon loop is a passive two-phase gravity driven system i.e., no external pump
is required for fluid circulation. Thermosiphon loops are generally used to transfer heat
over large distances compared to conventional heat pipes [46]. Franco and Filippeschi [47]
experimentally studied a thermosiphon loop using plain hollow copper cylinder as the
heating substrate in the evaporator and achieved heat flux of 370 kW/m2 with water as the
working fluid. Pal et al.[48] applied thermosiphon loop for processor cooling in a
commercial desktop computer. The loop dissipated 50 W/cm2 with water and the bottom
temperature of the evaporator was maintained at 60°C. The system was also evaluated with
refrigerant PF5060 as the working fluid, and the bottom temperature of the evaporator was
maintained at 98°C. Lamaison et al.[49] numerically studied the thermal performance of
thermosiphon loop for parallel cooling of two Intel Xeon E560 processors and dissipating
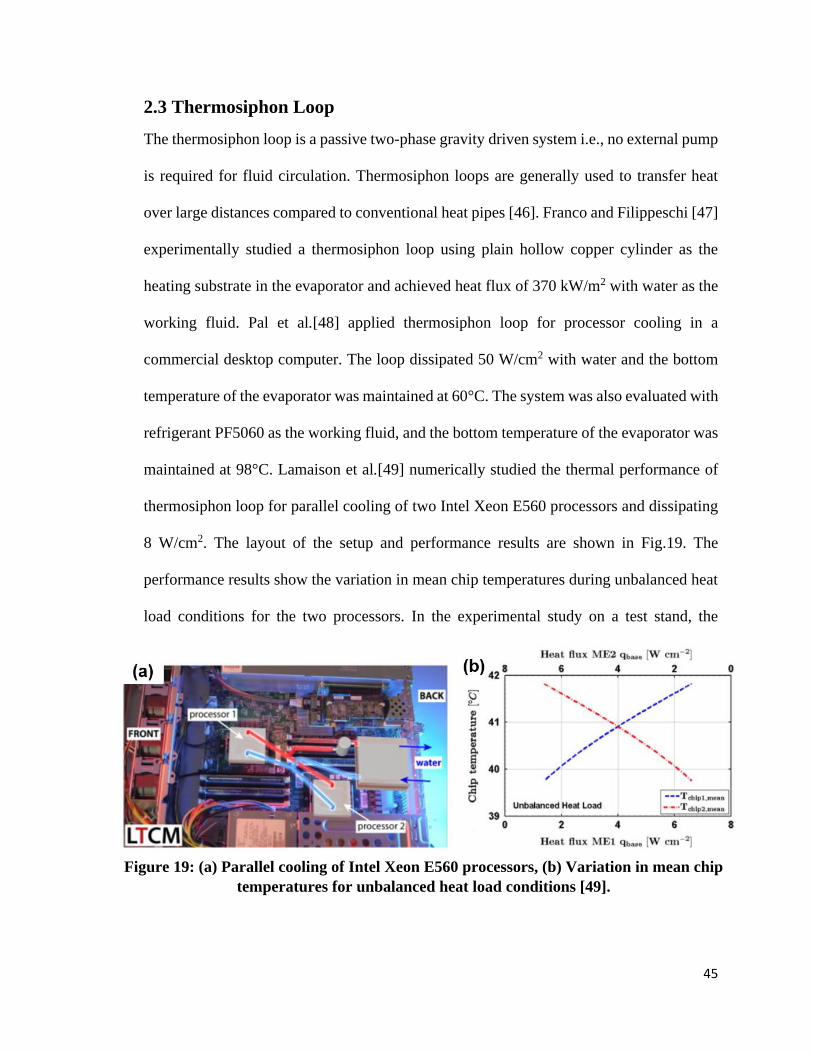
8 W/cm2. The layout of the setup and performance results are shown in Fig.19. The
performance results show the variation in mean chip temperatures during unbalanced heat
load conditions for the two processors. In the experimental study on a test stand, the
Figure 19: (a) Parallel cooling of Intel Xeon E560 processors, (b) Variation in mean chip
temperatures for unbalanced heat load conditions [49].

46
thermosiphon loop dissipated 33 W/cm2 using refrigerant R134a as the working fluid and
the chip temperature was maintained at 56°C.
Samba et al. [50] developed an evaporator where a microchannel block was used to
separate the liquid and vapor chambers in the evaporator. This evaporator was used in a
thermosiphon loop with n-pentane as the working fluid to dissipate heat from a prototype
of telecommunications outdoor cabinet. The loop was able to dissipate 600 W, and the
operating temperature of the cabinet was maintained below 55°C. Whereas, using an air-
cooling technique at 55°C operating temperature only 250 W was dissipated. Noie [51]
evaluated an integrated loop where the evaporator and the condenser were contained in a
single unit as shown in Fig.20. The experimental study was conducted to evaluate the
combined effect of filling ratio and aspect ratio on heat transfer performance of the loop.
Figure 20: The integrated thermosiphon loop unit studied by Noie et al. [51].
Saenan and Baelmans [52] analytically evaluated the heat transfer performance of three
different refrigerants as the working fluids, R134a, R236fa, and R245fa by varying the
accumulator volume. Webb et al. [53,54] studied two different working fluids – water,

47
refrigerant R134a, and achieved HTC values greater than 60 kW/m2ºC. Tuma [55] used
metallic porous coatings on the heated surface in the evaporator for microprocessor cooling
application and obtained HTC of 100 kW/m2ºC. The image of microporous coating and
experimental setup are shown in Fig.21.
Moura [56] used circular cavities in the thermosiphon loop and reduced the temperature of
the processor by 26°C. The circular cavities enhances the nucleate boiling thus reducing
the pressure drop. The reduced pressure drop enhances the HTC in the gravity driven
systems [57,58]. The orientation of the heated surface in the evaporator affects the thermal
performance of the thermosiphon loop. The heat transfer performance is reduced for a
horizontal surface compared to a vertical configuration [59]. In this research study, the
performance of thermosiphon loop is evaluated for horizontally oriented CPU cooling in
the data center servers.
Figure 21: Schematic of the thermosiphon loop used for microprocessor cooling using
metallic porous coatings at the interface [55].
48
Chapter 3
3.0 Research Approach
3.1 Research Need
The currently used air-based cooling techniques are not efficient to dissipate high heat
fluxes from CPUs in the data center. Due to large thermal resistances involved in air
cooling, extremely low temperature air supply is required to dissipate heat from the servers.
To meet the cooling demands, single phase water cooling is adopted for high power density
CPUs, but this technique requires continuous pumping power for the fluid flow and hot
spots are generated on the CPU surface. Also, the leakage of water can cause severe
damage to the processing equipment.
In this work boiling heat transfer is proposed as the efficient solution for high heat flux
dissipation using a ‘dual-tapered manifold’ design. Kalani and Kandlikar[34,41] studied
flow boiling enhancement using a single taper manifold on a small surface (1 cm2) where
an external pump was used for fluid circulation. The pressure drop (𝛥𝑃) affects the
pumping power required for the stable volumetric flow rate (��) in a system as shown by
Eq. (1).
𝑃𝑜𝑤𝑒𝑟 = 𝛥𝑃. �� (1)
The aim of this work was to obtain a pumpless self-driven stable fluid flow on a larger
heater surface (11 cm2) for CPU cooling in data centers. Therefore, a dual-taper design was
developed to reduce the pressure drop by decreasing the flow length, since external
pumping power is not available for driving the flow.
49
Hypothesis: It is hypothesized that taper manifold provides pressure recovery effect which
can be effective to create two-phase flow in tapered microgaps for significantly enhanced
pool boiling, and thermosiphon loop heat transfer performances.
3.2 Methodology
The two major boiling heat transfer configurations studied in this work are (a) pool boiling,
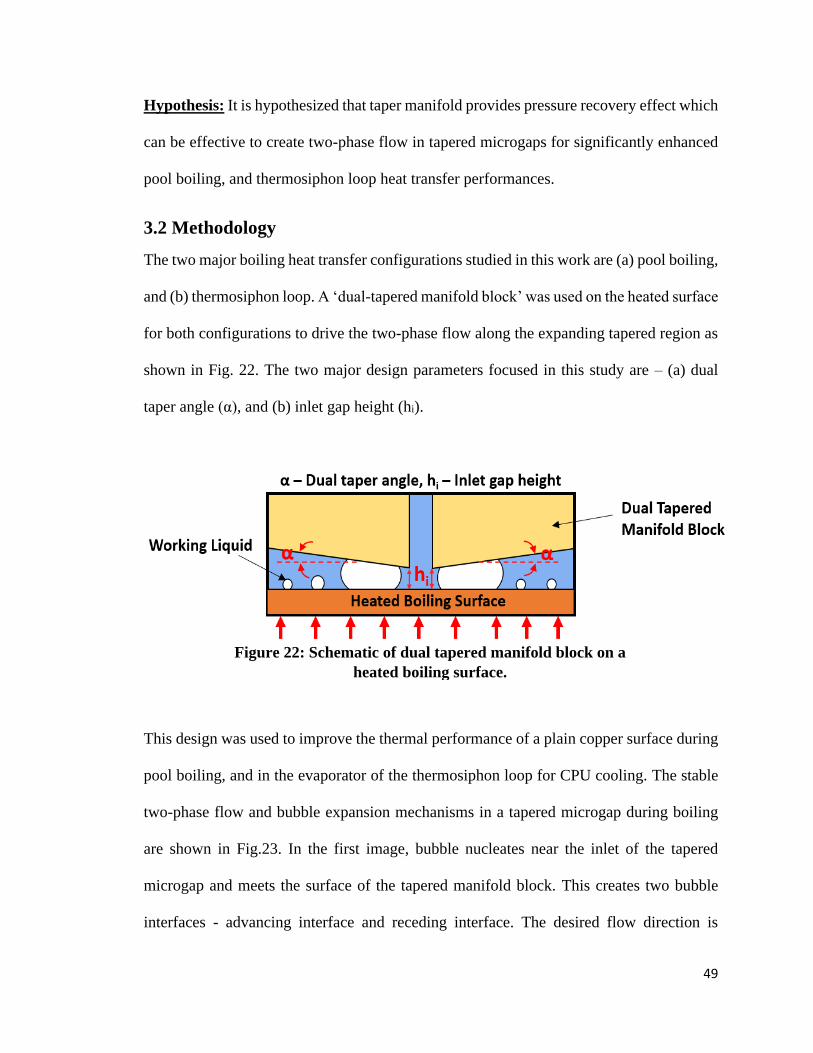
and (b) thermosiphon loop. A ‘dual-tapered manifold block’ was used on the heated surface
for both configurations to drive the two-phase flow along the expanding tapered region as
shown in Fig. 22. The two major design parameters focused in this study are – (a) dual
taper angle (α), and (b) inlet gap height (hi).
This design was used to improve the thermal performance of a plain copper surface during
pool boiling, and in the evaporator of the thermosiphon loop for CPU cooling. The stable
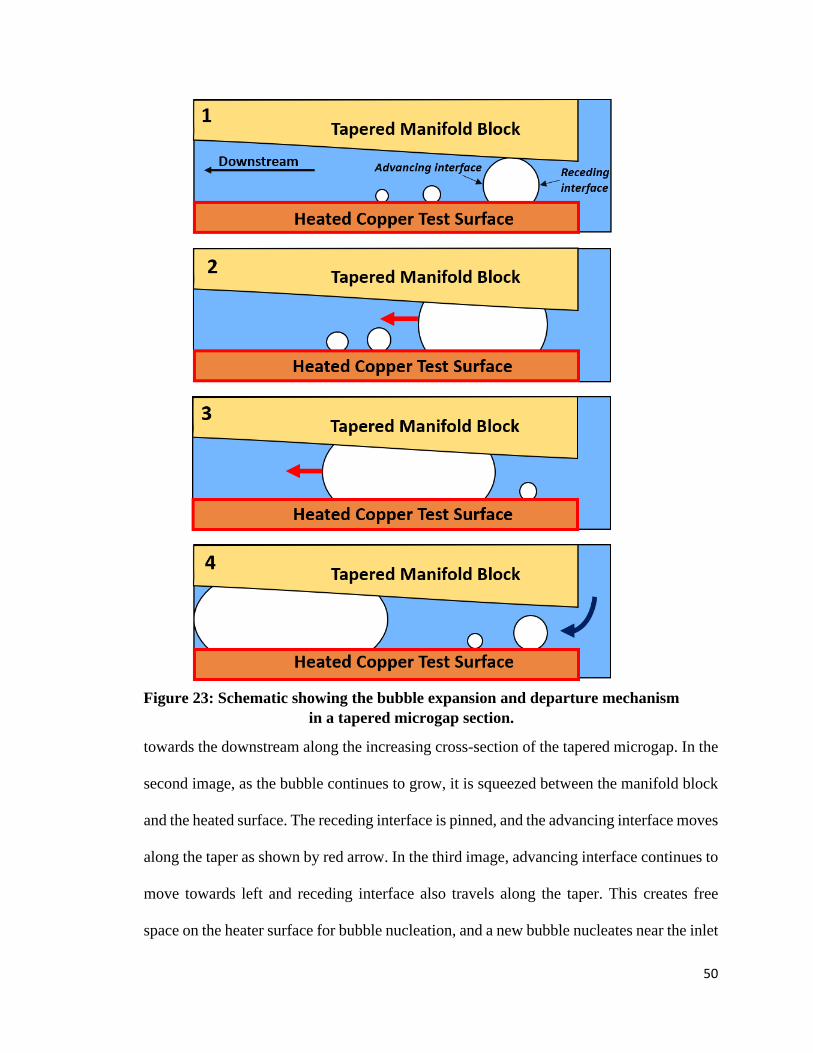
two-phase flow and bubble expansion mechanisms in a tapered microgap during boiling
are shown in Fig.23. In the first image, bubble nucleates near the inlet of the tapered
microgap and meets the surface of the tapered manifold block. This creates two bubble
interfaces - advancing interface and receding interface. The desired flow direction is
Figure 22: Schematic of dual tapered manifold block on a
heated boiling surface.
50
towards the downstream along the increasing cross-section of the tapered microgap. In the
second image, as the bubble continues to grow, it is squeezed between the manifold block
and the heated surface. The receding interface is pinned, and the advancing interface moves
along the taper as shown by red arrow. In the third image, advancing interface continues to
move towards left and receding interface also travels along the taper. This creates free
space on the heater surface for bubble nucleation, and a new bubble nucleates near the inlet
Figure 23: Schematic showing the bubble expansion and departure mechanism
in a tapered microgap section.

51
of the tapered microgap. In the fourth image, the expanding bubble leaves the tapered
region, and this creates a liquid pumping effect near the inlet of the microgap as shown by
blue arrow. The expanding cross section in the tapered region helps in pressure recovery
thus reducing the total pressure drop along the flow and improves the flow stability in the
boiling domain. The bubble squeezing mechanism creates a liquid pumping effect from the
bulk into the tapered microgap region and this helps in continuous surface rewetting. In a
thermosiphon loop, the gravitational head and bubble squeezing mechanism provides the
combined liquid pumping effect in the tapered microgap. The pressure recovery and bubble
squeezing mechanisms are discussed in detail later in Chapter 4 and Chapter 8,
respectively.
The objectives of this research work are, (i) to develop a fundamental theoretical model to
predict the pressure recovery, total pressure drop, mass flux, and HTC due to tapered
microgap geometry in a pool boiling system to (ii) improve the CHF and HTC of a pool
boiling system using dual tapered manifold on a plain copper surface and characterize the
performance as a function of geometrical and operating parameters, (iii) evaluate the heat
dissipation performance of an innovative evaporator containing the dual tapered manifold
in a thermosiphon loop for CPU cooling in data center, and (iv) obtain high speed images
of bubble squeezing mechanism in a tapered microgap and present a theoretical analysis.
3.3 Research Layout
The various objectives accomplished in this research and the corresponding chapters are
discussed below.
1. Chapter 4: Theoretical model for pressure drop and HTC predictions in pool
boiling.

52
(a) A theoretical model was developed to evaluate the two-phase flow characteristics
and effect of different geometric and operational parameters on thermal
performance of dual tapered manifold block. The model was developed to predict
the pressure drop, pressure recovery, mass flux, and HTC in the tapered microgap
region. This helps in establishing a fundamental understanding of the two-phase
flow mechanism in the microgap.
2. Chapter 5 and Chapter 6: Pool boiling performance using dual tapered manifold.
(a) The aim of this study was to evaluate the heat dissipation performance of a dual
tapered manifold placed on a plain cooper test surface in a pool boiling system,
since the current pool boiling heat transfer enhancement studies are focused on
surface modifications such as nano-microstructures, porous coatings, and
microchannels. Such enhancement techniques involve expensive and highly skilled
fabrication processes. The aim is to develop simple, robust, add-on technique to
enhance the heat dissipation on a plain surface.
(b) An experimental study was conducted to evaluate the effect of geometrical design
parameters - taper angle, and inlet height on the heat dissipation performance. The
study was conducted for two different working fluids, water in Chapter 5, and
HFE7000 in Chapter 6. The HFE7000 fluid was used considering the electronics
cooling application due to its dielectric nature.
(c) The theoretical HTC values from Chapter 4 are presented and compared with the
experimental results to validate the theoretical model.
53
3. Chapter 7: Thermosiphon loop for CPU cooling using dual tapered manifold
design.
a) The aim of this study was to design, fabricate, and test an evaporator containing a
dual tapered manifold in a thermosiphon loop for CPU cooling in data center using
a dielectric liquid (HFE7000) as the working fluid. Thermosiphon loop is a gravity
driven system and does not require external pumping power for fluid circulation,
hence low operational cost can be achieved for large applications.
b) The heat dissipation performance of thermosiphon loop with dual tapered manifold
was evaluated and compared with the commercial air and water-based coolers.
These single-phase air and water coolers are currently used for CPU cooling in
RIT’s data center and the potential of the tapered manifold design was investigated
in data center cooling application.
4. Chapter 8: High speed imaging and theoretical analysis of bubble squeezing
mechanism.
a) High speed images of bubble squeezing mechanism were obtained in the tapered
microgap for different taper angles and inlet gap heights. During this study, the
motion of advancing and receding interfaces was tracked to gain insight into the
stable and unstable bubble squeezing mechanisms. A preliminary force balance
model was also developed to evaluate the effect of multiple forces acting on
advancing and receding interfaces.
54
Chapter 4
4.0 Theoretical Model for Pressure Drop and HTC
Prediction in Pool Boiling
A theoretical model was developed to predict the two-phase flow characteristics such as
mass flux, pressure recovery, net pressure drop, and the HTC for a tapered microgap in a
pool boiling configuration as shown earlier in Fig. 22. The theoretical analysis provides a
fundamental insight into the two-phase heat transfer, and this could provide a more
efficient optimization approach for tapered microgap based geometry. The approach
followed to develop the theoretical model consists of five steps as discussed below.
1. Input parameters: The two types of input parameters are, (a) geometric, and (b)
operational. The geometric parameters include the design parameters such as taper
angle, flow length, inlet gap height, and flow width. The operational parameters
include the type of working fluid and the dissipated heat flux at steady state.
2. Pressure drop model: The second step is to evaluate the pressure drop and
pressure recovery effects and calculate the net pressure drop in the microgap region.
Homogeneous flow model was adopted to evaluate the net pressure drop in the
boiling region for different input parameters [60]. A detailed discussion on the
pressure drop analysis in provided later in this chapter.
3. Estimate the mass flux: The third step is to estimate the mass flux at the center of
the expanding tapered section. It is assumed a ‘stable operating point’ is achieved
when the pressure drop is balanced by the pressure recovery effect for a given set
of input parameters. The ‘stable operating point’ suggests that a stable pumpless

55
two-phase flow is developed in the tapered microgap region. The mass flux values
were calculated at ‘stable operating points’ for different input parameters. A
detailed discussion on this is presented later in this chapter.
4. Prediction of heat transfer coefficient (HTC): The fourth step is to predict the
HTC for the obtained ‘stable operating points’. The boiling correlation by
Kandlikar [61] was used to predict the HTCs for different estimated mass fluxes. A
detailed discussion on the boiling correlation is presented later in this chapter.
5. Validation of theoretical model: The fifth step is to validate the theoretical HTC
predictions by comparing with the experimentally obtained HTCs for different
tapered configurations and working fluids. The validation and accuracy of the
model is presented later in Chapter 5 for water and Chapter 6 for HFE7000. A chart
representing the summary of the approach used for developing the theoretical
model is shown in Fig.24.
Figure 24: The flow chart representation of the approach adopted for theoretical
model.
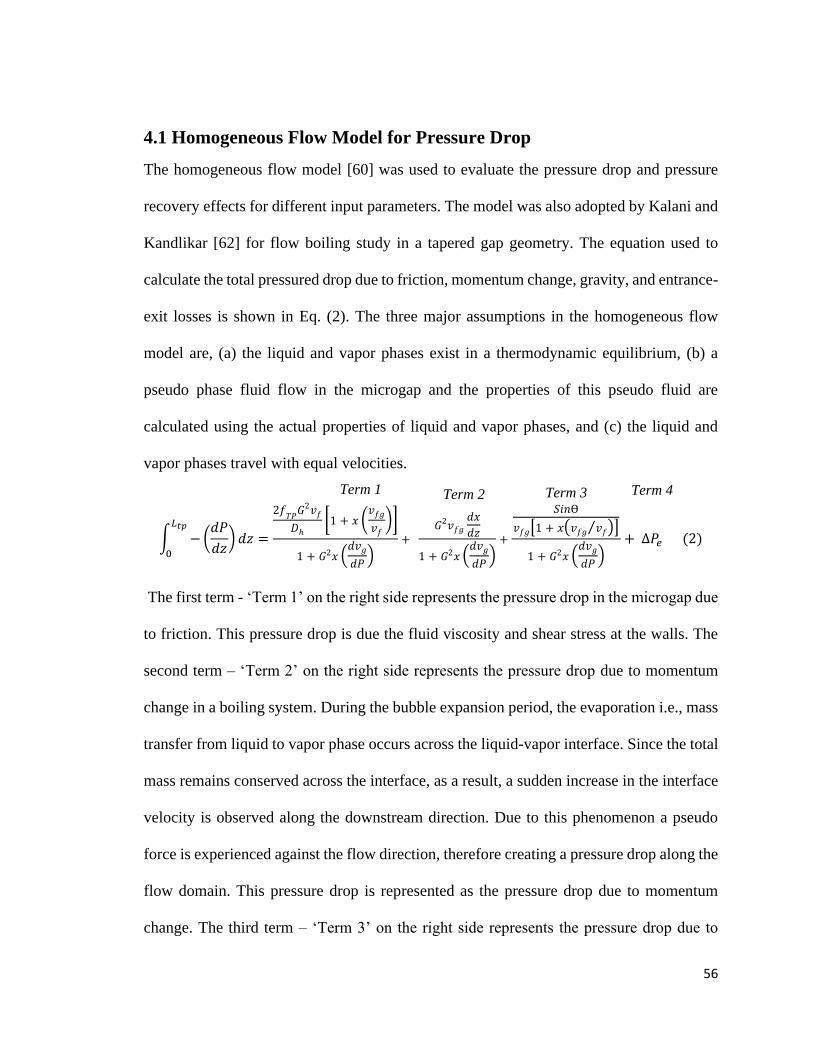
56
4.1 Homogeneous Flow Model for Pressure Drop
The homogeneous flow model [60] was used to evaluate the pressure drop and pressure
recovery effects for different input parameters. The model was also adopted by Kalani and
Kandlikar [62] for flow boiling study in a tapered gap geometry. The equation used to
calculate the total pressured drop due to friction, momentum change, gravity, and entrance-
exit losses is shown in Eq. (2). The three major assumptions in the homogeneous flow
model are, (a) the liquid and vapor phases exist in a thermodynamic equilibrium, (b) a
pseudo phase fluid flow in the microgap and the properties of this pseudo fluid are
calculated using the actual properties of liquid and vapor phases, and (c) the liquid and
vapor phases travel with equal velocities.
∫ − (𝑑𝑃
𝑑𝑧) 𝑑𝑧
𝐿𝑡𝑝
0
=
2𝑓𝑇𝑃
𝐺2𝑣𝑓
𝐷ℎ[1 + 𝑥 (
𝑣𝑓𝑔
𝑣𝑓)]
1 + 𝐺2𝑥 (𝑑𝑣𝑔
𝑑𝑃)
+ 𝐺2𝑣𝑓𝑔
𝑑𝑥
𝑑𝑧
1 + 𝐺2𝑥 (𝑑𝑣𝑔
𝑑𝑃)
+
𝑆𝑖𝑛Ɵ
𝑣𝑓𝑔[1 + 𝑥(𝑣𝑓𝑔 𝑣𝑓⁄ )]
1 + 𝐺2𝑥 (𝑑𝑣𝑔
𝑑𝑃)
+ ∆𝑃𝑒 (2)
The first term - ‘Term 1’ on the right side represents the pressure drop in the microgap due
to friction. This pressure drop is due the fluid viscosity and shear stress at the walls. The
second term – ‘Term 2’ on the right side represents the pressure drop due to momentum
change in a boiling system. During the bubble expansion period, the evaporation i.e., mass
transfer from liquid to vapor phase occurs across the liquid-vapor interface. Since the total
mass remains conserved across the interface, as a result, a sudden increase in the interface
velocity is observed along the downstream direction. Due to this phenomenon a pseudo
force is experienced against the flow direction, therefore creating a pressure drop along the
flow domain. This pressure drop is represented as the pressure drop due to momentum
change. The third term – ‘Term 3’ on the right side represents the pressure drop due to
Term 1 Term 2 Term 3 Term 4
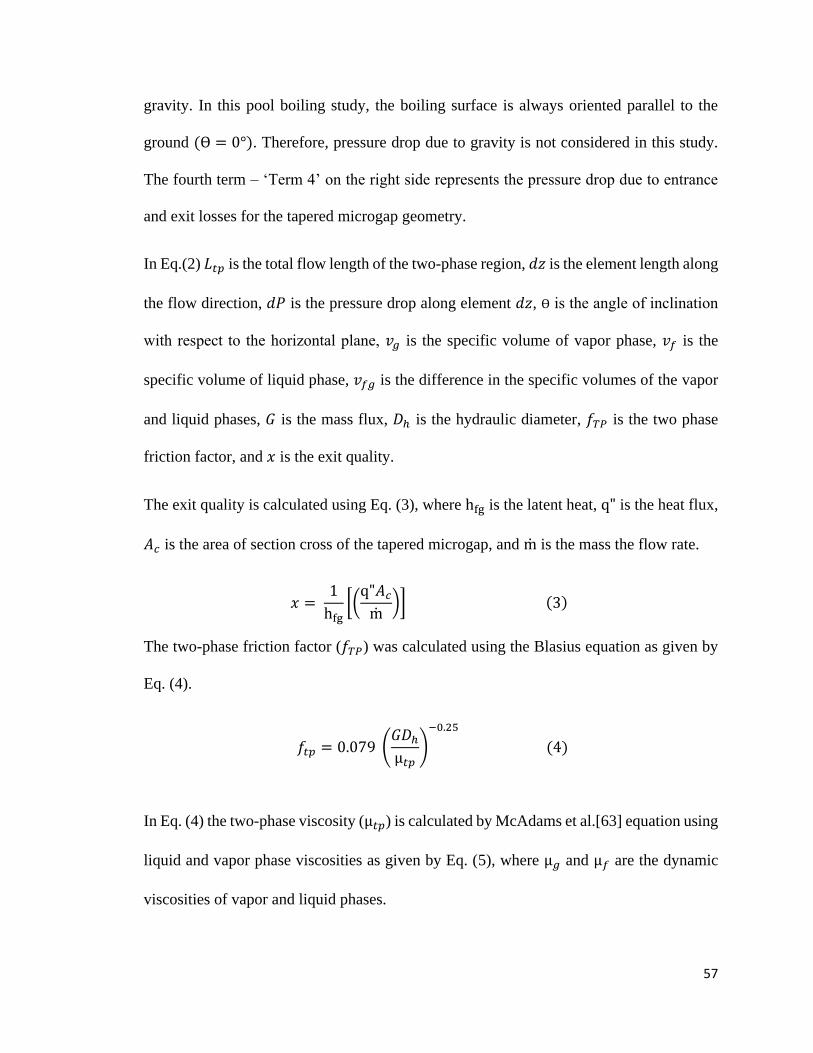
57
gravity. In this pool boiling study, the boiling surface is always oriented parallel to the
ground (Ɵ = 0°). Therefore, pressure drop due to gravity is not considered in this study.
The fourth term – ‘Term 4’ on the right side represents the pressure drop due to entrance
and exit losses for the tapered microgap geometry.
In Eq.(2) 𝐿𝑡𝑝 is the total flow length of the two-phase region, 𝑑𝑧 is the element length along
the flow direction, 𝑑𝑃 is the pressure drop along element 𝑑𝑧, Ɵ is the angle of inclination
with respect to the horizontal plane, 𝑣𝑔 is the specific volume of vapor phase, 𝑣𝑓 is the
specific volume of liquid phase, 𝑣𝑓𝑔 is the difference in the specific volumes of the vapor
and liquid phases, 𝐺 is the mass flux, 𝐷ℎ is the hydraulic diameter, 𝑓𝑇𝑃 is the two phase
friction factor, and 𝑥 is the exit quality.
The exit quality is calculated using Eq. (3), where hfg is the latent heat, q" is the heat flux,
𝐴𝑐 is the area of section cross of the tapered microgap, and m is the mass the flow rate.
𝑥 = 1
hfg[(
q"𝐴𝑐
m)] (3)
The two-phase friction factor (𝑓𝑇𝑃) was calculated using the Blasius equation as given by
Eq. (4).
𝑓𝑡𝑝 = 0.079 (𝐺𝐷ℎ
µ𝑡𝑝)
−0.25
(4)
In Eq. (4) the two-phase viscosity (µ𝑡𝑝) is calculated by McAdams et al.[63] equation using
liquid and vapor phase viscosities as given by Eq. (5), where µ𝑔 and µ𝑓 are the dynamic
viscosities of vapor and liquid phases.

58
1
µ𝑡𝑝=
𝑥
µ𝑔+
1 − 𝑥
µ𝑓 (5)
The pressure recovery per unit flow length due to the increasing cross-section area in the
tapered microgap is calculated using Eq. (6), where 𝑑𝐴/𝑑𝑧 represents the change in cross-
sectional per unit flow length.
(𝑑𝑃
𝑑𝑧𝑡𝑎𝑝𝑒𝑟 𝑎𝑟𝑒𝑎) =
2𝐺2𝑣𝑓
𝐴𝑐[1 + 𝑥 (
𝑣𝑓𝑔
𝑣𝑓)]
𝑑𝐴𝑑𝑧
1 + 𝐺2𝑥 (𝑑𝑣𝑔
𝑑𝑝)
(6)
The net pressure drop was calculated considering the pressure drop from Eq.(2) and
pressure recovery from Eq.(6). The pressure recovery due to taper balances the pressure
drop due to friction, momentum change, and entrance-exit losses. When this condition is
satisfied, a ‘stable operating point’ is obtained, and the mass flux value is estimated at the
mid cross-section of the tapered section. The mass flux values at the ‘stable operating
points’ were used in the boiling correlation by Kandlikar [61] to obtain the HTC values.
The heat transfer correlation is presented in the next section.
4.2 Heat Transfer Correlation
The boiling correlation by Kandlikar [61] was used to calculate the HTC for different mass
fluxes obtained from the pressure drop analysis. This boiling correlation was developed for
flow boiling systems but since a local flow boiling heat transfer is developed in the tapered
microgap, the correlation was used in this pool boiling study.

59
The boiling correlation used to predict the HTC is shown by Eq. (7), where ℎ𝑓 is the single-
phase heat transfer coefficient, 𝐶𝑜 is the convection number, 𝐵𝑜 is the boiling number, 𝐹𝑓
is the liquid dependent parameter, and 𝐶1 to 𝐶4 are the constants.
𝐻𝑇𝐶
ℎ𝑓= 𝐶1𝐶𝑜𝐶2 + 𝐶3𝐵𝑜𝐶4𝐹𝑓 (7)
The single-phase heat transfer coefficient, convection number, and boiling number were
calculated using the Eqs. (8 - 10).
ℎ𝑓 = 0.023𝑅𝑒𝑓0.8𝑃𝑟𝑓
0.4(𝑘𝑓 𝐷ℎ⁄ ) (8)
𝐶𝑜 = (1 − 𝑥
𝑥)
0.8
(𝜌𝑔
𝜌𝑓)
0.5
(9)
𝐵𝑜 = 𝑞"
𝐺ℎ𝑓𝑔 (10)
In the above equations, 𝑅𝑒𝑓 is the liquid Reynolds number, 𝑃𝑟𝑓 is the liquid Prandtl
number, 𝑘𝑓 is thermal conductivity of the liquid, 𝐷ℎis the hydraulic diameter, 𝜌𝑓 is liquid
density, 𝜌𝑔 is vapor density, ℎ𝑓𝑔 is latent heat of vaporization, 𝐺 is mass flux, and 𝑞" is the
heat flux.
The theoretical model was used for water, and HFE7000 as the working fluids. The
theoretical predictions form the pressure drop analysis is presented in the following section.
4.3 Results of Pressure Drop Analysis for Water
The theoretical pressure drop analysis, and mass flux estimation for water as the working
fluid are presented in this section. The calculations were performed for two different taper
angles (α) 10°, and 15° with 1.27 mm inlet gap height (hi). The bubble departure diameter

60
in pool boiling with water is ~ 2.5 mm, hence the inlet gap height was selected considering
the bubble squeezing mechanism near the inlet of the microgap.
The net pressure drop plots at different heat fluxes were obtained for 15°, and 10° taper
angles using homogeneous flow model. In Fig. 25 for 15° taper angle, the net pressure drop
(kPa) is shown along the Y-axis, and mass flux (kg/m2s) at the mid-section of the tapered
microgap is shown along the X-axis. The pressure drop curves were plotted for various
heat fluxes which are represented by different colored lines, these heat flux values were
obtained from the experimental study. The x-intercept of the pressure drop curves provide
the ‘stable operating points’ as shown by block dots. The ‘stable operating point’ is
obtained by balancing the pressure drop due to friction, momentum change, entrance-exit
losses by pressure recovery due to expanding cross-section. It is assumed that a stable two-
phase flow is achieved in the tapered microgap configuration when pressure drop is
balanced by the pressure recovery effect. The mass fluxes at the ‘stable operating points’
were obtained from the pressure drop analysis for heat fluxes, 101 W/cm2 to 287 W/cm2.
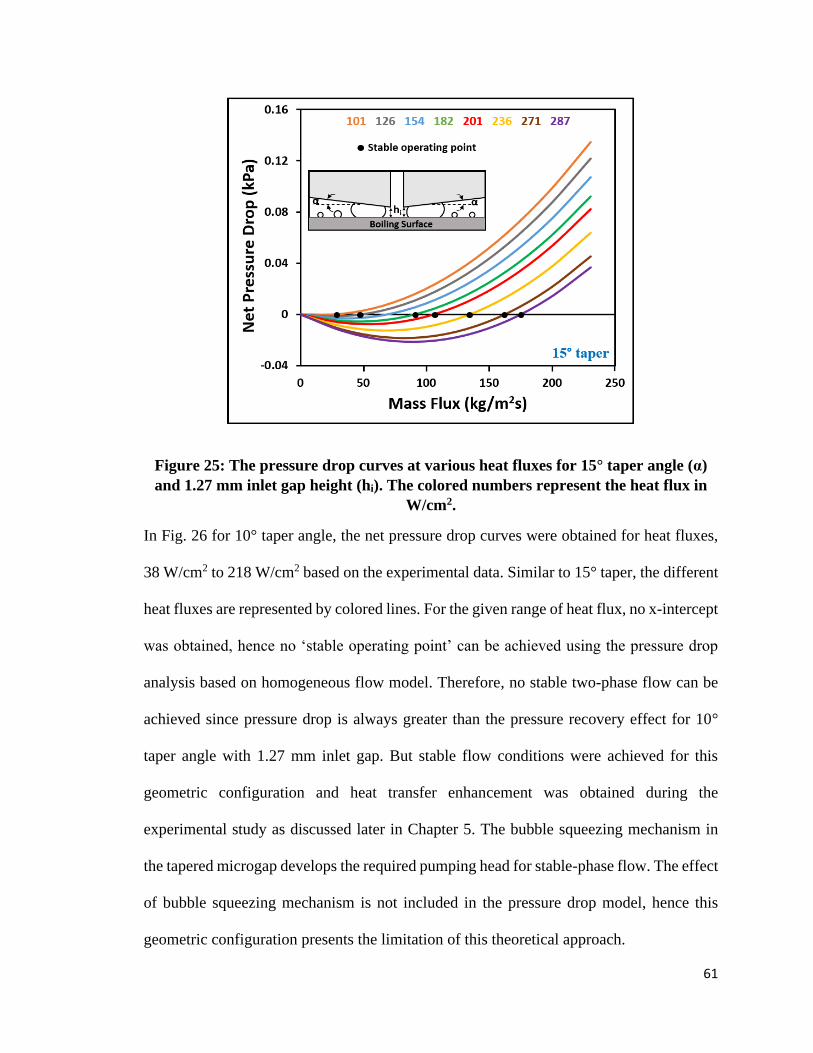
61
Figure 25: The pressure drop curves at various heat fluxes for 15° taper angle (α)
and 1.27 mm inlet gap height (hi). The colored numbers represent the heat flux in
W/cm2.
In Fig. 26 for 10° taper angle, the net pressure drop curves were obtained for heat fluxes,
38 W/cm2 to 218 W/cm2 based on the experimental data. Similar to 15° taper, the different
heat fluxes are represented by colored lines. For the given range of heat flux, no x-intercept
was obtained, hence no ‘stable operating point’ can be achieved using the pressure drop
analysis based on homogeneous flow model. Therefore, no stable two-phase flow can be
achieved since pressure drop is always greater than the pressure recovery effect for 10°
taper angle with 1.27 mm inlet gap. But stable flow conditions were achieved for this
geometric configuration and heat transfer enhancement was obtained during the
experimental study as discussed later in Chapter 5. The bubble squeezing mechanism in
the tapered microgap develops the required pumping head for stable-phase flow. The effect
of bubble squeezing mechanism is not included in the pressure drop model, hence this
geometric configuration presents the limitation of this theoretical approach.
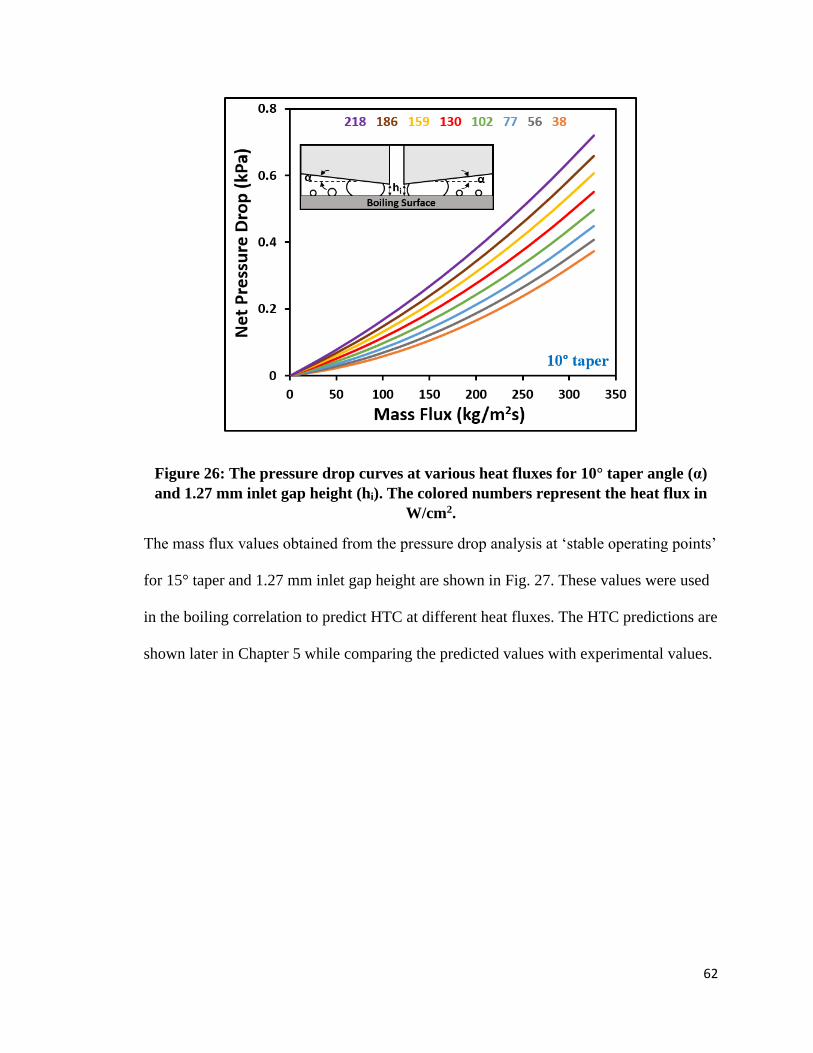
62
Figure 26: The pressure drop curves at various heat fluxes for 10° taper angle (α)
and 1.27 mm inlet gap height (hi). The colored numbers represent the heat flux in
W/cm2.
The mass flux values obtained from the pressure drop analysis at ‘stable operating points’
for 15° taper and 1.27 mm inlet gap height are shown in Fig. 27. These values were used
in the boiling correlation to predict HTC at different heat fluxes. The HTC predictions are
shown later in Chapter 5 while comparing the predicted values with experimental values.
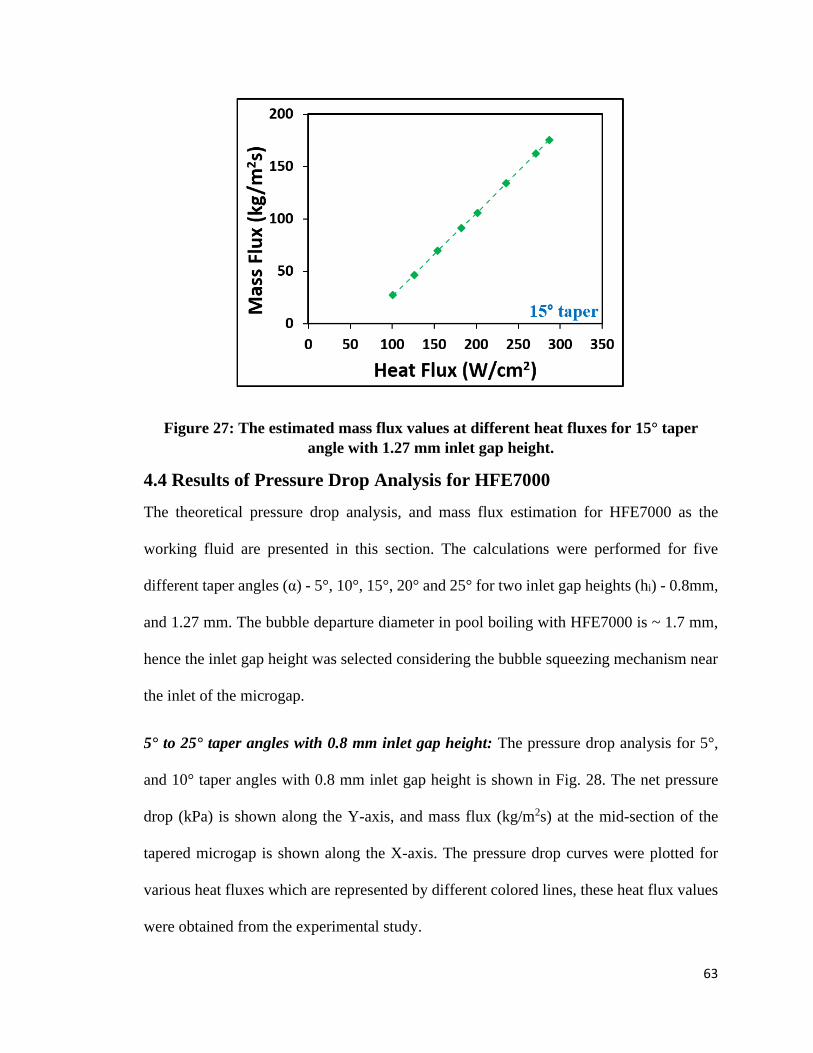
63
Figure 27: The estimated mass flux values at different heat fluxes for 15° taper
angle with 1.27 mm inlet gap height.
4.4 Results of Pressure Drop Analysis for HFE7000
The theoretical pressure drop analysis, and mass flux estimation for HFE7000 as the
working fluid are presented in this section. The calculations were performed for five
different taper angles (α) - 5°, 10°, 15°, 20° and 25° for two inlet gap heights (hi) - 0.8mm,
and 1.27 mm. The bubble departure diameter in pool boiling with HFE7000 is ~ 1.7 mm,
hence the inlet gap height was selected considering the bubble squeezing mechanism near
the inlet of the microgap.
5° to 25° taper angles with 0.8 mm inlet gap height: The pressure drop analysis for 5°,
and 10° taper angles with 0.8 mm inlet gap height is shown in Fig. 28. The net pressure
drop (kPa) is shown along the Y-axis, and mass flux (kg/m2s) at the mid-section of the
tapered microgap is shown along the X-axis. The pressure drop curves were plotted for
various heat fluxes which are represented by different colored lines, these heat flux values
were obtained from the experimental study.
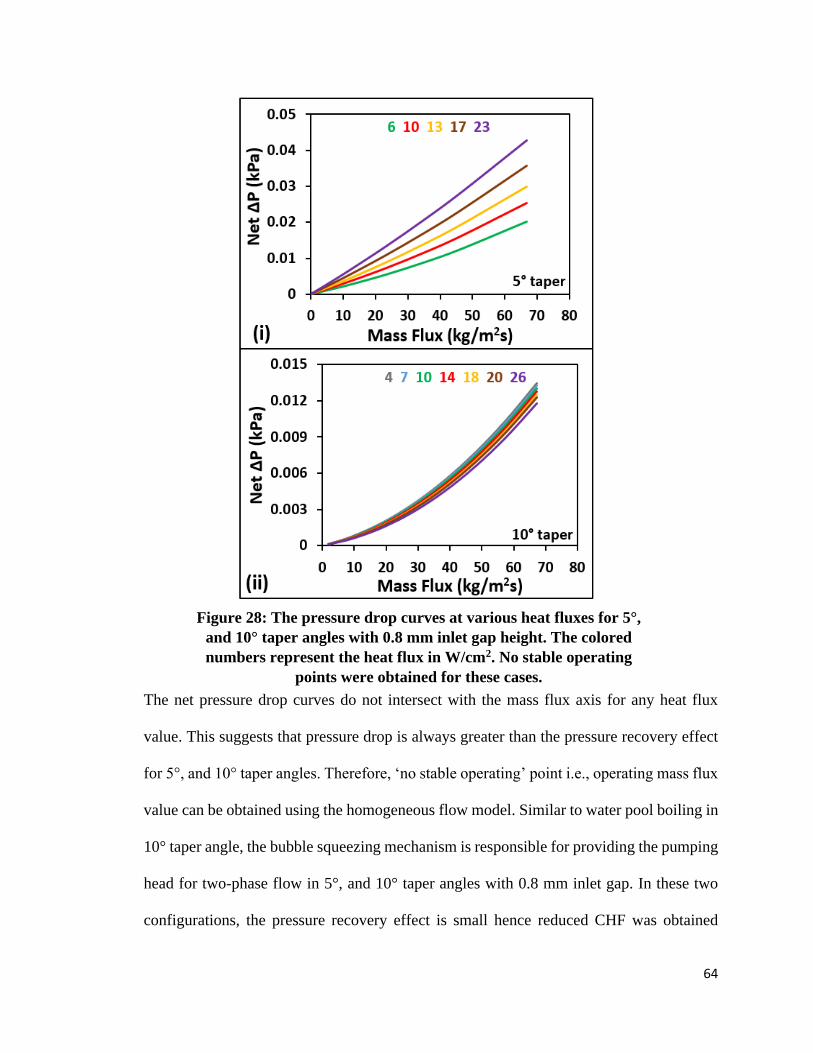
64
The net pressure drop curves do not intersect with the mass flux axis for any heat flux
value. This suggests that pressure drop is always greater than the pressure recovery effect
for 5°, and 10° taper angles. Therefore, ‘no stable operating’ point i.e., operating mass flux
value can be obtained using the homogeneous flow model. Similar to water pool boiling in
10° taper angle, the bubble squeezing mechanism is responsible for providing the pumping
head for two-phase flow in 5°, and 10° taper angles with 0.8 mm inlet gap. In these two
configurations, the pressure recovery effect is small hence reduced CHF was obtained
Figure 28: The pressure drop curves at various heat fluxes for 5°,
and 10° taper angles with 0.8 mm inlet gap height. The colored
numbers represent the heat flux in W/cm2. No stable operating
points were obtained for these cases.
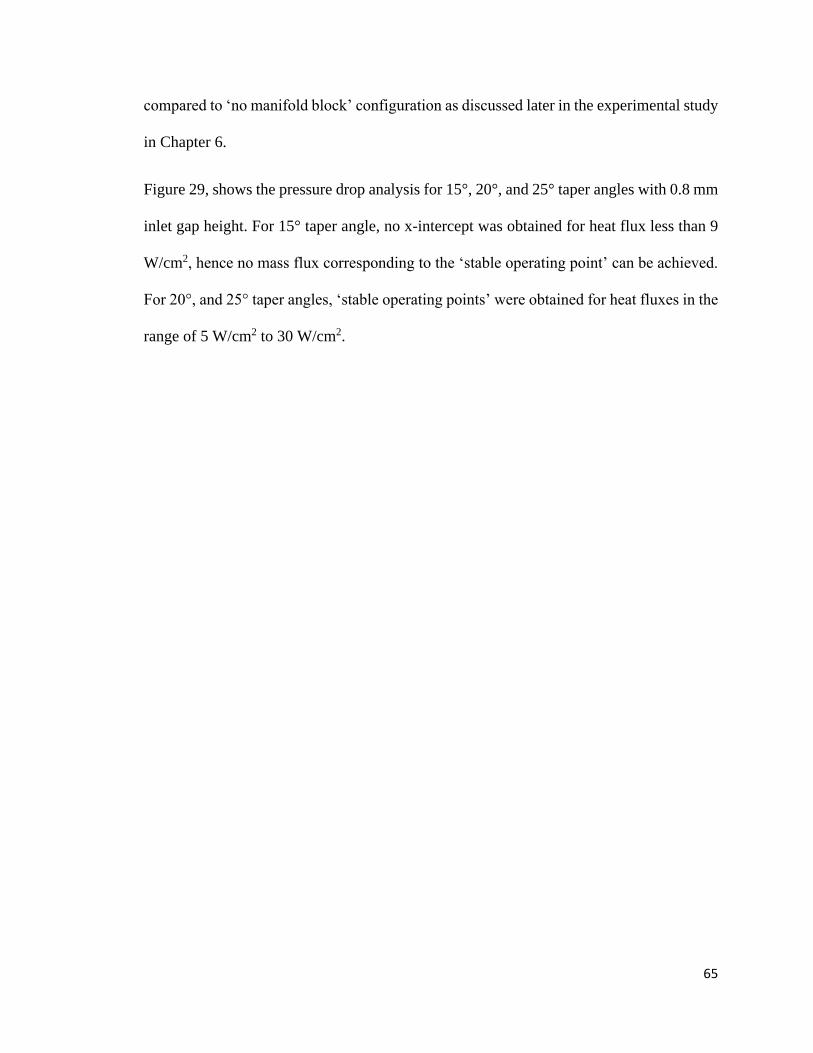
65
compared to ‘no manifold block’ configuration as discussed later in the experimental study
in Chapter 6.
Figure 29, shows the pressure drop analysis for 15°, 20°, and 25° taper angles with 0.8 mm
inlet gap height. For 15° taper angle, no x-intercept was obtained for heat flux less than 9
W/cm2, hence no mass flux corresponding to the ‘stable operating point’ can be achieved.
For 20°, and 25° taper angles, ‘stable operating points’ were obtained for heat fluxes in the
range of 5 W/cm2 to 30 W/cm2.
66
Figure 29: The pressure drop curves at various heat fluxes for 15°,
20°, and 25° taper angles with 0.8 mm inlet gap height. The colored
numbers represent the heat flux in W/cm2.

67
Figure 30: The pressure drop curves at various heat fluxes for 5°, 10°, and 15°
taper angles with 1.27 mm inlet gap height. The colored numbers represent the
heat flux in W/cm2. No stable operating points were obtained for these cases.
68
5° to 25° taper angles with 1.27 mm inlet gap height: The plots obtained from the pressure
drop analysis for 5°, 10°, and 15° taper angles with 1.27 mm inlet gap height are shown in
Fig. 30. Similar to previous representations, the net pressure drop (kPa) is shown along the
Y-axis, and mass flux (kg/m2s) at the mid-section of the tapered microgap is shown along
the X-axis. The different colored numbers in represent the heat flux (W/cm2) values
obtained from the experimental study. For 5°, 10°, and 15° taper angles, no x-intercept was
obtained hence no ‘stable operating point’ can be achieved based on the homogeneous flow
model. For these configurations, the pressure recovery effect along the flow domain is less
than the pressure drop, therefore reduced CHFs were obtained for these taper angles as
discussed later in the experimental study in Chapter 6.
Figure 31 shows the pressure drop analysis for 20°, and 25° taper angles. For 20° taper, the
‘stable operating points’ were not obtained for heat fluxes less than 24 W/cm2, and for 25°
taper, no ‘stable operating points’ were achieved for heat fluxes less than 15 W/cm2. At
low heat fluxes the pressure drop dominates over the pressure recovery effect, hence net
pressure drop is always greater than zero. The theoretical approach is based on
homogeneous flow model and does not include pumping effect of the bubble squeezing
mechanism, and at low heat fluxes the bubble squeezing mechanism significantly drives
the two-phase flow in the tapered microgap.

69
The mass fluxes obtained from the pressure drop analysis for various taper angles and inlet
gap heights are shown in Fig. 32. These values were used in the boiling correlation to
predict HTC at different heat fluxes. The HTC predictions are shown later in Chapter 6
while comparing the predicted values with experimental values.
Figure 31: The pressure drop curves at various heat fluxes for 20°, and
25° taper angles with 1.27 mm inlet gap height. The colored numbers
represent the heat flux in W/cm2.

70
Figure 32: The predicted mass flux values at 'stable operating points' for different
geometric configurations.
4.5 Major Outcomes of the Theoretical Analysis
The theoretical model based on homogeneous flow model and boiling heat transfer
correlation was developed to predict the two-phase flow characteristics - mass flux,
pressure recovery, net pressure drop, and the HTC for a tapered microgap in a pool boiling
system. The ‘stable operating points’ were obtained for various geometric configurations
and heat fluxes with water, and HFE7000 as the working fluids. The stable operating point
is obtained when pressure recovery balances the pressure drop, this denotes that stable two-
phase flow will be established in the microgap. It was observed that for smaller taper
angles, and low heat fluxes, pressure recovery is less than pressure drop hence no ‘stable
operating points’ were obtained. For such cases, bubble squeezing effect provides the
driving force for fluid flow as discussed later in Chapter 8. For HFE7000 with smaller taper
angles, reduced CHF values were recorded during the experimental study as discussed later
in Chapter 6 suggesting flow instabilities in the tapered microgap. This shows that pressure
71
recovery effect is critical in obtaining the enhanced heat dissipation performance. For cases
where pressure recovery was able to balance the pressure drops with sustained two-phase
flow, the HTC values were predicted and validated by comparing with experimental
findings shown later in Chapter 5 for water, and Chapter 6 for HFE7000.

72
Chapter 5
5.0 Pool Boiling Performance of Dual Tapered Manifold
with Water
In this study, a dual tapered manifold block was used on a plain copper surface with water
as the working fluid in a pool boiling system. An experimental study was conducted with
two different taper angles and enhancement in CHF and HTC was evaluated. The
experimental setup, experimental procedure, data reduction, heat transfer results, and
conclusion of the study are presented in this chapter.
5.1 Experimental Setup
The schematic of experimental setup used in the pool boiling study with water as the
working fluid is shown in Fig.33. The two main sub-assemblies in the setup are the boiling
test section contained in the water reservoir, and a copper heater block assembly. An
aluminum block was used as the reservoir to contain the saturated water, and the boiling
test section was fixed at the bottom face of the aluminum block. A cartridge heater was
immersed in the water to maintain saturation temperature throughout the study. A ceramic
chip holder was designed and fabricated to hold the copper test chip and minimize the heat
losses from the test chip. The edges of the test surface were covered by kapton tape to
project 10mm ⨯10mm area for the heat dissipation. A dual-tapered manifold block
containing the dual taper was secured over the plain copper chip and a steel plate of
thickness 1.27 mm was used between the manifold block and copper test chip to provide
desired inlet gap height. The manifold was machined from polysulfone material which has
a glass transition temperature of 185°C. Two different dual taper angles tested in this study
were - 10°, and 15°. The front and rear sides of the aluminum block were enclosed by high

73
temperature resistant borosilicate glass for clear visualization. Below the boiling test
section, a copper heater block containing four cartridge heaters (200 W each) was secured
in direct contact with the copper test chip. The cartridge heaters were connected to an
external dc power supply. The copper heater block consists an extended stem with cross
section 10 mm ⨯ 10 mm, matching the dimensions of copper test chip’s stem. The stem of
the copper heater block was enclosed by a ceramic sleeve to minimize the heat losses. Four
Figure 33: Schematic representations of (a) boiling test section with dual tapered
manifold block, and (b) pool boiling experimental setup with water. (Schematics are
not to scale)
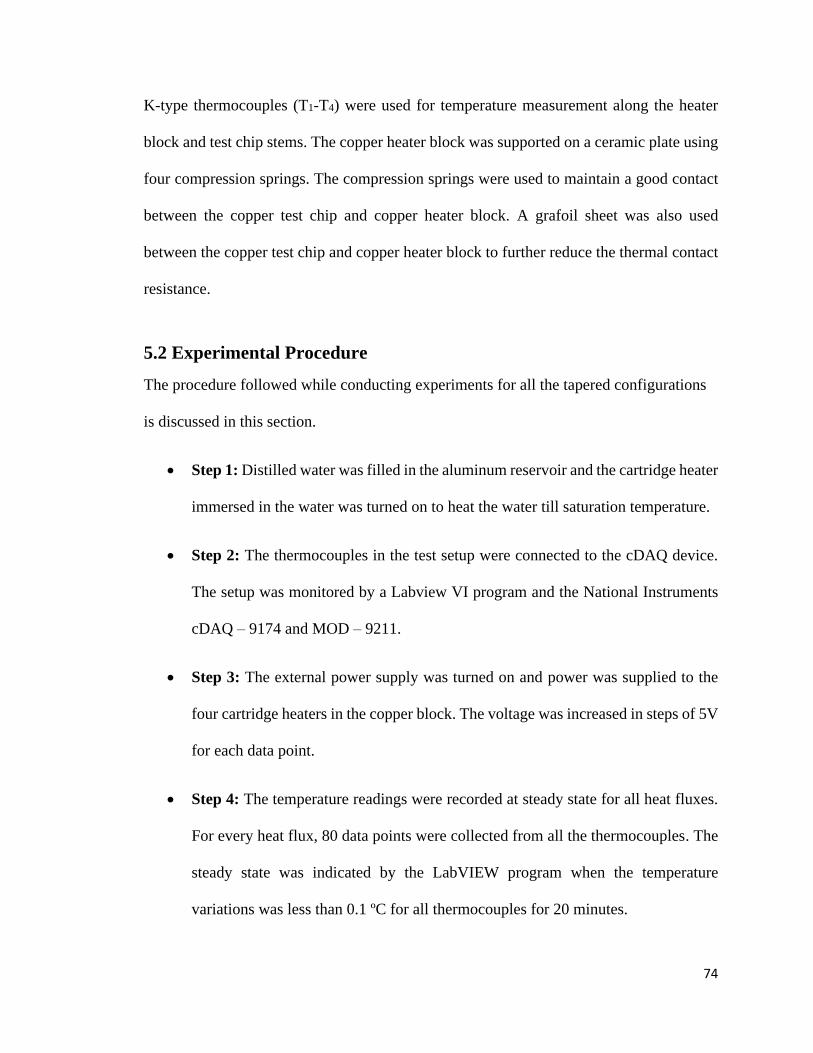
74
K-type thermocouples (T1-T4) were used for temperature measurement along the heater
block and test chip stems. The copper heater block was supported on a ceramic plate using
four compression springs. The compression springs were used to maintain a good contact
between the copper test chip and copper heater block. A grafoil sheet was also used
between the copper test chip and copper heater block to further reduce the thermal contact
resistance.
5.2 Experimental Procedure
The procedure followed while conducting experiments for all the tapered configurations
is discussed in this section.
• Step 1: Distilled water was filled in the aluminum reservoir and the cartridge heater
immersed in the water was turned on to heat the water till saturation temperature.
• Step 2: The thermocouples in the test setup were connected to the cDAQ device.
The setup was monitored by a Labview VI program and the National Instruments
cDAQ – 9174 and MOD – 9211.
• Step 3: The external power supply was turned on and power was supplied to the
four cartridge heaters in the copper block. The voltage was increased in steps of 5V
for each data point.
• Step 4: The temperature readings were recorded at steady state for all heat fluxes.
For every heat flux, 80 data points were collected from all the thermocouples. The
steady state was indicated by the LabVIEW program when the temperature
variations was less than 0.1 ºC for all thermocouples for 20 minutes.

75
• Step 5: The heat transfer parameters – heat flux, wall superheat, and HTC were
calculated as discussed in the following ‘data reduction’ section.
5.3 Data Reduction
The one-dimensional heat conduction in the copper heater assembly is shown in Fig.34.
The heat dissipation parameters - heat flux (q"), heat transfer coefficient (HTC) and, wall
superheat (ΔTsat) were calculated to evaluate the performance of dual-tapered manifold
block using the following equations.
The heat flux conducted through the copper column was calculated using Fourier’s law for
1D conduction:
q" = −kCudT/dx (11)
The temperature gradient (dT/dx) along the heater was calculated using Taylor’s three-
point backward difference formula, as shown by Eq.12.
dT
dx=
3T1 − 4T2 + T3
2Δx (12)
The temperature values were recorded using four K-type thermocouples (T1 to T4) as
shown in Fig.34. The heater block was insulated from all sides using a ceramic sleeve.
The spacing between successive thermocouples, T1 – T2, and T2 – T3 (Δx) was 5 mm. The
surface temperature (Ts) was then calculated using the temperature gradient (dT/dx), the
top thermocouple temperature (T4), and the distance between the top thermocouple and the
surface (x1), 7.1 mm.
Ts = T4 +dT
dxx1 (13)
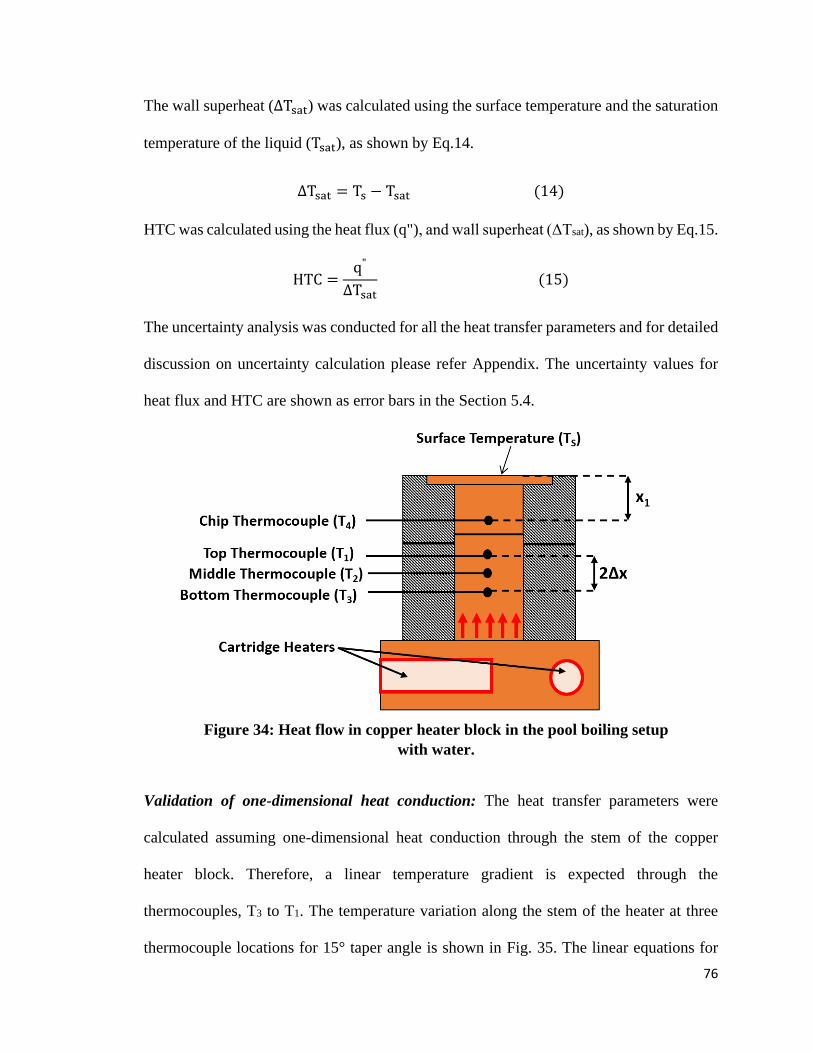
76
The wall superheat (∆Tsat) was calculated using the surface temperature and the saturation
temperature of the liquid (Tsat), as shown by Eq.14.
∆Tsat = Ts − Tsat (14)
HTC was calculated using the heat flux (q"), and wall superheat (ΔTsat), as shown by Eq.15.
HTC =qʺ
ΔTsat (15)
The uncertainty analysis was conducted for all the heat transfer parameters and for detailed
discussion on uncertainty calculation please refer Appendix. The uncertainty values for
heat flux and HTC are shown as error bars in the Section 5.4.
Validation of one-dimensional heat conduction: The heat transfer parameters were
calculated assuming one-dimensional heat conduction through the stem of the copper
heater block. Therefore, a linear temperature gradient is expected through the
thermocouples, T3 to T1. The temperature variation along the stem of the heater at three
thermocouple locations for 15° taper angle is shown in Fig. 35. The linear equations for
Figure 34: Heat flow in copper heater block in the pool boiling setup
with water.

77
different heat fluxes are shown in the plot, and the linear regressions (R2) for the heat fluxes
tends to 1. This proves the authenticity of the linear temperature profile and the one-
dimensional heat conduction. This assumption was validated for all the experimental
configurations by plotting the temperature variation at equidistant thermocouple locations
along the heater stem.
5.4 Experimental Results for Enhancement on Plain Surface
The effect of taper angle on heat flux dissipation, and HTC was evaluated in this study.
The performance plots showing the variation in heat flux with respect to wall superheat,
and HTC with respect to heat flux are presented in this section.
5.4.1 Effect of Taper Angle on Critical Heat Flux (CHF)
The pool boiling curves showing the variation in heat flux (W/cm2) with respect to wall
superheat (°C) are shown in Fig.36. The units W/cm2 are used for heat flux to follow the
convention used in electronics cooling application. The heat dissipation performances of
the dual-tapered manifolds with 10° and 15° taper angles are compared with the ‘no
Figure 35: The temperature variation at different heat fluxes along the copper heater
block for 15° dual taper angle.

78
manifold block’ baseline configuration, where no manifold block was placed on the top of
plain copper surface. Both dual tapered manifold blocks dissipate higher heat fluxes
compared to the ‘no manifold block’ configuration for all wall superheats. The highest
CHF achieved was 288 W/cm2 for 15° angle at a wall superheat of 24.1°C. The CHF
obtained for the 10° angle was 218 W/cm2 at a wall superheat of 20.5°C. The ‘no manifold
block’ configuration resulted in a CHF of 124 W/cm2 at a wall superheat of 23.8°C. A 2.3X
enhancement in CHF was obtained with 15° dual taper compared to ‘no manifold block’
configuration.
5.4.2 Effect of Taper Angle on Heat Transfer Coefficient (HTC)
The variation in HTC (kW/m2°C) at different heat fluxes (W/cm2) for 15° dual taper, 10°
dual taper, and ‘no manifold block’ baseline configuration are shown in Fig.37. The
manifold block for both-10° and 15° dual taper angles achieved higher HTC values for all
Figure 36: Pool boiling curves showing the performance of 10°
and 15° dual taper angle and comparison with 'no manifold
block' configuration.
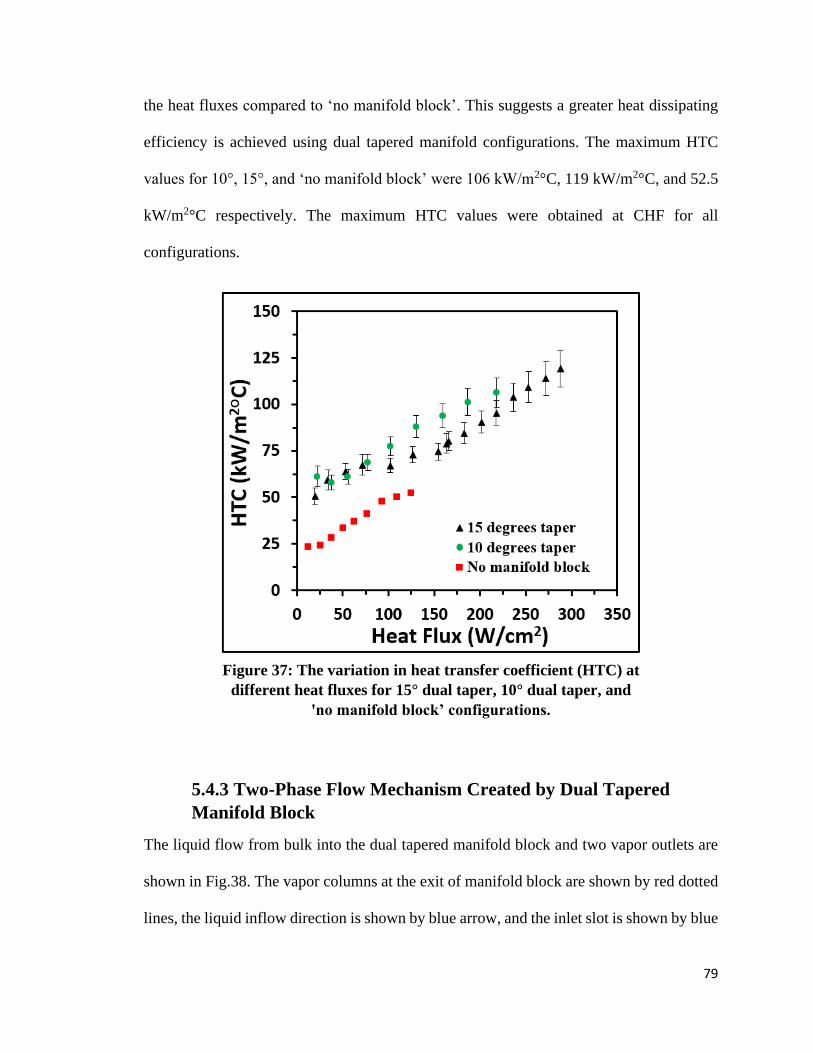
79
the heat fluxes compared to ‘no manifold block’. This suggests a greater heat dissipating
efficiency is achieved using dual tapered manifold configurations. The maximum HTC
values for 10°, 15°, and ‘no manifold block’ were 106 kW/m2°C, 119 kW/m2°C, and 52.5
kW/m2°C respectively. The maximum HTC values were obtained at CHF for all
configurations.
5.4.3 Two-Phase Flow Mechanism Created by Dual Tapered
Manifold Block
The liquid flow from bulk into the dual tapered manifold block and two vapor outlets are
shown in Fig.38. The vapor columns at the exit of manifold block are shown by red dotted
lines, the liquid inflow direction is shown by blue arrow, and the inlet slot is shown by blue
Figure 37: The variation in heat transfer coefficient (HTC) at
different heat fluxes for 15° dual taper, 10° dual taper, and
'no manifold block’ configurations.
80
dashed lines. The image was captured during the experimental study at 140 W/cm2 for 15°
taper angle. A stable liquid inflow and vapor outflow mechanism was observed at high heat
fluxes, thus showing efficient working of the dual taper design at high heat load conditions.
In the tapered microgap region, the bubble squeezing mechanism provides the liquid
pumping effect on the heating surface thus developing continuous surface rewetting
mechanism in the microgap. And the pressure recovery along the taper due to continuous
increase in cross-section area helps in achieving reduced pressure drops, therefore the
pumping action provided by the bubble squeezing mechanism is able to establish stable
two-phase flow in the tapered region. This transforms a pool boiling system into a local
flow boiling system since higher fluid velocities are achieved using tapered microgap
design compared to conventional pool boiling systems, and enhanced CHF and HTC values
are obtained. A detailed analysis on bubble squeezing mechanism and interface velocities
is presented later in Chapter 8.
Figure 38: The image showing the establishment of two vapor columns with a
central liquid inlet at 140 W/cm2 for 15° dual tapered manifold block.

81
5.5 Theoretical HTC Results and Experimental Validation
The estimated mass flux values were used in the boiling heat transfer correlation by
Kandlikar [61] to predict the HTC values at different heat fluxes as discussed earlier in
Chapter 4. The predicted HTC values and the comparison with experimental results is
shown in Fig. 39. It was observed that the theoretical model underpredicts the HTC values
for all the heat fluxes. The theoretical model does not include the effect of bubble squeezing
mechanism, hence the additional mass flux established in the tapered microgap due to the
pumping head provided by bubble squeezing is not included in the estimated mass flux
values. This concludes that bubble squeezing mechanism is critical for 15° taper angle with
1.27 mm inlet gap height for the range of heat fluxes, 101 W/cm2 to 287 W/cm2.
Figure 39: The predicted HTC values and the comparison with experimental results.
Table 2 shows the estimated mass flux, predicted HTC values, experimental HTC values,
and the percentage deviation in the theoretical and experimental results. The deviation
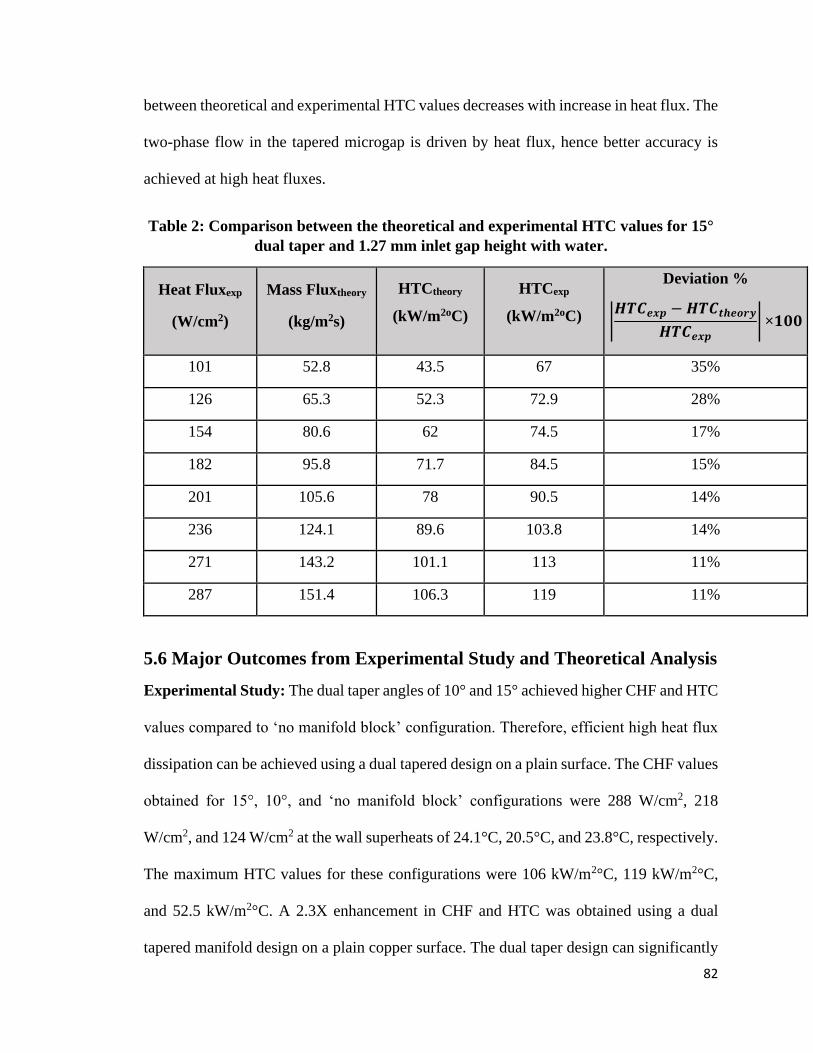
82
between theoretical and experimental HTC values decreases with increase in heat flux. The
two-phase flow in the tapered microgap is driven by heat flux, hence better accuracy is
achieved at high heat fluxes.
Table 2: Comparison between the theoretical and experimental HTC values for 15°
dual taper and 1.27 mm inlet gap height with water.
Heat Fluxexp
(W/cm2)
Mass Fluxtheory
(kg/m2s)
HTCtheory
(kW/m2oC)
HTCexp
(kW/m2oC)
Deviation %
|𝑯𝑻𝑪𝒆𝒙𝒑 − 𝑯𝑻𝑪𝒕𝒉𝒆𝒐𝒓𝒚
𝑯𝑻𝑪𝒆𝒙𝒑| ×𝟏𝟎𝟎
101 52.8 43.5 67 35%
126 65.3 52.3 72.9 28%
154 80.6 62 74.5 17%
182 95.8 71.7 84.5 15%
201 105.6 78 90.5 14%
236 124.1 89.6 103.8 14%
271 143.2 101.1 113 11%
287 151.4 106.3 119 11%
5.6 Major Outcomes from Experimental Study and Theoretical Analysis
Experimental Study: The dual taper angles of 10° and 15° achieved higher CHF and HTC
values compared to ‘no manifold block’ configuration. Therefore, efficient high heat flux
dissipation can be achieved using a dual tapered design on a plain surface. The CHF values
obtained for 15°, 10°, and ‘no manifold block’ configurations were 288 W/cm2, 218
W/cm2, and 124 W/cm2 at the wall superheats of 24.1°C, 20.5°C, and 23.8°C, respectively.
The maximum HTC values for these configurations were 106 kW/m2°C, 119 kW/m2°C,
and 52.5 kW/m2°C. A 2.3X enhancement in CHF and HTC was obtained using a dual
tapered manifold design on a plain copper surface. The dual taper design can significantly

83
improve the performance of a plain surface and expensive surface enhancement techniques
such as microporous coatings, and nano-microstructures are not required.
A stable two-phase flow mechanism was observed in the dual tapered manifold
configuration at high heat fluxes. This shows the efficiency of bubble squeezing and
pressure recovery mechanism at high heat flux conditions. The high fluid velocities
established in tapered microgap region develops a local flow boiling mechanism in the pool
boiling system, hence significantly enhanced heat transfer performance can be achieved.
Theoretical Analysis: The model could not predict HTCs for 10° taper angle due to limited
pressure recovery effect that was unable to provide a sustained two-phase flow as discussed
earlier in Chapter 4. For 15° taper angle, the HTC values were predicted and validated by
comparing with the experimental findings. The deviation between theoretical and
experimental HTC values decreases with increasing heat flux and minimum deviation
value was 11% near CHF. The fluid flow in tapered microgap is driven by heat flux hence
the accuracy of theoretical model improves at higher heat fluxes.

84
Chapter 6
6.0 Pool Boiling Performance of Dual Tapered Manifold
with HFE7000
In this study, a dual tapered manifold block was used on a plain copper surface with
HFE7000 as the working fluid in a pool boiling system. An experimental study was
conducted with five different taper angles (5°, 10°, 15°, 20°, 25°) and two inlet gap heights
(0.8mm, 1.27mm). The heat transfer enhancement was evaluated for different
configurations. The experimental setup, experimental procedure, data reduction, heat
transfer results, and conclusion of the study are discussed in this chapter.
6.1 Experimental Setup
The closed loop experimental setup for dielectric liquid with the boiling test section used
in this study is shown in Fig. 40. The setup consists of a fluid chamber with a boiling test
section test section, a condenser coil, and a heater block assembly underneath the test
section. The fluid chamber was built using a mild steel cylinder with a visualization
window. The boiling test section at the bottom wall of the chamber contains a plain copper
test chip, garolite chip holder, steel spacer, and a dual tapered manifold block. The garolite
chip holder was designed and fabricated to minimize the heat losses from the stem of the
copper test chip. The dual tapered manifold block was secured over the test chip, and the
steel spacer was placed between the manifold block and the test chip to develop the desired
inlet gap height. The boiling surface (10 mm × 10 mm) was exposed to the working fluid
by covering the edges of the test chip with kapton tape. The working liquid was maintained
at saturation using a cartridge heater which was fixed adjacent to the test section,
completely immersed in the liquid. The saturation state of the liquid was recorded using a
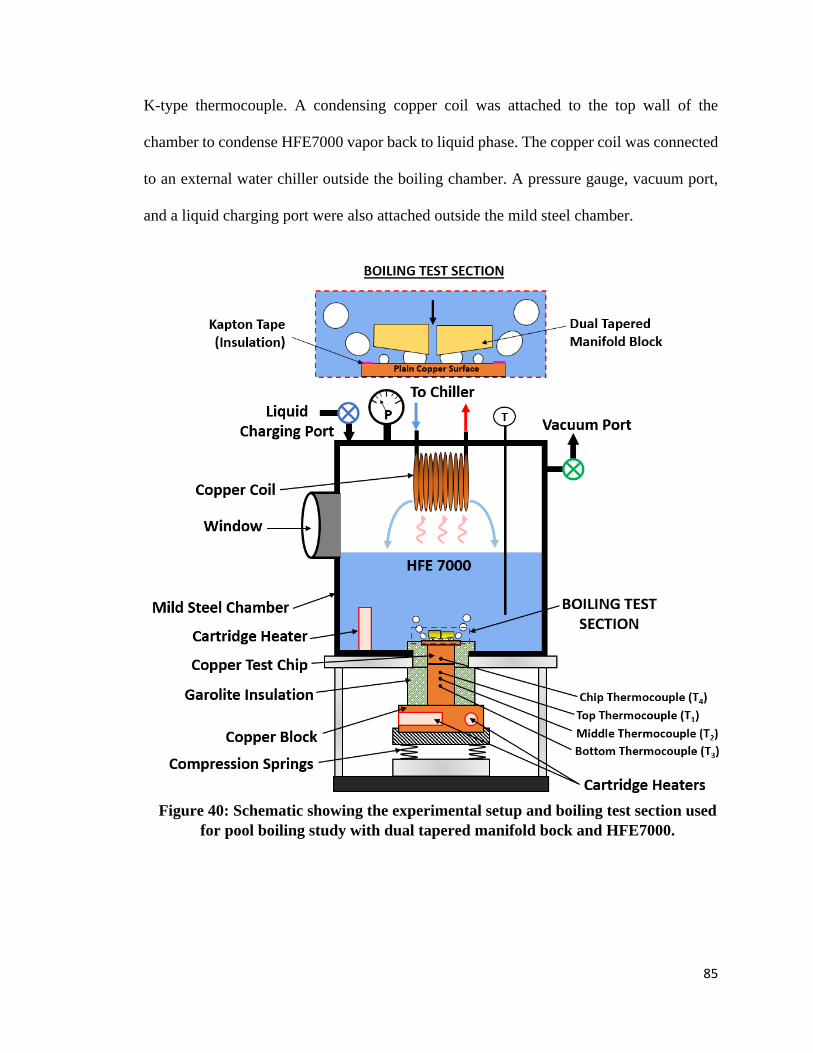
85
K-type thermocouple. A condensing copper coil was attached to the top wall of the
chamber to condense HFE7000 vapor back to liquid phase. The copper coil was connected
to an external water chiller outside the boiling chamber. A pressure gauge, vacuum port,
and a liquid charging port were also attached outside the mild steel chamber.
Figure 40: Schematic showing the experimental setup and boiling test section used
for pool boiling study with dual tapered manifold bock and HFE7000.
86
A heater block assembly was placed underneath the test section to supply heat to the copper
chip in the test section. The assembly consists of a copper heater block, a garolite insulation
sleeve, four cartridge heaters (200W each), and four compressed springs on a fixed
platform. The cartridge heaters were connected to an external dc power supply and were
used to heat the copper block. The compressed springs were used to push the heater block
assembly against the fixed boiling chamber. This developed an effective contact between
the copper heater block and the test chip. To further reduce the contact resistance, a grafoil
sheet was used between the heater block and the test chip. Three K-type thermocouples
were inserted in the copper heater block, and the recorded temperatures were used to
calculate the performance parameters.
6.2 Experimental Procedure
The procedure followed while conducting experiments for all the tapered configurations
is discussed in this section.
• Step 1: The experimental test setup was assembled on a benchtop and the working
liquid (HFE7000) was charged in the system through the liquid charging port.
• Step 2: A vacuum pump was attached to the vacuum port in the steel chamber, and
15 psi vacuum was created in the setup. Since the presence of air in the chamber
reduces the efficiency of copper coil, vacuum was created to eliminate the existing
air from the chamber.
• Step 3: The dc power supply was turned on and power was supplied to the cartridge
heaters in the copper heater block. The cartridge heater in the steel chamber was
87
turned on to maintain the bulk working liquid at its saturation temperature of 34°C at
1 atm.
• Step 4: The external water chiller was turned on to maintain the system pressure at 1
atm. Onset of nucleate boiling was confirmed through the visualization window
attached in the test chamber.
• Step 5: The voltage in the supper supply was increased in the steps of 2V to 5V, and
temperature readings from all thermocouples were recorded at steady state through a
LabVIEW program. The steady state was confirmed when the temperature variation
for all thermocouples (T1-T4) was less than 0.1°C over a period of 25 minutes.
• Step 6: The chiller water temperature and power supply to cartridge heater in the
working liquid were adjusted to maintain liquid at saturation temperature and an
absolute pressure of 1 atm.
The temperature data was recorded for different heat fluxes until CHF was achieved for
each configuration.
6.3 Data Reduction
The data reduction methodology adopted for this study is similar to the data reduction
performed in Chapter 5. The heat transfer parameters - heat flux (q"), boiling surface
temperature (Ts), wall superheat (∆𝑇𝑠𝑎𝑡), and HTC were calculated from the temperature
recordings from the various thermocouples in the test setup. Similar data reduction
approach was adopted in previous pool boiling studies [64–66]. The heat transfer
equations, Eqs. (11 – 15) were used to calculate all the performance parameters. As shown
in Fig.41, the values of Δx and x1 parameters were 5 mm and 7.1 mm, respectively.
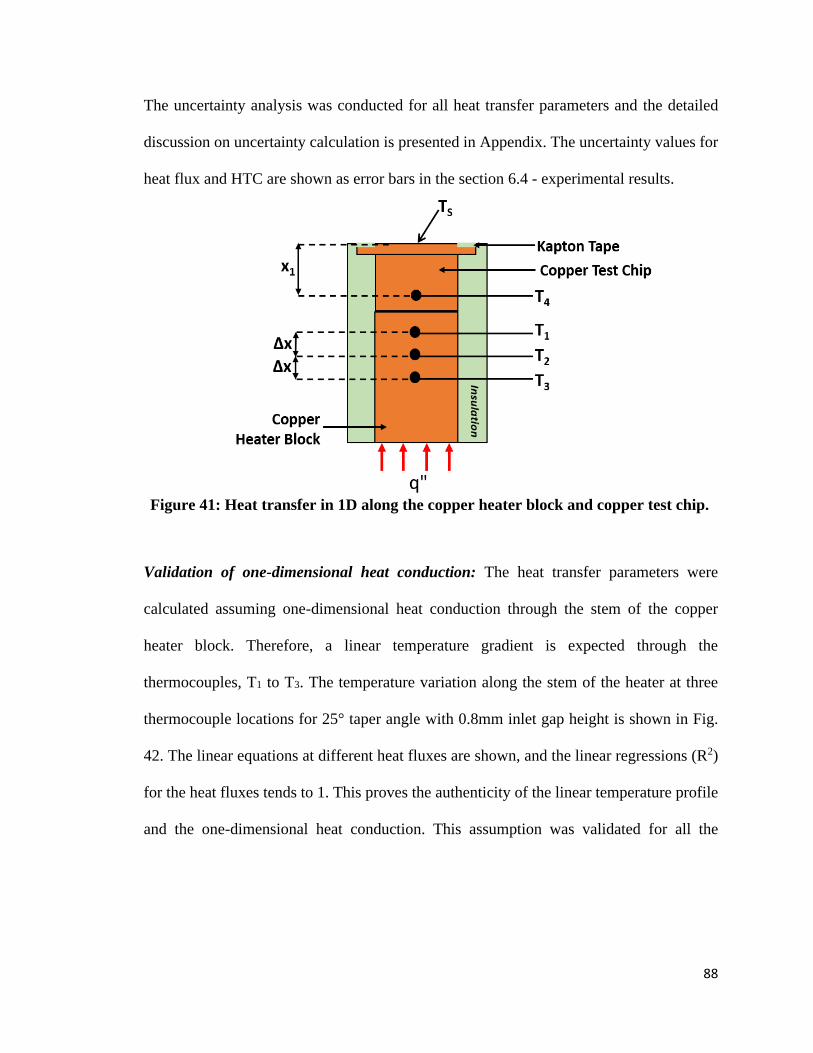
88
The uncertainty analysis was conducted for all heat transfer parameters and the detailed
discussion on uncertainty calculation is presented in Appendix. The uncertainty values for
heat flux and HTC are shown as error bars in the section 6.4 - experimental results.
Validation of one-dimensional heat conduction: The heat transfer parameters were
calculated assuming one-dimensional heat conduction through the stem of the copper
heater block. Therefore, a linear temperature gradient is expected through the
thermocouples, T1 to T3. The temperature variation along the stem of the heater at three
thermocouple locations for 25° taper angle with 0.8mm inlet gap height is shown in Fig.
42. The linear equations at different heat fluxes are shown, and the linear regressions (R2)
for the heat fluxes tends to 1. This proves the authenticity of the linear temperature profile
and the one-dimensional heat conduction. This assumption was validated for all the
Figure 41: Heat transfer in 1D along the copper heater block and copper test chip.
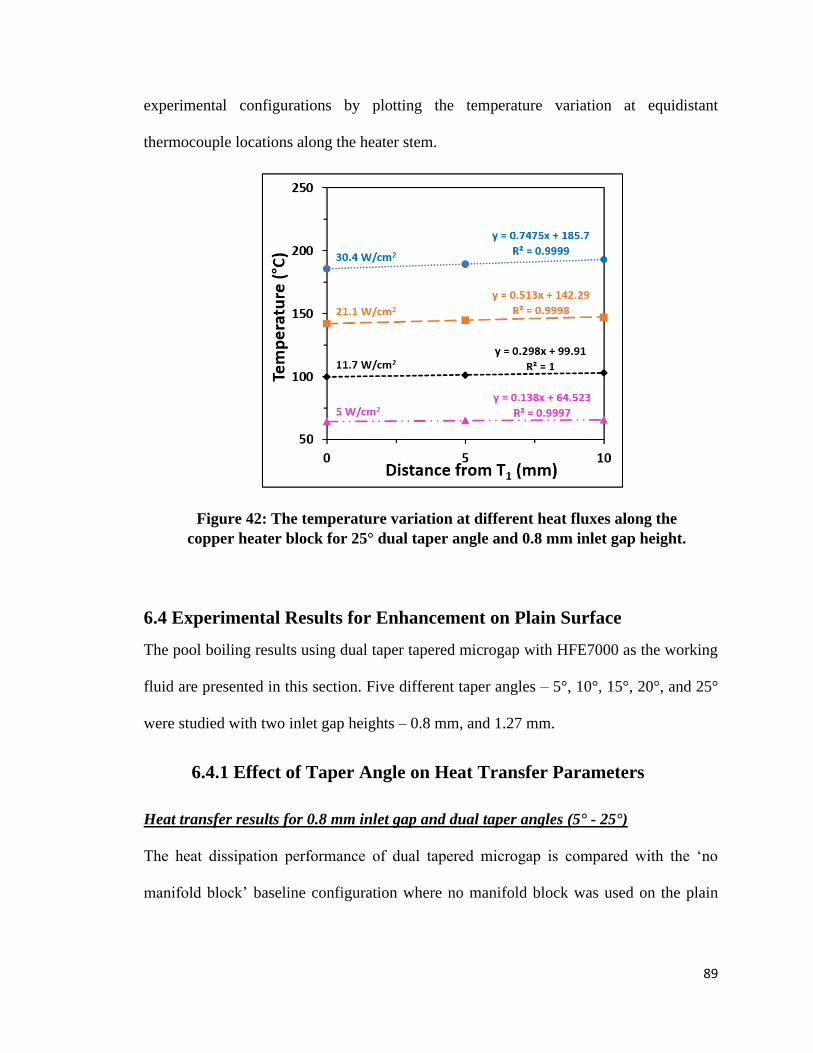
89
experimental configurations by plotting the temperature variation at equidistant
thermocouple locations along the heater stem.
6.4 Experimental Results for Enhancement on Plain Surface
The pool boiling results using dual taper tapered microgap with HFE7000 as the working
fluid are presented in this section. Five different taper angles – 5°, 10°, 15°, 20°, and 25°
were studied with two inlet gap heights – 0.8 mm, and 1.27 mm.
6.4.1 Effect of Taper Angle on Heat Transfer Parameters
Heat transfer results for 0.8 mm inlet gap and dual taper angles (5° - 25°)
The heat dissipation performance of dual tapered microgap is compared with the ‘no
manifold block’ baseline configuration where no manifold block was used on the plain
Figure 42: The temperature variation at different heat fluxes along the
copper heater block for 25° dual taper angle and 0.8 mm inlet gap height.
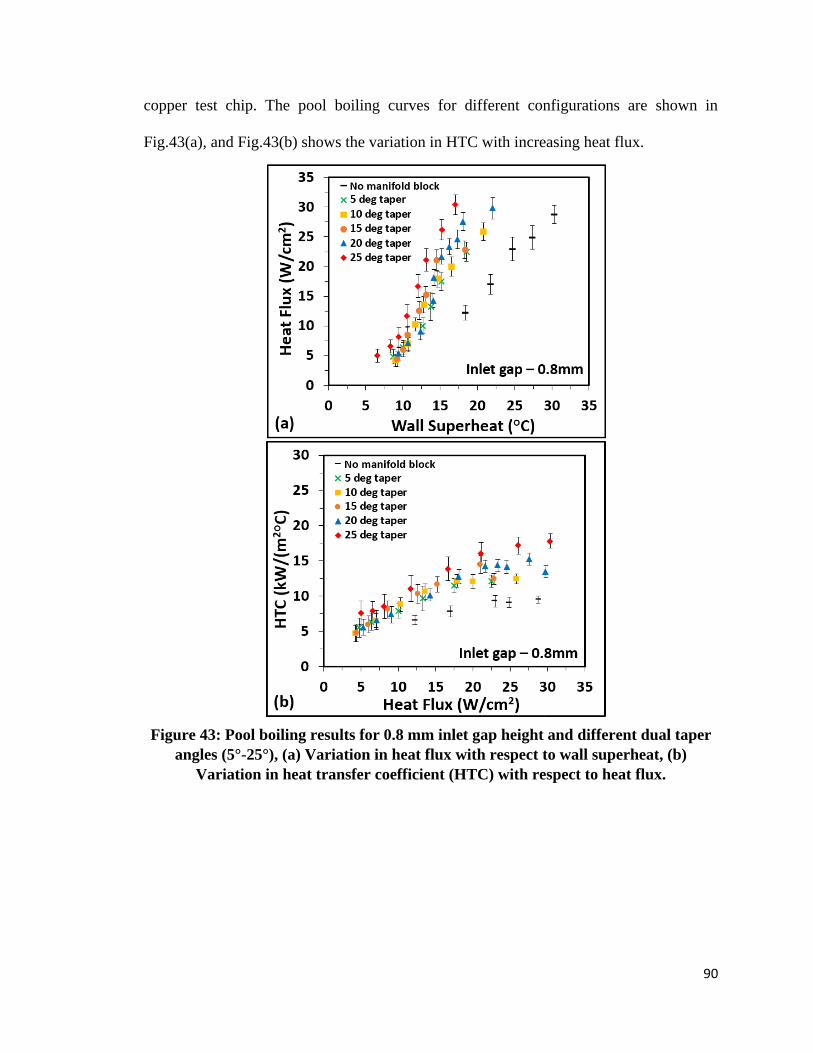
90
copper test chip. The pool boiling curves for different configurations are shown in
Fig.43(a), and Fig.43(b) shows the variation in HTC with increasing heat flux.
Figure 43: Pool boiling results for 0.8 mm inlet gap height and different dual taper
angles (5°-25°), (a) Variation in heat flux with respect to wall superheat, (b)
Variation in heat transfer coefficient (HTC) with respect to heat flux.

91
The maximum CHF and HTC were obtained for 25° dual taper angle. The highest CHF
and HTC values achieved were 30.4 W/cm2 and 17.8 kW/(m2°C) respectively at a wall
superheat of 17°C. The CHF and HTC values obtained for ‘no manifold block’
configuration were 28.8 W/cm2 and 9.5 kW/m2°C. Approximately, 2X enhancement was
observed in the HTC using 25° taper angle; this proves high heat dissipating efficiency can
be achieved using dual tapered microgap. For all the dual taper angles, higher HTCs were
obtained compared to ‘no manifold block’ configuration. For 5°, 10°, and 15° taper angles,
a reduction in CHF was observed, whereas for 20°, and 25° taper angles similar CHF was
obtained compared to ‘no manifold block’ configuration. The CHF and maximum HTC
values for all taper angles with 0.8 mm gap and ‘no manifold block’ configuration are
shown in Table 3.
Table 3: Pool boiling results for 0.8 mm inlet gap and different dual taper angles
with HFE7000.
Taper Angle HTC (kW/m2°C) ΔTsat (°C) CHF (W/cm2)
No manifold block 9.5 30.3 28.8
5° 12.1 18.5 22.5
10° 12.4 20.8 25.9
15° 12.4 18.3 22.8
20° 13.5 22 29.8
25° 17.8 17 30.4
Heat transfer results for 1.27 mm inlet gap and dual taper angles (5° - 25°)
Figure 44 shows the effect of different taper angles for 1.27 mm inlet gap height. The pool
boiling performance of dual tapered manifold is compared with the ‘no manifold block’
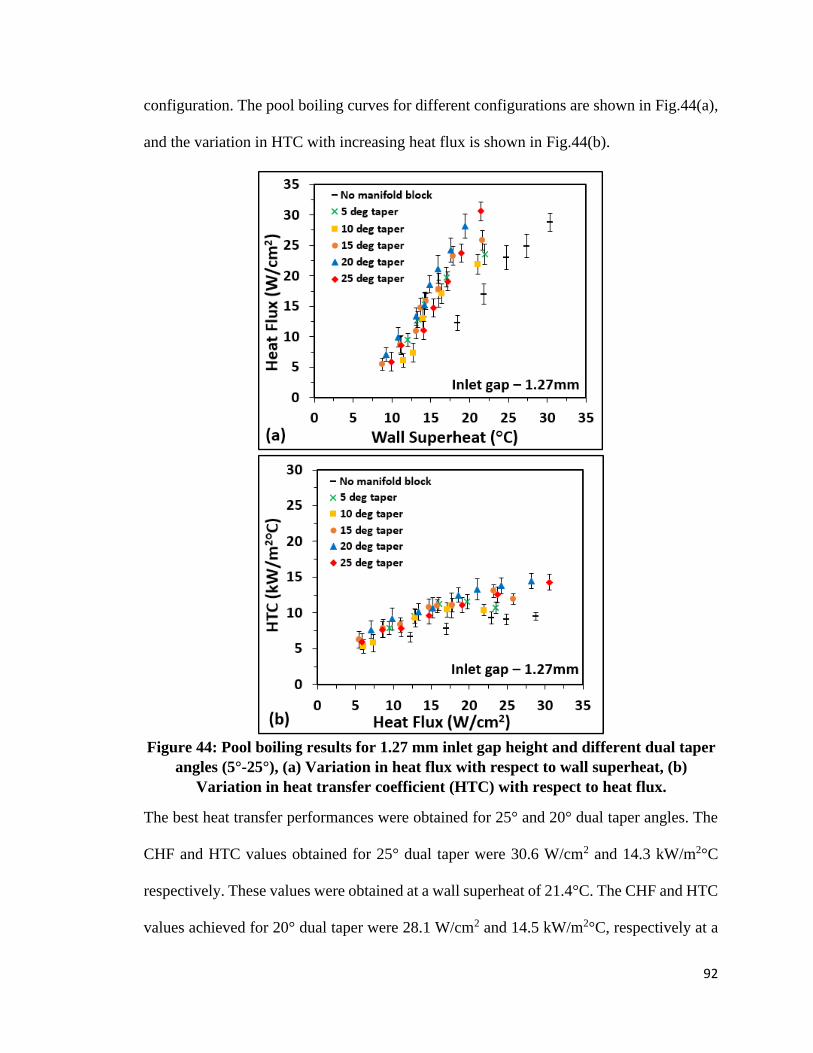
92
configuration. The pool boiling curves for different configurations are shown in Fig.44(a),
and the variation in HTC with increasing heat flux is shown in Fig.44(b).
The best heat transfer performances were obtained for 25° and 20° dual taper angles. The
CHF and HTC values obtained for 25° dual taper were 30.6 W/cm2 and 14.3 kW/m2°C
respectively. These values were obtained at a wall superheat of 21.4°C. The CHF and HTC
values achieved for 20° dual taper were 28.1 W/cm2 and 14.5 kW/m2°C, respectively at a
Figure 44: Pool boiling results for 1.27 mm inlet gap height and different dual taper
angles (5°-25°), (a) Variation in heat flux with respect to wall superheat, (b)
Variation in heat transfer coefficient (HTC) with respect to heat flux.
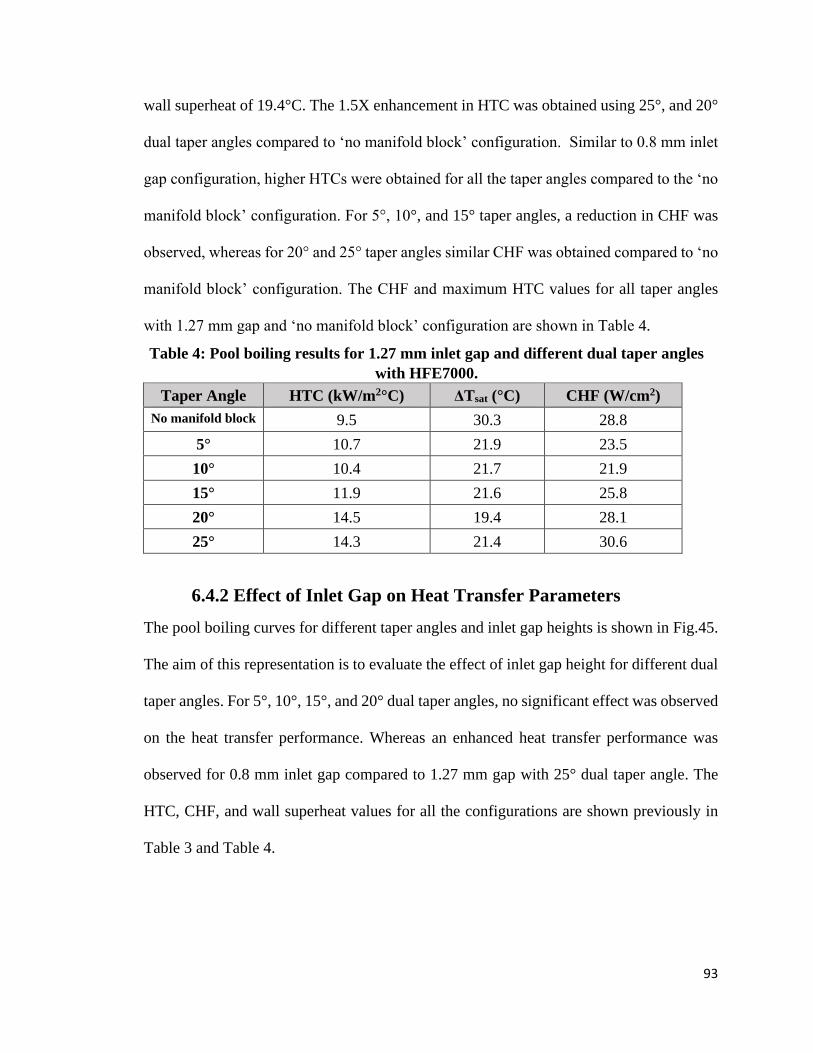
93
wall superheat of 19.4°C. The 1.5X enhancement in HTC was obtained using 25°, and 20°
dual taper angles compared to ‘no manifold block’ configuration. Similar to 0.8 mm inlet
gap configuration, higher HTCs were obtained for all the taper angles compared to the ‘no
manifold block’ configuration. For 5°, 10°, and 15° taper angles, a reduction in CHF was
observed, whereas for 20° and 25° taper angles similar CHF was obtained compared to ‘no
manifold block’ configuration. The CHF and maximum HTC values for all taper angles
with 1.27 mm gap and ‘no manifold block’ configuration are shown in Table 4.
Taper Angle HTC (kW/m2°C) ΔTsat (°C) CHF (W/cm2)
No manifold block 9.5 30.3 28.8
5° 10.7 21.9 23.5
10° 10.4 21.7 21.9
15° 11.9 21.6 25.8
20° 14.5 19.4 28.1
25° 14.3 21.4 30.6
6.4.2 Effect of Inlet Gap on Heat Transfer Parameters
The pool boiling curves for different taper angles and inlet gap heights is shown in Fig.45.
The aim of this representation is to evaluate the effect of inlet gap height for different dual
taper angles. For 5°, 10°, 15°, and 20° dual taper angles, no significant effect was observed
on the heat transfer performance. Whereas an enhanced heat transfer performance was
observed for 0.8 mm inlet gap compared to 1.27 mm gap with 25° dual taper angle. The
HTC, CHF, and wall superheat values for all the configurations are shown previously in
Table 3 and Table 4.
Table 4: Pool boiling results for 1.27 mm inlet gap and different dual taper angles
with HFE7000.
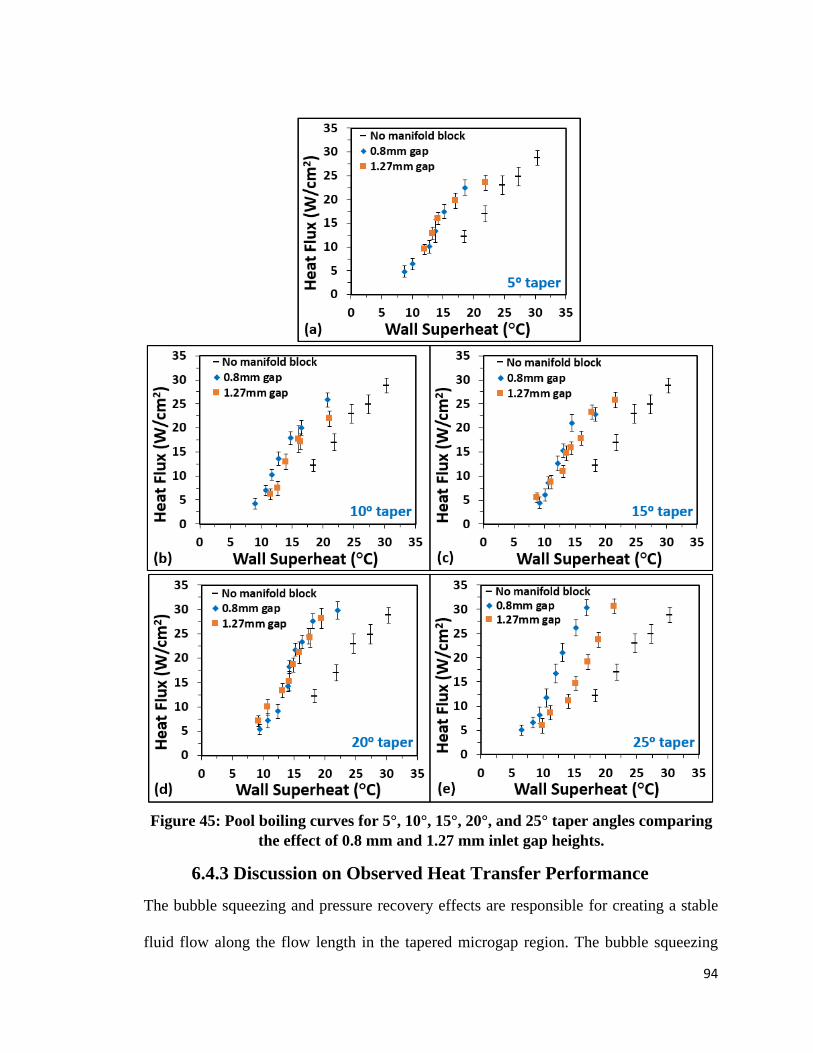
94
6.4.3 Discussion on Observed Heat Transfer Performance
The bubble squeezing and pressure recovery effects are responsible for creating a stable
fluid flow along the flow length in the tapered microgap region. The bubble squeezing
Figure 45: Pool boiling curves for 5°, 10°, 15°, 20°, and 25° taper angles comparing
the effect of 0.8 mm and 1.27 mm inlet gap heights.
95
mechanism is discussed in detail in Chapter 8 and the schematic showing the bubble
squeezing process was shown earlier in Fig.23 in Chapter 3. As the squeezed bubble leaves
the tapered microgap region and it creates liquid pumping effect from the bulk into the
microgap. The pressure recovery effect due to expanding cross-section helps in reducing
the total pressure drop thus improving the flow stability with low pumping power
requirement. A detailed discussion on the pressure recovery and total pressure drop was
discussed in Chapter 4. For the dielectric liquid (HFE7000) in this study, enhanced HTCs
were obtained but no improvement in CHF was achieved. At higher heat fluxes, large vapor
films are developed near the heater surface due to high bubble nucleation frequency and
bubble coalescence causing poor heat transfer. An effective removal of vapor lumps and
liquid resupply is essential to obtain high CHF and HTC values. Further study is
recommended to improve the CHF values with smaller inlet gap heights less than 0.8 mm.
6.5 Theoretical HTC Results and Experimental Validation
The HTC values were predicted for 15°, 20°, 25° taper angles with 0.8 mm inlet gap, and
20°, 25° taper angles with 1.27 mm inlet using the boiling correlation by Kandlikar [61] as
discussed earlier in Chapter 4. The model was validated by comparing the predicted HTC
values with the experimental results. The comparison between predicted and experimental
values is shown in Fig. 46. The accuracy of the theoretical predictions increases with heat
increase in heat flux, and maximum accuracy is obtained near CHF since fluid is driven by
heat flux in the tapered configurations. To improve the accuracy of the theoretical values,
the effect of bubble squeezing mechanism can be included in the future developments. A
preliminary force balance on the bubble during expansion is presented later in Chapter 8.
The force balance can be adopted to develop a dynamic bubble squeezing model to evaluate

96
the pumping action provided by the interface motion. The additional pumping action due
to bubble squeezing will increase the predicted mass flux values, hence improved
Figure 46: The predicted HTC values and the comparison with the experimental
results for different geometric configurations.
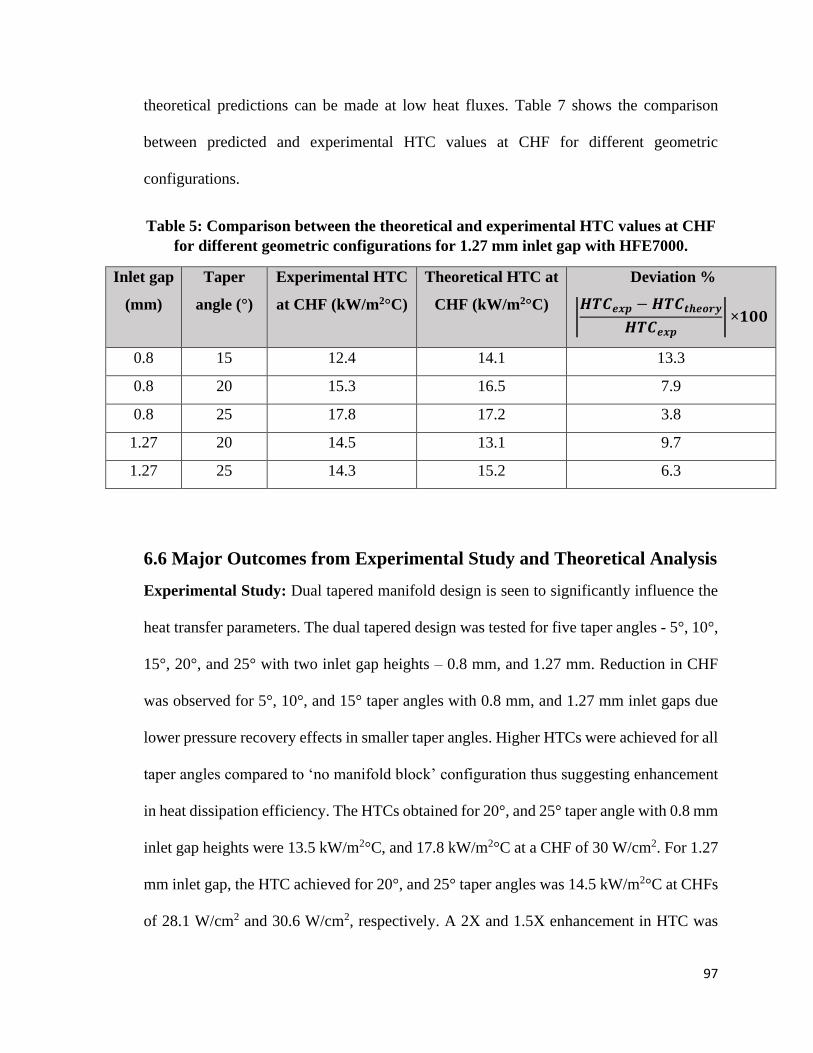
97
theoretical predictions can be made at low heat fluxes. Table 7 shows the comparison
between predicted and experimental HTC values at CHF for different geometric
configurations.
Table 5: Comparison between the theoretical and experimental HTC values at CHF
for different geometric configurations for 1.27 mm inlet gap with HFE7000.
Inlet gap
(mm)
Taper
angle (°)
Experimental HTC
at CHF (kW/m2°C)
Theoretical HTC at
CHF (kW/m2°C)
Deviation %
|𝑯𝑻𝑪𝒆𝒙𝒑 − 𝑯𝑻𝑪𝒕𝒉𝒆𝒐𝒓𝒚
𝑯𝑻𝑪𝒆𝒙𝒑| ×𝟏𝟎𝟎
0.8 15 12.4 14.1 13.3
0.8 20 15.3 16.5 7.9
0.8 25 17.8 17.2 3.8
1.27 20 14.5 13.1 9.7
1.27 25 14.3 15.2 6.3
6.6 Major Outcomes from Experimental Study and Theoretical Analysis
Experimental Study: Dual tapered manifold design is seen to significantly influence the
heat transfer parameters. The dual tapered design was tested for five taper angles - 5°, 10°,
15°, 20°, and 25° with two inlet gap heights – 0.8 mm, and 1.27 mm. Reduction in CHF
was observed for 5°, 10°, and 15° taper angles with 0.8 mm, and 1.27 mm inlet gaps due
lower pressure recovery effects in smaller taper angles. Higher HTCs were achieved for all
taper angles compared to ‘no manifold block’ configuration thus suggesting enhancement
in heat dissipation efficiency. The HTCs obtained for 20°, and 25° taper angle with 0.8 mm
inlet gap heights were 13.5 kW/m2°C, and 17.8 kW/m2°C at a CHF of 30 W/cm2. For 1.27
mm inlet gap, the HTC achieved for 20°, and 25° taper angles was 14.5 kW/m2°C at CHFs
of 28.1 W/cm2 and 30.6 W/cm2, respectively. A 2X and 1.5X enhancement in HTC was

98
recorded using 25° taper angle with 0.8 mm, and 1.27 mm inlet gaps respectively compared
to ‘no manifold block’ configuration.
Theoretical Analysis: The model could not predict HTCs for 5°, 10° taper angles with 0.8
mm inlet gap height and 5°, 10°, 15° taper angles with 1.27 mm inlet gap height. For these
configurations pressure drop is greater than pressure recovery effect for all heat fluxes. For
cases where pressure recovery was able to balance the pressure drops with stable flow, the
HTC values were predicted and validated by comparing with experimental findings. The
maximum deviation in the theoretical and experimental HTC value was 13.3% for 15° taper
with 0.8 mm inlet gap. For all other configurations less than 10% deviation was obtained,
thus validating the use of homogeneous model in the theoretical approach.
99
Chapter 7
7.0 Thermosiphon Loop with Dual Tapered Manifold
for CPU Cooling
In this study, an innovative evaporator design in a thermosiphon loop is introduced for
CPU cooling application in servers assembled horizontally in a rack in data center. The
manifold block containing a dual taper design is used in the evaporator to develop a stable
two-phase fluid circulation in a thermosiphon loop. The thermal performance of the
thermosiphon loop was compared with the currently used air based, and water-based
coolers.
The three taper angles studied in this work are 2°, 2.5°, and 3°. Based on the previous flow
boiling work on tapered manifold by Kalani and Kandlikar [34,41], it was observed that
taper design reduces the flow instabilities and decreases the total pressure drop along the
flow length. Based on these observations, the taper angle of 2° was selected as the lower
limit in the current study. However, Kalani and Kandlikar showed 3.4° taper angle
produced best heat dissipation performance over a flow length of 10 mm. Since the flow
length in the presented study is larger, two additional angles of 2.5° and 3° were also
studied. The flow length in the presented work is based on the dimensions of the targeted
CPU.

100
7.1 Methodology
The experimental study was conducted in three phases – a) benchtop thermosiphon loop
on a mock CPU heater, b) thermosiphon loop on an actual CPU under thermal stressful
conditions, and c) comparison of thermosiphon loop, air cooler, and water cooler under
high heat flux conditions.
a) Benchtop thermosiphon loop on a mock CPU heater: In this phase of the study,
a standalone version of thermosiphon loop was designed and built to evaluate the
heat dissipation ability of the loop for different taper angles. The study was
performed on a copper heater (mock CPU) with dimensions same as the dimensions
of the CPU’s heat spreader. The targeted CPU is a i7-930 processor with a thermal
design power (TDP) 130 W and heat spreader measurements, 34.5 mm x 32 mm.
b) Thermosiphon loop on an actual CPU under thermal stressful conditions: In
this phase of the study, the performance and adaptability of the thermosiphon loop
for actual CPU cooling was evaluated under thermal stressful conditions. The
evaporator of the thermosiphon loop developed in the benchtop study was mounted
on an i7-930 processor, and the cooling performance was compared with the
commercial air based, and water based coolers.
c) Comparison of thermosiphon loop, air cooler, and water cooler under high
heat flux conditions: In this phase of the study, the cooling performance of the
three coolers was evaluated on the mock CPU heater under high heat flux
conditions. The actual CPU cooling study provides performance comparison at low
heat flux based on the TDP of CPU, therefore this study was performed to compare
the performance of the three coolers at high heat flux conditions.

101
7.2 Benchtop Thermosiphon Loop on a Mock CPU Heater
7.2.1 Experimental Setup of the Standalone Loop
A benchtop thermosiphon loop was designed and fabricated for experimental study under
the heat flux-controlled environment. The data obtained from this configuration was used
to evaluate the ability of a dual-tapered evaporator for CPU cooling in a thermosiphon loop.
The benchtop loop contains an evaporator, a condenser, two risers, and a downcomer as
Figure 47: The schematic of benchtop thermosiphon loop with dual-tapered manifold in
the evaporator and mock CPU.
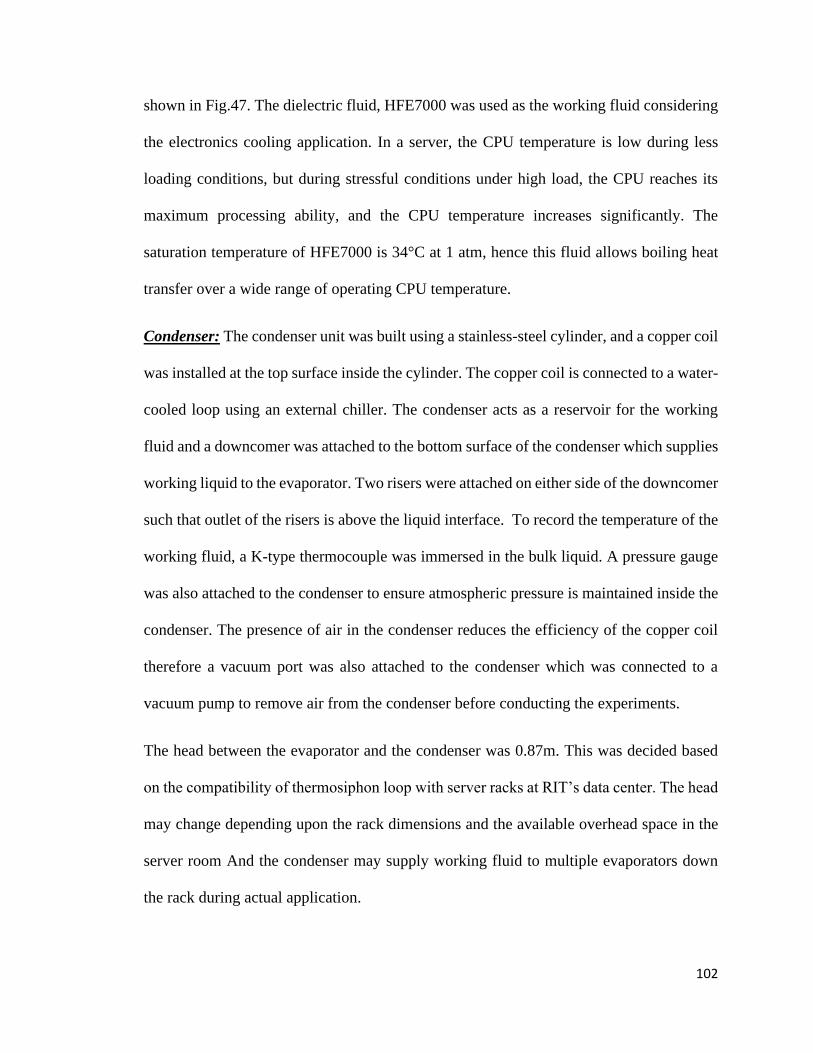
102
shown in Fig.47. The dielectric fluid, HFE7000 was used as the working fluid considering
the electronics cooling application. In a server, the CPU temperature is low during less
loading conditions, but during stressful conditions under high load, the CPU reaches its
maximum processing ability, and the CPU temperature increases significantly. The
saturation temperature of HFE7000 is 34°C at 1 atm, hence this fluid allows boiling heat
transfer over a wide range of operating CPU temperature.
Condenser: The condenser unit was built using a stainless-steel cylinder, and a copper coil
was installed at the top surface inside the cylinder. The copper coil is connected to a water-
cooled loop using an external chiller. The condenser acts as a reservoir for the working
fluid and a downcomer was attached to the bottom surface of the condenser which supplies
working liquid to the evaporator. Two risers were attached on either side of the downcomer
such that outlet of the risers is above the liquid interface. To record the temperature of the
working fluid, a K-type thermocouple was immersed in the bulk liquid. A pressure gauge
was also attached to the condenser to ensure atmospheric pressure is maintained inside the
condenser. The presence of air in the condenser reduces the efficiency of the copper coil
therefore a vacuum port was also attached to the condenser which was connected to a
vacuum pump to remove air from the condenser before conducting the experiments.
The head between the evaporator and the condenser was 0.87m. This was decided based
on the compatibility of thermosiphon loop with server racks at RIT’s data center. The head
may change depending upon the rack dimensions and the available overhead space in the
server room And the condenser may supply working fluid to multiple evaporators down
the rack during actual application.
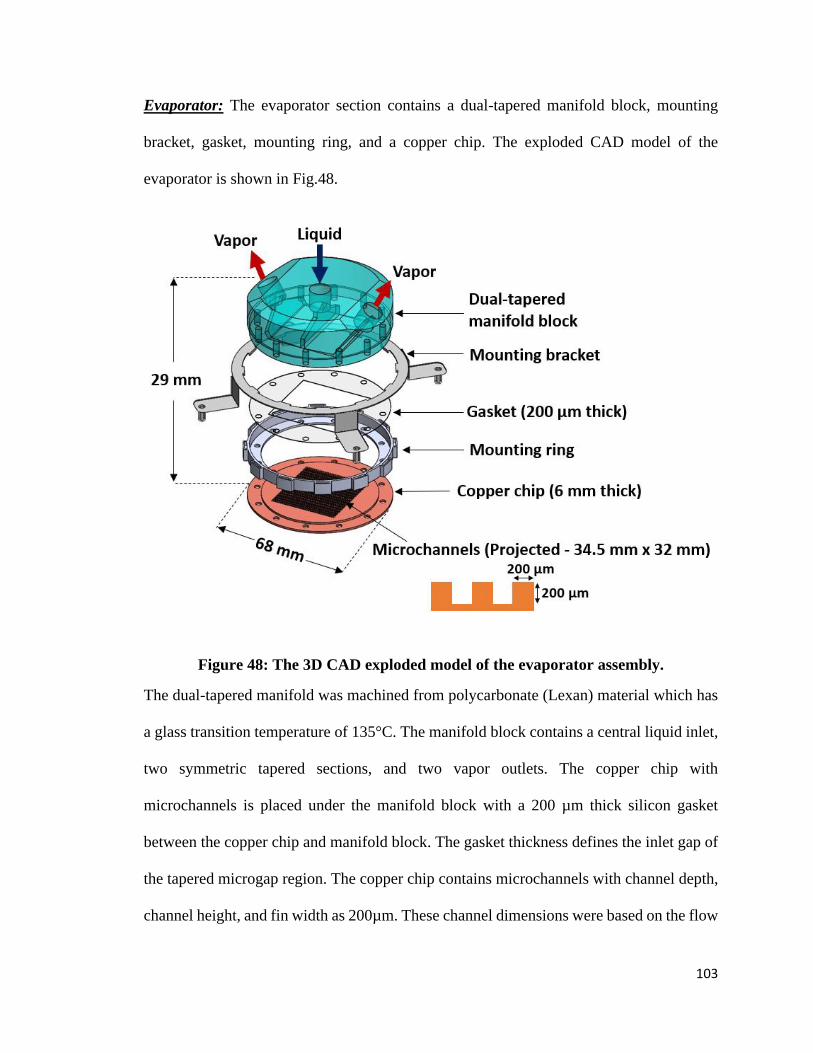
103
Evaporator: The evaporator section contains a dual-tapered manifold block, mounting
bracket, gasket, mounting ring, and a copper chip. The exploded CAD model of the
evaporator is shown in Fig.48.
Figure 48: The 3D CAD exploded model of the evaporator assembly.
The dual-tapered manifold was machined from polycarbonate (Lexan) material which has
a glass transition temperature of 135°C. The manifold block contains a central liquid inlet,
two symmetric tapered sections, and two vapor outlets. The copper chip with
microchannels is placed under the manifold block with a 200 µm thick silicon gasket
between the copper chip and manifold block. The gasket thickness defines the inlet gap of
the tapered microgap region. The copper chip contains microchannels with channel depth,
channel height, and fin width as 200µm. These channel dimensions were based on the flow

104
boiling work by Kalani and Kandlikar [34,41]. The copper contains a
34.5mm⨯32mm⨯4mm step at the bottom. This step was designed in order to place the
chip directly in contact with the mock CPU heater and allow enough space to put a
thermocouple to measure the chip temperature. The assembly of manifold block, copper
chip, and gasket are held together using an aluminum ring and 12 hex screws. The whole
evaporator assembly is mounted on the mock CPU heater using a mounting bracket and
thermal interface material (TIM) was applied on the heater. As shown in Fig.47, the mock
CPU heater was fabricated using a copper block and was heated via joule heating using
four cartridge heaters (200 W each). The cartridge heaters were connected to an external
DC power supply. The heat transfer projected area was 34.5mm⨯32mm, these dimensions
were decided based on the CPU dimensions (i7-930). Three K-type thermocouples were
inserted in the copper heater block to calculate the heat flux for different configurations.
The stem of the heater block was surrounded by a garolite insulation to minimize the heat
losses.
7.2.2 Experimental Procedure
The procedure followed while conducting experiments for all the tapered configurations
is discussed in this section.
• Step 1: Refrigerant HFE7000 (175ml volume) was charged in the condenser and
the fill volume 175ml was selected based on previous study on optimum fill volume
in thermosiphon loop [67].
• Step 2: The vacuum pump was turned on and air was removed through the vacuum
port from the system before all experiments.

105
• Step 3: The thermocouples in the test setup were connected to the cDAQ device.
And the setup was monitored by a Labview VI program and the National
Instruments cDAQ – 9174 and MOD – 9211.
• Step 4: The external dc power supply was turned on and power was supplied to the
four cartridge heaters in the mock CPU heater.
• Step 5: The boiling heat transfer was visually confirmed throughout the experiment
and voltage was increased in steps of 5V for each heat flux data point.
• Step 6: Data was recorded at steady state conditions after about fifteen minutes of
steady operation as indicated by the LabVIEW program. Steady state was
confirmed when the temperature variation was less than 0.1ºC for all the
thermocouples.
• Step 7: Pressure in the system was maintained at 1atm by controlling the cooling
water temperature in the copper coil in condenser.
7.2.3 Data Reduction
The data reduction procedure adopted for this study was similar to the ‘pool boiling
performance of dual tapered manifold with water’ as discussed earlier in Chapter 5. The
heat transfer parameters - heat flux (q"), heat transfer coefficient (HTC) and, wall superheat
(ΔTsat) were calculated using the Eqs. (11 – 15). For this study, the value of Δx and x1
parameters as shown in Fig.49 were 5 mm and 4 mm, respectively. The uncertainty analysis
was conducted for all heat transfer parameters and a detailed discussion on uncertainty
calculation is presented in Appendix. The uncertainty values for heat flux and HTC are
shown as error bars in the ‘experimental results’ section 7.2.4.
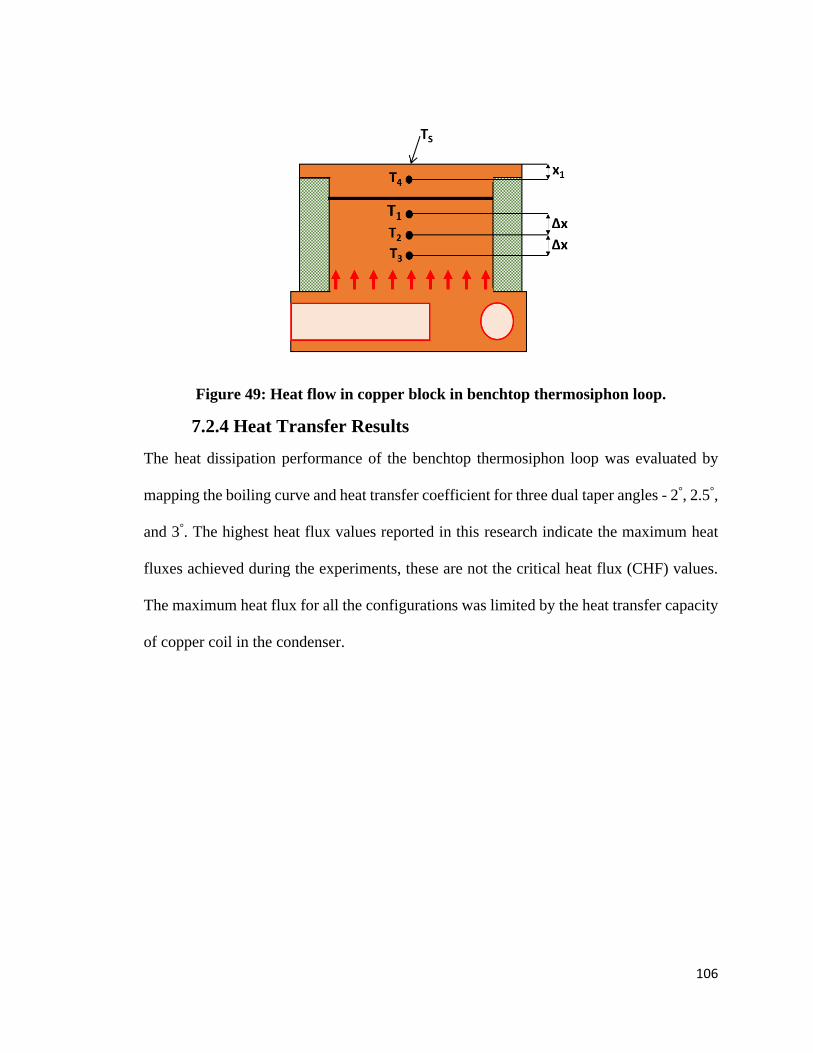
106
Figure 49: Heat flow in copper block in benchtop thermosiphon loop.
7.2.4 Heat Transfer Results
The heat dissipation performance of the benchtop thermosiphon loop was evaluated by
mapping the boiling curve and heat transfer coefficient for three dual taper angles - 2°, 2.5°,
and 3°. The highest heat flux values reported in this research indicate the maximum heat
fluxes achieved during the experiments, these are not the critical heat flux (CHF) values.
The maximum heat flux for all the configurations was limited by the heat transfer capacity
of copper coil in the condenser.

107
7.2.4.1 Boiling Curve for Benchtop Thermosiphon Loop Testing
The boiling curves obtained for the benchtop thermosiphon loop testing for different dual
taper angles are shown in Fig. 50. The degree of subcooling for all the experimental
configurations was kept below 5°C. The degree of subcooling is defined as the difference
between the saturation temperature and actual temperature of the working liquid at the
condenser outlet in the downcomer. The boiling curve shows the variation in heat flux
with respect to wall superheat for 2°, 2.5°, and 3° dual taper angles. The highest heat flux
was achieved using 2° taper angle; 26 W/cm2 at a wall superheat of 11.5ºC. For 2.5º taper
angle, the highest heat flux obtained was 25 W/cm2 at a wall superheat of 15.5 ºC. The
taper angle of 3° provided the lowest performance compared to 2°, and 2.5° dual taper
angles. The maximum heat flux achieved for 3° taper was 21 W/cm2 at wall superheat of
14°C. The maximum heat flux values for different dual taper angles is shown in Fig. 51.
Figure 50: Boiling curve showing the variation in heat flux with respect to wall
superheat for different dual taper angles in benchtop thermosiphon loop.
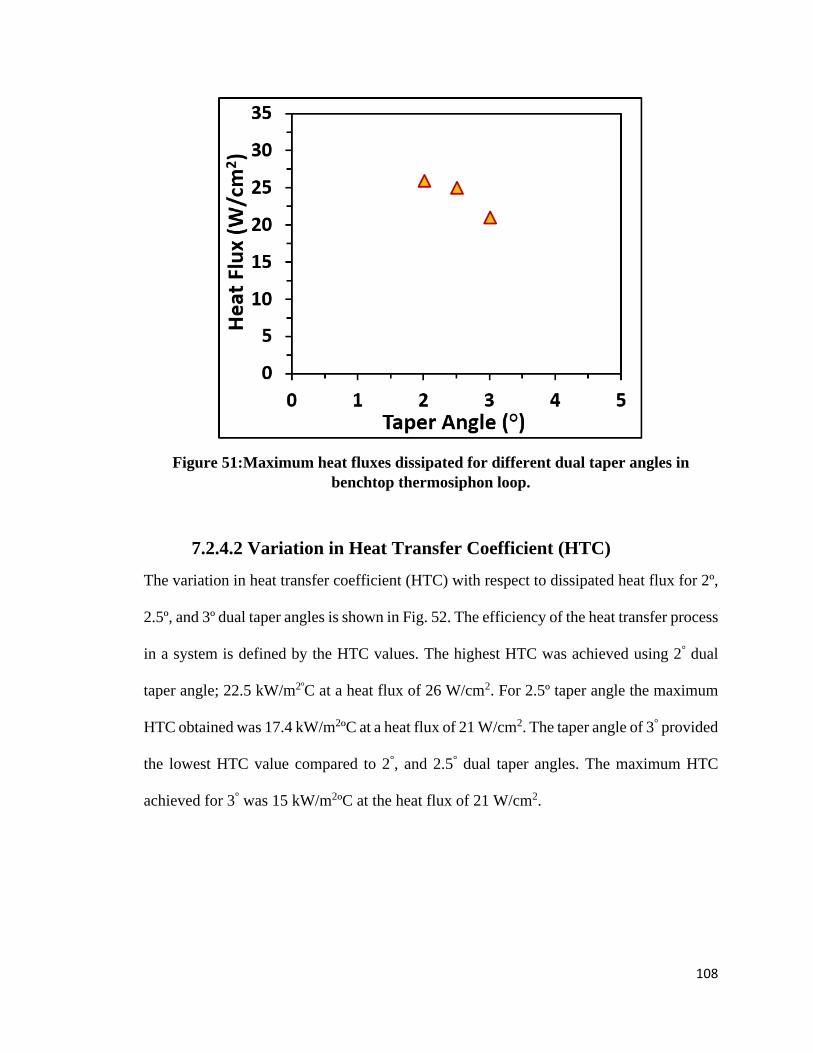
108
Figure 51:Maximum heat fluxes dissipated for different dual taper angles in
benchtop thermosiphon loop.
7.2.4.2 Variation in Heat Transfer Coefficient (HTC)
The variation in heat transfer coefficient (HTC) with respect to dissipated heat flux for 2º,
2.5º, and 3º dual taper angles is shown in Fig. 52. The efficiency of the heat transfer process
in a system is defined by the HTC values. The highest HTC was achieved using 2° dual
taper angle; 22.5 kW/m2ºC at a heat flux of 26 W/cm2. For 2.5º taper angle the maximum
HTC obtained was 17.4 kW/m2ºC at a heat flux of 21 W/cm2. The taper angle of 3° provided
the lowest HTC value compared to 2°, and 2.5° dual taper angles. The maximum HTC
achieved for 3° was 15 kW/m2ºC at the heat flux of 21 W/cm2.

109
Figure 52: Variation in heat transfer coefficient (HTC) with respect to heat flux for
different dual taper angles in benchtop thermosiphon loop.
The 2º dual taper angle dissipated more heat flux compared to 2.5º, and 3º and achieved
higher HTC values. This suggests that 2º taper dissipates more heat with better efficiency.
The tapered design allows pressure recovery which helps in developing a unidirectional
flow thus enhancing heat transfer by continuously rewetting the heated surface. For higher
taper angles - 2.5° and 3°, the liquid inertia reduces due to larger cross section along the
flow length. This mitigates the bubble removal process in the flow domain. This results in
high wall superheats and smaller HTC values. The heat flux dissipation ability of such
tapered systems is proportional to the liquid inertia as shown by Kalani and Kandlikar [44].
7.2.5 Thermal Simulation of Mock CPU in ANSYS Static Thermal
The copper heater used in the benchtop configurations was developed based on the
dimensions of i7-930 processor which is used in RIT’s data center. The scale and the

110
geometrical configuration of the evaporator used in thermosiphon loop study makes this
configuration first of its kind. Since no other data is available for this setup, a numerical
study was performed in ANSYS 18.1 to validate the experimental findings. A 3D heater
model was designed in SolidWorks and was imported in the ANSYS design modeler as
shown in Fig.53. An unstructured mesh consisting of 120,302 tetrahedral elements was
generated as shown in Fig.54.
Figure 53: The 3D CAD model of mock CPU used in the benchtop thermosiphon
loop study.

111
Figure 54: An unstructured mesh consisting of tetrahedral elements for simulation
study in ANSYS static thermal.
Boiling heat transfer was simulated at the top surface of the heater block. According to the
experimental findings the maximum and most-efficient heat dissipation was achieved for
a 2° taper angle. Therefore, the experimental boundary conditions for 2° taper angle were
used for the simulation. A total of 280 W of power was applied at the four holes where
cartridge heaters were inserted during the experimental study. The heat transfer coefficient
(HTC) of 22.38 kW/m2°C achieved for 2° taper angle was applied at the top surface. The
base and the sides of the copper heater were insulated using garolite which was exposed to
air at the room temperature. HTC of 5 W/m2°C was applied on the surfaces exposed to the
air, this HTC value was calculated based on the thermal resistances due to garolite and the
air pocket between heater wall and garolite sleeve.
The temperature distribution along the heater was obtained as shown in Fig. 55(a). A
maximum temperature of 93°C was achieved near the holes where cartridge heaters were
inserted. And minimum temperature of 56.3°C was achieved at the heater’s top surface.
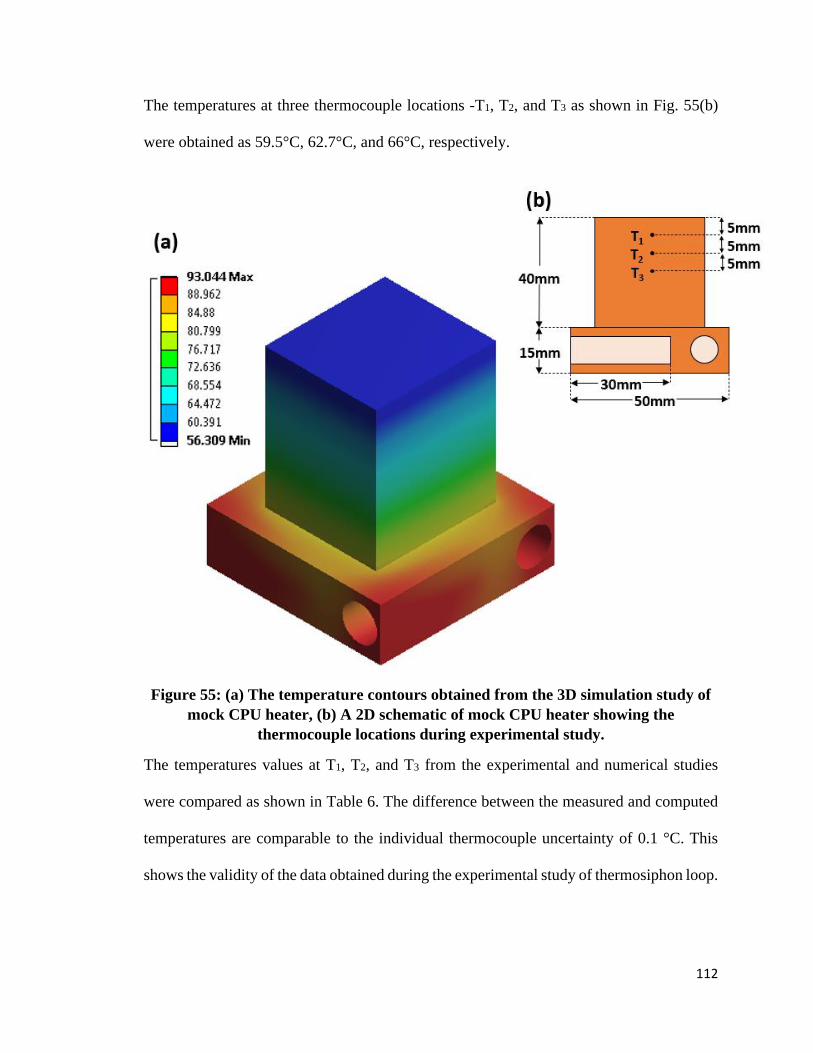
112
The temperatures at three thermocouple locations -T1, T2, and T3 as shown in Fig. 55(b)
were obtained as 59.5°C, 62.7°C, and 66°C, respectively.
Figure 55: (a) The temperature contours obtained from the 3D simulation study of
mock CPU heater, (b) A 2D schematic of mock CPU heater showing the
thermocouple locations during experimental study.
The temperatures values at T1, T2, and T3 from the experimental and numerical studies
were compared as shown in Table 6. The difference between the measured and computed
temperatures are comparable to the individual thermocouple uncertainty of 0.1 °C. This
shows the validity of the data obtained during the experimental study of thermosiphon loop.

113
Table 6: The temperature comparison between experimental and numerical results
at T1, T2, and T3 during benchtop thermosiphon loop study.
Temperature
location
Experimental (TE)
°C
Numerical (TN)
°C
|𝑻𝑵 − 𝑻𝑬| °C
T1 59.7 59.5 0.2
T2 62.8 62.7 0.1
T3 65.5 66 0.5
7.3 Thermosiphon Loop on an actual CPU under Thermal Stressful
Conditions
7.3.1 Experimental Setup
The thermosiphon loop used for CPU cooling was same as the one used in benchtop testing,
except for the mock CPU copper heater, the evaporator was mounted on a motherboard in
direct contact with an actual CPU. The schematic of the whole assembly is shown in Fig.
56. The image of actual evaporator mounted directly on the CPU attached to the
motherboard is shown in Fig. 57. The CPU used for the study was Intel i7-930 processor
with a thermal design power (TDP) of 130W, which used in RIT’s data center. To minimize
the contact resistance, Arctic Silver thermal grease was used between the evaporator and
the CPU. The heat dissipation performance of the thermosiphon loop was compared with
SilenX air cooler (296g, 2.4W SilenX EFZ-80HA2), and Alienware water cooler (2.5W
Alienware Area 51 W550R PP749). The detailed description of the air, water coolers is
presented later in the Appendix.
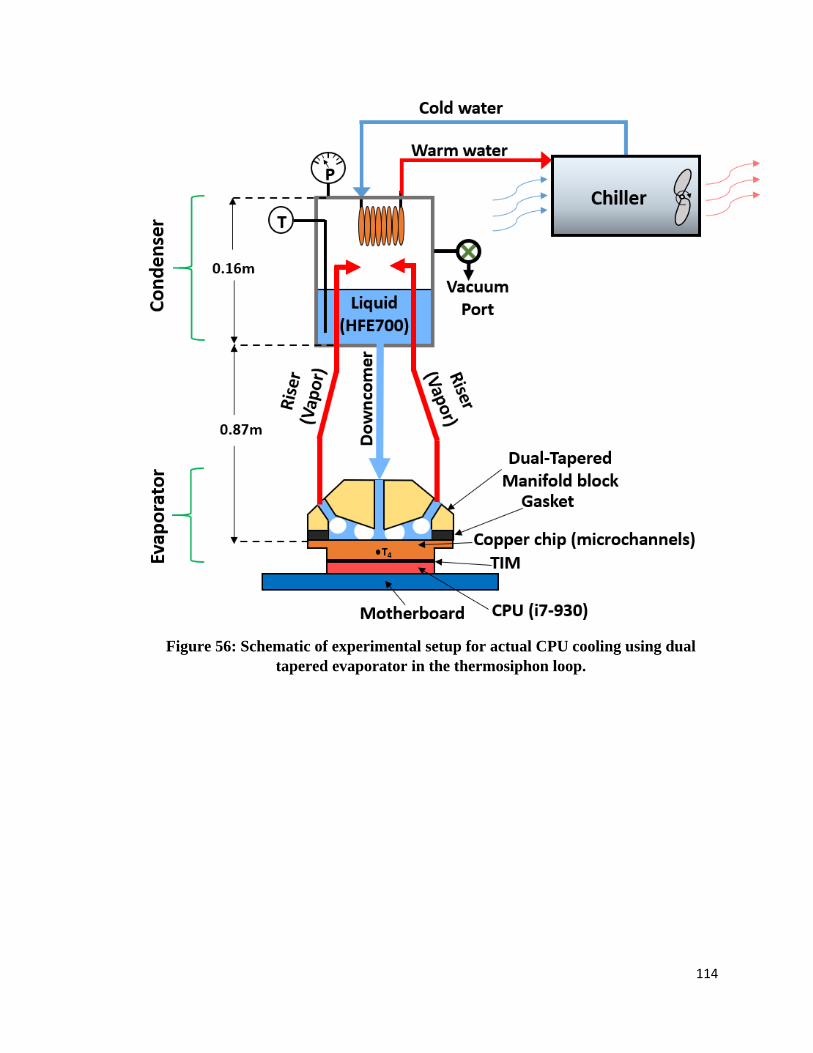
114
Figure 56: Schematic of experimental setup for actual CPU cooling using dual
tapered evaporator in the thermosiphon loop.
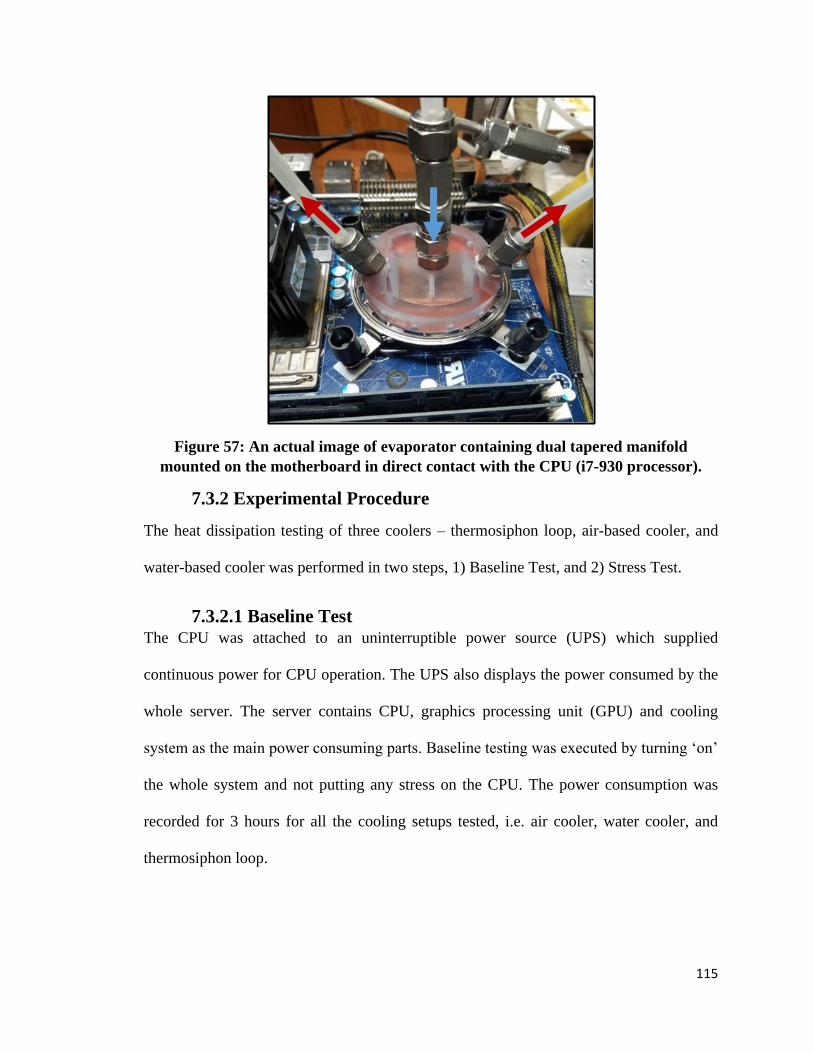
115
Figure 57: An actual image of evaporator containing dual tapered manifold
mounted on the motherboard in direct contact with the CPU (i7-930 processor).
7.3.2 Experimental Procedure
The heat dissipation testing of three coolers – thermosiphon loop, air-based cooler, and
water-based cooler was performed in two steps, 1) Baseline Test, and 2) Stress Test.
7.3.2.1 Baseline Test The CPU was attached to an uninterruptible power source (UPS) which supplied
continuous power for CPU operation. The UPS also displays the power consumed by the
whole server. The server contains CPU, graphics processing unit (GPU) and cooling
system as the main power consuming parts. Baseline testing was executed by turning ‘on’
the whole system and not putting any stress on the CPU. The power consumption was
recorded for 3 hours for all the cooling setups tested, i.e. air cooler, water cooler, and
thermosiphon loop.
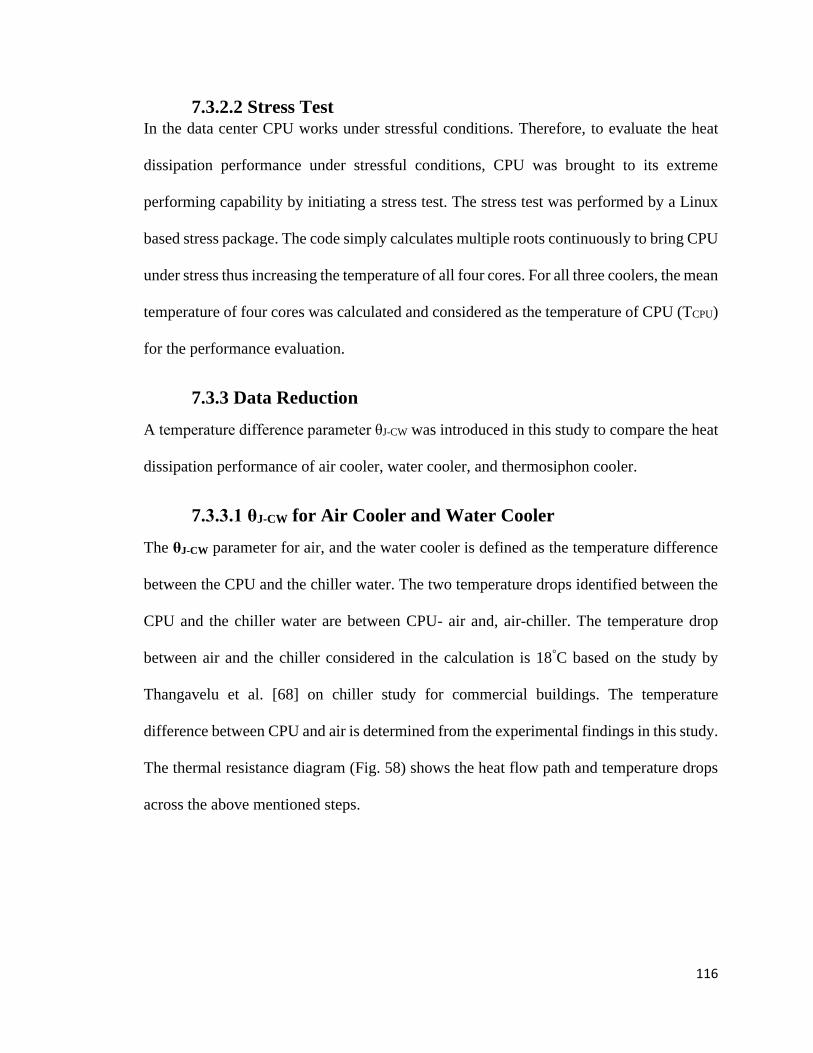
116
7.3.2.2 Stress Test In the data center CPU works under stressful conditions. Therefore, to evaluate the heat
dissipation performance under stressful conditions, CPU was brought to its extreme
performing capability by initiating a stress test. The stress test was performed by a Linux
based stress package. The code simply calculates multiple roots continuously to bring CPU
under stress thus increasing the temperature of all four cores. For all three coolers, the mean
temperature of four cores was calculated and considered as the temperature of CPU (TCPU)
for the performance evaluation.
7.3.3 Data Reduction
A temperature difference parameter θJ-CW was introduced in this study to compare the heat
dissipation performance of air cooler, water cooler, and thermosiphon cooler.
7.3.3.1 θJ-CW for Air Cooler and Water Cooler
The θJ-CW parameter for air, and the water cooler is defined as the temperature difference
between the CPU and the chiller water. The two temperature drops identified between the
CPU and the chiller water are between CPU- air and, air-chiller. The temperature drop
between air and the chiller considered in the calculation is 18°C based on the study by
Thangavelu et al. [68] on chiller study for commercial buildings. The temperature
difference between CPU and air is determined from the experimental findings in this study.
The thermal resistance diagram (Fig. 58) shows the heat flow path and temperature drops
across the above mentioned steps.
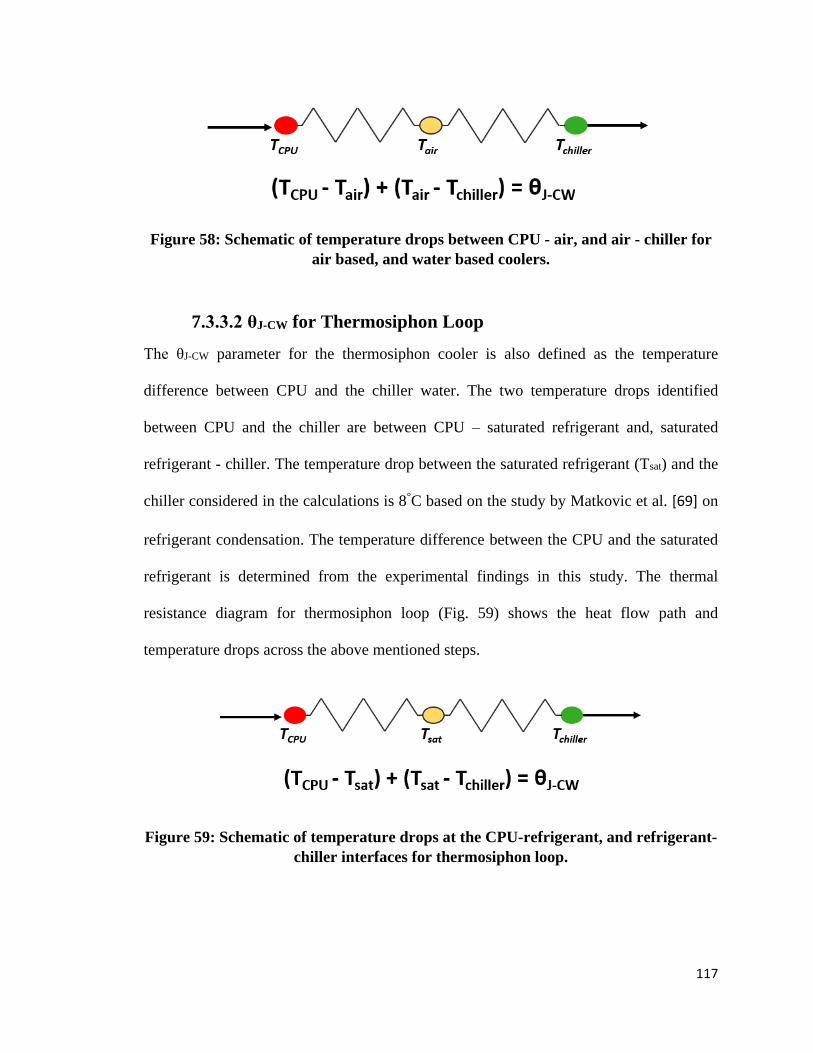
117
Figure 58: Schematic of temperature drops between CPU - air, and air - chiller for
air based, and water based coolers.
7.3.3.2 θJ-CW for Thermosiphon Loop
The θJ-CW parameter for the thermosiphon cooler is also defined as the temperature
difference between CPU and the chiller water. The two temperature drops identified
between CPU and the chiller are between CPU – saturated refrigerant and, saturated
refrigerant - chiller. The temperature drop between the saturated refrigerant (Tsat) and the
chiller considered in the calculations is 8°C based on the study by Matkovic et al. [69] on
refrigerant condensation. The temperature difference between the CPU and the saturated
refrigerant is determined from the experimental findings in this study. The thermal
resistance diagram for thermosiphon loop (Fig. 59) shows the heat flow path and
temperature drops across the above mentioned steps.
Figure 59: Schematic of temperature drops at the CPU-refrigerant, and refrigerant-
chiller interfaces for thermosiphon loop.
118
7.3.2 Heat Transfer Results - Comparison Study of Water Cooler,
Air Cooler, and Thermosiphon Loop
To evaluate the heat dissipation performance of the thermosiphon loop, CPU cooling
results of thermosiphon loop with dual taper tapered manifold were compared with
commercial air and water-based coolers. Three dual taper angles - 2º, 2.5º, and 3º were
tested in the thermosiphon loop configuration. The heat dissipation performance of all the
coolers in terms of θJ-CW is shown in Fig. 60. The CPU was under no stress initially during
baseline phase, as the stress command was executed the temperature of four cores shoots
up instantly. The CPU was dissipating ~ 12 W/cm2 during the stress test. As shown in the
performance plot, thermosiphon loop with 2º dual taper angle achieved minimum θJ-CW
during stressful conditions. This shows that this configuration dissipates heat from the CPU
most efficiently compared to other configurations. The worst performance was observed
for air-based cooler obtaining the highest θJ-CW value. All dual taper angles in thermosiphon
loop achieved better performance than air, and water coolers. The average θJ-CW values for
all the coolers during stress test is shown in Table 7.
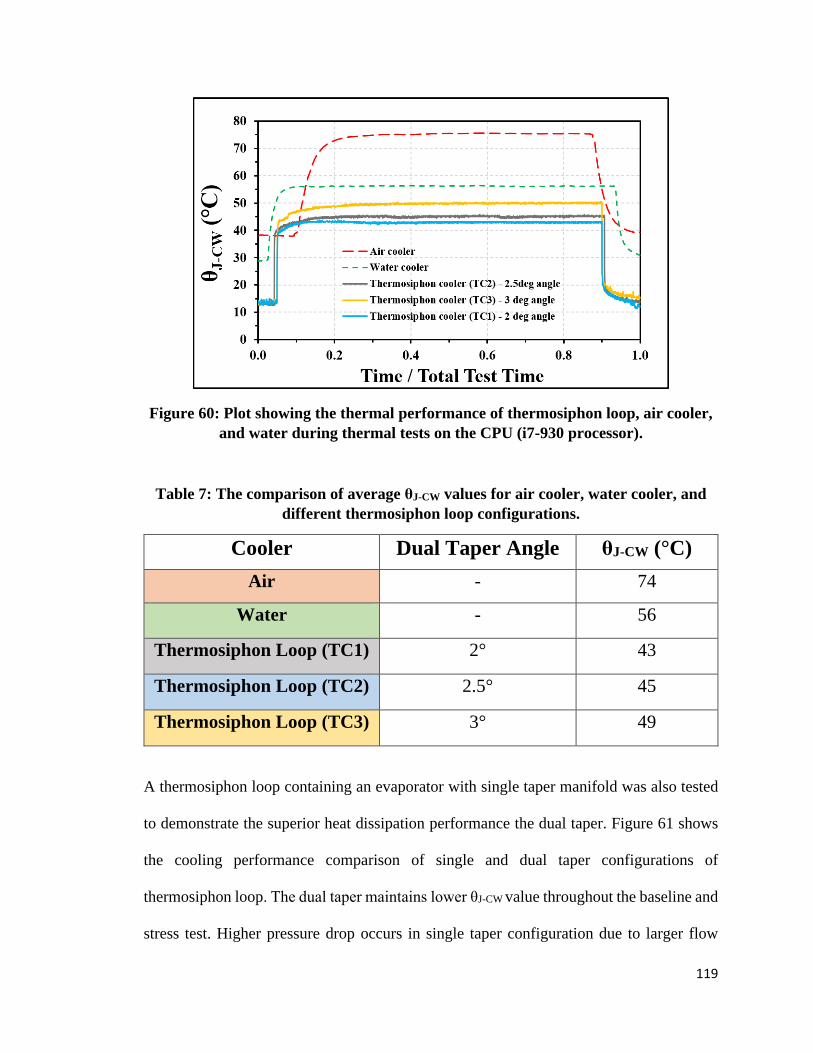
119
Figure 60: Plot showing the thermal performance of thermosiphon loop, air cooler,
and water during thermal tests on the CPU (i7-930 processor).
Table 7: The comparison of average θJ-CW values for air cooler, water cooler, and
different thermosiphon loop configurations.
Cooler Dual Taper Angle θJ-CW (°C)
Air - 74
Water - 56
Thermosiphon Loop (TC1) 2° 43
Thermosiphon Loop (TC2) 2.5° 45
Thermosiphon Loop (TC3) 3° 49
A thermosiphon loop containing an evaporator with single taper manifold was also tested
to demonstrate the superior heat dissipation performance the dual taper. Figure 61 shows
the cooling performance comparison of single and dual taper configurations of
thermosiphon loop. The dual taper maintains lower θJ-CW value throughout the baseline and
stress test. Higher pressure drop occurs in single taper configuration due to larger flow

120
length. The higher pressure drop causes reduced flow rate in single taper system and the
heat dissipation performance suffers. Also, the liquid inertia reduces significantly along the
flow length in single taper configurations due to high degree of cross section expansion.
These factors lead to inefficient vapor removal from microchannels surface in the
evaporator thus reducing the heat transfer performance of the single taper evaporator.
Figure 61: Plot showing the thermal performance of single taper and dual taper
manifolds in thermosiphon during thermal tests on the CPU.
A flow boiling loop can also be implemented as a CPU cooling technique for high heat
flux dissipation. The flow boiling system may obtain lower CPU temperature compared to
thermosiphon loop, but it requires an additional continuous pumping power for fluid
circulation. The primary advantage of a thermosiphon loop compared to a flow boiling loop
is the absence of a pump and additional system components. The microchannels chip used
in the evaporator of the thermosiphon loop may contain nanostructured surfaces or porous
coating to improve the heat dissipation efficiency but this will add significant cost to the
cooling process for any large scale application such as data center.
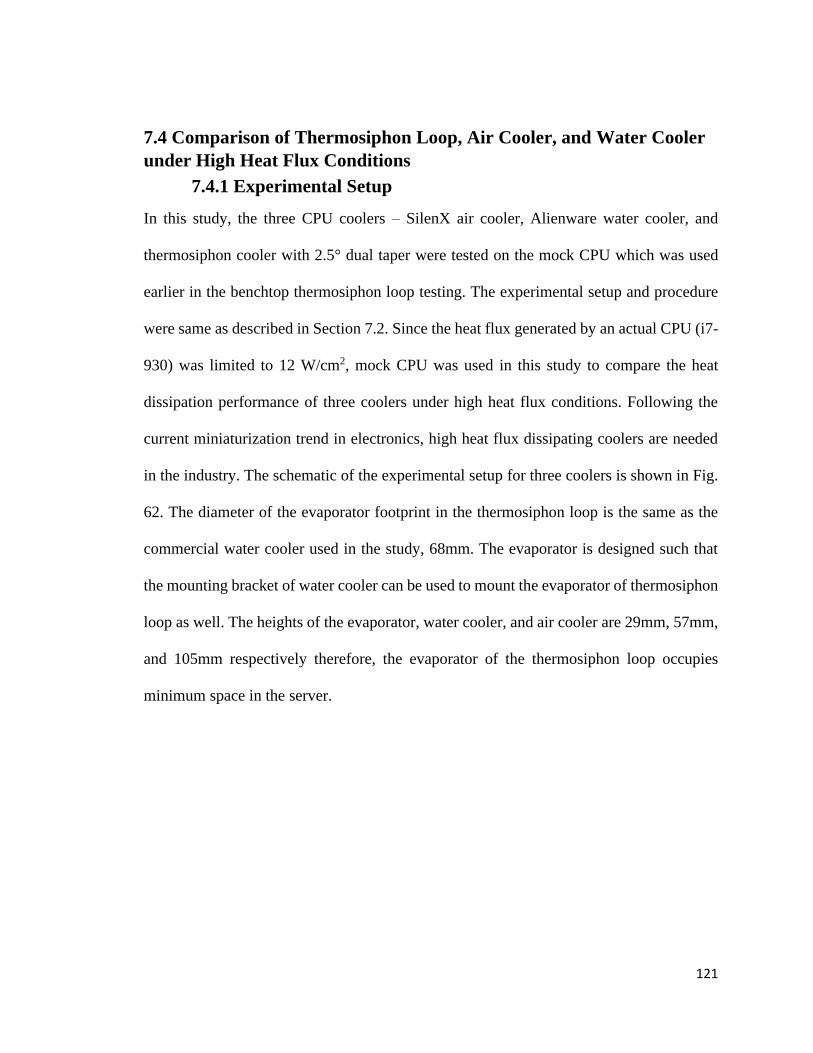
121
7.4 Comparison of Thermosiphon Loop, Air Cooler, and Water Cooler
under High Heat Flux Conditions
7.4.1 Experimental Setup
In this study, the three CPU coolers – SilenX air cooler, Alienware water cooler, and
thermosiphon cooler with 2.5° dual taper were tested on the mock CPU which was used
earlier in the benchtop thermosiphon loop testing. The experimental setup and procedure
were same as described in Section 7.2. Since the heat flux generated by an actual CPU (i7-
930) was limited to 12 W/cm2, mock CPU was used in this study to compare the heat
dissipation performance of three coolers under high heat flux conditions. Following the
current miniaturization trend in electronics, high heat flux dissipating coolers are needed
in the industry. The schematic of the experimental setup for three coolers is shown in Fig.
62. The diameter of the evaporator footprint in the thermosiphon loop is the same as the
commercial water cooler used in the study, 68mm. The evaporator is designed such that
the mounting bracket of water cooler can be used to mount the evaporator of thermosiphon
loop as well. The heights of the evaporator, water cooler, and air cooler are 29mm, 57mm,
and 105mm respectively therefore, the evaporator of the thermosiphon loop occupies
minimum space in the server.
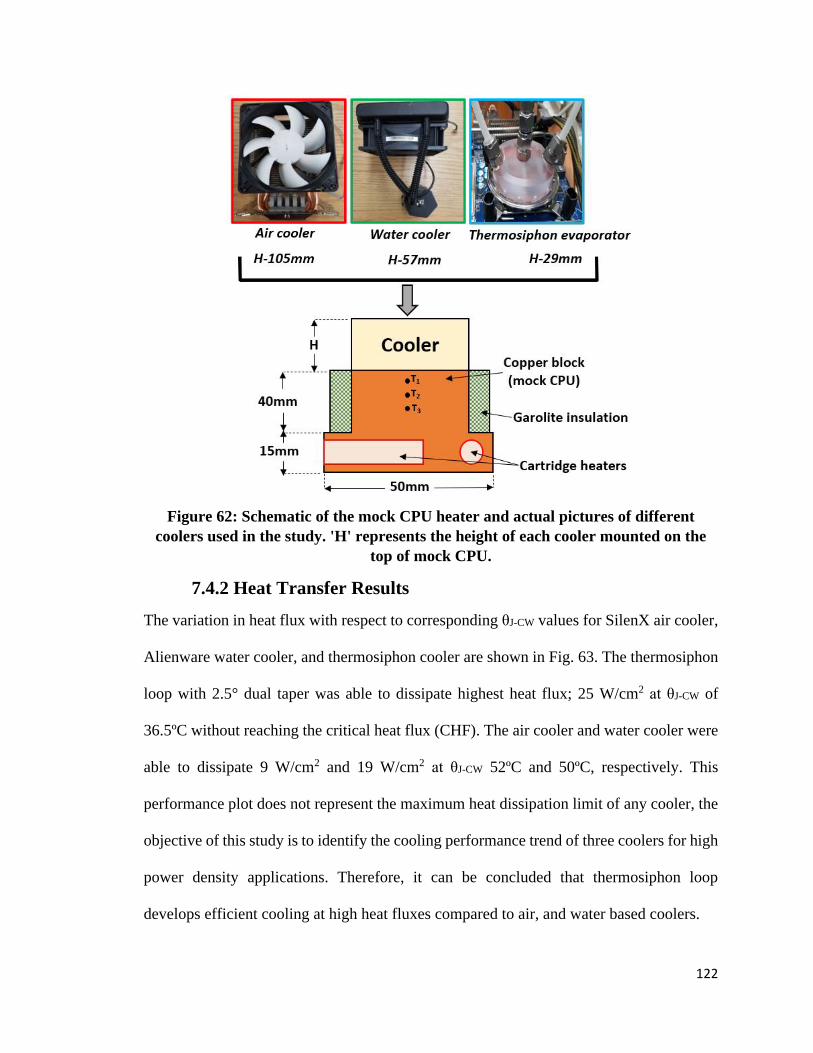
122
Figure 62: Schematic of the mock CPU heater and actual pictures of different
coolers used in the study. 'H' represents the height of each cooler mounted on the
top of mock CPU.
7.4.2 Heat Transfer Results
The variation in heat flux with respect to corresponding θJ-CW values for SilenX air cooler,
Alienware water cooler, and thermosiphon cooler are shown in Fig. 63. The thermosiphon
loop with 2.5° dual taper was able to dissipate highest heat flux; 25 W/cm2 at θJ-CW of
36.5ºC without reaching the critical heat flux (CHF). The air cooler and water cooler were
able to dissipate 9 W/cm2 and 19 W/cm2 at θJ-CW 52ºC and 50ºC, respectively. This
performance plot does not represent the maximum heat dissipation limit of any cooler, the
objective of this study is to identify the cooling performance trend of three coolers for high
power density applications. Therefore, it can be concluded that thermosiphon loop
develops efficient cooling at high heat fluxes compared to air, and water based coolers.
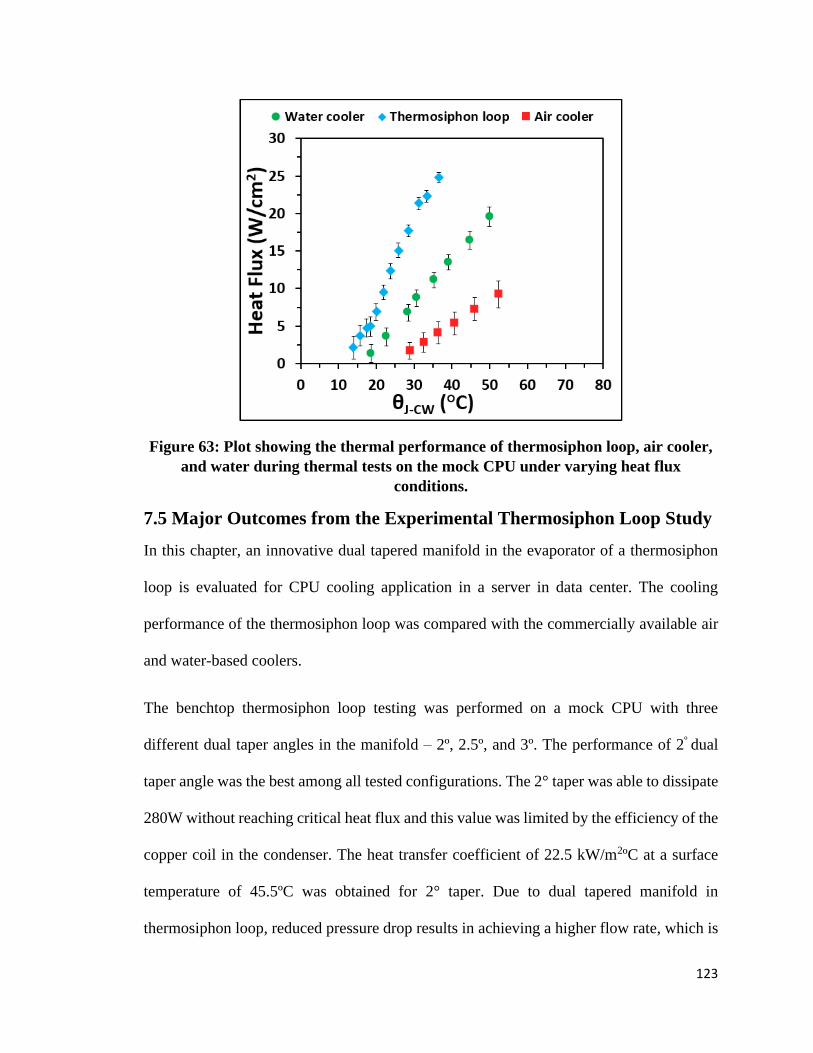
123
Figure 63: Plot showing the thermal performance of thermosiphon loop, air cooler,
and water during thermal tests on the mock CPU under varying heat flux
conditions.
7.5 Major Outcomes from the Experimental Thermosiphon Loop Study
In this chapter, an innovative dual tapered manifold in the evaporator of a thermosiphon
loop is evaluated for CPU cooling application in a server in data center. The cooling
performance of the thermosiphon loop was compared with the commercially available air
and water-based coolers.
The benchtop thermosiphon loop testing was performed on a mock CPU with three
different dual taper angles in the manifold – 2º, 2.5º, and 3º. The performance of 2º dual
taper angle was the best among all tested configurations. The 2° taper was able to dissipate
280W without reaching critical heat flux and this value was limited by the efficiency of the
copper coil in the condenser. The heat transfer coefficient of 22.5 kW/m2ºC at a surface
temperature of 45.5ºC was obtained for 2° taper. Due to dual tapered manifold in
thermosiphon loop, reduced pressure drop results in achieving a higher flow rate, which is
124
helpful in improving both CHF and HTC. However, as the taper increases, the heat transfer
performance deteriorates due to reduced fluid velocities at the outlet of the tapered
manifold. Hence for any specific geometry and the fluid used in the evaporator, there is an
optimum taper angle to dissipate heat most efficiently.
In the thermosiphon loop during actual CPU cooling application, the evaporator of the
thermosiphon loop was installed on the motherboard in direct contact with the CPU (i7-
930 processor). The cooling performance of thermosiphon loop was compared with SilenX
air cooler, and Alienware water cooler during thermal stress test. The performance
comparison parameter, θJ-CW was defined as the temperature difference between the
junction (or mock CPU surface) and the chilled water temperature for all three coolers.
Thermosiphon cooler with 2° dual taper angle maintained the minimum θJ-CW value at 43ºC
during the thermal stress test and the values for water, and air based coolers were 56°C and
74°C respectively. Also, the other taper angles – 2.5°, and 3° obtained smaller θJ-CW values
compared to air, and water coolers hence establishing superior heat dissipation
performance.
The benchtop comparison of thermosiphon, air, and water CPU coolers was also studied
on a mock CPU to compare the cooling performance of different coolers under high heat
flux conditions. The thermosiphon loop with 2.5º dual taper angle was able to dissipate 25
W/cm2 at θJ-CW of 36.5ºC without reaching the CHF. The air and water coolers were able
to dissipate 9 W/cm2 and 19 W/cm2 at θJ-CW 52ºC and 50ºC, respectively. These heat flux
values does not represent the maximum heat dissipation limit of the coolers; these values
were obtained to obtain the performance trend for different coolers.

125
7.6 Design Guidelines
Based on the experience gained from the experimental study where thermosiphon
evaporator was mounted directly on the CPU, some of design guidelines are provided in
this section. The heat transfer performance in a thermosiphon loop can be enhanced by
sustaining the two-phase flow stability with continuous surface rewetting. This can be
obtained by evaluating the effect of various operational parameters such as the type of
working fluid, the head between the evaporator and the condenser, and the pressure drop.
The design parameters such as taper angle, inlet gap height, and flow length also need to
be considered depending on the targeted CPU.
1) Type of working fluid: In the presented work HFE7000 was used as the working fluid.
HFE7000 is a dielectric fluid, hence it can be used in electronics application. Also, the low
saturation temperature, 34°C at 1 atm, allows in establishing the two-phase heat transfer
under a no stress conditions. The working fluid can be changed depending on the saturation
temperature and latent heat requirements. It is suggested to use a dielectric fluid in
electronics cooling application considering the safety of the electronic devices. Water as
the working fluid will provide the best cooling performance, but such loop requires
operation in vacuum condition, and this adds complexity to the cooling structure. Also, the
possibility of leakage leading to a catastrophic failure of the expensive electronic
equipment have prevented the widespread usage of water in thermosiphon loops for
electronics cooling application.
2) Head between the evaporator and the condenser: Based on the compatibility of the
thermosiphon loop with the racks at RIT’s data center, a head of 0.87 m was developed
126
between the evaporator and the condenser. The head between the evaporator and the
condenser helps in developing the fluid inertia across the tapered boiling region. The
greater head develops higher fluid inertia at the inlet of the evaporator therefore increases
the heat transfer rate. In general, it is suggested to use the highest available head based on
the space and piping constrains in the server room.
3) Pressure drop: The flow instability or fluctuations results in reversed flow in the
evaporator leading to high pressure drops and this degrades the cooling performance of the
thermosiphon loop. Also, increasing the flow lengths result in high pressure drops. The use
of dual paper is suggested to reduce the flow length for a given tapered manifold. For larger
evaporators than those tested in this study, further increasing the number of differed tapered
regions with multiple inlets and outlets may be considered to reduce the pressure drop.
4) Effect of flow length and taper angle: The flow length and taper angle affect the total
pressure drop along the boiling domain significantly. The taper angle provides additional
expanding volume along the flow length towards the evaporator outlet. This allows bubble
to grow in the vertical space above the heating surface thus avoiding lateral dry outs.
Therefore, a stable fluid flow can be established with a lower pressure drop using such
configuration. A detailed theoretical analysis on pressure recovery effect due to tapered
region is discussed earlier in Chapter 4. The value of taper angle can be increased until an
optimized value is obtained depending on the flow length and flow width. This
optimization process requires an independent parametric study for a specific evaporator
design.

127
In a tapered region, due to the continuous expansion in the flow domain, the fluid inertia
continuously decreases along the flow length. Hence, a greater expansion is experienced
for larger flow lengths resulting in inefficient bubble removal especially towards the
evaporator outlet and an overall performance deterioration. For the same taper angle, the
dual taper design allows lesser expansion along the flow direction compared to the single
taper design since the flow length is reduced by half. In a dual taper configuration, adequate
fluid inertia is maintained along the flow length for smaller taper angles therefore resulting
in a better thermal performance.
128
Chapter 8
8.0 High Speed Visualization and Theoretical Analysis
of Bubble Squeezing Mechanism
The bubble squeezing mechanism in the tapered microgap section provides a liquid
pumping effect from the bulk into the microgap. The bubble nucleation, bubble expansion,
and departure in the microgap are discussed in this chapter. The high-speed images of
bubble growth and departure were obtained for different taper angles and inlet gap heights
using water as the working fluid. The stable and unstable bubble expansion cases were
obtained, and the interface tracking of a single bubble provided insight into motion of the
receding and advancing interfaces. A preliminary force balance on a single squeezed
bubble is also presented under static conditions.
8.1 Experimental Setup
The schematic of the experimental setup used to obtain the high-speed images of the bubble
squeezing mechanism with water as the working fluid is shown in Fig.64. The setup
contains a boiling test section at top and a heating assembly at the bottom. The boiling test
section is supported on an adjustable platform with a copper test chip held in a ceramic
chip holder. The ceramic is used to prevent heat losses from the heated test chip. The edges
of the copper test surface are covered by kapton tape providing a 10 mm x 10 mm boiling
surface for the bubble nucleation. A polysulfone block with a tapered surface is placed over
the copper test chip in the liquid reservoir. The tapered surface on the block is machined
based on the required taper angle in the microgap. The two taper angles (α) used in this
study are 2º, and 10º. The inlet gap height (hi) between the edge of the tapered surface and
copper test surface varies from 0.35 mm to 1.2 mm. The saturated water was contained in

129
a quartz glass reservoir to achieve clear visualization. The quartz reservoir was pushed
against the test chip using hex screws with a silicon gasket between the reservoir and the
test chip.
At the bottom, a copper heater block assembly was used to heat the copper test chip. The
heater assembly was supported on compressed springs. The springs pushes the heater block
against the test chip to reduce the contact resistance. To further minimize the contact
resistance a grafoil sheet was placed between the test chip and the heater block. Four
cartridge heaters (200 W each) were inserted in the heater block. The cartridge heaters were
connected to an external DC power supply. Three K-type thermocouples (T1-T3) were
inserted in the copper test chip to measure the temperature gradient in the test chip. A
Figure 64: Schematic of the experimental setup used for obtaining high-speed
imaging of bubble squeezing mechanism in the tapered microgap.

130
Photron high speed camera was placed adjacent to the test surface supported on a four axes
platform. The platform allows smooth motion control of the camera thus helps in achieving
the required focus on the targeted bubbles.
8.2 Experimental Procedure
The quartz tube reservoir was initially filled with the saturated water before each high-
speed recording. The DC power supply was turned on and the voltage was supplied to the
cartridge heaters in the copper heater block. The videos were obtained at low heat flux ~ 5
W/cm2 to obtain clear visualization. At higher heat fluxes, the clear visualization is not
achieved due to generation of multiple ‘rogue bubbles’ along the edge of the silicon gasket.
The saturation state of the water reservoir was observed using a K-type thermocouple
during the recordings. The tapered block was inserted in the water reservoir and the
nucleating bubble was squeezed between the copper test chip and the tapered surface in the
expanding microgap.
The high-speed videos for different taper angles and inlet gap heights were recorded at
2000 fps (frames per second) using a PHOTRON high speed camera using a Photron
Fastcam View (PFV) software. The pixel size in the videos was determined by observing
a wire of known diameter before each recording. The high-speed videos were post
processed in the Photron Fastcam Analyzer (PFA) software to obtain the images and
velocity data as presented in this chapter.
8.3 Stable Bubble Expansion in Tapered Microgap
During the actual boiling application in a tapered microgap, a stable bubble expansion is
preferred along the expanding cross section. This creates the required unidirectional two-
phase flow and the liquid pumping effect along the flow domain. The stable bubble
131
expansion was observed for 10° taper angle with 0.8 mm inlet gap, and 10° taper angle
with 1.2 mm inlet gap.
8.3.1 10° taper angle with 0.8 mm inlet gap: The high-speed images of the
sequence of stable bubble squeezing mechanism obtained for the 10° taper angle with 0.8
mm inlet gap are shown in Fig. 65. The bubble interface is shown by red dotted lines and
the cross-sectional area in the tapered microgap increases from right to left, therefore the
bubble expansion and departure is expected from right to left as shown by the blue arrows.
In the first image at t = 0s, two bubbles of different sizes are observed on the surface of the
copper test chip in the tapered microgap. The bigger bubble on the left is in contact with
the tapered surface and a smaller bubble nucleates on the right side near the inlet of the
microgap. In the second image at t = 0.059s, the bubble near the inlet of the microgap meets
the tapered surface and expands towards the right side outside the microgap. In the third
image at t = 0.114s, the bubbles continue to expand and begin to coalesce towards the left
to form a bigger bubble at t = 0.1255s as shown in the fourth image. In the fifth image at t
= 0.1385s, the big bubble continues to move towards left and exits the microgap at t =
0.1845s. This provides space for bubble nucleation and a new bubble nucleates near the
inlet as shown in the sixth image. The bubble departure along the taper causes liquid
pumping effect into the microgap from the right side.
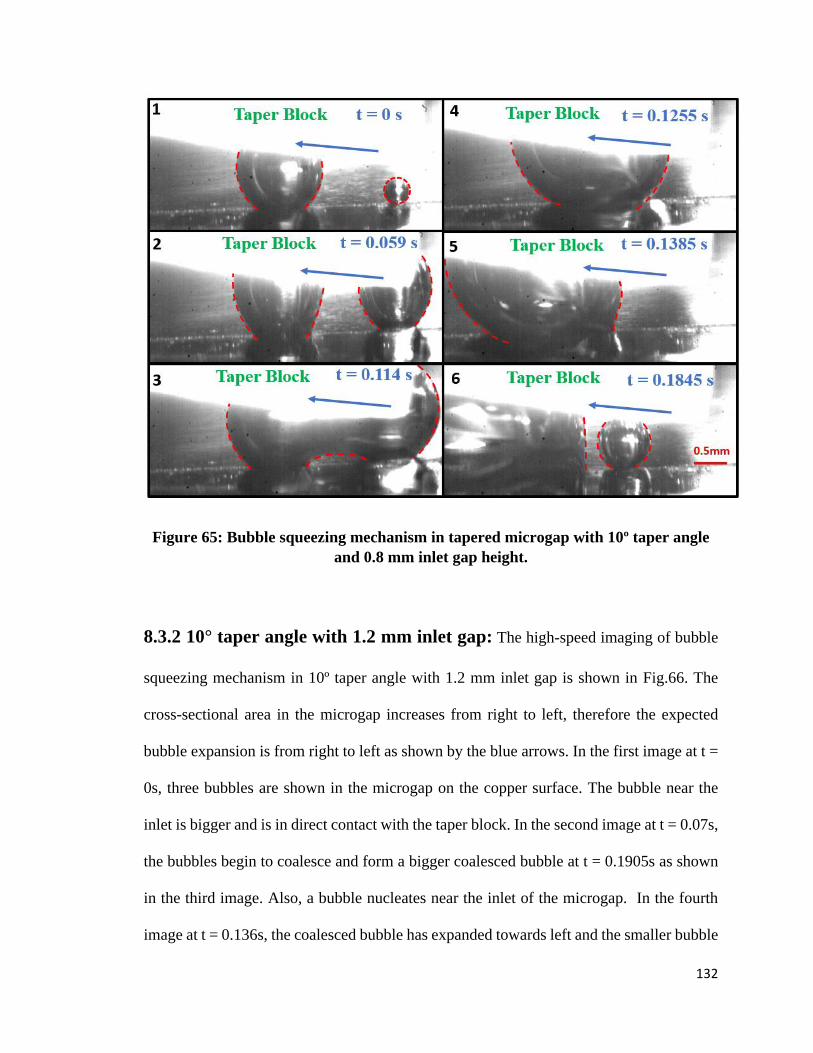
132
Figure 65: Bubble squeezing mechanism in tapered microgap with 10º taper angle
and 0.8 mm inlet gap height.
8.3.2 10° taper angle with 1.2 mm inlet gap: The high-speed imaging of bubble
squeezing mechanism in 10º taper angle with 1.2 mm inlet gap is shown in Fig.66. The
cross-sectional area in the microgap increases from right to left, therefore the expected
bubble expansion is from right to left as shown by the blue arrows. In the first image at t =
0s, three bubbles are shown in the microgap on the copper surface. The bubble near the
inlet is bigger and is in direct contact with the taper block. In the second image at t = 0.07s,
the bubbles begin to coalesce and form a bigger coalesced bubble at t = 0.1905s as shown
in the third image. Also, a bubble nucleates near the inlet of the microgap. In the fourth
image at t = 0.136s, the coalesced bubble has expanded towards left and the smaller bubble
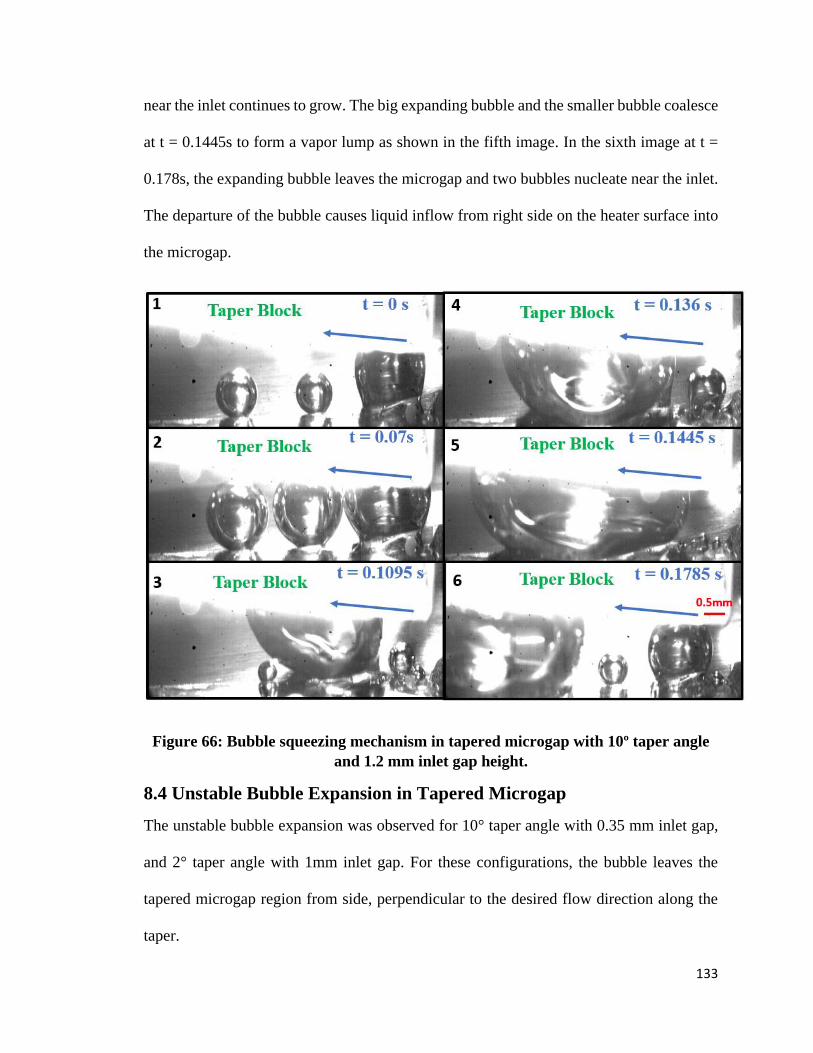
133
near the inlet continues to grow. The big expanding bubble and the smaller bubble coalesce
at t = 0.1445s to form a vapor lump as shown in the fifth image. In the sixth image at t =
0.178s, the expanding bubble leaves the microgap and two bubbles nucleate near the inlet.
The departure of the bubble causes liquid inflow from right side on the heater surface into
the microgap.
Figure 66: Bubble squeezing mechanism in tapered microgap with 10º taper angle
and 1.2 mm inlet gap height.
8.4 Unstable Bubble Expansion in Tapered Microgap
The unstable bubble expansion was observed for 10° taper angle with 0.35 mm inlet gap,
and 2° taper angle with 1mm inlet gap. For these configurations, the bubble leaves the
tapered microgap region from side, perpendicular to the desired flow direction along the
taper.

134
8.4.1 10° taper angle with 0.35 mm inlet gap: Figure 67 shows the sequence of
bubble squeezing mechanism for 10º taper angle and 0.35mm inlet gap. The cross-sectional
area in the microgap increases from right to left, therefore the expected bubble expansion
is from right to left as shown by the blue arrows. The bubble interface is shown by red
dotted lines. Unlike the two cases discussed previously in stable bubble expansion section,
in this case unstable bubble expansion was observed perpendicular to the flow direction.
In the first image at t = 0s, a nucleated bubble on the copper surface was observed in contact
with the taper block at the top and the bubble begins to grow along the taper towards left.
In the second image at t = 0.0315s, the bubble continues to grow along and a second bubble
nucleates near the inlet of the microgap. In the third image at t = 0.048s, both bubbles grow
along the taper and continue to expand towards left side as observed in the fourth image at
t = 0.052s. In the fifth image at t = 0.0565s, the two expanding bubbles coalesce to form a
large vapor lump significantly occupying the flow space in the microgap. In the sixth image
at t = 0.068s, the unstable vapor expansion is observed, and the bubble leaves the microgap,
in the direction perpendicular to the blue arrow. This type of bubble departure is not desired
in a pool boiling system.
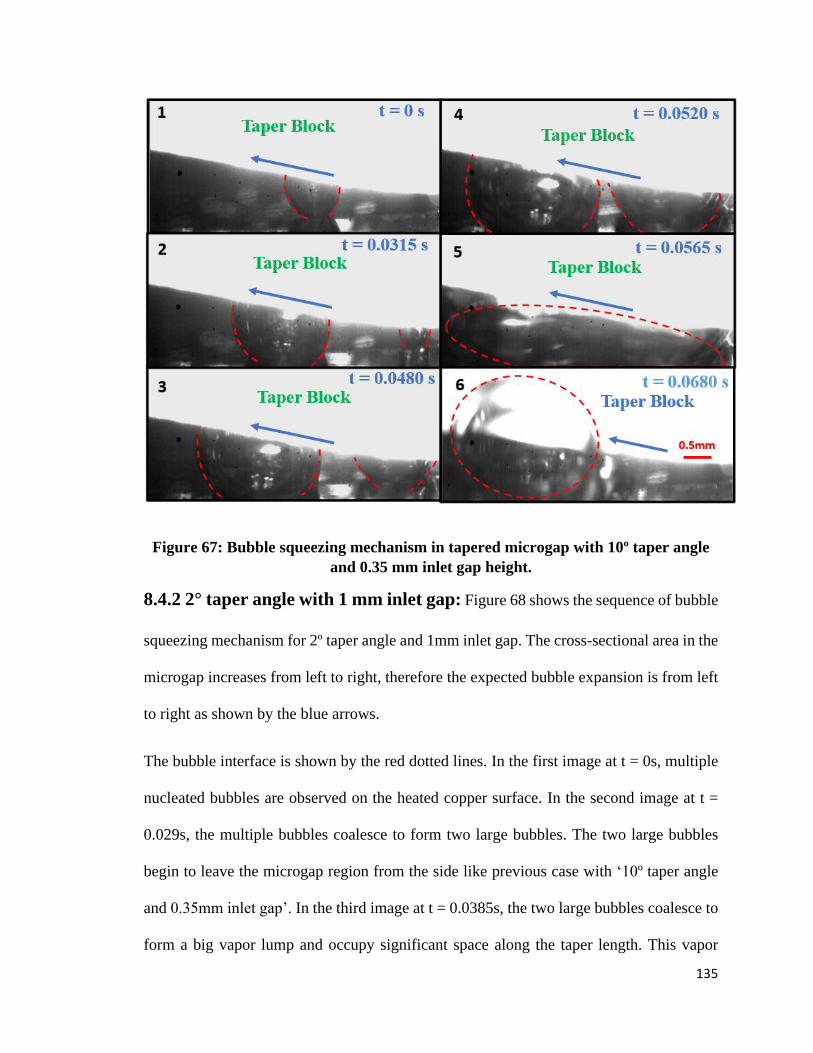
135
Figure 67: Bubble squeezing mechanism in tapered microgap with 10º taper angle
and 0.35 mm inlet gap height.
8.4.2 2° taper angle with 1 mm inlet gap: Figure 68 shows the sequence of bubble
squeezing mechanism for 2º taper angle and 1mm inlet gap. The cross-sectional area in the
microgap increases from left to right, therefore the expected bubble expansion is from left
to right as shown by the blue arrows.
The bubble interface is shown by the red dotted lines. In the first image at t = 0s, multiple
nucleated bubbles are observed on the heated copper surface. In the second image at t =
0.029s, the multiple bubbles coalesce to form two large bubbles. The two large bubbles
begin to leave the microgap region from the side like previous case with ‘10º taper angle
and 0.35mm inlet gap’. In the third image at t = 0.0385s, the two large bubbles coalesce to
form a big vapor lump and occupy significant space along the taper length. This vapor

136
lumps leaves the tapered microgap from the side perpendicular to the desired flow
direction.
Figure 68: Bubble squeezing mechanism in tapered microgap with 2º taper angle
and 1 mm inlet gap height.
8.5 Advancing and Receding Interface Motion
The motion of advancing and receding interfaces was tracked during the bubble expansion
process for a 10° taper angle as shown in Fig. 69. The aim is to analyze the interface
velocities and develop an insight into the liquid pumping effect.
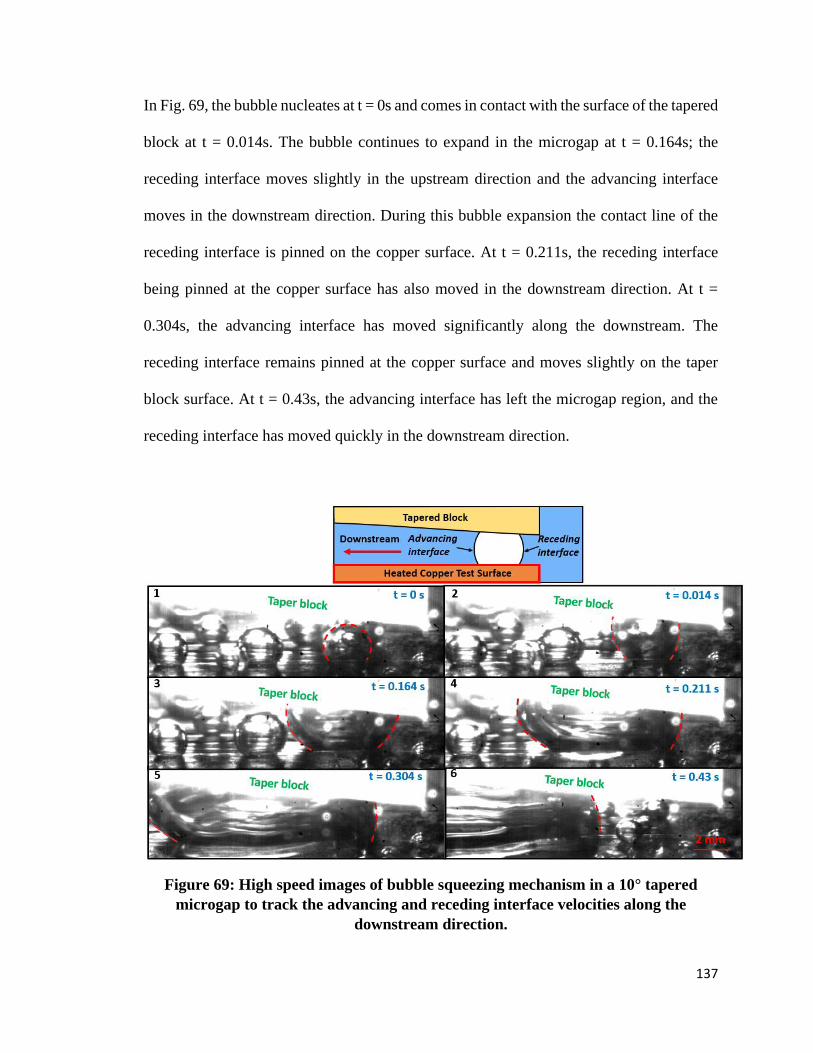
137
In Fig. 69, the bubble nucleates at t = 0s and comes in contact with the surface of the tapered
block at t = 0.014s. The bubble continues to expand in the microgap at t = 0.164s; the
receding interface moves slightly in the upstream direction and the advancing interface
moves in the downstream direction. During this bubble expansion the contact line of the
receding interface is pinned on the copper surface. At t = 0.211s, the receding interface
being pinned at the copper surface has also moved in the downstream direction. At t =
0.304s, the advancing interface has moved significantly along the downstream. The
receding interface remains pinned at the copper surface and moves slightly on the taper
block surface. At t = 0.43s, the advancing interface has left the microgap region, and the
receding interface has moved quickly in the downstream direction.
Figure 69: High speed images of bubble squeezing mechanism in a 10° tapered
microgap to track the advancing and receding interface velocities along the
downstream direction.
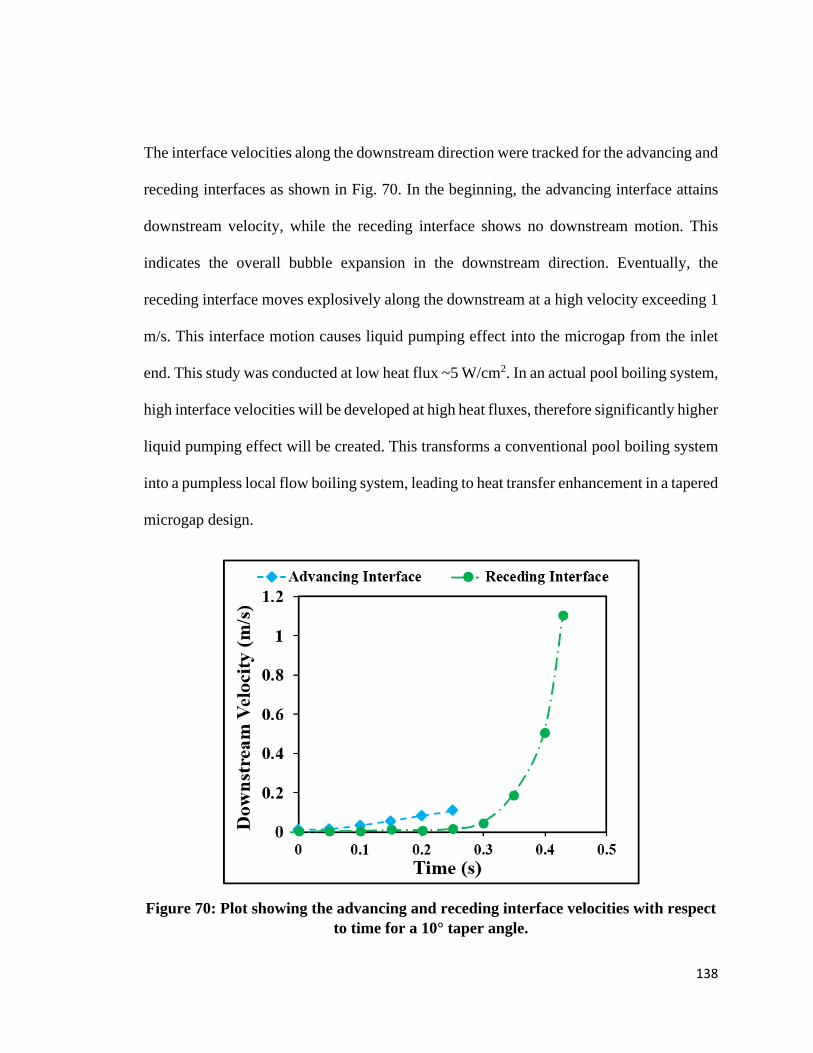
138
The interface velocities along the downstream direction were tracked for the advancing and
receding interfaces as shown in Fig. 70. In the beginning, the advancing interface attains
downstream velocity, while the receding interface shows no downstream motion. This
indicates the overall bubble expansion in the downstream direction. Eventually, the
receding interface moves explosively along the downstream at a high velocity exceeding 1
m/s. This interface motion causes liquid pumping effect into the microgap from the inlet
end. This study was conducted at low heat flux ~5 W/cm2. In an actual pool boiling system,
high interface velocities will be developed at high heat fluxes, therefore significantly higher
liquid pumping effect will be created. This transforms a conventional pool boiling system
into a pumpless local flow boiling system, leading to heat transfer enhancement in a tapered
microgap design.
Figure 70: Plot showing the advancing and receding interface velocities with respect
to time for a 10° taper angle.

139
8.6 Force Balance during Bubble Squeezing
An insight into the forces acting on a bubble during squeezing mechanism in a tapered
microgap is discussed in this section. A bubble growing in the microgap experiences a
rapid bubble growth and it contacts the tapered surface of the manifold block. The bubble
in such narrow passages experiences explosive growth as presented in the literature
[70,71]. The maximum pressure inside the bubble is dictated by the saturation pressure
corresponding to the wall temperature. A two-dimensional force balance was developed on
a growing bubble based on the approach successfully used by Mikic, Rohsenow and
Griffith [72]. Figure 71 shows the forces per unit length acting on a squeezed bubble at the
advancing and receding interfaces. The different forces acting on the interfaces are (a)
surface tension (Fσ1 and Fσ2), (b) pressure difference forces (Fp1 and Fp2), and (c)
evaporation momentum forces (Fem1 and Fem2).
Figure 71: Schematic of forces acting on a squeezed bubble in the tapered microgap.
The net force (Fnet) acting on the bubble along the increasing cross-section is given by
Eq.15.
𝐹𝑛𝑒𝑡 = (𝐹𝜎2 − 𝐹𝜎1) + (𝐹𝑝1 − 𝐹𝑝2) + (𝐹𝑒𝑚1 − 𝐹𝑒𝑚2) (15)
Where, 𝐹𝜎1 = 𝜎𝐶𝑜𝑠Ɵ1 and 𝐹𝜎2 = 𝜎𝐶𝑜𝑠Ɵ2, and 𝜎 is the surface tension. Ɵ1 and Ɵ2 are the
contact angles at the copper test surface. The contact angles and the other dimensional
140
parameters as shown in Fig. 71 were obtained from the high-speed images. The contact
angles for the advancing and receding interfaces at the surface of the manifold block are
close to 90° and therefore the surface tension forces along downstream direction at the
upper edges are neglected. Based on the surface tension at the heated copper surface, the
net surface tension force in the upstream direction (𝐹𝜎1 − 𝐹𝜎2) i.e., against the expanding
cross-section was 0.0058 N/m. The saturation pressure corresponding to a wall superheat
of 6°C (based on the experimental data) develops a pressure difference of 25 kPa. The
maximum net pressure force was calculated based on the area increase corresponding to
the height difference (760 µm - 670 µm = 90 µm) between the interfaces and the pressure
difference of 25 kPa. The calculated maximum net pressure force per unit length (𝐹𝑝1 −
𝐹𝑝2) was 2.25 N/m in the downstream direction i.e., along the expanding cross-section.
The magnitude of the pressure forces is significantly higher than the surface tension forces
at the interfaces.
The evaporation momentum force at the interfaces depends on the interface temperature
and governs the motion of the interface at high heat fluxes [73]. The interface temperature
is higher at the advancing interface compared to the receding interface since liquid
temperature is higher on the left side of the bubble. Therefore, evaporation momentum
force is considerably higher in the downstream direction at the advancing interface
compared to the upstream direction at the receding interface. Hence, the net downstream
force (Fnet) considering the effects of pressure force, surface tension, and evaporation
momentum force drives the explosive bubble growth in the microgap. The Fnet is further
aided by the lower flow resistance due to expanding cross-section in the downstream
direction. For future theoretical developments, an accurate representation of the bubble
141
growth can be developed by solving bubble growth equations considering the dynamic
effects due liquid inertia, similar to the simulations conducted by Mukherjee and Kandlikar
[74].
8.7 Major Outcomes from the High-Speed Imaging Study
The bubble squeezing mechanism was studied by capturing the high-speed videos of
bubble growth and departure in the tapered microgap. The taper angle and inlet gap height
are critical parameters in developing a stable bubble expansion mechanism in the microgap.
The tracking of the interfaces showed that high receding interface velocity is obtained in
the downstream direction (in the direction of expanding cross-section) at the end of the
bubble growth cycle. This creates a liquid pumping effect into the tapered microgap
section. And finally, a preliminary two-dimensional force balance theoretical study was
performed on a squeezed bubble, and it was shown that forces due to the vapor pressure in
the bubble dominate over surface tension effects and contribute significantly to drive the
bubble motion in the downstream direction. The evaporation momentum force also drives
the bubble along the downstream direction due to more evaporation at the advancing
interface. A more detailed analysis can be developed in the future under dynamic flow
conditions. Such modeling development can predict the fluid velocity due to bubble
squeezing mechanism and can be coupled with the homogeneous flow model to accurately
estimate the mass fluxes in the tapered microgap.
142
Chapter 9
9.0 Conclusion
9.1 Major Contributions
• A theoretical model was developed and validated to gain the fundamental
understanding of two-phase flow characteristics in a tapered microgap geometry.
The model presents the stable flow conditions based on pressure drop analysis and
predicts the HTC for different working fluids and geometries.
• A dual-tapered manifold block was developed for efficient high heat flux
dissipation in pool boiling, and record CHF and HTC values were obtained on a
plain copper surface. No surface enhancements are required for efficient high heat
flux dissipation, instead a simple, robust, add-on technique was developed for a
plain surface.
• A novel evaporator was developed using dual-taper design in thermosiphon loop
for CPU cooling in data centers. A significantly enhanced CPU cooling
performance was obtained using thermosiphon loop compared to air cooler with
heat pipes, and water cooler with microchannels under thermal stressful conditions.
9.2 Theoretical Model for Pressure Drop and HTC Prediction in Pool
Boiling
A theoretical model was developed using homogeneous flow model to calculate the
pressure recovery due to expanding tapered region and pressure drop due to friction,
momentum change, and entrance-exit losses in a pool boiling system. For cases where
pressure recovery was able to balance the pressure drop, mass flux values were predicted
in the tapered microgap. These mass flux values were used to predict the HTC for different
143
geometrical and operational parameters. The predicted values were validated by comparing
with the experimental data. For water, a deviation ~10% was observed near CHF between
predicted and experimental values. For HFE7000, a deviation of less than 10% was
observed near CHF and the minimum deviation achieved was 3.8% for 20° taper with 0.8
mm inlet gap. The pressure recovery effect creates a stable two-phase flow along the taper,
and this enhances the heat dissipation performance of a dual-tapered based pool boiling
system on a plain surface. It was observed that pressure recovery effect increases with
increase in taper angle, and heat flux. The fluid flow in a tapered microgap is significantly
driven by heat flux, therefore the accuracy of theoretical model increases with increase in
heat flux. This suggests that pressure recovery effect is dominant at high heat fluxes
therefore a stable flow is established near CHF. This was also validated by observing
unidirectional flow of vapor columns along the taper in experimental pool boiling study
with water.
For cases where pressure drop is always greater than pressure recovery, no predictions
could be made using the theoretical model. Such conditions are obtained for small taper
angles, and low heat fluxes. For water with 10° taper angle, pressure drop dominates over
pressure recovery, but experimental results show enhanced heat dissipation performance
and stable two-phase flow in the tapered microgap. For HFE7000, during experimental
study reduction in CHF was observed for small taper angles and enhanced HTCs were
achieved for all heat fluxes. For these cases, the bubble squeezing mechanism provides the
required liquid pumping action to establish flow in the microgap. The effect of bubble
squeezing on fluid flow rate should be considered for future study, this will improve the
accuracy of the theoretical model.
144
9.3 Pool Boiling Performance of Dual Tapered Manifold on Plain
Surface A dual-tapered design was developed to enhance the pool boiling heat transfer on a plain
surface. The dual tapered manifold block with 15° taper angle and 1.27 mm inlet gap height
obtained a CHF of 288 W/cm2 on a plain copper surface using water as the working fluid.
A 2.3X enhancement in CHF and HTC was observed using this tapered configuration, this
is highest reported enhancement on a plain surface without using any modifications such
as nano-microstructures, porous coatings, and microchannels. With HFE7000 as the
working fluid, a 2X enhancement in HTC was observed using the 25° taper angle with 0.8
mm inlet gap height. Reduction in CHF was observed for 5°, 10°, and 15° taper angles with
0.8 mm, and 1.27 mm inlet gaps due lower pressure recovery effects in smaller taper angles
but higher HTC values were obtained for all taper angles and inlet gap height
configurations compared to the baseline configuration with no manifold block.
This suggests that efficient high heat dissipation can be achieved in low head systems using
a taper design and in futuristic developments, tapered based CPU coolers can be developed
where available head space is minimal. The dual taper design creates smaller flow lengths
on the heated surface therefore further reducing the pressure drop and improving the flow
stability. Therefore, for larger heated surfaces, several dual tapered manifolds can be
developed along the length and width of the boiling surface.
9.4 Thermosiphon Loop with Dual Tapered Manifold for CPU Cooling
An innovative dual-tapered manifold design was developed and used in the evaporator of
a thermosiphon loop for efficient CPU cooling in data centers. The thermal performance
of a dual-tapered manifold was evaluated for efficient high heat flux dissipation in
145
electronics. The tapered manifold design creates a stable two-phase flow on the heated
surface, and this improves the heat transfer performance of the system.
The thermosiphon loop using a dual-tapered manifold in the evaporator was able to
dissipate 26 W/cm2 (280 W) from a mock CPU without reaching CHF in a benchtop
configuration using HFE7000 as the working fluid. During an actual CPU cooling testing
on i7-930 processor under thermal stressful conditions, thermosiphon loop showed
superior heat dissipation efficiency compared to air cooler with heat pipes, and water-based
cooler with microchannels. The performance of thermosiphon loop was also compared
with air, and water coolers on a mock CPU under high heat flux conditions. This study was
conducted considering the high heat flux dissipation demands from futuristic CPUs
installed in the servers. Significantly superior cooling performance was obtained using
thermosiphon loop at high heat fluxes, since thermosiphon loop is heat flux driven system,
the flow stability increases with increase in heat flux resulting in improved heat transfer.
This study shows the CPU cooling potential of thermosiphon loop in data centers, where a
single condenser can be installed on the top of each rack feeding liquid to several
evaporators installed in multiple servers along the rack. The head between the condenser
and the evaporators can be decided based on the available space and piping constraints in
the room. In thermosiphon study, HFE7000 was used as the working fluid due its dielectric
nature and such fluids are preferred in electronics cooling applications. But water is also
adopted for cooling high power density CPUs in data centers, considering such applications
water can be used in a pressure-controlled thermosiphon loop with dual-tapered evaporator
and significantly high heat fluxes can be dissipated while maintaining low CPU
temperatures.
146
9.5 High Speed Visualization and Theoretical Analysis of Bubble
Squeezing Mechanism
The bubble squeezing mechanism creates a liquid pumping effect along the heater surface
due to sudden vapor expansion and bubble departure along the taper. High fluid velocities
can be obtained in a pool boiling system using a tapered design, and this transforms a
conventional pool boiling system into a local flow boiling system. The bubble interface
motion was studied for different tapered configurations by capturing high-speed images of
bubble growth in the microgap, and interface velocities were obtained causing liquid
pumping effect. For water as the working fluid, it was observed that receding interface
leaves the tapered microgap region with high velocities greater than 1 m/s at low heat flux
~ 5 W/cm2. This creates a sudden liquid rush into the tapered microgap, thus improving the
surface rewetting. This liquid pumping action increases with increase in heat flux.
A preliminary theoretical analysis was also conducted by capturing the effects of various
forces - surface tension, pressure difference, and evaporation momentum. The pressure
inside the bubble dominates over surface tension force and drives the interface along
towards the increasing cross-section direction along the taper. The evaporation momentum
force also drives the bubble motion along the taper due to greater evaporation at the
advancing interface. A more detailed bubble squeezing model can be developed in the
future to evaluate the effect of squeezing mechanism on fluid flow rates.
147
10.0 References
[1] I. Ferain, C.A. Colinge, J.-P. Colinge, Multigate transistors as the future of
classical metal–oxide–semiconductor field-effect transistors, Nature. 479 (2011) 310–
316. https://doi.org/10.1038/nature10676.
[2] I. Staff, Moore’s Law, Investopedia. (2003).
http://www.investopedia.com/terms/m/mooreslaw.asp (accessed April 13, 2017).
[3] E.R. Masanet, R.E. Brown, A. Shehabi, J.G. Koomey, B. Nordman, Estimating
the Energy Use and Efficiency Potential of US Data Centers, Proc. Ieee. 99 (2011) 1440–
1453. https://doi.org/10.1109/JPROC.2011.2155610.
[4] R.R. Schmidt, E.E. Cruz, M. Iyengar, Challenges of data center thermal
management, IBM J. Res. Dev. 49 (2005) 709–723. https://doi.org/10.1147/rd.494.0709.
[5] A. Capozzoli, G. Primiceri, Cooling Systems in Data Centers: State of Art and
Emerging Technologies, Energy Procedia. 83 (2015) 484–493.
https://doi.org/10.1016/j.egypro.2015.12.168.
[6] S.G. Kandlikar, Review and Projections of Integrated Cooling Systems for Three-
Dimensional Integrated Circuits, J. Electron. Packag. 136 (2014).
https://doi.org/10.1115/1.4027175.
[7] Z. Li, S.G. Kandlikar, Current Status and Future Trends in Data-Center Cooling
Technologies, Heat Transf. Eng. 36 (2015) 523–538.
https://doi.org/10.1080/01457632.2014.939032.
[8] S. Nukiyama, The maximum and minimum values of the heat Q transmitted from
metal to boiling water under atmospheric pressure, Int. J. Heat Mass Transf. 9 (1966)
1419–1433. https://doi.org/10.1016/0017-9310(66)90138-4.
[9] M.M. Rahman, E. Ölçeroğlu, M. McCarthy, Role of Wickability on the Critical
Heat Flux of Structured Superhydrophilic Surfaces, Langmuir. 30 (2014) 11225–11234.
https://doi.org/10.1021/la5030923.
[10] K.-H. Chu, Y. Soo Joung, R. Enright, C.R. Buie, E.N. Wang, Hierarchically
structured surfaces for boiling critical heat flux enhancement, Appl. Phys. Lett. 102
(2013) 151602. https://doi.org/10.1063/1.4801811.
[11] K.-H. Chu, R. Enright, E.N. Wang, Structured surfaces for enhanced pool boiling
heat transfer, Appl. Phys. Lett. 100 (2012) 241603. https://doi.org/10.1063/1.4724190.
148
[12] Y. Nam, E. Aktinol, V.K. Dhir, Y.S. Ju, Single bubble dynamics on a
superhydrophilic surface with artificial nucleation sites, Int. J. Heat Mass Transf. 54
(2011) 1572–1577. https://doi.org/10.1016/j.ijheatmasstransfer.2010.11.031.
[13] A. Zou, D.P. Singh, S.C. Maroo, Early Evaporation of Microlayer for Boiling
Heat Transfer Enhancement, Langmuir. 32 (2016) 10808–10814.
https://doi.org/10.1021/acs.langmuir.6b02642.
[14] P.A. Raghupathi, S.G. Kandlikar, Pool boiling enhancement through contact line
augmentation, Appl. Phys. Lett. 110 (2017) 204101. https://doi.org/10.1063/1.4983720.
[15] B.J. Jones, J.P. McHale, S.V. Garimella, The Influence of Surface Roughness on
Nucleate Pool Boiling Heat Transfer, J. Heat Transf. 131 (2009) 121009-121009–14.
https://doi.org/10.1115/1.3220144.
[16] A.R. Betz, J. Jenkins, C.-J. “CJ” Kim, D. Attinger, Boiling heat transfer on
superhydrophilic, superhydrophobic, and superbiphilic surfaces, Int. J. Heat Mass Transf.
57 (2013) 733–741. https://doi.org/10.1016/j.ijheatmasstransfer.2012.10.080.
[17] K.-H. Chu, Y.S. Joung, R. Enright, C.R. Buie, E.N. Wang, Hierarchically
structured surfaces for boiling critical heat flux enhancement, Appl. Phys. Lett. 102
(2013) 151602. https://doi.org/10.1063/1.4801811.
[18] M.M. Rahman, E. Olceroglu, M. McCarthy, Role of Wickability on the Critical
Heat Flux of Structured Superhydrophilic Surfaces, Langmuir. 30 (2014) 11225–11234.
https://doi.org/10.1021/la5030923.
[19] M.M. Rahman, J. Pollack, M. McCarthy, Increasing Boiling Heat Transfer using
Low Conductivity Materials, Sci. Rep. 5 (2015) 13145.
https://doi.org/10.1038/srep13145.
[20] S. Mori, K. Okuyama, Enhancement of the critical heat flux in saturated pool
boiling using honeycomb porous media, Int. J. Multiph. Flow. 35 (2009) 946–951.
https://doi.org/10.1016/j.ijmultiphaseflow.2009.05.003.
[21] C.H. Li, T. Li, P. Hodgins, C.N. Hunter, A.A. Voevodin, J.G. Jones, G.P.
Peterson, Comparison study of liquid replenishing impacts on critical heat flux and heat
transfer coefficient of nucleate pool boiling on multiscale modulated porous structures,
Int. J. Heat Mass Transf. 54 (2011) 3146–3155.
https://doi.org/10.1016/j.ijheatmasstransfer.2011.03.062.
[22] A. Zou, S.C. Maroo, Critical height of micro/nano structures for pool boiling heat
transfer enhancement, Appl. Phys. Lett. 103 (2013) 221602.
https://doi.org/10.1063/1.4833543.

149
[23] A. Jaikumar, S.G. Kandlikar, A. Gupta, Dip Coating of Electrochemically
Generated Graphene and Graphene Oxide Coatings to Enhance Pool Boiling
Performance, Amer Soc Mechanical Engineers, New York, 2016.
[24] S.G. Kandlikar, Enhanced Macroconvection Mechanism With Separate Liquid–
Vapor Pathways to Improve Pool Boiling Performance, J. Heat Transf. 139 (2017)
051501. https://doi.org/10.1115/1.4035247.
[25] S.G. Liter, M. Kaviany, Pool-boiling CHF enhancement by modulated porous-
layer coating: theory and experiment, Int. J. Heat Mass Transf. 44 (2001) 4287–4311.
https://doi.org/10.1016/S0017-9310(01)00084-9.
[26] S.G. Kandlikar, Controlling bubble motion over heated surface through
evaporation momentum force to enhance pool boiling heat transfer, Appl. Phys. Lett. 102
(2013) 051611. https://doi.org/10.1063/1.4791682.
[27] A. Jaikumar, S.G. Kandlikar, Enhanced pool boiling heat transfer mechanisms for
selectively sintered open microchannels, Int. J. Heat Mass Transf. 88 (2015) 652–661.
https://doi.org/10.1016/j.ijheatmasstransfer.2015.04.100.
[28] A. Jaikumar, S.G. Kandlikar, Pool boiling enhancement through bubble induced
convective liquid flow in feeder microchannels, Appl. Phys. Lett. 108 (2016) 041604.
https://doi.org/10.1063/1.4941032.
[29] A. Jaikumar, S.G. Kandlikar, Pool Boiling Inversion on Surfaces With Separate
Liquid-Vapor Pathways And Enhanced Macroconvection Mechanisms, Amer Soc
Mechanical Engineers, New York, 2017.
[30] A. Jaikumar, S.G. Kandlikar, Pool boiling inversion through bubble induced
macroconvection, Appl. Phys. Lett. 110 (2017) 094107.
https://doi.org/10.1063/1.4977557.
[31] A. Jaikumar, S.G. Kandlikar, Ultra-high pool boiling performance and effect of
channel width with selectively coated open microchannels, Int. J. Heat Mass Transf. 95
(2016) 795–805. https://doi.org/10.1016/j.ijheatmasstransfer.2015.12.061.
[32] E.G. Colgan, B. Furman, M. Gaynes, W.S. Graham, N.C. LaBianca, J.H.
Magerlein, R.J. Polastre, M.B. Rothwell, R.J. Bezama, R. Choudhary, K.C. Marston, H.
Toy, J. Wakil, J.A. Zitz, R.R. Schmidt, A practical implementation of silicon
microchannel coolers for high power chips, Ieee Trans. Compon. Packag. Technol. 30
(2007) 218–225. https://doi.org/10.1109/TCAPT.2007.897977.
[33] D. Tuckerman, R. Pease, High-Performance Heat Sinking for Vlsi, Electron
Device Lett. 2 (1981) 126–129.

150
[34] A. Kalani, S.G. Kandlikar, Evaluation of Pressure Drop Performance During
Enhanced Flow Boiling in Open Microchannels With Tapered Manifolds, J. Heat Transf.-
Trans. Asme. 136 (2014) 051502. https://doi.org/10.1115/1.4026306.
[35] T. Zhang, T. Tong, J.-Y. Chang, Y. Peles, R. Prasher, M.K. Jensen, J.T. Wen, P.
Phelan, Ledinegg instability in microchannels, Int. J. Heat Mass Transf. 52 (2009) 5661–
5674. https://doi.org/10.1016/j.ijheatmasstransfer.2009.09.008.
[36] K. Balasubramanian, P.S. Lee, L.W. Jin, S.K. Chou, C.J. Teo, S. Gao,
Experimental investigations of flow boiling heat transfer and pressure drop in straight and
expanding microchannels - A comparative study, Int. J. Therm. Sci. 50 (2011) 2413–
2421. https://doi.org/10.1016/j.ijthermalsci.2011.07.007.
[37] A. Mukherjee, S.G. Kandlikar, Numerical study of the effect of inlet constriction
on bubble growth during flow boiling in microchannels, Amer Soc Mechanical
Engineers, New York, 2005.
[38] A. Mukherjee, S.G. Kandlikar, The effect of inlet constriction on bubble growth
during flow boiling in microchannels, Int. J. Heat Mass Transf. 52 (2009) 5204–5212.
https://doi.org/10.1016/j.ijheatmasstransfer.2009.04.025.
[39] C.T. Lu, C. Pan, Stabilization of flow boiling in microchannel heat sinks with a
diverging cross-section design, J. Micromechanics Microengineering. 18 (2008) 075035.
https://doi.org/10.1088/0960-1317/18/7/075035.
[40] Y.K. Prajapati, M. Pathak, Mohd. Kaleem Khan, A comparative study of flow
boiling heat transfer in three different configurations of microchannels, Int. J. Heat Mass
Transf. 85 (2015) 711–722. https://doi.org/10.1016/j.ijheatmasstransfer.2015.02.016.
[41] A. Kalani, S.G. Kandlikar, Preliminary Results of Pressure Drop Modeling
During Flow Boiling in Open Microchannels with Uniform and Tapered Manifolds
(OMM), Amer Soc Mechanical Engineers, New York, 2014.
[42] A. Kalani, S.G. Kandlikar, Pressure Drop Analysis Using the Homogeneous
Model for Open Microchannel with Manifold (OMM), Amer Soc Mechanical Engineers,
New York, 2014.
[43] S.G. Kandlikar, T. Widger, A. Kalani, V. Mejia, Enhanced Flow Boiling Over
Open Microchannels With Uniform and Tapered Gap Manifolds, J. Heat Transf.-Trans.
Asme. 135 (2013) 061401. https://doi.org/10.1115/1.4023574.
[44] A. Kalani, S.G. Kandlikar, Combining liquid inertia with pressure recovery from
bubble expansion for enhanced flow boiling, Appl. Phys. Lett. 107 (2015) 181601.
https://doi.org/10.1063/1.4935211.
151
[45] A. Kalani, S.G. Kandlikar, Flow patterns and heat transfer mechanisms during
flow boiling over open microchannels in tapered manifold (OMM), Int. J. Heat Mass
Transf. 89 (2015) 494–504. https://doi.org/10.1016/j.ijheatmasstransfer.2015.05.070.
[46] A.A. Chehade, H. Louahlia-Gualous, S. Le Masson, I. Victor, N. Abouzahab-
Damaj, Experimental investigation of thermosyphon loop thermal performance, Energy
Convers. Manag. 84 (2014) 671–680. https://doi.org/10.1016/j.enconman.2014.04.092.
[47] A. Franco, S. Filippeschi, Experimental analysis of Closed Loop Two Phase
Thermosyphon (CLTPT) for energy systems, Exp. Therm. Fluid Sci. 51 (2013) 302–311.
https://doi.org/10.1016/j.expthermflusci.2013.08.013.
[48] A. Pal, Y.K. Joshi, M.H. Beitelmal, C.D. Patel, T.M. Wenger, Design and
performance evaluation of a compact thermosyphon, IEEE Trans. Compon. Packag.
Technol. 25 (2002) 601–607. https://doi.org/10.1109/TCAPT.2002.807997.
[49] N. Lamaison, C.L. Ong, J.B. Marcinichen, J.R. Thome, Two-phase mini-
thermosyphon electronics cooling: Dynamic modeling, experimental validation and
application to 2U servers, Appl. Therm. Eng. 110 (2017) 481–494.
https://doi.org/10.1016/j.applthermaleng.2016.08.198.
[50] A. Samba, H. Louahlia-Gualous, S. Le Masson, D. Nörterhäuser, Two-phase
thermosyphon loop for cooling outdoor telecommunication equipments, Appl. Therm.
Eng. 50 (2013) 1351–1360. https://doi.org/10.1016/j.applthermaleng.2012.05.023.
[51] S.H. Noie, Heat transfer characteristics of a two-phase closed thermosyphon,
Appl. Therm. Eng. 25 (2005) 495–506.
https://doi.org/10.1016/j.applthermaleng.2004.06.019.
[52] T. Saenen, M. Baelmans, Size effects of a portable two-phase electronics cooling
loop, Appl. Therm. Eng. 50 (2013) 1174–1185.
https://doi.org/10.1016/j.applthermaleng.2012.08.048.
[53] R.L. Webb, S. Yamauchi, S. Denko, Test results on a thermo-syphon concept to
high-power cool desktop computers and servers, in: Eighteenth Annu. Ieee Semicond.
Therm. Meas. Manag. Symp. Proc. 2002, Ieee, New York, 2002: pp. 151–158.
[54] R.L. Webb, S. Yamauchi, S. Denko, K.K. Tochigi, Remote heat sink concept for
high power heat rejection, Ieee Trans. Compon. Packag. Technol. 25 (2002) 608–614.
https://doi.org/10.1109/TCAPT.2003.809109.
[55] P.E. Tuma, Evaporator/boiler design for thermosyphons utilizing segregated
hydrofluoroether working fluids, in: P. Wesling, K. Erickson (Eds.), Twenty Second

152
Annu. IEEE Semicond. Therm. Meas. Manag. Symp. Proc. 2006, Ieee, New York, 2006:
pp. 69–77.
[56] M. Moura, E. Teodori, A.S. Moita, A.L.N. Moreira, 2 Phase Microprocessor
Cooling System with Controlled Pool Boiling of Dielectrics over Micro-andNano
Structured Integrated Heat Spreaders, in: 2016 15th Ieee Intersoc. Conf. Therm.
Thermomechanical Phenom. Electron. Syst. Itherm, Ieee, New York, 2016: pp. 378–387.
[57] R. Furberg, R. Khodabandeh, B. Palm, S. Li, M. Toprak, M. Muhammed,
Experimental Investigation of an Evaporator Enhanced With a Micro-Porous Structure in
a Two-Phase Thermosyphon Loop, (2008) 327–334. https://doi.org/10.1115/HT2008-
56471.
[58] R. Khodabandeh, B. Palm, Influence of system pressure on the boiling heat
transfer coefficient in a closed two-phase thermosyphon loop, Int. J. Therm. Sci. 41
(2002) 619–624. https://doi.org/10.1016/S1290-0729(02)01355-8.
[59] V. Tsoi, S.W. Chang, K.F. Chiang, C.C. Huang, Thermal performance of plate-
type loop thermosyphon at sub-atmospheric pressures, Appl. Therm. Eng. 31 (2011)
2556–2567. https://doi.org/10.1016/j.applthermaleng.2011.04.021.
[60] J.G. Collier, J.R. Thome, Convective Boiling and Condensation, Clarendon Press,
1994.
[61] S.G. Kandlikar, A General Correlation for Saturated Two-Phase Flow Boiling
Heat Transfer Inside Horizontal and Vertical Tubes, J. Heat Transf. 112 (1990) 219–228.
https://doi.org/10.1115/1.2910348.
[62] A. Kalani, S.G. Kandlikar, Effect of taper on pressure recovery during flow
boiling in open microchannels with manifold using homogeneous flow model, Int. J. Heat
Mass Transf. 83 (2015) 109–117.
https://doi.org/10.1016/j.ijheatmasstransfer.2014.11.080.
[63] W.H. MCADAMS, Vaporization inside horizontal tubes-II, Benzene oil mixtures,
Trans ASME. 64 (1942) 193–200.
[64] A. Chauhan, S.G. Kandlikar, High Heat Flux Dissipation Using Symmetric Dual-
Taper Manifold in Pool Boiling, in: ICNMM2019, ASME 2019 17th International
Conference on Nanochannels, Microchannels, and Minichannels, 2019.
https://doi.org/10.1115/ICNMM2019-4292.
[65] A. Chauhan, S.G. Kandlikar, Transforming pool boiling into self-sustained flow
boiling through bubble squeezing mechanism in tapered microgaps, Appl. Phys. Lett. 116
(2020) 081601. https://doi.org/10.1063/1.5141357.
153
[66] T.S. Emery, S.G. Kandlikar, Pool boiling with four non-ozone depleting
refrigerants and comparison with previously established correlations, Exp. Therm. Fluid
Sci. 85 (2017) 132–139. https://doi.org/10.1016/j.expthermflusci.2017.02.027.
[67] A. Chauhan, S.G. Kandlikar, Effect of Liquid Volume on Thermosiphon Loop
Performance Using Open Microchannels Manifold for CPU Cooling in Data Center, in:
ASME 2017 15th Int. Conf. Nanochannels Microchannels Minichannels, ASME,
Cambridge, Massachusetts, USA, 2017: p. V001T05A002.
https://doi.org/10.1115/ICNMM2017-5529.
[68] S.R. Thangavelu, A. Myat, A. Khambadkone, Energy optimization methodology
of multi-chiller plant in commercial buildings, Energy. 123 (2017) 64–76.
https://doi.org/10.1016/j.energy.2017.01.116.
[69] M. Matkovic, A. Cavallini, D. Del Col, L. Rossetto, Experimental study on
condensation heat transfer inside a single circular minichannel, Int. J. Heat Mass Transf.
52 (2009) 2311–2323. https://doi.org/10.1016/j.ijheatmasstransfer.2008.11.013.
[70] S.G. Kandlikar, Nucleation characteristics and stability considerations during
flow boiling in microchannels, Exp. Therm. Fluid Sci. 30 (2006) 441–447.
https://doi.org/10.1016/j.expthermflusci.2005.10.001.
[71] A. Kalani, S.G. Kandlikar, Flow patterns and heat transfer mechanisms during
flow boiling over open microchannels in tapered manifold (OMM), Int. J. Heat Mass
Transf. 89 (2015) 494–504. https://doi.org/10.1016/j.ijheatmasstransfer.2015.05.070.
[72] B.B. Mikic, W.M. Rohsenow, P. Griffith, On bubble growth rates, Int. J. Heat
Mass Transf. 13 (1970) 657–666. https://doi.org/10.1016/0017-9310(70)90040-2.
[73] S.G. Kandlikar, A Theoretical Model to Predict Pool Boiling CHF Incorporating
Effects of Contact Angle and Orientation, J. Heat Transf. 123 (2001) 1071–1079.
https://doi.org/10.1115/1.1409265.
[74] A. Mukherjee, S.G. Kandlikar, Numerical simulation of growth of a vapor bubble
during flow boiling of water in a microchannel, Microfluid. Nanofluidics. 1 (2005) 137–
145. https://doi.org/10.1007/s10404-004-0021-8.

154
Appendix
Air, and Water Based Coolers
Air based cooler: The air-based cooler used in this study is a 296 g, 2.4 W SilenX EFZ-
80HA2 CPU cooler. The actual images of this air cooler is shown in Fig. 72. The cooler is
placed in direct contact with the CPU’s heat spreader, and arctic silver thermal past is used
between the air cooler and heat spreader. The cooler has a copper base with dimensions 45
mm ⨯ 35.5 mm and a secondary fin array containing 32 fins (4 row x 8 columns) is also
attached on the top of copper base. The measurement of each fin are 4.1 mm ⨯ 10 mm ⨯
1.5 mm. There are four copper heat pipes attached on the copper base, these heat pipes run
through a primary metallic fin array over the base of the cooler. The outside diameter of
each pipe is 6mm. These metallic fins are cooled using a 2.4 W fan with a diameter 80mm.
The projected area of the metallic fins along the air flow direction is 6.7 mm ⨯ 76.7 mm.
There are 36 fins arranged linearly, and the thickness of each is 6 mm. The heat from the
CPU conducts into the secondary fin array, but most heat is transferred into the heat pipes.
The heat from heat pipes is transferred to the primary fin array, which are cooled by forced
convection using the fan.
Figure 72: The actual images of air based cooler used in this study.

155
Water based cooler: The water based cooler used in this study is a 2.5 W Dell Alienware
Area 51 W550R PP749 CPU cooler. The two major components in the cooler are the pump,
and a fan cooled radiator as shown in Fig. 73. The pump is secured on the CPU with a
copper base in direct contact with the CPU’s heat spreader. The dimensions of the copper
base are 32mm ⨯ 34.6mm. The copper base has microchannels on the opposite side which
are contained in the pump enclosure. The heat is conducted from the CPU to the
microchannels via copper base, and is transferred to the cooling water flowing through the
microchannels. The warm water at the outlet of the microchannels is supplied to an external
fan cooled radiator. The radiator contains a fin arrangement with projected area of 110mm
⨯ 118mm along the air flow direction. The total surface area of the fins is 1478 cm2. The
water flowing through the radiator is cooled using an external fan, and the cold water is
supplied back to the microchannels.
Figure 73: The actual images of water-based cooler used in this study.

156
MATLAB code for calculating net pressure drop in tapered microgap An example of 20° taper angle with 0.8 mm inlet gap height and HFE7000 as the
working fluid is considered here.
%Homogeneous flow model and HTC correlation%
%Design parameters%
amm=20; %taper angle in degrees
hmm=0.8; %inlet gap in mm
zmm=4.5; %flow length in mm
wmm=10; %flow width in mm
%Fluid paramters
rhol=1378.55; %Liquid density (HFE7000) at saturation in kg/m^3
rhov=8.49565; %Vapor density (HFE7000) at 1atm in kg/m^3
hfg=142000; %Laten heat of vaporization (HFE7000) in kJ/kg
mewl=0.00037691; %Dynamic viscosity of liquid (HFE7000) in kg/ms
mewv=0.000011277; %Dynamic viscosity of vapor (HFE7000) in kg/ms
vl=(1/rhol); %Specific volume of liquid
vg=(1/rhov); %Specific volume of vapor
kl=0.063293; %Thermal conductivity of liquid
%Operational parameters
q= 20.06; %Experimental heat flux values in W/cm^2, 8 X 1
htcexp= 12.42; %Experimental heat transfer coefficient values in kW/m^2C, 8 X 1
%Calculation begin%
a=amm*pi/180; %taper angle in radians
h=hmm/1000; %inlet gap in m
z=zmm/1000; %flow length in m
w=wmm/1000; %flow width in m
Ain=w*h;
hout=z*tan(a)+h;
Aout=hout*w;
Ac=(Ain+Aout)/2;
dA=Aout-Ain;
Dh1=4*Ain/(2*w+2*h);
Dh2=4*Aout/(2*w+2*hout);
Dh=(Dh1+Dh2)/2;
dPnet=-0.0001;%Error margin
Vdot= 0; %Initial guess value of volume flow rate in ml/min
nloops=1;
while dPnet<0
Vdot=Vdot+0.1

157
Vdot1=(0.0000001/6)*Vdot; %Volume flow rate in m^3/s
mdot=rhol*Vdot1;
G= mdot/((Ain+Aout)/2);
x=(1/hfg)*(q*(z*100)*(w*100)/mdot);%Exit quality
mewtp=1/((x/mewv)+((1-x)/mewl));%two phase dynamic viscosity in kg/ms using
McAdams et al. equation
ftp=0.079*((G*Dh/mewtp)^-0.25);%two phase friction factor using Blassius equation
dP1=2*ftp*(G^2)/Dh;
dP2=(vg-vl)*x+vl;
dP3=(G^2)*(vg-vl)*(x/z);
dP=dP1*dP2+dP3;
dPloss=40.5;
dPtotal=dP*z+dPloss;
PR1=(2*(G^2)*vl*dA)/(Ac*z);
PR2=((vg-vl)/vl)*x+1;
PR=PR1*PR2;
PRtotal=PR*z;
dPnet=(PRtotal-dPtotal)/1000 %Net pressure drop in kPa
plot(G,dPnet,"r*");
ylim([-0.05 0.05])
ylabel("Pressure Drop (kPa)")
xlabel("Mass Flux(kg/m^2s)")
pause(0.05)
nloops=nloops+1
end

158
Uncertainty Calculation
The uncertainty analysis similar to that of Emery and Kandlikar [66] was performed for a
95% confidence level for all the recorded data points. The two types of uncertainties
considered in this study were, (a) bias error (By), and (b) precision error (Py). The total
uncertainty (Uy) can be calculated using Eq. 16 as shown below.
𝑼𝒚 = √𝑩𝒚𝟐 + 𝑷𝒚
𝟐 (16)
The sources of error in the experimental study are thermocouples, thermal conductivity of
the copper, and length measurements. The bias error of the thermocouples was determined
by calculating the standard deviation of the temperature readings during the calibration
process. The calibration process was conducted using a hot cell over a range of known
steady state temperature values. The standard deviation value was doubled to obtain the
bias error for 95% confidence interval. The precision error of the thermocouples was
determined by doubling the standard deviation of the temperature values during the
experiments for each steady state condition. The bias uncertainties of the thermal
conductivity of copper and length measurements were 9 W/m°C and 10-4 m, respectively.
The precision or bias errors for the calculated parameters – heat flux, wall superheat,
surface temperature, and HTC were calculated using the following general equation.
𝑼𝒑 = √∑ (𝝏𝒑
𝝏𝝈𝒊𝑼𝝈𝒊)
𝟐𝒏𝒊=𝟏 (17)
Where p is any property dependent on independent variable σ over n samples.

159
Derivation of Heat Flux Uncertainty
The relation for heat flux, measured from the three heater block thermocouples, is
computed from Eqns. (11) and (12) in Chapter 5, and shown below in Eqn. (18)
𝒒′′ = −𝒌𝑪𝒖 (𝟑𝑻𝟏 − 𝟒𝑻𝟐 + 𝑻𝟑
𝟐𝜟𝒙) (18)
The variables in Eq. (18) are substituted into the general equation, as shown earlier in
Eq.(17), and the following Eq.(19) is obtained.
𝑼𝒒"
𝒒"=
√(
𝝏𝒒"𝝏𝒌𝑪𝒖
𝑼𝒌𝑪𝒖)
𝟐
+ (𝝏𝒒"𝝏𝜟𝒙
𝑼𝜟𝒅)𝟐
+ (𝝏𝒒"𝝏𝑻𝟏
𝑼𝑻𝟏)
𝟐
+ (𝝏𝒒"𝝏𝑻𝟐
𝑼𝑻𝟐)
𝟐
+ (𝝏𝒒"𝝏𝑻𝟑
𝑼𝑻𝟑)
𝟐
𝒒"𝟐
(19)
A new parameter (𝛼) is defined as shown in Eq.(20) for simplifying the next calculation
steps.
𝜶 = 𝟑𝑻𝟏 − 𝟒𝑻𝟐 + 𝑻𝟑 (20)
The various partial differential expressions in Eq.(19) are calculated using Eq.(18). These
calculations are shown below.
𝝏𝒒"
𝝏𝒌𝑪𝒖= −
𝜶
𝟐𝜟𝒙=
𝒒"
𝒌𝑪𝒖 (21)
𝝏𝒒"
𝝏𝜟𝒙= −𝒌𝑪𝒖
𝜶
−𝟐𝜟𝒙𝟐= −
𝒒"
𝜟𝒙 (22)
𝝏𝒒"
𝝏𝑻𝟏= −𝒌𝑪𝒖
𝟑
𝟐𝜟𝒙=
𝟑𝒒"
𝜶
(23)
𝝏𝒒"
𝝏𝑻𝟐= −𝒌𝑪𝒖
−𝟒
𝟐𝜟𝒙= −
𝟒𝒒"
𝜶
(24)
𝝏𝒒"
𝝏𝑻𝟑=
−𝒌𝑪𝒖
𝟐𝜟𝒙=
𝒒"
𝜶
(25)

160
The partial differential terms in Eqns. (21-25) are substituted back into Eq. (19) and
following Eq. (26) is obtained.
𝑼𝒒"
𝒒"=
√(
𝒒"𝒌𝑪𝒖
𝑼𝒌𝑪𝒖)
𝟐
+ (−𝒒"𝜟𝒅
𝑼𝜟𝒅)𝟐
+ (𝟑𝒒"𝜶
𝑼𝑻𝟏)
𝟐
+ (−𝟒𝒒"𝜶
𝑼𝑻𝟐)
𝟐
+ (𝒒"𝜶
𝑼𝑻𝟑)
𝟐
𝒒"𝟐
(26)
Eq.(26) is further simplified in two steps to obtain Eq.(28) as shown below. This simplified
form is used to calculate uncertainty percentage, and the absolute error values are shown
as error bars in the results section.
𝑼𝒒"
𝒒"=
√
𝒒"𝟐
𝒌𝑪𝒖𝟐 𝑼𝒌𝑪𝒖
𝟐 +𝒒"𝟐
𝜟𝒙𝟐 𝑼𝜟𝒙𝟐 +
𝟗𝒒"𝟐
𝜶𝟐 𝑼𝑻𝟏
𝟐 +𝟏𝟔𝒒"𝟐
𝜶𝟐 𝑼𝑻𝟐
𝟐 +𝒒"𝟐
𝜶𝟐 𝑼𝑻𝟑
𝟐
𝒒"𝟐
(27)
𝑼𝒒"
𝒒"= √
𝑼𝒌𝑪𝒖
𝟐
𝒌𝑪𝒖𝟐 +
𝑼𝒅𝟐
𝜟𝒅𝟐+
𝟗𝑼𝑻𝟏
𝟐
𝜶𝟐+
𝟏𝟔𝑼𝑻𝟐
𝟐
𝜶𝟐+
𝑼𝑻𝟑
𝟐
𝜶𝟐 (28)
Derivation of Chip Surface Temperature (Ts) Uncertainty
The uncertainty in heat flux is calculated using Eqns. (11) and (13) from Chapter 5 and Eq.
(17). Using Eqns. (11) and (13), following Eq. (29) is obtained.
𝑻𝒔 = 𝑻𝟒 −𝒒"
𝒌𝑪𝒖𝒙𝟏 (29)
The variables in Eq.(29) are substituted into the Eq. (17), as shown below in Eq. (30)
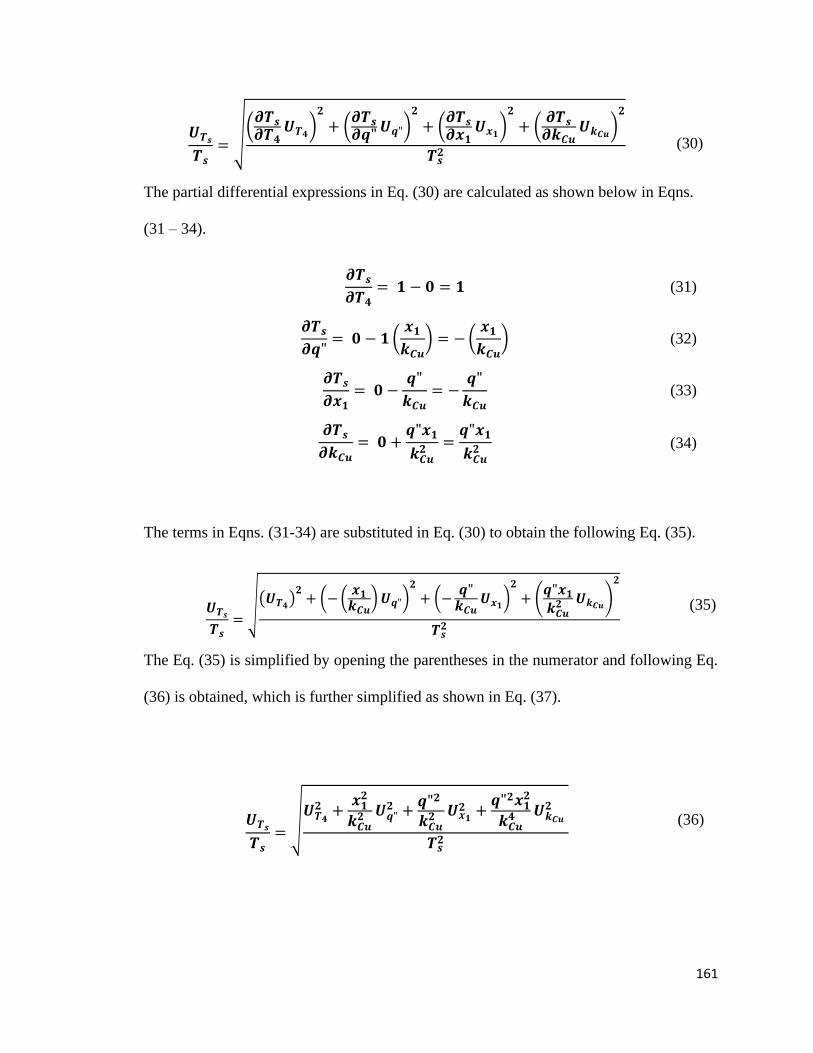
161
𝑼𝑻𝒔
𝑻𝒔=
√(
𝝏𝑻𝒔
𝝏𝑻𝟒𝑼𝑻𝟒
)𝟐
+ (𝝏𝑻𝒔
𝝏𝒒"𝑼𝒒")
𝟐
+ (𝝏𝑻𝒔
𝝏𝒙𝟏𝑼𝒙𝟏
)𝟐
+ (𝝏𝑻𝒔
𝝏𝒌𝑪𝒖𝑼𝒌𝑪𝒖
)𝟐
𝑻𝒔𝟐
(30)
The partial differential expressions in Eq. (30) are calculated as shown below in Eqns.
(31 – 34).
𝝏𝑻𝒔
𝝏𝑻𝟒= 𝟏 − 𝟎 = 𝟏 (31)
𝝏𝑻𝒔
𝝏𝒒"= 𝟎 − 𝟏 (
𝒙𝟏
𝒌𝑪𝒖) = − (
𝒙𝟏
𝒌𝑪𝒖) (32)
𝝏𝑻𝒔
𝝏𝒙𝟏= 𝟎 −
𝒒"
𝒌𝑪𝒖= −
𝒒"
𝒌𝑪𝒖 (33)
𝝏𝑻𝒔
𝝏𝒌𝑪𝒖= 𝟎 +
𝒒"𝒙𝟏
𝒌𝑪𝒖𝟐 =
𝒒"𝒙𝟏
𝒌𝑪𝒖𝟐 (34)
The terms in Eqns. (31-34) are substituted in Eq. (30) to obtain the following Eq. (35).
𝑼𝑻𝒔
𝑻𝒔=
√(𝑼𝑻𝟒)
𝟐+ (− (
𝒙𝟏𝒌𝑪𝒖
) 𝑼𝒒")𝟐
+ (−𝒒"
𝒌𝑪𝒖𝑼𝒙𝟏
)𝟐
+ (𝒒"𝒙𝟏
𝒌𝑪𝒖𝟐 𝑼𝒌𝑪𝒖
)
𝟐
𝑻𝒔𝟐
(35)
The Eq. (35) is simplified by opening the parentheses in the numerator and following Eq.
(36) is obtained, which is further simplified as shown in Eq. (37).
𝑼𝑻𝒔
𝑻𝒔=
√𝑼𝑻𝟒
𝟐 +𝒙𝟏
𝟐
𝒌𝑪𝒖𝟐 𝑼𝒒"
𝟐 +𝒒"𝟐
𝒌𝑪𝒖𝟐 𝑼𝒙𝟏
𝟐 +𝒒"𝟐𝒙𝟏
𝟐
𝒌𝑪𝒖𝟒 𝑼𝒌𝑪𝒖
𝟐
𝑻𝒔𝟐
(36)

162
𝑼𝑻𝒔
𝑻𝒔= √
𝑼𝑻𝟒
𝟐
𝑻𝒔𝟐
+𝑼𝒒"
𝟐 𝒙𝟏𝟐
𝒌𝑪𝒖𝟐 𝑻𝒔
𝟐+
𝑼𝒙𝟏𝟐 𝒒"𝟐
𝒌𝑪𝒖𝟐 𝑻𝒔
𝟐+
𝑼𝒌𝑪𝒖
𝟐 𝒒"𝟐𝒙𝟏𝟐
𝒌𝑪𝒖𝟒 𝑻𝒔
𝟐 (37)
Eq. (37) is used to calculate the percentage uncertainty in the surface temperature. The
uncertainty in heat flux which is used in this expression can be obtained from Eq. (28).
Derivation of Heat Transfer Coefficient (HTC) Uncertainty
In this derivation the HTC is shown by the parameter ‘h’ to make the equations simple.
Using Eqns. (14 and 15), following Eq.38 is obtained to calculate the HTC (h).
𝒉 =𝒒"
𝑻𝒔 − 𝑻𝒔𝒂𝒕 (38)
The variables in Eq. (38) are substituted in Eq. (17) and following Eq. (39) is obtained.
𝑼𝒉
𝒉=
√(𝝏𝒉𝝏𝒒"
𝑼𝒒")𝟐
+ (𝝏𝒉𝝏𝑻𝒔
𝑼𝑻𝒔)
𝟐
+ (𝝏𝒉
𝝏𝑻𝒔𝒂𝒕𝑼𝑻𝒔𝒂𝒕
)𝟐
𝒉𝟐 (39)
The partial differential expressions in Eq. (39) are calculated as shown below in Eqns.
(40 – 42).
𝝏𝒉
𝝏𝒒"=
𝟏
𝑻𝒔 − 𝑻𝒔𝒂𝒕=
𝒉
𝒒" (40)
𝝏𝒉
𝝏𝑻𝒔= −
𝒒"
(𝑻𝒔 − 𝑻𝒔𝒂𝒕)𝟐= −
𝒉
(𝑻𝒔 − 𝑻𝒔𝒂𝒕) (41)
𝝏𝒉
𝝏𝑻𝒔𝒂𝒕=
𝒒"
(𝑻𝒔 − 𝑻𝒔𝒂𝒕)𝟐=
𝒉
(𝑻𝒔 − 𝑻𝒔𝒂𝒕) (42)
The partial differential terms in Eqns. (40-42) are substituted in Eq. (39) to obtain the
following Eq. (43).
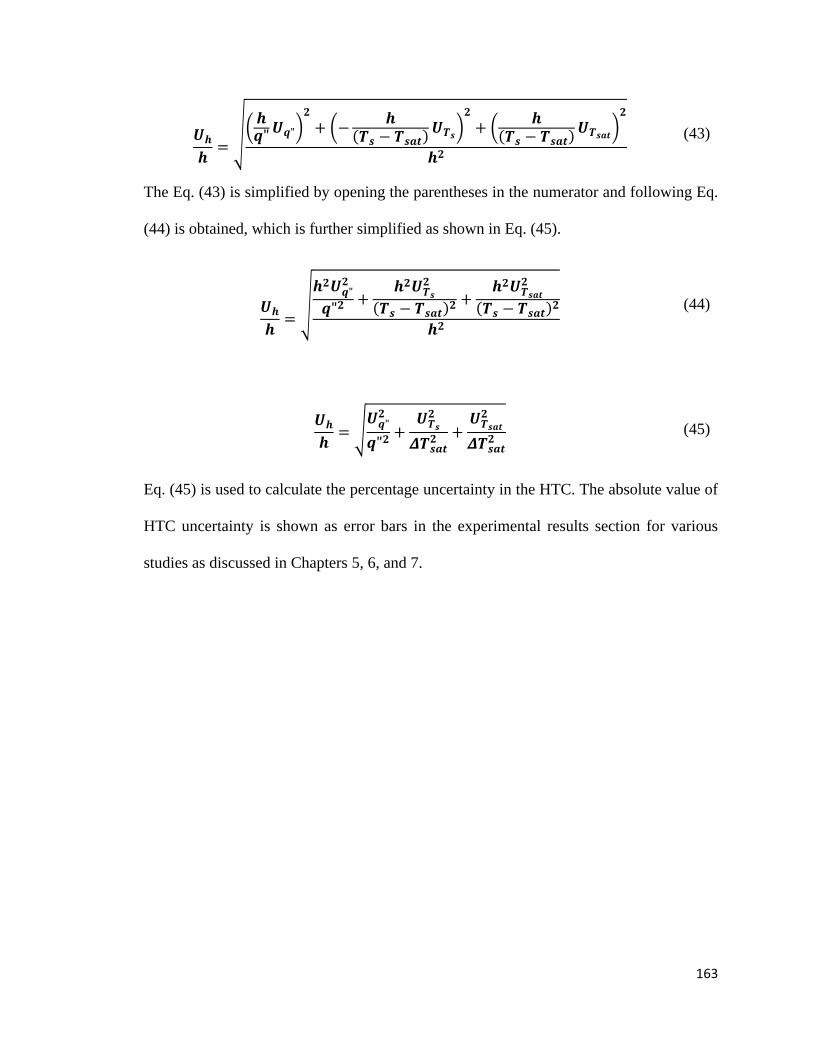
163
𝑼𝒉
𝒉=
√(𝒉𝒒"
𝑼𝒒")𝟐
+ (−𝒉
(𝑻𝒔 − 𝑻𝒔𝒂𝒕)𝑼𝑻𝒔
)𝟐
+ (𝒉
(𝑻𝒔 − 𝑻𝒔𝒂𝒕)𝑼𝑻𝒔𝒂𝒕
)𝟐
𝒉𝟐
(43)
The Eq. (43) is simplified by opening the parentheses in the numerator and following Eq.
(44) is obtained, which is further simplified as shown in Eq. (45).
𝑼𝒉
𝒉=
√𝒉𝟐𝑼𝒒"
𝟐
𝒒"𝟐 +𝒉𝟐𝑼𝑻𝒔
𝟐
(𝑻𝒔 − 𝑻𝒔𝒂𝒕)𝟐 +𝒉𝟐𝑼𝑻𝒔𝒂𝒕
𝟐
(𝑻𝒔 − 𝑻𝒔𝒂𝒕)𝟐
𝒉𝟐
(44)
𝑼𝒉
𝒉= √
𝑼𝒒"𝟐
𝒒"𝟐+
𝑼𝑻𝒔
𝟐
𝜟𝑻𝒔𝒂𝒕𝟐 +
𝑼𝑻𝒔𝒂𝒕
𝟐
𝜟𝑻𝒔𝒂𝒕𝟐 (45)
Eq. (45) is used to calculate the percentage uncertainty in the HTC. The absolute value of
HTC uncertainty is shown as error bars in the experimental results section for various
studies as discussed in Chapters 5, 6, and 7.