
Hierarchies in Communities of BorsaIstanbul Stock Exchange
19
Hierarchies in Communities of Borsa Istanbul Stock Exchange Mehmet Ali Balcı *† Abstract Nowadays, increase of the analyzing stock markets as complex systems lead graph theory to play key role. For instance detecting graph com- munities is an important task in the analysis of stocks, and minimum spanning trees let us to get important information for the topology of the market. In this paper, we introduce a method to build a con- nected graph representation of Borsa Istanbul based on the spectrum. We, then, detect graph communities and internal hierarchies by using the minimum spanning trees. The results suggest that the approach is demonstrably effective for Borsa Istanbul sessionally data returns. Keywords: Financial Networks, Graph Communities, Hierarchy Structures, Spectral Graph Theory, Minimum Spanning Trees 2000 AMS Classification: AMS 91B26, 91B80, 62P20, 05C12, 90C35, 05C90 1. Introduction Investigation of financial markets as complex systems is becoming increasingly accepted and recently majored in the statistical analysis of stock interaction net- works. This kind of approach was first directed by Mantegna in [17] using the daily logarithmic price return correlation between of each stocks to obtain hierarchical networks. Analyzing this kind of networks let us to get the topological properties of a market and its core information. By the help of an appropriate metric that is based on the correlation distance, a connected graph in which vertices represent stocks can be build and the generated minimum spanning trees would yield the hierarchies. Since companies interact with each other by cooperation and competition, finan- cial markets can be characterized as evolving complex systems [2]. In [3], authors briefly introduced that empirical trees obtained from surrogated data simulated by using simple market models has features of a complex network that cannot be reproduce by a random market model and by the widespread one-factor model. By using the certain geometric measures, generalization of motif scores and clus- tering coefficient to weighted networks, and its application to complex networks such as financial markets and metabolic networks are considered in [25]. Lately, the minimum spanning tree techniques and theory of complex networks are used to study dynamics of financial networks [5, 22, 24]. In [23], authors showed that the length of minimum spanning trees shrinks during a stock market crisis and * Muˇgla Sıtkı Ko¸ cman University, Faculty of Science, Department of Mathematics, Email: [email protected] † Corresponding Author.
Transcript of Hierarchies in Communities of BorsaIstanbul Stock Exchange

Hierarchies in Communities of Borsa IstanbulStock Exchange
Mehmet Ali Balcı∗†
Abstract
Nowadays, increase of the analyzing stock markets as complex systems
lead graph theory to play key role. For instance detecting graph com-
munities is an important task in the analysis of stocks, and minimum
spanning trees let us to get important information for the topology
of the market. In this paper, we introduce a method to build a con-
nected graph representation of Borsa Istanbul based on the spectrum.
We, then, detect graph communities and internal hierarchies by using
the minimum spanning trees. The results suggest that the approach is
demonstrably effective for Borsa Istanbul sessionally data returns.
Keywords: Financial Networks, Graph Communities, Hierarchy Structures,Spectral Graph Theory, Minimum Spanning Trees
2000 AMS Classification: AMS 91B26, 91B80, 62P20, 05C12, 90C35, 05C90
1. Introduction
Investigation of financial markets as complex systems is becoming increasinglyaccepted and recently majored in the statistical analysis of stock interaction net-works. This kind of approach was first directed by Mantegna in [17] using the dailylogarithmic price return correlation between of each stocks to obtain hierarchicalnetworks. Analyzing this kind of networks let us to get the topological propertiesof a market and its core information. By the help of an appropriate metric that isbased on the correlation distance, a connected graph in which vertices representstocks can be build and the generated minimum spanning trees would yield thehierarchies.
Since companies interact with each other by cooperation and competition, finan-cial markets can be characterized as evolving complex systems [2]. In [3], authorsbriefly introduced that empirical trees obtained from surrogated data simulatedby using simple market models has features of a complex network that cannot bereproduce by a random market model and by the widespread one-factor model.By using the certain geometric measures, generalization of motif scores and clus-tering coefficient to weighted networks, and its application to complex networkssuch as financial markets and metabolic networks are considered in [25]. Lately,the minimum spanning tree techniques and theory of complex networks are usedto study dynamics of financial networks [5, 22, 24]. In [23], authors showed thatthe length of minimum spanning trees shrinks during a stock market crisis and
∗Mugla Sıtkı Kocman University, Faculty of Science, Department of Mathematics, Email:[email protected]
†Corresponding Author.
2
reconfiguration takes place strongly. Most of these studies show that stocks aretending to group in clusters and motive us to study graph communities in financialmarkets. Graph communities can be seen as vertex clusters which probably sharecommon properties and/or play similar roles within the graph [11]. The inter-nal hierarchical tree characterization of graph communities can be used to analyzeeach agent of the network that shares important features and to understand deeplyevolution of the financial markets. Clusters of companies are identified by meansof minimum spanning tree. However, this kind of clustering may bring us theloss of information of hierarchies. To overcome this problem, we study cluster bycommunities and obtain hierarchies by studying the minimum spanning trees ofeach community.
In this paper we study 93 companies that continuously operating in Borsa Is-tanbul 100 Index (XU100) and the exchange rate of USD to TRY from the periodJanuary 2013 to January 2015. There are 100 companies operating in the Index(XU100), since our analysis depend on the dimensional equality of the time se-ries, we choose 93 of them which have trading operations during the chosen timeinterval. To represent this network as a connected graph, we consider each stock’sdaily sessional logarithmic returns which are the ends of midday and day pricesand their Pearson correlations. In section 2, we first present some basics of graphtheory and the spectrum of a graph. The main idea we present in this manuscriptdepends on the multiplicity of the 0 element in the spectrum of the graph. Then,in section 3, the method is presented. This method can be thought as in threesteps. First we build a non-weighted undirected graph representation by studyingthe control parameter which in between 0 and 1. The optimal parameter is thelargest one where the graph becomes with more than one component, i. e., mul-tiplicity of the 0 eigenvalue of the graph is more than 1. Afterwards the obtainednon-weighted graph, we determine the communities as the vertex sets by using thehigh modularity method [1], then obtain hierarchical organization of each stocksby studying the minimal spanning trees [17]. The main results of the methodpresented in Section 4 and also a comparative analysis respect to Planar MaximalFilter Graphs are presented. Finally in Section 5the discussion to the results andthe topology of Borsa Istanbul (BIST ) is given.
2. Preliminaries
An undirected graph G is the tuples (V,E), where V is the set of vertices (ornodes) and E is the set of edges. Each elements of E is an unordered pair ofvertices for an undirected graph G. Strictly speaking, we are considering simplegraphs in which all edges go between distinct vertices and in which there can beat most one undirected edge between a given pair of vertices. For any verticesvi, vj ∈ V the graph G is called connected if there is a path , i.e. a sequence ofedges, whose end points are vi and vj . A simple undirected graph in which everypair of distinct vertices is connected by a unique edge is called complete graph.Given an undirected graph G = (V,E), a vertex cover is a set S subset of V thatis incident to every elements of E. The smallest possible vertex cover for a givengraph G is called minimum vertex cover.

3
In many real world applications, each edge of G has an associated non-negativenumerical value, called a weight. Such a weighted graph can be represented by atriple (V,E,w) where w : E → R
+ is a function mapping edges to a numericalvalue.
An adjacency matrix AG of a graph G is defined by
AG(i, j) =
{
1, if (vi, vj) ∈ E0, otherwise.
Note that the matrix AG is symmetric, thus has an orthonormal basis of eigen-vectors and the number of vertices many eigenvalues, counted with multiplicity[29].
A tree is a graph with no circuits, that is a connected graph that does not involveany sequence of vertices (v1, v2, . . . , vk) such that vi = vj , ∃i, j ∈ {1, . . . , k}. Aspanning tree of a network is a subgraph that connects all the vertices. Amongall the spanning trees of a weighted and connected graph, the one and possiblymore with the least total weight is called a minimum spanning tree (MST ) [13].It can be easily concluded that for an unweighted graph all spanning trees are atthe minimum cost. There are several ways to determine a minimum spanning tree,we refer readers [13] for the history and the solution of the problem.
Degree of vertex in an undirected graph G is the number of edges incident tothe vertex, and let us denote it with dv. By the introducing the degree of a vertexwe can define the discrete analogue of a Laplacian operator for a graph which willlead us to the spectral graph theory. Given an undirected graph G = (V,E), theLaplacian Matrix of G is |V | × |V | matrix whose entries are
LG(i, j) =
dvi , if i = j−1, if AG(i, j) = 10, otherwise.
The Laplacian Matrix LG can also defined as LG = DG − AG, where DG
is diagonal matrix with DG = [dvi ]n×n. It can be also concluded that GraphLaplacian does not depend on an ordering of the vertices of G. Let us now denotethe spectrum of LG by SG = {λ1, . . . , λn} for the graph with |V | = n. TheLaplacian is positive-semidefinite, i.e. all of its eigenvalues have λi ≥ 0 with theleast one 0 [12].
2.1. Theorem. (Number of connected components and the spectrum ofLG) Let G be an undirected graph with nonnegative weights. Then the multiplicity
k of the eigenvalue 0 of LG equals the number of connected components A1, . . . , Ak
in the graph. The eigenspace of eigenvalue 0 is spanned by the indicator vectors
1A1, . . . ,1Ak
of those components.
Proof. See [29]. �
3. Data and The Methodology
In this study, the undirected and unweighted graph based on Pearson Correla-tion Distance of Turkish companies, issued and traded on Borsa Istanbul between2013 and 2014, was algorithmically built.
4
Borsa Istanbul (BIST), formerly called as Istanbul Stock Exchange, startedoperations at the beginning of 1986 and has memberships in various internationalfederations and associations such as the World Federation of Exchanges, Federationof Euro-Asian Stock Exchanges, Federation of European Securities Exchanges, andInternational Capital Market Association [31]. The general trading is regulated in[32]. Trading hours for the Stocks are held by two sessions on business days, andone session in some official holidays.
3.1. Data. The data used in this paper consists of daily data from the periodJanuary 2013 to January 2015. 93 companies operating in Borsa Istanbul 100Index (XU100) and the exchange rate of USD to TRY to validate the method areused throughout the rest of the paper. The daily price limit is set as ±20% ofthe base price which is found by rounding the previous daily settlement price tonearest price tick. If the price limits found by this method is not a valid pricetick, for upper limit it is rounded up, while the lower limit is rounded down to thenearest price tick. Sessionally return is calculated as the logarithmic return in thevalue of index compared to previous session’s closing value as follows:
Cli = logPi(t)− logPi(t− 1),
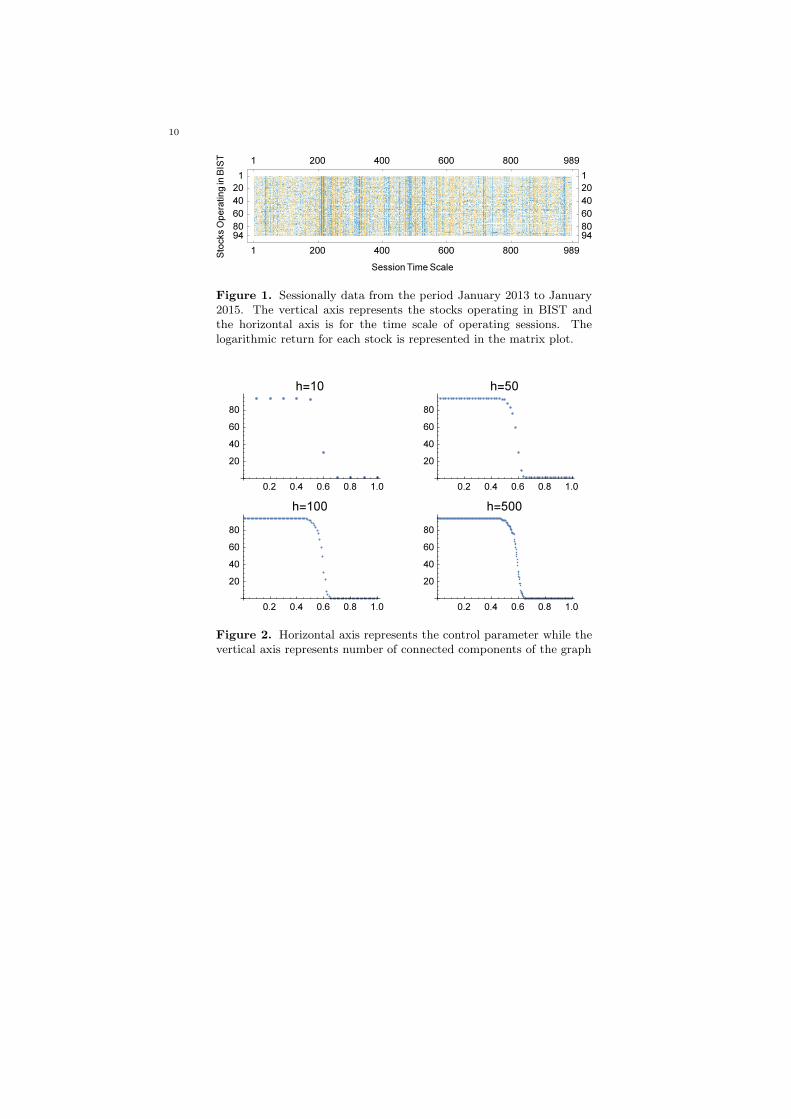
where Pi(t) is the closure price of the stock i at the daily session t.Plot of the logarithmic return data that is presented by temperature mapping
is given in Figure 1.
3.2. Methodology. Graph communities are cluster of vertices that is denselyconnected internally and can be used to analyze the data and links in the network[7, 16]. Community detection in graphs aims to identify these clusters, and theirhierarchies, by using the topology of graph. The most common methods to detectcommunities can be summarized as Minimum-cut method [19, 20], Hierarchicalclustering [15, 27], Girvan-Newman algorithm [21], High modularity [1], and Cliquebased methods [10, 9, 26].
Our method first aims to determine the network topology of stocks by studyingtheir correlations. Rather than the weighted graph representation of the network,we first build a non-weighted graph to catch optimized many links between thestocks. This internally connectedness lead us to detect communities more precisely.For this purpose, we first consider the Pearson correlation of each stock as
ρij =< CliClj > − < Cli >< Clj >
√
(< Cl2i > − < Cli >2)(< Cl2j > − < Clj >2)
where < .. > is a temporal average performed on all the trading days of theinvestigated time period which ranges from January 2, 2013 to December 30,2015, 1 ≤ i, j ≤ n are the numerical labels of stocks, and 1 ≤ t ≤ m. Then todetermine edges, we introduce a distance function respect to correlation coefficientsas CorrDist :=
√
2(1− ρij)/2. Since −1 ≤ ρij ≤ 1, 0 ≤ CorrDist ≤ 1 for all Cli.Our algorithm initially starts with the n-complete graph, i.e. a graph with
only one 0 eigenvalue. Afterwards, we determine the edges by a control parameterwhich is the element of the fraction of [0, 1] interval as the correlation distanceof two stocks is lesser than the control parameter. The way that we choose thecontrol parameter let us to catch highly correlated stocks; i.e., stocks with lesser
5
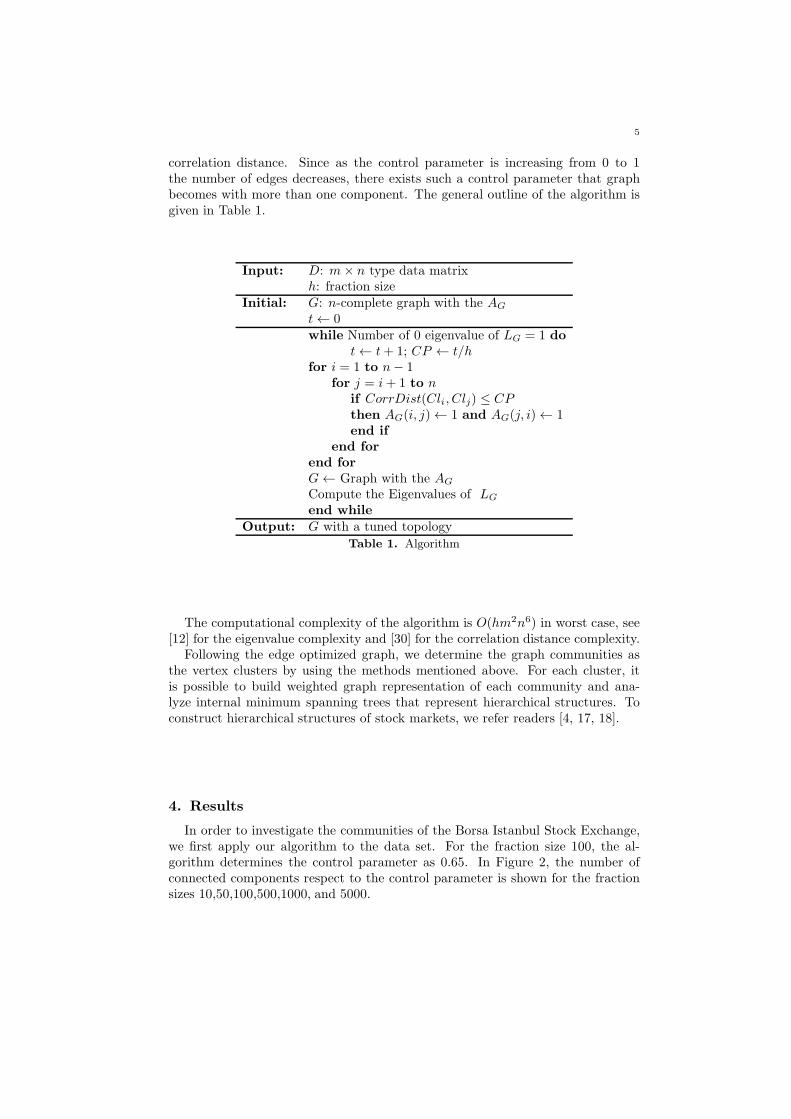
correlation distance. Since as the control parameter is increasing from 0 to 1the number of edges decreases, there exists such a control parameter that graphbecomes with more than one component. The general outline of the algorithm isgiven in Table 1.
Input: D: m× n type data matrixh: fraction size
Initial: G: n-complete graph with the AG
t← 0while Number of 0 eigenvalue of LG = 1 do
t← t+ 1; CP ← t/hfor i = 1 to n− 1
for j = i+ 1 to nif CorrDist(Cli, Clj) ≤ CPthen AG(i, j)← 1 and AG(j, i)← 1end if
end for
end for
G← Graph with the AG
Compute the Eigenvalues of LG
end while
Output: G with a tuned topology
Table 1. Algorithm
The computational complexity of the algorithm is O(hm2n6) in worst case, see[12] for the eigenvalue complexity and [30] for the correlation distance complexity.
Following the edge optimized graph, we determine the graph communities asthe vertex clusters by using the methods mentioned above. For each cluster, itis possible to build weighted graph representation of each community and ana-lyze internal minimum spanning trees that represent hierarchical structures. Toconstruct hierarchical structures of stock markets, we refer readers [4, 17, 18].
4. Results
In order to investigate the communities of the Borsa Istanbul Stock Exchange,we first apply our algorithm to the data set. For the fraction size 100, the al-gorithm determines the control parameter as 0.65. In Figure 2, the number ofconnected components respect to the control parameter is shown for the fractionsizes 10,50,100,500,1000, and 5000.
6
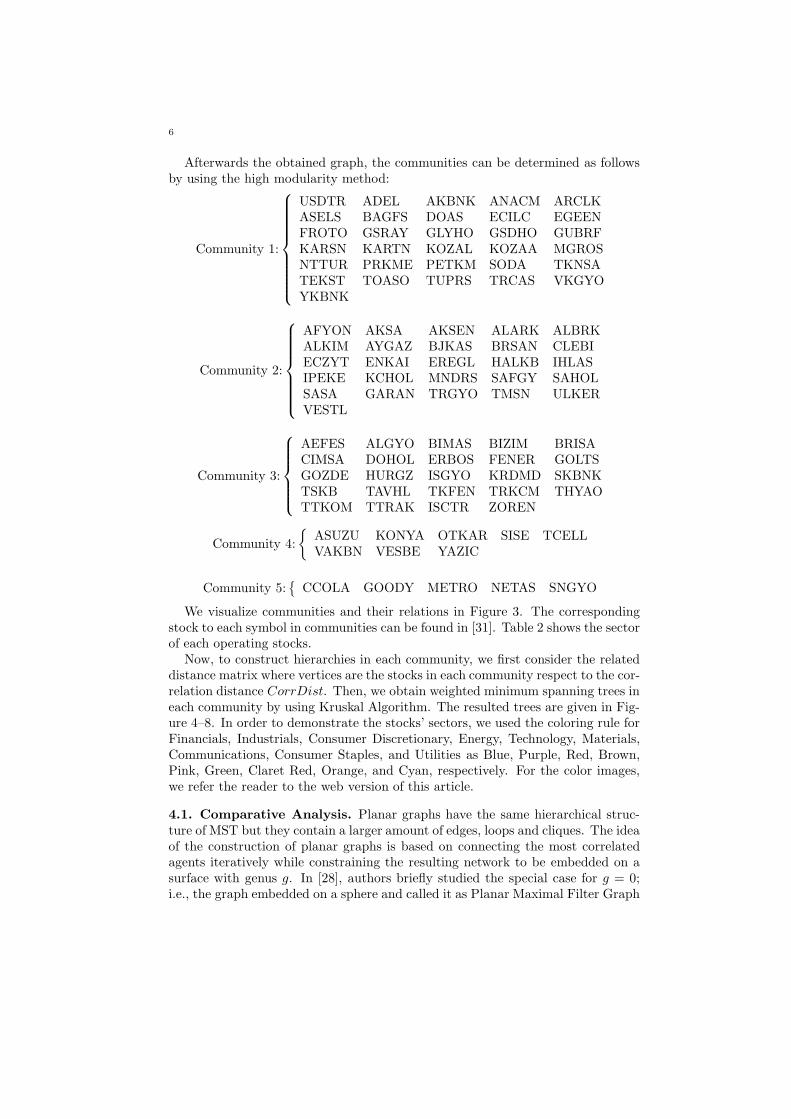
Afterwards the obtained graph, the communities can be determined as followsby using the high modularity method:
Community 1:
USDTR ADEL AKBNK ANACM ARCLKASELS BAGFS DOAS ECILC EGEENFROTO GSRAY GLYHO GSDHO GUBRFKARSN KARTN KOZAL KOZAA MGROSNTTUR PRKME PETKM SODA TKNSATEKST TOASO TUPRS TRCAS VKGYOYKBNK
Community 2:
AFYON AKSA AKSEN ALARK ALBRKALKIM AYGAZ BJKAS BRSAN CLEBIECZYT ENKAI EREGL HALKB IHLASIPEKE KCHOL MNDRS SAFGY SAHOLSASA GARAN TRGYO TMSN ULKERVESTL
Community 3:
AEFES ALGYO BIMAS BIZIM BRISACIMSA DOHOL ERBOS FENER GOLTSGOZDE HURGZ ISGYO KRDMD SKBNKTSKB TAVHL TKFEN TRKCM THYAOTTKOM TTRAK ISCTR ZOREN
Community 4:
{
ASUZU KONYA OTKAR SISE TCELLVAKBN VESBE YAZIC
Community 5:{
CCOLA GOODY METRO NETAS SNGYO
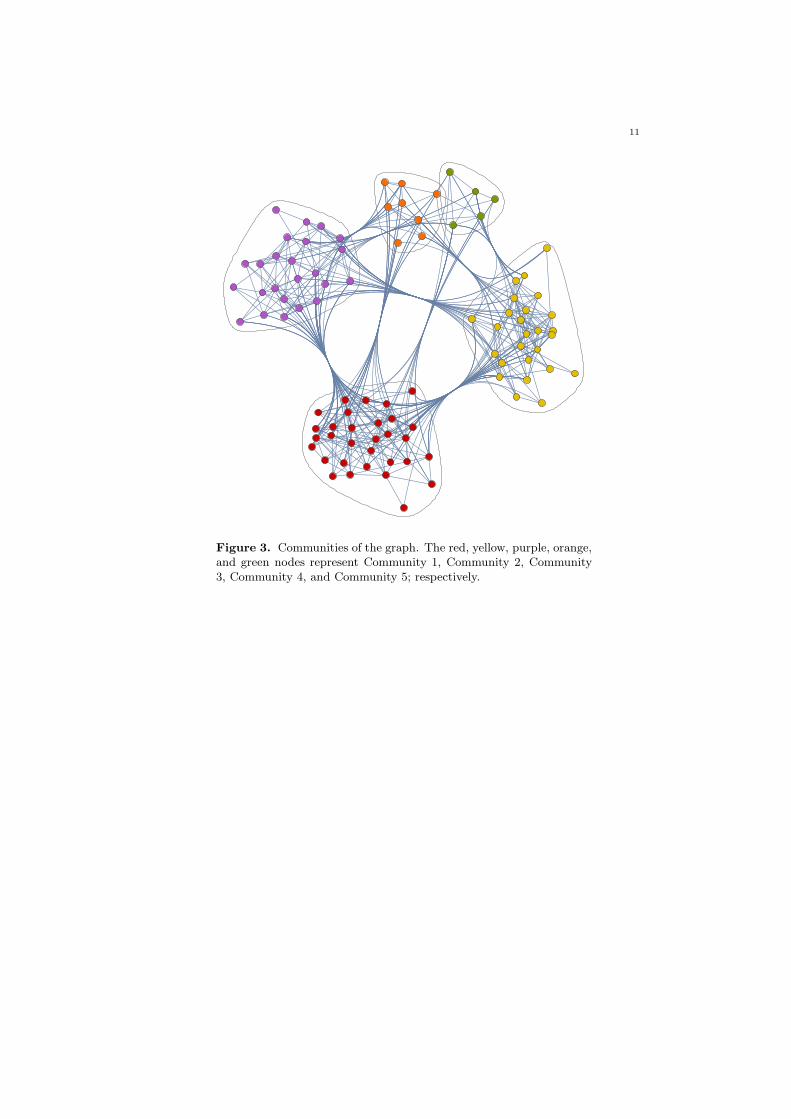
We visualize communities and their relations in Figure 3. The correspondingstock to each symbol in communities can be found in [31]. Table 2 shows the sectorof each operating stocks.
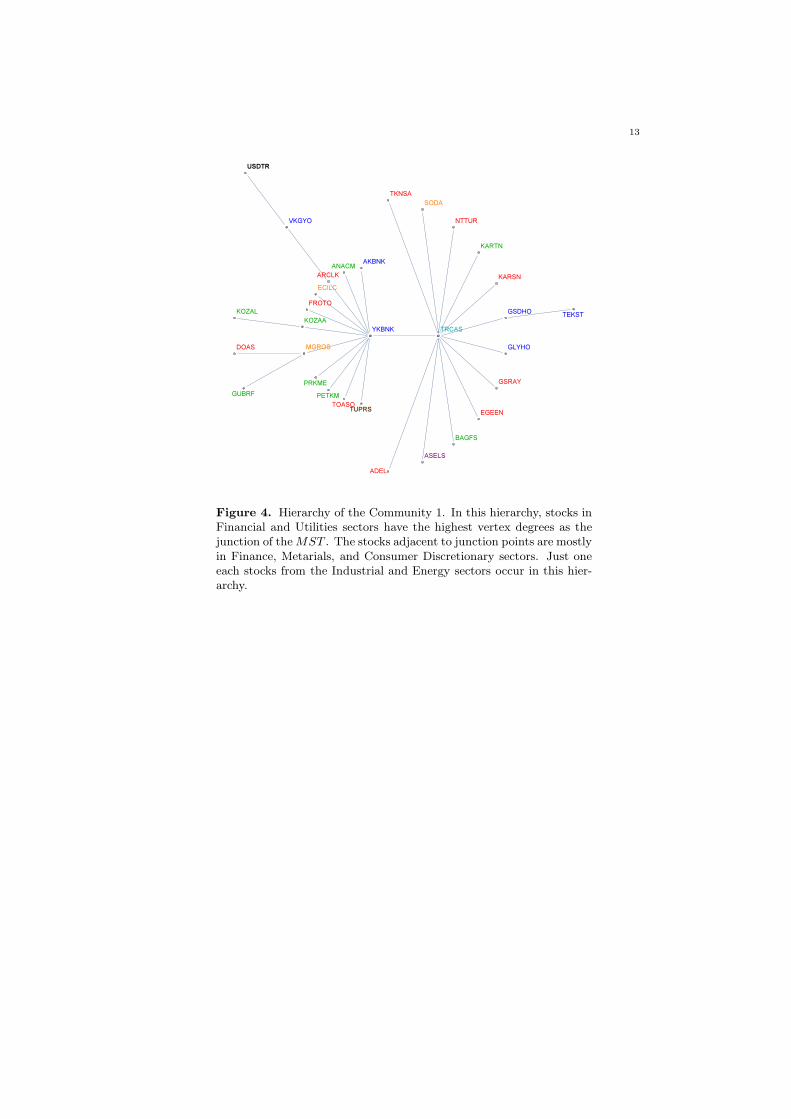
Now, to construct hierarchies in each community, we first consider the relateddistance matrix where vertices are the stocks in each community respect to the cor-relation distance CorrDist. Then, we obtain weighted minimum spanning trees ineach community by using Kruskal Algorithm. The resulted trees are given in Fig-ure 4–8. In order to demonstrate the stocks’ sectors, we used the coloring rule forFinancials, Industrials, Consumer Discretionary, Energy, Technology, Materials,Communications, Consumer Staples, and Utilities as Blue, Purple, Red, Brown,Pink, Green, Claret Red, Orange, and Cyan, respectively. For the color images,we refer the reader to the web version of this article.
4.1. Comparative Analysis. Planar graphs have the same hierarchical struc-ture of MST but they contain a larger amount of edges, loops and cliques. The ideaof the construction of planar graphs is based on connecting the most correlatedagents iteratively while constraining the resulting network to be embedded on asurface with genus g. In [28], authors briefly studied the special case for g = 0;i.e., the graph embedded on a sphere and called it as Planar Maximal Filter Graph
7
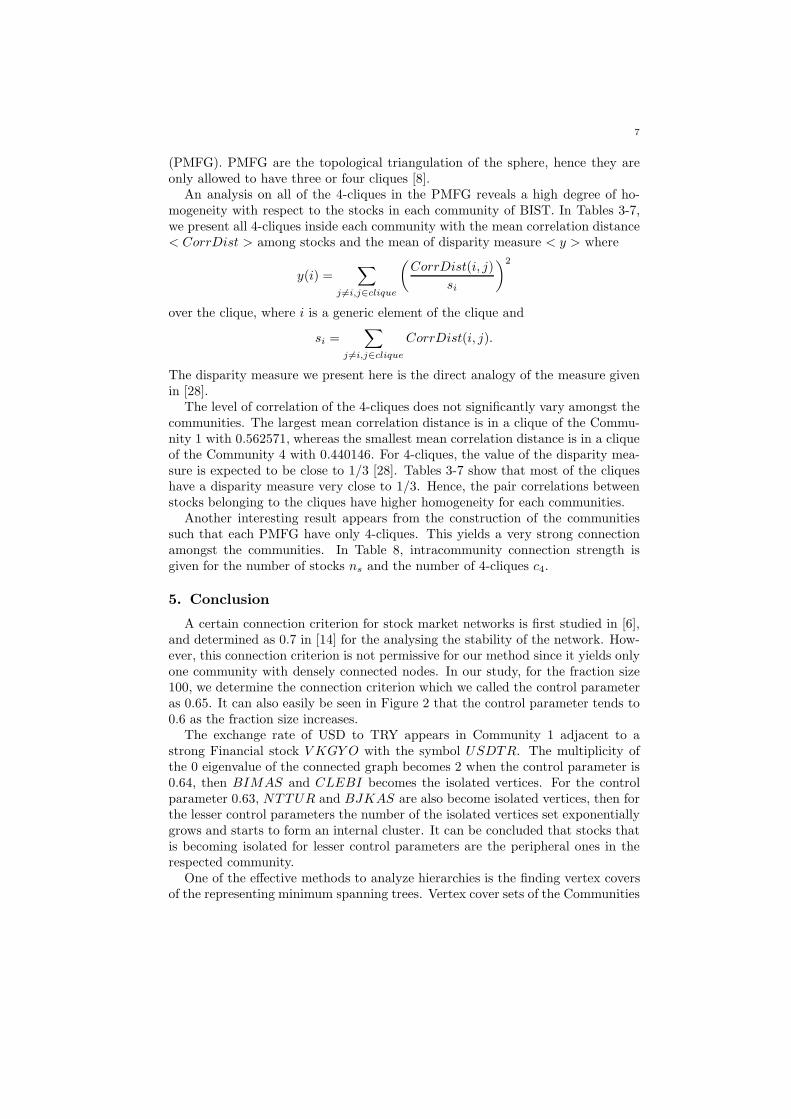
(PMFG). PMFG are the topological triangulation of the sphere, hence they areonly allowed to have three or four cliques [8].
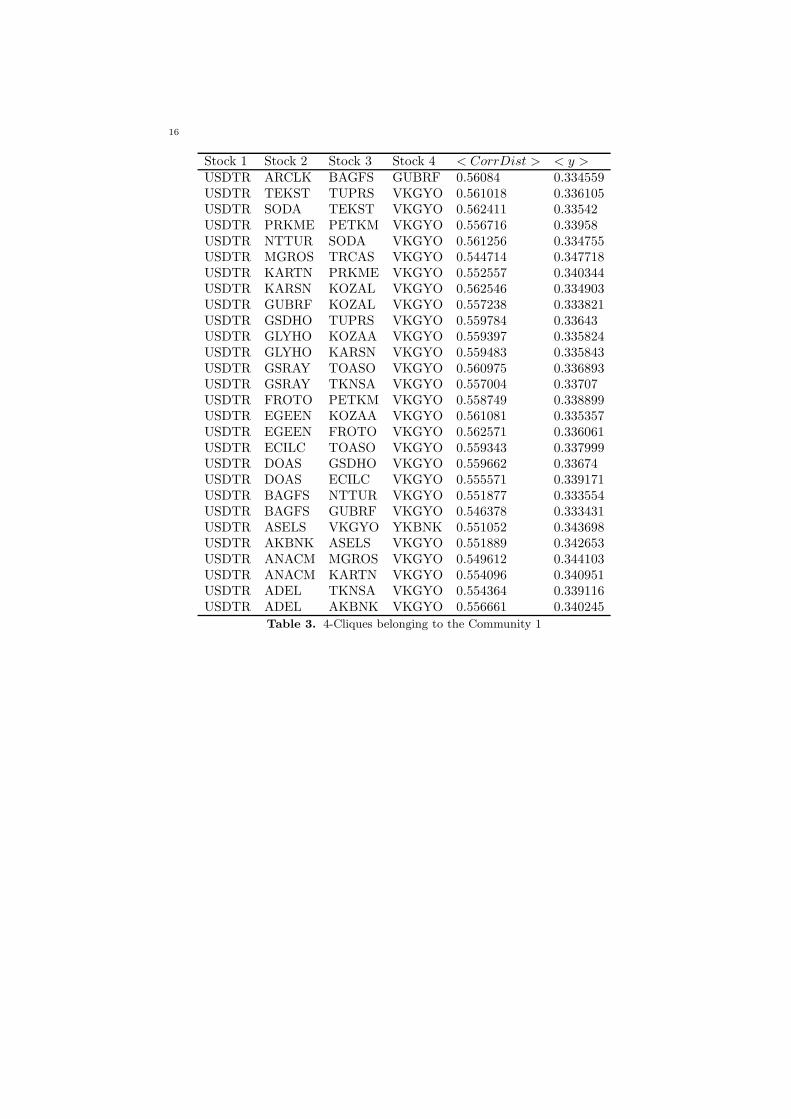
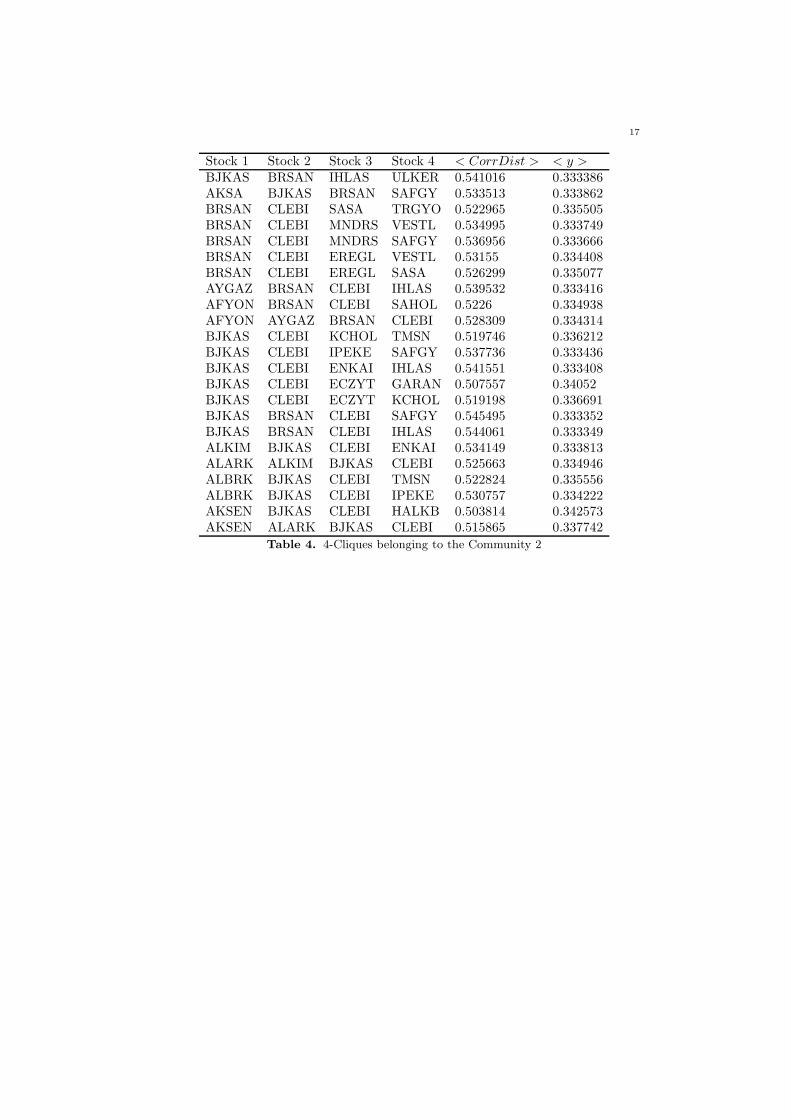
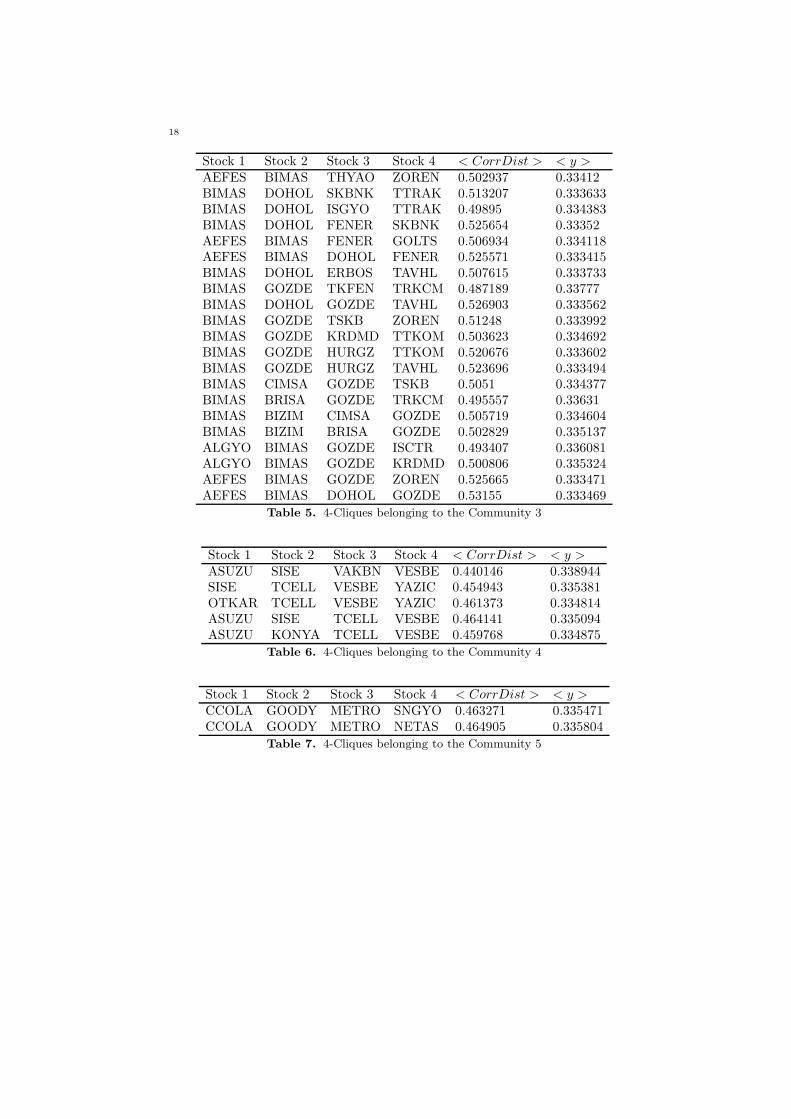
An analysis on all of the 4-cliques in the PMFG reveals a high degree of ho-mogeneity with respect to the stocks in each community of BIST. In Tables 3-7,we present all 4-cliques inside each community with the mean correlation distance< CorrDist > among stocks and the mean of disparity measure < y > where
y(i) =∑
j 6=i,j∈clique
(
CorrDist(i, j)
si
)2
over the clique, where i is a generic element of the clique and
si =∑
j 6=i,j∈clique
CorrDist(i, j).
The disparity measure we present here is the direct analogy of the measure givenin [28].
The level of correlation of the 4-cliques does not significantly vary amongst thecommunities. The largest mean correlation distance is in a clique of the Commu-nity 1 with 0.562571, whereas the smallest mean correlation distance is in a cliqueof the Community 4 with 0.440146. For 4-cliques, the value of the disparity mea-sure is expected to be close to 1/3 [28]. Tables 3-7 show that most of the cliqueshave a disparity measure very close to 1/3. Hence, the pair correlations betweenstocks belonging to the cliques have higher homogeneity for each communities.
Another interesting result appears from the construction of the communitiessuch that each PMFG have only 4-cliques. This yields a very strong connectionamongst the communities. In Table 8, intracommunity connection strength isgiven for the number of stocks ns and the number of 4-cliques c4.
5. Conclusion
A certain connection criterion for stock market networks is first studied in [6],and determined as 0.7 in [14] for the analysing the stability of the network. How-ever, this connection criterion is not permissive for our method since it yields onlyone community with densely connected nodes. In our study, for the fraction size100, we determine the connection criterion which we called the control parameteras 0.65. It can also easily be seen in Figure 2 that the control parameter tends to0.6 as the fraction size increases.
The exchange rate of USD to TRY appears in Community 1 adjacent to astrong Financial stock V KGY O with the symbol USDTR. The multiplicity ofthe 0 eigenvalue of the connected graph becomes 2 when the control parameter is0.64, then BIMAS and CLEBI becomes the isolated vertices. For the controlparameter 0.63, NTTUR and BJKAS are also become isolated vertices, then forthe lesser control parameters the number of the isolated vertices set exponentiallygrows and starts to form an internal cluster. It can be concluded that stocks thatis becoming isolated for lesser control parameters are the peripheral ones in therespected community.
One of the effective methods to analyze hierarchies is the finding vertex coversof the representing minimum spanning trees. Vertex cover sets of the Communities

8
1–5 can be obtained as
{GSDHO,KOZAL,MGROS,TRCAS,VKGYO,YKBNK}{ALKIM,ECZYT,HALKB,KCHOL,GARAN,TRGYO,TMSN}{AEFES,DOHOL,FENER,GOLTS, ISCTR}{VAKBN,YAZIC}{NETAS, SNGYO}
respectively.From the hierarchies, it can be concluded that stocks operating in Financial
sectors play key role for Borsa Istanbul, i.e. junction points with the highest ver-tex degrees in MST of each community. Amongst the Financial sector stocks,especially companies in Banking industry occur as junction points. Banking in-dustry has the highest weight in BIST as %36.76 [33], therefore our result is alsoconsistent with the empirical data. The other significant sectors are Materialsand Utilities in the topologies of the hierarchies. Stocks operating in these sectorswhich are the junctions are also adjacent to financial sector stocks. The stocksoperating in Consumer Discretionary, Consumer Staples, Communication, and In-dustry sectors are occur as the adjacent points to the junctions. They are mostlyadjacent to Financial sector stocks, then Materials sector stocks, as it is expectedfor the topology of Borsa Istanbul Stock Exchange.
6. Acknowledge
The author would like to extend sincere thanks to Borsa Istanbul for providingdata, and O. Akguller for valuable comments.
References
[1] Agarwal, Gaurav, and David Kempe. ”Modularity-maximizing graph communities via math-ematical programming.” The European Physical Journal B 66.3 (2008): 409-418.
[2] Arthur, W. B., Durlauf, S. N., and Lane, D. A. ”The economy as an evolving complexsystem II.” Vol. 28. Reading, MA: Addison-Wesley, 1997.
[3] Bonanno, Giovanni, et al. ”Topology of correlation-based minimal spanning trees in real andmodel markets.” Physical Review E 68.4 (2003): 046130.
[4] Brida, J. Gabriel, and W. Adrian Risso. ”Hierarchical structure of the German stock mar-ket.” Expert Systems with Applications 37.5 (2010): 3846-3852.
[5] Cai, Shi-Min, et al. ”Hierarchical organization and disassortative mixing of correlation-basedweighted financial networks.” International Journal of Modern Physics C 21.03 (2010): 433-441.
[6] Chi, K. Tse, Jing Liu, and Francis CM Lau. ”A network perspective of the stock market.”Journal of Empirical Finance 17.4 (2010): 659-667.
[7] Clauset, Aaron, Cristopher Moore, and Mark EJ Newman. ”Hierarchical structure and theprediction of missing links in networks.” Nature 453.7191 (2008): 98-101.
[8] Dirac, Gabriel A., and S. Schuster. ”A theorem of Kuratowski.” Indagationes Mathematicae(Proceedings). Vol. 57. North-Holland, 1954.
[9] Evans, Tim S. ”Clique graphs and overlapping communities.” Journal of Statistical Mechan-ics: Theory and Experiment 2010.12 (2010): P12037.
[10] Everett, Martin G., and Stephen P. Borgatti. ”Analyzing clique overlap.” Connections 21.1(1998): 49-61.
[11] Fortunato, Santo. ”Community detection in graphs.” Physics Reports 486.3 (2010): 75-174.[12] Golub, Gene H., and Henk A. Van der Vorst. ”Eigenvalue computation in the 20th century.”
Journal of Computational and Applied Mathematics 123.1 (2000): 35-65.
9
[13] Graham, Ronald L., and Pavol Hell. ”On the history of the minimum spanning tree prob-lem.” Annals of the History of Computing 7.1 (1985): 43-57.
[14] Heiberger, Raphael H. ”Stock network stability in times of crisis.” Physica A: StatisticalMechanics and its Applications 393 (2014): 376-381.
[15] Lancichinetti, Andrea, Santo Fortunato, and Janos Kertesz. ”Detecting the overlapping andhierarchical community structure in complex networks.” New Journal of Physics 11.3 (2009):033015.
[16] Lu, Linyuan, and Tao Zhou. ”Link prediction in complex networks: A survey.” Physica A:Statistical Mechanics and its Applications 390.6 (2011): 1150-1170.
[17] Mantegna, Rosario N. ”Hierarchical structure in financial markets.” The European PhysicalJournal B-Condensed Matter and Complex Systems 11.1 (1999): 193-197.
[18] Naylor, Michael J., Lawrence C. Rose, and Brendan J. Moyle. ”Topology of foreign exchangemarkets using hierarchical structure methods.” Physica A: Statistical Mechanics and itsApplications 382.1 (2007): 199-208.
[19] Newman, Mark EJ. ”Detecting community structure in networks.” The European PhysicalJournal B-Condensed Matter and Complex Systems 38.2 (2004): 321-330.
[20] Newman, Mark EJ. ”Fast algorithm for detecting community structure in networks.” Phys-ical review E 69.6 (2004): 066133.
[21] Newman, Mark EJ, and Michelle Girvan. ”Finding and evaluating community structure in
networks.” Physical review E 69.2 (2004): 026113.[22] Onnela, J-P., et al. ”Dynamics of market correlations: Taxonomy and portfolio analysis.”
Physical Review E 68.5 (2003): 056110.[23] Onnela, J-P., et al. ”Dynamic asset trees and Black Monday.” Physica A: Statistical Me-
chanics and its Applications 324.1 (2003): 247-252.[24] Onnela, J-P., Kimmo Kaski, and Janos Kertesz. ”Clustering and information in correla-
tion based financial networks.” The European Physical Journal B-Condensed Matter andComplex Systems 38.2 (2004): 353-362.
[25] Onnela, Jukka-Pekka, et al. ”Intensity and coherence of motifs in weighted complex net-works.” Physical Review E 71.6 (2005): 065103.
[26] Palla, Gergely, et al. ”Uncovering the overlapping community structure of complex networksin nature and society.” Nature 435.7043 (2005): 814-818.
[27] Radicchi, Filippo, et al. ”Defining and identifying communities in networks.” Proceedings ofthe National Academy of Sciences of the United States of America 101.9 (2004): 2658-2663.
[28] Tumminello, Michele, et al. ”A tool for filtering information in complex systems.” Proceed-ings of the National Academy of Sciences of the United States of America 102.30 (2005):10421-10426.
[29] Von Luxburg, Ulrike. ”A tutorial on spectral clustering.” Statistics and computing 17.4(2007): 395-416.
[30] Yang, Jing, and Lian Li. ”A partial correlation-based Bayesian network structure learningalgorithm under SEM.” Advances in Knowledge Discovery and Data Mining (2011): 63-74.
[31] http://borsaistanbul.com/en/[32] http://borsaistanbul.com/data/bylaws/ISE Stock Market Regulation.pdf[33] http://www.ist30.com/page/bist-30-index-components
10
Figure 1. Sessionally data from the period January 2013 to January
2015. The vertical axis represents the stocks operating in BIST and
the horizontal axis is for the time scale of operating sessions. The
logarithmic return for each stock is represented in the matrix plot.
Figure 2. Horizontal axis represents the control parameter while the
vertical axis represents number of connected components of the graph
11
Figure 3. Communities of the graph. The red, yellow, purple, orange,
and green nodes represent Community 1, Community 2, Community
3, Community 4, and Community 5; respectively.

12
Financials
AKBNK, SKBNK, SNGYO, TSKB, TEKST, TRGYO,VKGYO, ALGYO, ISGYO, GARAN, ALBRK, GLYHO,ISCTR, YKBNK, SAHOL, GOZDE, HALKB, VAKBN,ECZYT, SAFGY, EKGYO, SAHOL, GSDHOIndustrials
ASELS, TAVHL, TKFEN, TTRAK, CLEBIConsumer Discretionary
ASUZU, TKNSA, TOASO, YAZIC, AKSA, ARCLK,GSRAY, KARSN, THYAO, BRISA, DOAS, FENER,MNDRS, METRO, VESBE, ADEL , BJKAS, NTTUR,GOODY, OTKAR, TMSN, EGEEN, FROTO, IHLASEnergy
AYGAZ, TUPRS, IPEKE , KCHOLTechnology
NETAS, VESTLMaterials
SASA, AFYON, ANACM, BAGFS, CIMSA, KONYA,KOZAA, ERBOS, KRDMD, PRKME, SISE, ALKIM ,TRKCM, GUBRF, KOZAL, BRSAN, KARTN, PETKMGOLTS, EREGLCommunications
TTKOM, TCELL, DOHOL, HURGZConsumer Staples
AEFES, CCOLA, BIZIM, ECILC, BIMAS, MGROS,SODA, ULKERUtilities
AKSEN, ALARK, TRCAS, ZOREN, ENKAI
Table 2. Sectors of each considered stock
13
Figure 4. Hierarchy of the Community 1. In this hierarchy, stocks in
Financial and Utilities sectors have the highest vertex degrees as the
junction of theMST . The stocks adjacent to junction points are mostly
in Finance, Metarials, and Consumer Discretionary sectors. Just one
each stocks from the Industrial and Energy sectors occur in this hier-
archy.

14
Figure 5. Hierarchy of the Community 2. The junction point with
the highest degree is in the Financial sector. The rest of the stocks
from Energy sector occur in this hierarchy as peripherals. Also stocks
from the Utilities sector are in this hierarchy densely.
Figure 6. Hierarchy of the Community 3. In this hierarchy, a stock
in Financial sector has has the highest vertex degrees as the junction
of the MST . The other Financial stocks appear as peripherals. Stocks
from the Communication sector are in this hierarchy densely.

15
Figure 7. Hierarchy of the Community 4. A stock in Financial sector
has the highest vertex degree and the peripherals are mostly Consumer
Discretionary stocks.
Figure 8. Hierarchy of the Community 5. In this hierarchy, a stock
in Financial sector has the highest vertex degrees as the junction of the
MST .
16
Stock 1 Stock 2 Stock 3 Stock 4 < CorrDist > < y >USDTR ARCLK BAGFS GUBRF 0.56084 0.334559USDTR TEKST TUPRS VKGYO 0.561018 0.336105USDTR SODA TEKST VKGYO 0.562411 0.33542USDTR PRKME PETKM VKGYO 0.556716 0.33958USDTR NTTUR SODA VKGYO 0.561256 0.334755USDTR MGROS TRCAS VKGYO 0.544714 0.347718USDTR KARTN PRKME VKGYO 0.552557 0.340344USDTR KARSN KOZAL VKGYO 0.562546 0.334903USDTR GUBRF KOZAL VKGYO 0.557238 0.333821USDTR GSDHO TUPRS VKGYO 0.559784 0.33643USDTR GLYHO KOZAA VKGYO 0.559397 0.335824USDTR GLYHO KARSN VKGYO 0.559483 0.335843USDTR GSRAY TOASO VKGYO 0.560975 0.336893USDTR GSRAY TKNSA VKGYO 0.557004 0.33707USDTR FROTO PETKM VKGYO 0.558749 0.338899USDTR EGEEN KOZAA VKGYO 0.561081 0.335357USDTR EGEEN FROTO VKGYO 0.562571 0.336061USDTR ECILC TOASO VKGYO 0.559343 0.337999USDTR DOAS GSDHO VKGYO 0.559662 0.33674USDTR DOAS ECILC VKGYO 0.555571 0.339171USDTR BAGFS NTTUR VKGYO 0.551877 0.333554USDTR BAGFS GUBRF VKGYO 0.546378 0.333431USDTR ASELS VKGYO YKBNK 0.551052 0.343698USDTR AKBNK ASELS VKGYO 0.551889 0.342653USDTR ANACM MGROS VKGYO 0.549612 0.344103USDTR ANACM KARTN VKGYO 0.554096 0.340951USDTR ADEL TKNSA VKGYO 0.554364 0.339116USDTR ADEL AKBNK VKGYO 0.556661 0.340245
Table 3. 4-Cliques belonging to the Community 1
17
Stock 1 Stock 2 Stock 3 Stock 4 < CorrDist > < y >BJKAS BRSAN IHLAS ULKER 0.541016 0.333386AKSA BJKAS BRSAN SAFGY 0.533513 0.333862BRSAN CLEBI SASA TRGYO 0.522965 0.335505BRSAN CLEBI MNDRS VESTL 0.534995 0.333749BRSAN CLEBI MNDRS SAFGY 0.536956 0.333666BRSAN CLEBI EREGL VESTL 0.53155 0.334408BRSAN CLEBI EREGL SASA 0.526299 0.335077AYGAZ BRSAN CLEBI IHLAS 0.539532 0.333416AFYON BRSAN CLEBI SAHOL 0.5226 0.334938AFYON AYGAZ BRSAN CLEBI 0.528309 0.334314BJKAS CLEBI KCHOL TMSN 0.519746 0.336212BJKAS CLEBI IPEKE SAFGY 0.537736 0.333436BJKAS CLEBI ENKAI IHLAS 0.541551 0.333408BJKAS CLEBI ECZYT GARAN 0.507557 0.34052BJKAS CLEBI ECZYT KCHOL 0.519198 0.336691BJKAS BRSAN CLEBI SAFGY 0.545495 0.333352BJKAS BRSAN CLEBI IHLAS 0.544061 0.333349ALKIM BJKAS CLEBI ENKAI 0.534149 0.333813ALARK ALKIM BJKAS CLEBI 0.525663 0.334946ALBRK BJKAS CLEBI TMSN 0.522824 0.335556ALBRK BJKAS CLEBI IPEKE 0.530757 0.334222AKSEN BJKAS CLEBI HALKB 0.503814 0.342573AKSEN ALARK BJKAS CLEBI 0.515865 0.337742
Table 4. 4-Cliques belonging to the Community 2
18
Stock 1 Stock 2 Stock 3 Stock 4 < CorrDist > < y >AEFES BIMAS THYAO ZOREN 0.502937 0.33412BIMAS DOHOL SKBNK TTRAK 0.513207 0.333633BIMAS DOHOL ISGYO TTRAK 0.49895 0.334383BIMAS DOHOL FENER SKBNK 0.525654 0.33352AEFES BIMAS FENER GOLTS 0.506934 0.334118AEFES BIMAS DOHOL FENER 0.525571 0.333415BIMAS DOHOL ERBOS TAVHL 0.507615 0.333733BIMAS GOZDE TKFEN TRKCM 0.487189 0.33777BIMAS DOHOL GOZDE TAVHL 0.526903 0.333562BIMAS GOZDE TSKB ZOREN 0.51248 0.333992BIMAS GOZDE KRDMD TTKOM 0.503623 0.334692BIMAS GOZDE HURGZ TTKOM 0.520676 0.333602BIMAS GOZDE HURGZ TAVHL 0.523696 0.333494BIMAS CIMSA GOZDE TSKB 0.5051 0.334377BIMAS BRISA GOZDE TRKCM 0.495557 0.33631BIMAS BIZIM CIMSA GOZDE 0.505719 0.334604BIMAS BIZIM BRISA GOZDE 0.502829 0.335137ALGYO BIMAS GOZDE ISCTR 0.493407 0.336081ALGYO BIMAS GOZDE KRDMD 0.500806 0.335324AEFES BIMAS GOZDE ZOREN 0.525665 0.333471AEFES BIMAS DOHOL GOZDE 0.53155 0.333469
Table 5. 4-Cliques belonging to the Community 3
Stock 1 Stock 2 Stock 3 Stock 4 < CorrDist > < y >ASUZU SISE VAKBN VESBE 0.440146 0.338944SISE TCELL VESBE YAZIC 0.454943 0.335381OTKAR TCELL VESBE YAZIC 0.461373 0.334814ASUZU SISE TCELL VESBE 0.464141 0.335094ASUZU KONYA TCELL VESBE 0.459768 0.334875
Table 6. 4-Cliques belonging to the Community 4
Stock 1 Stock 2 Stock 3 Stock 4 < CorrDist > < y >CCOLA GOODY METRO SNGYO 0.463271 0.335471CCOLA GOODY METRO NETAS 0.464905 0.335804
Table 7. 4-Cliques belonging to the Community 5

19
Community ns c4 c4/(ns − 3)1 31 28 12 26 23 13 24 21 14 8 5 15 5 2 1
Table 8. Intracommunity connection strength


