Every Cloud has a Quicksilver Lining: MERCURY IN THE ENVIRONMENT Hg 0 80 Hg 200.59 Hg 2+ CH 3 Hg +
Upload
lisa-schmidtCategory
view
524download
0
© 2016 Pearson Education, Inc.
Chapter 8: Geographies of Economic Development
Chapter 8 Lecture
Katie PrattMacalester College
© 2016 Pearson Education, Inc.

© 2016 Pearson Education, Inc.
Key Concepts
Figure: Chapter 8 Opener - Garment workers in Gajipur, Bangladesh.

© 2016 Pearson Education, Inc.
Patterns of Economic Development
• Three types of changes– Structure of region’s economy– Forms of economic organization– Availability and use of technology
• Unevenness• Measuring economic development
– Gross domestic product (GDP)– Gross national income (GNI)– Purchasing power parity (PPP)
Apply your knowledge: What kind of statistics besides GNI provide an indication of international disparities in economic development?

© 2016 Pearson Education, Inc.
Figure 8.1 GNI per capita, 2012: GNI is one of the best single measures of economic development. Use this map to compare the core countries with the peripheral and semiperipheral countries.
Patterns of Economic Development (cont’d)

© 2016 Pearson Education, Inc.
Resources and Development
• Energy• Cultivable land• Carrying capacity• Industrial resources
Figure 8.3 Deforestation Malaysia in preparation of an oil palm plantation.
Figure 8.2 A fracking rig at a well site in Washington, PA.

© 2016 Pearson Education, Inc.
Resources and Development (cont’d)
Figure 8.4 Agricultural land cover: Some countries are fortunate in having a broad range of cultivable land. Others must rely on exploitation of one major resource for economic development.

© 2016 Pearson Education, Inc.
Figure 8.6 Promoting local economies.
Resources and Development (cont’d)
• Sustainable development• Ecological footprint• Obstacles
– Reliance on fossil fuels– Rate of growth in periphery– Institutional framework
Apply your knowledge: How sustainable do you think your lifestyle is compared to other places in the world?

© 2016 Pearson Education, Inc.
Technical Change and Economic Development
Figure 8.1.2 The international telegraph network in 1900.
Figure 8.1.4 Undersea internet cables in 2012.
Apply your knowledge: Where do you think technology and economic development are headed? Do you think there will be a new site of hegemonic influence?

© 2016 Pearson Education, Inc.
Economic Structure
• Primary, secondary, tertiary, and quaternary activities
Table 8.1 Economic structure.

© 2016 Pearson Education, Inc.
Economic Structure (cont’d)
• Geographic divisions of labor
• Newly industrializing countries (NICs)
• Foreign direct investment• Transnational
corporations (TNCs)
Figure 8.8 Manufacturing in South Korea.
Apply your knowledge: Consider a product you own and map out the product’s development through the primary, secondary, and tertiary activities.

© 2016 Pearson Education, Inc.
Economic Structure (cont’d)
Figure 8.7 The geography of primary economic activities (2012).

© 2016 Pearson Education, Inc.
China’s Economic Development
Figure 8.A The city of Shenzhen. Figure 8.B New affluence.
Figure 8.C Real estate boom.
Apply your knowledge: What factors in China’s “open-door policy” changed the economy and how?
© 2016 Pearson Education, Inc.
Economic Structure (cont’d)
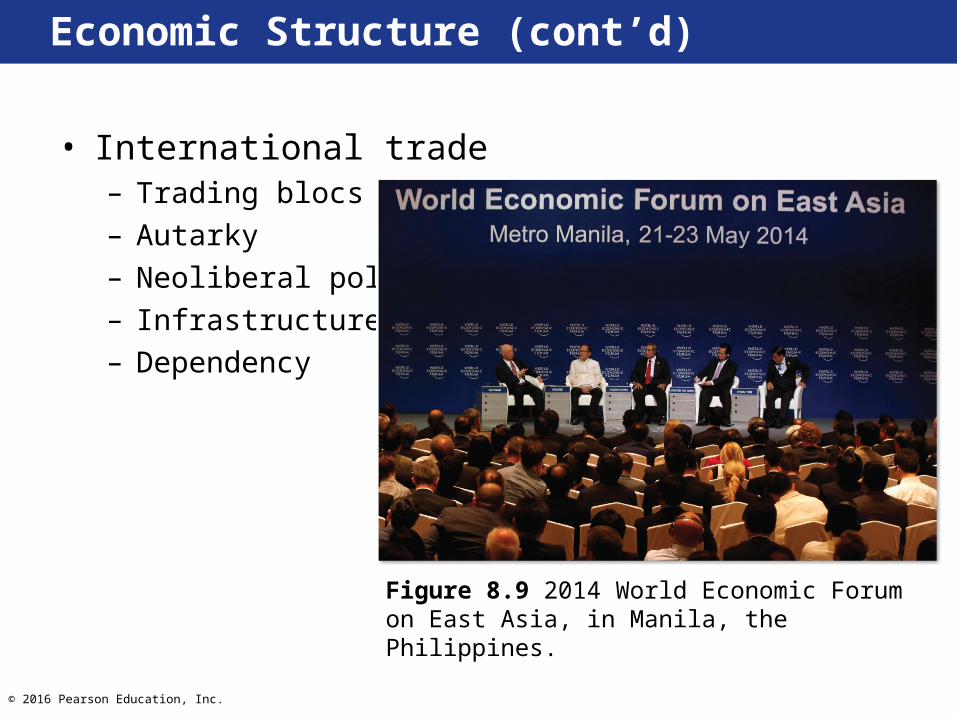
• International trade– Trading blocs– Autarky– Neoliberal polices– Infrastructure– Dependency
Figure 8.9 2014 World Economic Forum on East Asia, in Manila, the Philippines.
© 2016 Pearson Education, Inc.
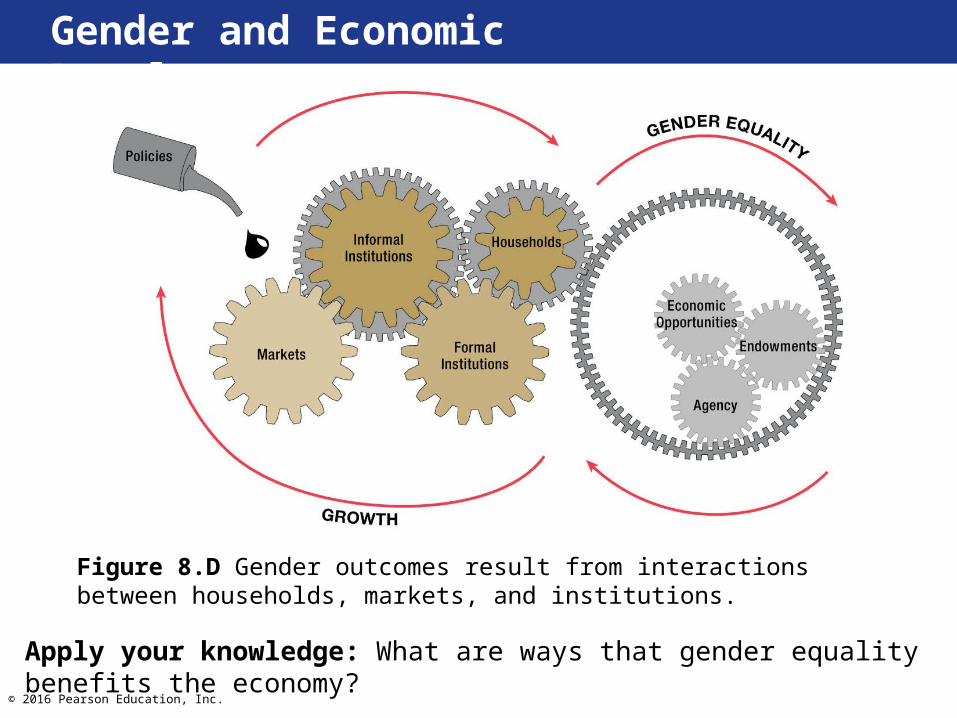
Figure 8.D Gender outcomes result from interactions between households, markets, and institutions.
Apply your knowledge: What are ways that gender equality benefits the economy?
Gender and Economic Development

© 2016 Pearson Education, Inc.
Economic Structure (cont’d)
• Patterns of international debt– Elasticity of demand
• Terms of trade– Ratio of prices
• Import substitution
Figure 8.11 Cocoa production, Ghana.
Apply your knowledge: Determine the current debt of three countries. What main factors have contributed to each country’s debt?

© 2016 Pearson Education, Inc.
Economic Structure (cont’d)
Figure 8.10 The debt crisis in 2012.

© 2016 Pearson Education, Inc.
Economic Structure (cont’d)
• Fair trade– Key principles
• Ethical trading initiative
Figure 8.12 Farmers harvesting cotton in Gujarat, India supply fair trade cotton to supermarkets in the UK.

© 2016 Pearson Education, Inc.
• Rostow model• Myth of
“developmentalism”• Dependency theory• Places now seen as
interdependent
Interpretations of International Patterns of Development
Figure 8.13 A model based on the idea of successive stages of economic development, now regarded as overly simplistic.

© 2016 Pearson Education, Inc.
Regional Economic Development
• Regional inequalities• Geographical path dependence• Initial advantage• External economies• Localization economies
Apply your knowledge: Identify an example of localized economics functioning in your own community. What industries are clustering together and how can this result in cost savings?

© 2016 Pearson Education, Inc.
Regional Economic Development (cont’d)
• Webs of functional interdependence• Agglomeration effects• Backward and forward linkages• Ancillary industries• Cumulative causation• Backwash effects
Apply your knowledge: Identify and research three cities that have experienced a backwash effect and the reasons for the backwash effect in each locale.

© 2016 Pearson Education, Inc.
Regional Economic Development (cont’d)
Figure 8.14 Processes of regional economic growth. The geographic principles of agglomeration and localization reinforce the initial advantages of industrial growth. The overall process is known as cumulative causation.

© 2016 Pearson Education, Inc.
Regional Economic Development (cont’d)
• Modification of regional core-periphery patterns– Spread effects– Agglomeration diseconomies
© 2016 Pearson Education, Inc.
Regional Economic Development (cont’d)
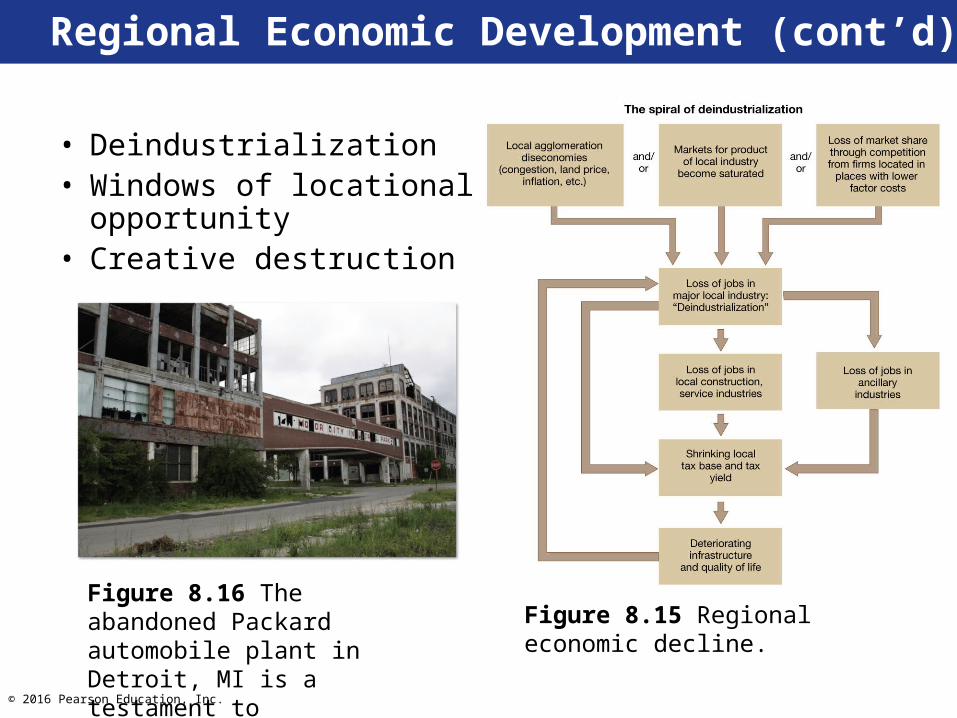
• Deindustrialization• Windows of locational
opportunity• Creative destruction
Figure 8.15 Regional economic decline.Figure 8.16 The abandoned Packard automobile plant in Detroit, MI is a testament to deindustrialization.
© 2016 Pearson Education, Inc.
Regional Economic Development (cont’d)
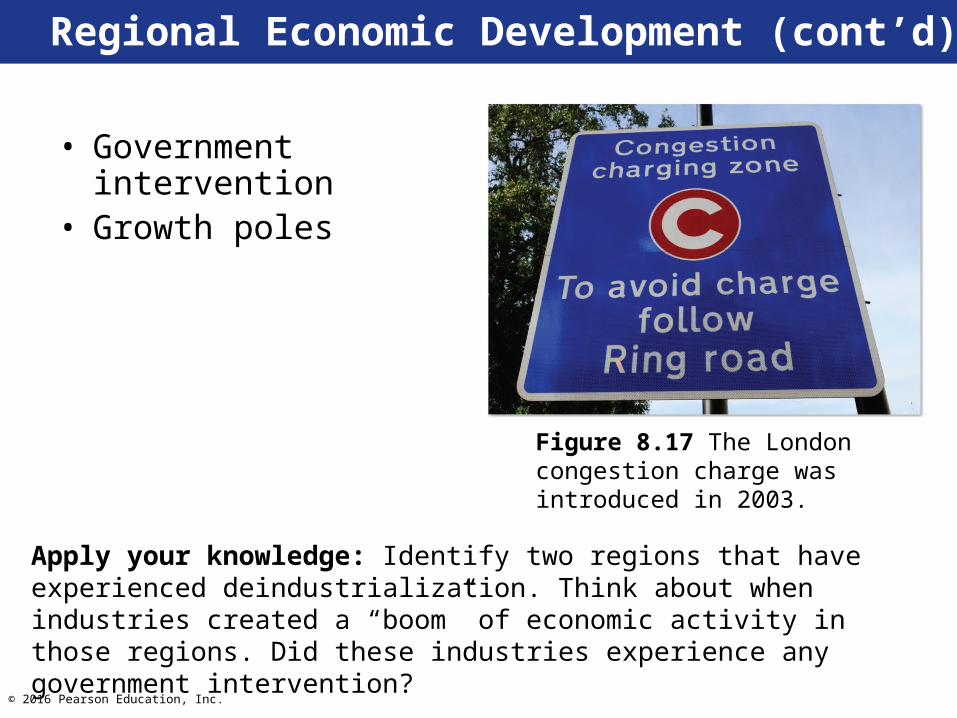
• Government intervention• Growth poles
Figure 8.17 The London congestion charge was introduced in 2003.
Apply your knowledge: Identify two regions that have experienced deindustrialization. Think about when industries created a “boom” of economic activity in those regions. Did these industries experience any government intervention?

© 2016 Pearson Education, Inc.
Globalization and Economic Development
• New international division of labor– Producer services
• New technology: robotics, biotechnology, digital telecommunications, etc.
• Homogenization of international consumer markets
• Internationalization of finance
Figure 8.18 The impact of containerization on world trade.

© 2016 Pearson Education, Inc.
Globalization and Economic Development (cont’d)
Figure 8.19 24-hour trading between major financial markets.
Apply your knowledge: Choose a semiperipheral or peripheral country and determine the ways each of the four factors of globalization have affected its economic development process.

© 2016 Pearson Education, Inc.
• Global assembly lines and supply chains– Conglomerate
corporations– Transnational
corporations– Advantages of global
assembly line
Globalization and Economic Development (cont’d)
Figure 8.20 Subcontracting: Nike factory on the outskirts of Ho Chi Minh City, Vietnam.

© 2016 Pearson Education, Inc.
• Flexible production systems– Fordism– Neo-Fordism– Just-in-time production– Vertical disintegration– Strategic alliances
Globalization and Economic Development (cont’d)
Figure 8.21 Headquarters of the Benetton Group, Villa Minelli, Treviso, Italy.
Apply your knowledge: Describe the transnational commodity chain from start to finish.

© 2016 Pearson Education, Inc.
• Maquiladoras• Export-processing zones (EPZs)• Retailing chains and global sourcing
Globalization and Economic Development (cont’d)
Figure 8.22 The production floor at the Flextronics maquiladora in Jalisco, Mexico.

© 2016 Pearson Education, Inc.
New Geographies of Office Employment
• Decentralization – Back-office functions
• Outsourcing• Clusters of specialized
offices• World cities
Figure 8.24 Workers at a call center in New Delhi, India.
Figure 8.23 Outsourcing: Panasonic’s manufacturing unit at Jhajjar, India.
Figure 8.25 London’s financial quarter.

© 2016 Pearson Education, Inc.
The Experience Economy and Place Marketing
• Combining commodities, products, and services with compelling experiences
• Place marketing– “Carnival Masks”– “Businessmen’s utopias”
Apply your knowledge: Think of a place that is part of the experience economy. List two ways that manipulation of material and visual culture is used to enhance a sense of place for this location. Analyze where the tourists originate and what is the “experience” they hope to have.

© 2016 Pearson Education, Inc.
How Geopolitics has Changed the World
Figure 8.E Tax havens.
Table 8.2 Some examples of tax havens.
© 2016 Pearson Education, Inc.
Future Geographies
• Availability of energy resources– Increasing energy demand
in peripheral countries– Energy production will not
keep up with demand– Increasing dependence
on OPEC governments• Transportation
technologies– High-speed rail systems– Smart roads– Smart cars
• Impact of climate change
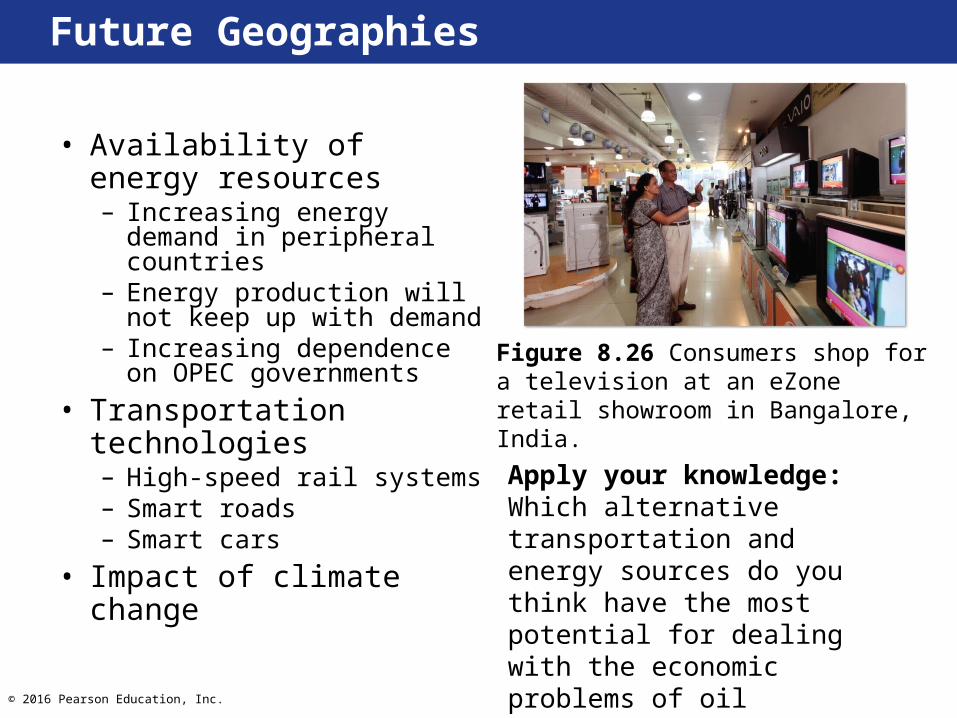
Figure 8.26 Consumers shop for a television at an eZone retail showroom in Bangalore, India.
Apply your knowledge: Which alternative transportation and energy sources do you think have the most potential for dealing with the economic problems of oil dependency and declining reserves?