Heterogeneous Photocatalytic Degradation of … n1 2014 pp 31-45.pdfHeterogeneous Photocatalytic...
15
South African Journal of Chemical Engineering, vol. 19, 2014, no. 1, pp 31-45 31 Heterogeneous Photocatalytic Degradation of Naphthalene using Periwinkle Shell Ash: Effect of Operating Variables, Kinetic and Isotherm Study Aisien Felix a , Amenaghawon Andrew b , Assogba Mededode c a,b,c University of Benin, Chemical Engineering Department Keywords: Photocatalysis, Periwinkle shell ash, Naphthalene, Kinetics, Adsorption capacity Abstract-This study investigated the potential use of low cost photocatalyst, Periwinkle shell ash (PSA) for the batch photocatalytic degradation of naphthalene in aqueous solutions. The effect of contact time, initial naphthalene concentration, PSA dosage, presence of electron accepting oxidant (H 2 O 2 ), and the pH of solution on the percentage photodegradation of naphthalene determined. For the treatment conditions considered in this study, the optimum values were obtained to be: contact time, 210 minutes; initial naphthalene concentration, 25 mg/L; PSA dosage, 2 g; pH, 9. The addition of Hydrogen Peroxide (H 2 O 2 ) enhanced the photodegradation process with almost 100 percent degradation achieved. The adsorption equilibrium data fitted well to the Langmuir isotherm equation (R 2 =0.993) indicating mono layer type adsorption while the kinetics of the process was well described by the Langmuir- Hinshelwood kinetic model with high correlation coefficient value (R 2 =0.998). This study has demonstrated that the low cost photocatalyst, PSA can be used for removal of naphthalene from aqueous solution. Also the kinetic information obtained can be used for designing treatment systems for naphthalene abatement. INTRODUCTION The scale of environmental pollution and particularly water pollution in the world today has prompted engineers and scientists to focus attention on cleaner and more environmentally friendly processes (Abdollahi et al., 2011). Naphthalene is an important polycyclic aromatic hydrocarbon (PAH) which enters the environment through various sources such as incomplete combustion of gasoline and diesel in internal combustion engines, combustion of coal and oil for power generation, wood burning, tobacco smoking, fumigants etc (Jia and Batterman, 2010; Li et al., 2010; Wilson et al., 2003). As a result of it relatively higher solubility compared to other PAHs, it can be readily mobilised into the aqueous phase through discharges from industrial and domestic effluents, leaks of PAHs containing materials, used oil, bilge water, runoff from paved roads, parking lots etc (Alamo-Nole et al., 2011; Lair et al., 2008). Exposure to naphthalene is considered to be carcinogenic, toxic and mutagenic to humans with both acute and chronic effects on health; hence it has been listed as a priority environmental pollutant by many countries (ATSDR, 2005; Henner et al., 1997; Lair et al., 2008). Removal of naphthalene from aqueous solutions can be accomplished by various methods including electron beam irradiation (Cooper et al., 2002), biodegradation using surfactants (Liu et al., 1995), ozonolysis (Legube et al., 1986), adsorption using zeolites and activated carbon (Ania et al., 2007; Chang et al., 2004) and photocatalytic degradation using Titanium dioxide (TiO 2 ) and Zinc oxide (ZnO) (Lair et al., 2008; Zhou et al., 2012). Photocatalysis is a promising technique for the degradation of organic pollutants in aqueous media. It is based on the surface activation of semiconductors notably ZnO and TiO 2 by ultraviolet (UV) radiation. Perhaps the most significant advantage of this technique is that it can be used to degrade most organic compounds which are not amenable to other conventional treatment processes. It is faster than most bioprocesses and cheaper than ozonolysis and radiation based processes as it can be carried out under direct sunlight, making it able to operate independent of any external power source (Lair et al., 2008). Woo et al. (2009) studied the photocatalytic degradation of some PAHs namely naphthalene, acenaphthylene, phenanthrene, anthracene, and benzo[a]anthracene. These PAHs typically have low solubility in aqueous medium hence they investigated the effect of acetone on the photocatalytic degradation efficiency. They reported that addition of 16% acetone greatly enhanced the efficiency of the process with all of the PAHs degraded within a 24 hour period using TiO 2 . Gautam et al. (2005) studied the photocatalytic degradation of 4- nitroaniline using solar and artificial UV radiation in the presence of TiO 2 suspensions in a batch and continuous annular reactor. They observed that catalyst loading, pH, initial concentration and the presence of anions influenced the rate of photocatalytic degradation. They further reported that P-Aminophenol, p-benzoquinone
Transcript of Heterogeneous Photocatalytic Degradation of … n1 2014 pp 31-45.pdfHeterogeneous Photocatalytic...

South African Journal of Chemical Engineering, vol. 19, 2014, no. 1, pp 31-45 31
Heterogeneous Photocatalytic Degradation of Naphthalene using Periwinkle Shell Ash: Effect of Operating Variables, Kinetic and
Isotherm Study
Aisien Felixa, Amenaghawon Andrew
b, Assogba Mededode
c
a,b,c University of Benin, Chemical Engineering Department
Keywords: Photocatalysis, Periwinkle shell ash, Naphthalene, Kinetics, Adsorption capacity
Abstract-This study investigated the potential use of low cost photocatalyst, Periwinkle shell
ash (PSA) for the batch photocatalytic degradation of naphthalene in aqueous solutions. The
effect of contact time, initial naphthalene concentration, PSA dosage, presence of electron
accepting oxidant (H2O2), and the pH of solution on the percentage photodegradation of
naphthalene determined. For the treatment conditions considered in this study, the optimum
values were obtained to be: contact time, 210 minutes; initial naphthalene concentration, 25
mg/L; PSA dosage, 2 g; pH, 9. The addition of Hydrogen Peroxide (H2O2) enhanced the
photodegradation process with almost 100 percent degradation achieved. The adsorption
equilibrium data fitted well to the Langmuir isotherm equation (R2=0.993) indicating mono
layer type adsorption while the kinetics of the process was well described by the Langmuir-
Hinshelwood kinetic model with high correlation coefficient value (R2=0.998). This study has
demonstrated that the low cost photocatalyst, PSA can be used for removal of naphthalene
from aqueous solution. Also the kinetic information obtained can be used for designing
treatment systems for naphthalene abatement.
INTRODUCTION
The scale of environmental pollution and particularly water pollution in the world today has prompted engineers
and scientists to focus attention on cleaner and more environmentally friendly processes (Abdollahi et al., 2011).
Naphthalene is an important polycyclic aromatic hydrocarbon (PAH) which enters the environment through
various sources such as incomplete combustion of gasoline and diesel in internal combustion engines,
combustion of coal and oil for power generation, wood burning, tobacco smoking, fumigants etc (Jia and
Batterman, 2010; Li et al., 2010; Wilson et al., 2003). As a result of it relatively higher solubility compared to
other PAHs, it can be readily mobilised into the aqueous phase through discharges from industrial and domestic
effluents, leaks of PAHs containing materials, used oil, bilge water, runoff from paved roads, parking lots etc
(Alamo-Nole et al., 2011; Lair et al., 2008).
Exposure to naphthalene is considered to be carcinogenic, toxic and mutagenic to humans with both acute and
chronic effects on health; hence it has been listed as a priority environmental pollutant by many countries
(ATSDR, 2005; Henner et al., 1997; Lair et al., 2008). Removal of naphthalene from aqueous solutions can be
accomplished by various methods including electron beam irradiation (Cooper et al., 2002), biodegradation
using surfactants (Liu et al., 1995), ozonolysis (Legube et al., 1986), adsorption using zeolites and activated
carbon (Ania et al., 2007; Chang et al., 2004) and photocatalytic degradation using Titanium dioxide (TiO2) and
Zinc oxide (ZnO) (Lair et al., 2008; Zhou et al., 2012).
Photocatalysis is a promising technique for the degradation of organic pollutants in aqueous media. It is based
on the surface activation of semiconductors notably ZnO and TiO2 by ultraviolet (UV) radiation. Perhaps the
most significant advantage of this technique is that it can be used to degrade most organic compounds which are
not amenable to other conventional treatment processes. It is faster than most bioprocesses and cheaper than
ozonolysis and radiation based processes as it can be carried out under direct sunlight, making it able to operate
independent of any external power source (Lair et al., 2008).
Woo et al. (2009) studied the photocatalytic degradation of some PAHs namely naphthalene, acenaphthylene,
phenanthrene, anthracene, and benzo[a]anthracene. These PAHs typically have low solubility in aqueous
medium hence they investigated the effect of acetone on the photocatalytic degradation efficiency. They
reported that addition of 16% acetone greatly enhanced the efficiency of the process with all of the PAHs
degraded within a 24 hour period using TiO2. Gautam et al. (2005) studied the photocatalytic degradation of 4-
nitroaniline using solar and artificial UV radiation in the presence of TiO2 suspensions in a batch and continuous
annular reactor. They observed that catalyst loading, pH, initial concentration and the presence of anions
influenced the rate of photocatalytic degradation. They further reported that P-Aminophenol, p-benzoquinone
South African Journal of Chemical Engineering, vol. 19, 2014, no. 1, pp 31-45 32
and hydroquinone were the intermediates during the degradation process. Wu et al. (2008) studied the
photocatalytic degradation of terbufos in aqueous suspensions using TiO2. They reported that various
operational variables such as catalyst loading, pH, and the presence of anions affected the rate of degradation
with about 99% of terbufos degraded within 90 minutes. Vasconcelos et al. (2009) reported results on the
performance of heterogeneous photocatalytic degradation, photo-induced oxidation, ozonation and peroxone in
degrading the fluoroquinolone antimicrobial ciprofloxacin (CIP) in a hospital effluent. They reported that both
heterogeneous photocatalytic degradation and peroxone led to almost complete CIP degradation after one hour
of treatment.
From these studies, it was observed that photocatalytic degradation is fast and efficient and conventional
catalyst such as TiO2 is typically used in the presence of UV light. The use of TiO2 in photocatalysis is highly
evident in degrading organic pollutants in wastewater, sludges and contaminated soils due to its high activity,
stability under irradiation, reliability, low cost and availability (Ahmed et al., 2011). Despite these attractive
characteristics, the commercial application of TiO2 for the photocatalytic degradation of liquid wastes is limited
by the recovery potential of the catalyst and economic viability of the process with respect to the efficiency in
the use of radiation. As a result of these limitations, researchers have focused attention on the development of
photocatalysts with better recovery and light absorption capacity. Hence, focus will be on replacement of the
commercial catalysts with locally sourced catalysts such as periwinkle shell ash. Periwinkle shell is a waste
product generated from the consumption.
periwinkle, a small greenish-blue marine snail housed in a V shaped spiral shell. It is found in many coastal
communities within Nigeria (Olutoge et al., 2012). After consumption of the edible part as sea food, the shell is
typically disposed off as waste thereby constituting environmental problems. Although some research work
have focused on utilising the shell as coarse aggregate in concrete, manufacture of break pads, as paving of
water logged areas e.t.c., yet a large amount of these shells are still disposed resulting in the need to find other
means of improving upon the reuse capacity of these shells (Aku et al., 2012).
The aim of this study therefore is to evaluate the potential use of periwinkle shell ash (PSA) for the
photocatalytic degradation of naphthalene in aqueous solution. The effects of factors such as contact time, initial
naphthalene concentration, catalyst dosage, pH, and amount of oxidant (Hydrogen peroxide, H2O2) on the
degradation process was investigated. The photocatalytic degradation of naphthalene was further evaluated by
carrying out kinetic (pseudo-first-order, pseudo-second-order, intra particle diffusion and Langmuir-
Hinshelwood models) and isotherm studies (using common isotherms such as Langmuir, and Freundlich
isotherms).
MATERIALS AND METHODS
Preparation and Characterisation of Adsorbent (Periwinkle shell ash)
Periwinkle shells were obtained from Evbuobanosa in Edo State of Nigeria. They were washed and dried in an
oven at 110°C to constant mass, followed by crushing, then calcined at 600°C in a muffle furnace. The
calcination was carried out in such a way that neither the fuel for heating not the fire gases came in contact with
the material that was being calcined. It was thereafter sieved to obtain fine particles (< 350Hm) of periwinkle
shell ash (PSA). The prepared PSA was characterized by determining the composition using X-Ray
Fluorescence (XRF) analysis. Complete mineralogical analysis was carried out by X-ray diffraction (XRD) to
determine the ultimate elemental composition of the PSA using a Philips X-ray diffractometer (Aku et al.,
2012). Fourier transform infrared spectrometry (FTIR) was also carried out on the PSA. The IR spectra of the
PSA were recorded using Perkin Elmer spectrum 100 FT–IR spectrometer in the frequency range 4000 to 400
cm-1
, operating in ATR (attenuated total reflectance) mode. The surface structure and other properties of the
PSA were evaluated by nitrogen adsorption method at -196ºC (Aisien et al., 2013). Nitrogen adsorption
isotherms were determined using an adsorption equipment (BET 624, Micro-meritics, Germany). The surface
area of the PSA was determined using the standard BET equation. The bulk density of the PSA was determined
following standard methods (APHA-AWWA-WPCF, 1989).
Preparation of Adsorbate
Analytical reagent grade naphthalene, provided by Griffin and George Ltd, Loughborough, England was used as
the representative PAH. A stock solution of naphthalene was prepared by dissolving 1 g of naphthalene in 1L of
a binary solution comprising 50 mL of methanol (British Drug Houses Ltd, England) and 950 mL of deionised
water. Naphthalene is a hydrophobic compound with low solubility in water. The water-methanol solution was
South African Journal of Chemical Engineering, vol. 19, 2014, no. 1, pp 31-45 33
used instead of pure deionised water to enhance the solubility of hydrophobic naphthalene (Agarry et al., 2013;
Chang et al., 2004). Working solutions with different concentrations of naphthalene were prepared by
appropriate dilutions of the stock solution with distilled water immediately prior to their use.
Analysis of Naphthalene in Aqueous Solution
A UV-Vis spectrophotometer (PG Instruments model T70) was used to determine the concentration of
undegraded naphthalene in the aqueous medium at a wavelength of 226 nm. The pH of the aqueous medium was
adjusted using 0.5 M HCl and 0.1 M NaOH solutions.
Batch Study of the Photocatalytic Degradation of Naphthalene
Batch photocatalytic degradation of naphthalene using PSA in the presence of UV radiation from sunlight was
carried out in mechanically agitated 250 mL jacketed glass flasks with a working volume of 100 mL. Two
grams (2 g) of PSA was added to the aqueous solution of naphthalene of the desired concentration. For all
studies, the suspensions were magnetically stirred without any permanent air bubbling. The temperature was
maintained at 20oC and monitored throughout the process (Lair et al., 2008). The effects of contact time, initial
naphthalene concentration, PSA dosage, amount of oxidant and pH of solution on the degradation efficiency
were investigated. At the end of each experiment the agitated solution mixture was filtered through a 0.45 μm
membrane and the residual concentration of naphthalene was determined spectrophotometrically. The
percentage photocatalytic degradation of naphthalene was calculated using the equation.
% Photodegradation = 𝐶𝑜− 𝐶𝑡
𝐶𝑜 x 100 (1)
where Co and Ct are the initial and the liquid-phase concentration of naphthalene at time t, respectively.
RESULTS AND DISCUSSION
Characterisation of PSA
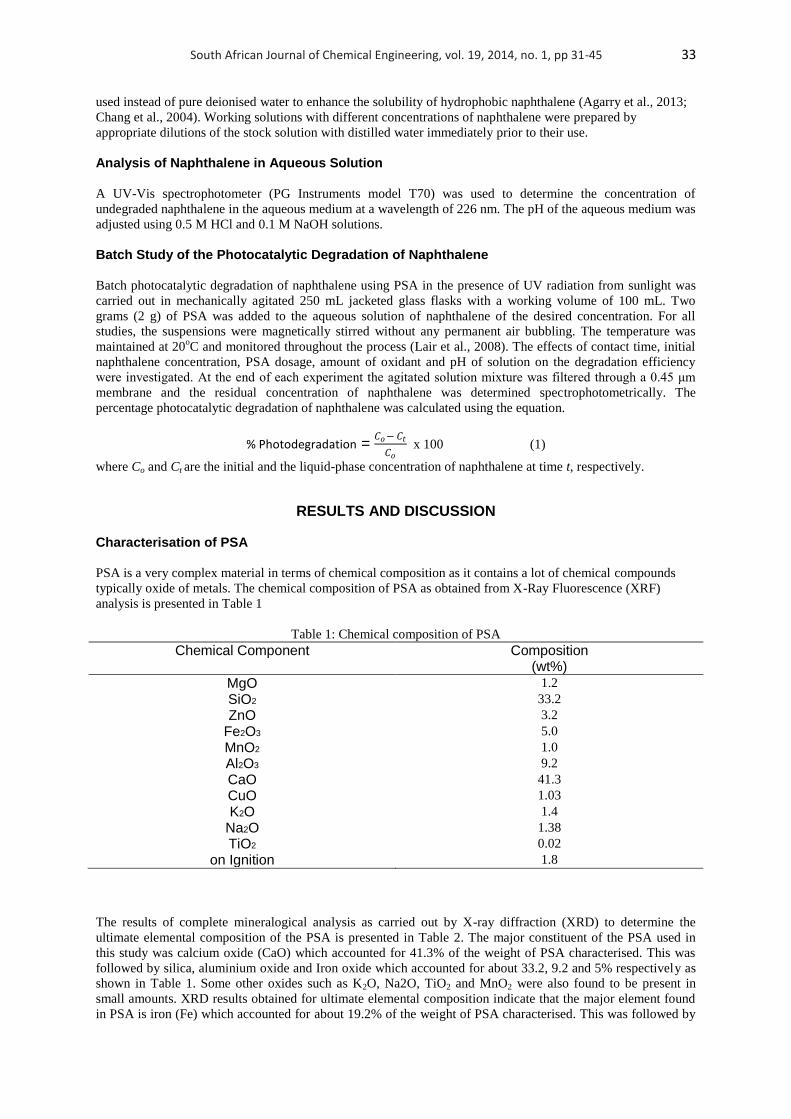
PSA is a very complex material in terms of chemical composition as it contains a lot of chemical compounds
typically oxide of metals. The chemical composition of PSA as obtained from X-Ray Fluorescence (XRF)
analysis is presented in Table 1
Table 1: Chemical composition of PSA
Chemical Component Composition (wt%)
MgO 1.2
SiO2 33.2
ZnO 3.2
Fe2O3 5.0
MnO2 1.0
Al2O3 9.2
CaO 41.3
CuO 1.03
K2O 1.4
Na2O 1.38
TiO2 0.02
on Ignition 1.8
The results of complete mineralogical analysis as carried out by X-ray diffraction (XRD) to determine the
ultimate elemental composition of the PSA is presented in Table 2. The major constituent of the PSA used in
this study was calcium oxide (CaO) which accounted for 41.3% of the weight of PSA characterised. This was
followed by silica, aluminium oxide and Iron oxide which accounted for about 33.2, 9.2 and 5% respectively as
shown in Table 1. Some other oxides such as K2O, Na2O, TiO2 and MnO2 were also found to be present in
small amounts. XRD results obtained for ultimate elemental composition indicate that the major element found
in PSA is iron (Fe) which accounted for about 19.2% of the weight of PSA characterised. This was followed by

South African Journal of Chemical Engineering, vol. 19, 2014, no. 1, pp 31-45 34
Zinc (Zn) and Nickel (Ni) which accounted for about 16.5 and 9% respectively as shown in Table 2. Some of
the oxides and elements presented in Tables 1 and 2 have been established to possess photocatalytic properties
thus supporting the choice of PSA for this study.
Table 2: Ultimate elemental composition of PSA
Chemical Component Composition (wt%)
Fe 19.20
Cr 6.30
V 1.50
Ni 9.00
Se 0.13
Pb 0.08
Al 12.30
Zn 16.50
Sn 8.00
Cd 0.05
Cu 2.40
Table 3: Physical properties of PSA
Property Value
Surface area (m2/g) 400
Bulk density (kg/m3) 2940
Porosity (-) 0.004
The surface area, bulk density, and porosity of the PSA used in this study are presented in Table 3. The results
presented in Tables 1, 2 and 3 are similar to those reported in the literature (Kosmatka et al., 2003; Owabor and
Iyaomolere, 2013; Umoh and Olusola, 2012).
The pattern of naphthalene uptake by PSA may be attributed to the active groups and bonds present in the
photocatalyst (Nagarajan et al., 2013). The result of FTIR analysis of the PSA in the range 350 to 4400 cm-1
is
shown in Figure 1. Peaks in the range of 3100 to 3500 cm-1
is indicative of the presence of OH groups and the
stretching of the N-H bond of the amino group (Park et al., 2005). Absorption bands in the range of 2700 to
1430 cm-1
and 900 to 1380 cm-1
are indicative of the presence of phenyl groups and the stretching of the C-O
bond in carboxylic groups present in the PSA.
Fig. 1: FTIR spectra of periwinkle shell ash
South African Journal of Chemical Engineering, vol. 19, 2014, no. 1, pp 31-45 35
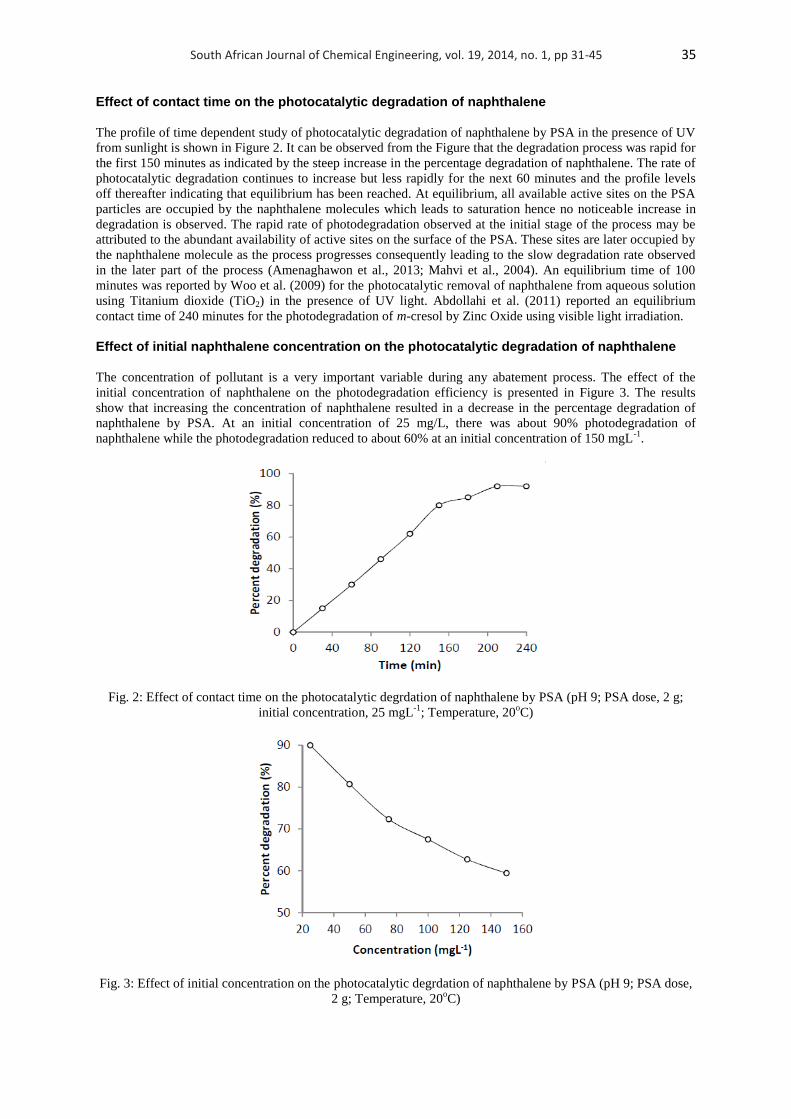
Effect of contact time on the photocatalytic degradation of naphthalene
The profile of time dependent study of photocatalytic degradation of naphthalene by PSA in the presence of UV
from sunlight is shown in Figure 2. It can be observed from the Figure that the degradation process was rapid for
the first 150 minutes as indicated by the steep increase in the percentage degradation of naphthalene. The rate of
photocatalytic degradation continues to increase but less rapidly for the next 60 minutes and the profile levels
off thereafter indicating that equilibrium has been reached. At equilibrium, all available active sites on the PSA
particles are occupied by the naphthalene molecules which leads to saturation hence no noticeable increase in
degradation is observed. The rapid rate of photodegradation observed at the initial stage of the process may be
attributed to the abundant availability of active sites on the surface of the PSA. These sites are later occupied by
the naphthalene molecule as the process progresses consequently leading to the slow degradation rate observed
in the later part of the process (Amenaghawon et al., 2013; Mahvi et al., 2004). An equilibrium time of 100
minutes was reported by Woo et al. (2009) for the photocatalytic removal of naphthalene from aqueous solution
using Titanium dioxide (TiO2) in the presence of UV light. Abdollahi et al. (2011) reported an equilibrium
contact time of 240 minutes for the photodegradation of m-cresol by Zinc Oxide using visible light irradiation.
Effect of initial naphthalene concentration on the photocatalytic degradation of naphthalene
The concentration of pollutant is a very important variable during any abatement process. The effect of the
initial concentration of naphthalene on the photodegradation efficiency is presented in Figure 3. The results
show that increasing the concentration of naphthalene resulted in a decrease in the percentage degradation of
naphthalene by PSA. At an initial concentration of 25 mg/L, there was about 90% photodegradation of
naphthalene while the photodegradation reduced to about 60% at an initial concentration of 150 mgL-1
.
Fig. 2: Effect of contact time on the photocatalytic degrdation of naphthalene by PSA (pH 9; PSA dose, 2 g;
initial concentration, 25 mgL-1
; Temperature, 20oC)
Fig. 3: Effect of initial concentration on the photocatalytic degrdation of naphthalene by PSA (pH 9; PSA dose,
2 g; Temperature, 20oC)

South African Journal of Chemical Engineering, vol. 19, 2014, no. 1, pp 31-45 36
The trend observed can be explained by the fact that at high concentrations of naphthalene, the active sites on
the PSA are occupied by the naphthalene molecules and its intermediates thereby leading to reduced generation
of the electron-hole pair (e--h
+) which consequently reduces the photodegradation efficiency (Abdollahi et al.,
2011; Konstantinou and Albanis, 2004). Another reason could be that with every other variable held constant
while the initial naphthalene concentration is increased, the amount of hydroxyl and oxygen (•OH and O2 2-
) free
radicals formed on the surface of the PSA is also constant. Hence the relative ratio of these radicals available for
attacking the naphthalene molecules decreases and the photodegradation efficiency consequently decreases
(Lathasree et al., 2004; Rana and Sharma, 2010).
Effect of PSA dosage on the photocatalytic degradation of naphthalene
The result of the investigation of the effect of PSA dosage on the photocatalytic degradation of naphthalene is
presented in Figure 4. The percentage degradation of naphthalene initially increased with increase in PSA
dosage up to a maximum value of about 90% at a PSA dosage of 2 g. Further increase in PSA dosage resulted in
a decrease in the percentage degradation of naphthalene. The initial increase in percentage degradation of
naphthalene observed could be attributed to the fact that increasing the amount of PSA increases the number of
active sites on the PSA surface which in turn increases the number of free radicals (•OH and O2 2-
) consequently
leading to enhanced photodegradation of naphthalene (Inamdar and Singh, 2008). Furthermore, more of the
naphthalene molecules were removed from the solution by adsorption as a result of the increase in the dosage of
PSA.
Fig. 4: Effect of PSA dosage on the photocatalytic degrdation of naphthalene by PSA (pH 9; initial
concentration, 25 mgL-1
; Temperature, 20oC)
Fig. 5: Effect of pH on the photocatalytic degrdation of naphthalene by PSA (Initial concentration, 25 mgL-1
PSA dose, 2 g; Temperature, 20oC)
South African Journal of Chemical Engineering, vol. 19, 2014, no. 1, pp 31-45 37
The decrease in photodegradation efficiency observed beyond the optimum PSA dosage might have been as a
result of some factors. These factors include increased opacity of the aqueous medium and enhancement of the
light reflectance as a result of the excess of PSA particles, agglomeration and sedimentation of the PSA particles
is possible at high PSA dosage, thus making a fraction of the PSA surface inaccessible for radiation absorption
and consequently resulting in a decrease in the degradation of the naphthalene molecules (Abdollahi et al., 2011;
Konstantinou and Albanis, 2004; Rana and Sharma, 2010).
Effect of pH on the photocatalytic degradation of naphthalene
The effect of pH on the photocatalytic degradation of naphthalene by PSA is presented in Figure 5. The pH of
the aqueous medium is important in that it controls the surface charge properties of the photocatalyst (Abdollahi
et al., 2011). It also affects the production of hydroxyl radicals which are powerful oxidizing agents (Rana and
Sharma, 2010). The percentage degradation of naphthalene initially increased with increase in pH up to a
maximum value of about 92 % at a pH of 9. Further increase in pH did not result in an increase in the
percentage degradation of naphthalene. Similar observations have been reported by Qamar et al. (2005) for the
photocatalysed degradation of two selected azo dye derivative in aqueous suspension as well as Abdollahi et al.
(2011) for the photodegradation of m-cresol by Zinc Oxide under visible-light irradiation. The initial increase in
percentage degradation of naphthalene observed could be attributed to the increase in the adsorption of
naphthalene on the PSA surface which results from a decrease in the electrostatic repulsive forces and increased
interaction between photocatalyst surface and naphthalene molecules (Kosmulski, 2006). Additionally, in
alkaline solutions, the hydroxyl ions (OH-) are readily generated. When a hole is generated by the photocatalyst,
an electron is abstracted from the OH- ions converting it into hydroxyl radicals (•OH) which are responsible for
the photodegradation of naphthalene (Menkiti et al., 2009). However, beyond the pH value of 9, the
photodegradation efficiency was observed to decrease. This could be attributed to the fact that at high pH values
and consequently high hydroxyl ions (OH-) concentrations, the rate at which the hydroxyl radicals (•OH) are
used up is accelerated resulting in a decrease in the photodegradation efficiency (Abdollahi et al., 2011). In
addition, the abundant hydroxyl ions (OH-) generated at high pH values will compete with the electron rich
naphthalene for adsorption on the PSA surface. The hydroxyl ions (OH-) will make the PSA surface to be
negatively charged and as a result, the approach of the naphthalene molecules to the PSA surface will be slowed
because of the repulsive force between the hydroxyl ions (OH-) and the naphthalene molecules thereby leading
to a decrease in the photodegradation efficiency (Kothari et al., 2007).
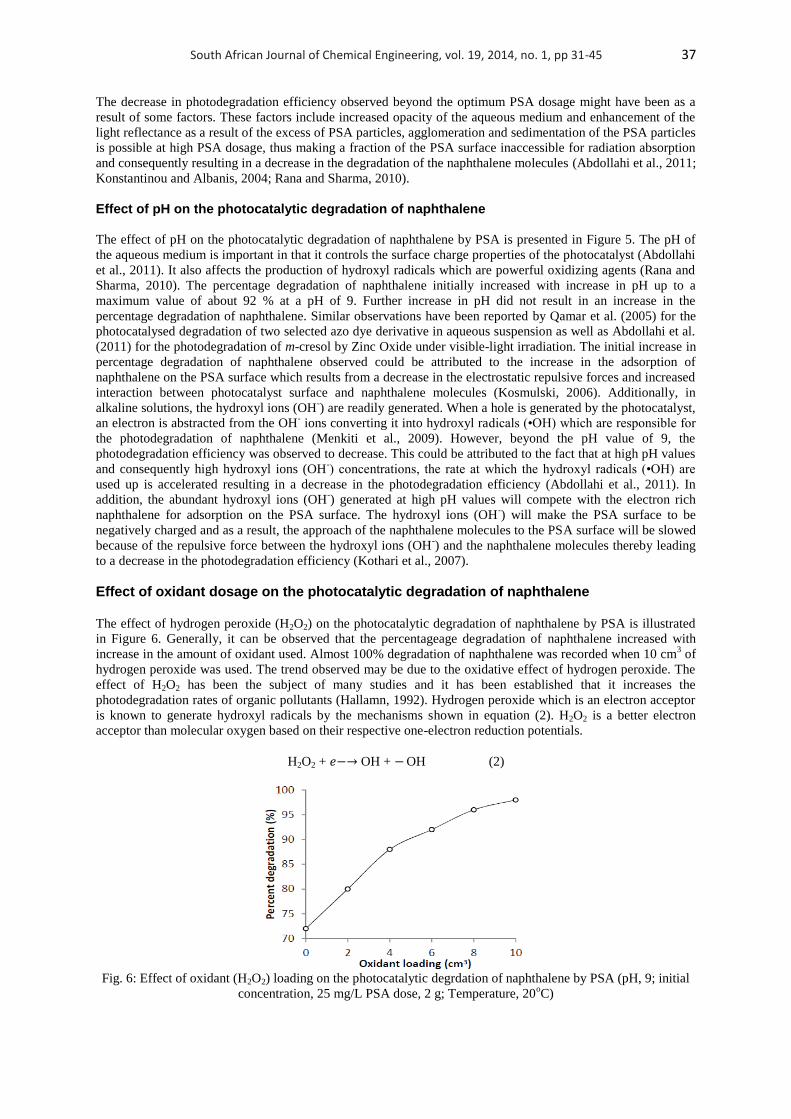
Effect of oxidant dosage on the photocatalytic degradation of naphthalene The effect of hydrogen peroxide (H2O2) on the photocatalytic degradation of naphthalene by PSA is illustrated
in Figure 6. Generally, it can be observed that the percentageage degradation of naphthalene increased with
increase in the amount of oxidant used. Almost 100% degradation of naphthalene was recorded when 10 cm3 of
hydrogen peroxide was used. The trend observed may be due to the oxidative effect of hydrogen peroxide. The
effect of H2O2 has been the subject of many studies and it has been established that it increases the
photodegradation rates of organic pollutants (Hallamn, 1992). Hydrogen peroxide which is an electron acceptor
is known to generate hydroxyl radicals by the mechanisms shown in equation (2). H2O2 is a better electron
acceptor than molecular oxygen based on their respective one-electron reduction potentials.
H2O2 + 𝑒−→ OH + − OH (2)
Fig. 6: Effect of oxidant (H2O2) loading on the photocatalytic degrdation of naphthalene by PSA (pH, 9; initial
concentration, 25 mg/L PSA dose, 2 g; Temperature, 20oC)

South African Journal of Chemical Engineering, vol. 19, 2014, no. 1, pp 31-45 38
The increase in percentage degradation of naphthalene observed when the amount of H2O2 was increased may
be attributed to some factors which include the ability of H2O2 to remove the electrons trapped on the surface of
the PSA thereby lowering the electron-hole recombination rate and consequently improving the utilisation of
holes in the production of the hydroxyl radicals (•OH). In addition H2O2 can also cleave in the presence of UV
radiation to directly produce the hydroxyl radicals (•OH). Lastly, rapid oxygen consumption or passive oxygen
mass transfer in the liquid phase may result to that phase being depleted of oxygen, hence H2O2 addition
alleviates this problem. The free radicals formed from the addition of H2O2 create a strong oxidation
environment which favours the photocatalytic degradation of naphthalene.
Kinetics of Photodegradation of Naphthalene The kinetics of photodegradation was studied for its important function in the treatment of naphthalene
contaminated aqueous systems. Four kinetic models namely Lagergren pseudo first order, pseudo second-order,
intra particle diffusion and Langmuir-Hinshelwood kinetic models were used to elucidate the mechanism of the
degradation process.
Pseudo-first order model The Lagergren pseudo first order kinetic model (Lagergren, 1898) has been widely used to describe the
kinetics of heterogeneous treatment processes. It is expressed in its integrated linear form in Equation (3).
ln(qe -qt) = ln(qe - klt) (3)
where qe and qt (mg/g) are adsorption capacity at equilibrium and at time t, respectively, k1 is the rate constant of
pseudo first order adsorption (min-1). The values of ln(qe – qt) were linearly correlated with t. The plot of ln(qe –
qt) versus t resulted in a linear relationship from which k1 and qe was determined from the slope and intercept
respectively as shown in Figure 7. The first order rate constants calculated from the plot are given in Table 4. A
linear relationship observed in the semi-log plot is indicative of the applicability of the model and the first order
of the process.
Pseudo-second order model
The pseudo-second order kinetic model which assumes that chemisorption is the rate determining step can be
expressed in its integrated linear form as in Equation (4).
𝑡
𝑞𝑡=
1
𝑘2𝑞𝑒2 +
1
𝑞𝑒t (4)
The initial adsorption rate, h (mg.g-1
.min-1
) is expressed as follows:
ℎ = 𝑘2𝑞𝑒2 (5)
Where k2 is the rate constant of the pseudo second order process (g.mg-1.min-1). The plot of (t/qt) and t of
Equation (4) is shown in Figure 8. The kinetic constants calculated from the plot are shown in Table 4. It can be
observed that the model did not fit the experimental data. This indicates that the model was not able to describe
the mechanism of the process.

South African Journal of Chemical Engineering, vol. 19, 2014, no. 1, pp 31-45 39
Fig. 7: Pseudo first order model fitted to batch equilibrium data for naphthalene photodegradation by PSA (pH,
9; initial concentration, 25 mgL-1
PSA dose, 2 g; Temperature, 20oC)
Fig. 8: Pseudo second order model fitted to batch equilibrium data for naphthalene photodegradation by PSA
(pH, 9; initial concentration, 25 mgL-1
PSA dose, 2 g; Temperature, 20oC)
Intra particle diffusion model
The intra particle diffusion kinetic model (Weber and Morris, 1963) was fitted to the batch equilibrium data to
elucidate the diffusion mechanism. The model equation is presented in Equation (6).
qt = kpt1/2
+ c (6)
Where Kp is the intra particle diffusion rate constant (mgg-1
min-1/2
) and C is an indication of boundary layer
effect. The larger the intercept, the greater is the contribution of the surface sorption in the rate controlling step.
The calculated values of the intra particle diffusion rate constant and the boundary layer thickness are presented
in Table 4. The plot of qt vs t1/2
as presented in Figure 9 indicates the existence (although not significant) of
some boundary layer effect and further showed that intra particle diffusion was not the only rate limiting step.
Langmuir-Hinshelwood model
The Langmuir–Hinshelwood kinetic equation has been applied severally to the analysis of heterogeneous
photocatalytic reactions (Bianco-Prevot et al., 2001; Houas et al., 2001; Lachheb et al., 2002; Stylidi et al.,
2003).
r = 𝑘𝐾𝐶
1+𝐾𝐶 (7)
where r is the degradation rate of the pollutant (mg/L.min), C the concentration of the pollutant (mg/L), t the
irradiation time, k the reaction rate constant (mg/L.min), and K is the adsorption coefficient of the pollutant
(L/mg). The values of the calculated constants are presented in Table 4. A linear expression was obtained by
plotting the reciprocal initial rate against the reciprocal initial concentration (Figure 10).

South African Journal of Chemical Engineering, vol. 19, 2014, no. 1, pp 31-45 40
Fig. 9: Intra particle diffusion model fitted to batch equilibrium data for naphthalene
photodegradation by PSA (pH, 9; initial concentration, 25 mgL-1
PSA dose, 2 g; Temperature, 20oC)
Fig. 10: Langmuir-Hinshelwood model fitted to batch equilibrium data for
naphthalene photodegradation by PSA (pH, 9; PSA dose, 2 g; Temperature, 20oC)
In conclusion, Table 4 shows that the tested kinetic models fitted well to the kinetic data with high correlation
coefficients with the exception of the pseudo second order model. However, the Langmuir-Hinshelwood
resulted in the best fit with highest correlation coefficient to describe the adsorption behaviour of naphthalene
onto PSA.
Table 4: Kinetic constant parameter values for the photodegradation of naphthalene by PSA
Kinetic Model Parameters Values
Lagergren Pseudo First-Order k1 (min-1)
qe (mg/g)
0.626
1.116
R2 0.972
qe (mg/g) -3.049
R2 0.340
Intra particle diffusion Kp (mg/g/min1/2) 0.352
C (mg/g) 0.003
R2 0.986
Langmuir-Hinshelwood k (mgL-1.min) 333.333
K (Lmg-1) 0.00102
R2 0.998
Isotherm Studies Isotherm studies were carried out to explore the relationship between naphthalene uptake (qe) and its
equilibrium concentration in the solution (Ce). Equilibrium data was analysed using adsorption isotherms which
are helpful in determining the adsorption capacity of PSA for naphthalene. The Langmuir and Freundlich
adsorption isotherm models were used to analyze the equilibrium data for the photodegradation of naphthalene

South African Journal of Chemical Engineering, vol. 19, 2014, no. 1, pp 31-45 41
using PSA. The curves of the related adsorption isotherms were regressed and parameters of the equations were
thus obtained.
Langmuir isotherm
The Langmuir isotherm model (Langmuir, 1914) has been used empirically because it contains the two useful
parameters (qo and KL), which reflect the two important characteristics of the sorption system. It assumes that
the adsorption process is of the monolayer type which indicates that the adsorbate is adsorbed onto a surface
with finite number of sites which are homogeneously distributed over the surface of the adsorbent (Agarry and
Aremu, 2012). The Langmuir isotherm equation is given as:
qe= 𝑞𝑜𝐾𝑙𝐶𝑒
1+𝐾𝑙𝐶𝑒 ( 8)
qo is the maximum sorption capacity (mg/g) of the adsorbent while KL is the sorption constant (L/mg) at a given
temperature. The parameters of the Langmuir isotherm equation were obtained by fitting the equation directly to
the equilibrium data using the non-linear curve fitting tool of MATLAB 7.0 software package. The shape
obtained for the isotherm is shown in Figure 11. The values of the Langmuir isotherm parameters as well as the
correlation coefficient (R2) of the Langmuir equation for the photodegradation of naphthalene by PSA are given
in Table 6. The values of these parameters were close to those reported by Agarry et al. (2013) and Tsyntsarski
et al. (2011) for the adsorption of naphthalene by spent tea leaves and activated carbon produced from biomass
and coal wastes respectively.
The essential characteristics of the Langmuir isotherm model can also be explained in terms of a dimensionless
constant referred to as the separation factor (RL) defined in Equation (9) (Anirudhan and Radhakrishnan, 2008;
Annadurai et al., 2007).
Rl= 𝑞𝑜𝐾𝑙𝐶𝑒
1+𝐾𝑙𝐶𝑜 (9)
Co is the initial concentration of naphthalene. The value of the separation factor determines the nature of
adsorption as follows: RL > 1 unfavourable, RL = 1 linear, 0<RL<1 favourable and RL = 0
irreversible. For this study, the values of RL given in Table 5 are between zero and one indicating that the
adsorption was favourable.
Table 5: RL values and type of isotherm
Initial concentration(mg/L) RL Value
25 0.739
50 0.587
75 0.486
100 0.415
125 0.362
150 0.321
Freundlich isotherm
The Freundlich isotherm is an empirical equation employed to describe heterogeneous systems. The Freundlich
equation is expressed as:
qe = Kf (Ce)
1/n (10)
Table 6: Kinetic parameters for Langmuir and Freundlich isotherms
Langmuir isotherm Freundlich isotherm
qo (mg/g) KL (L/mg) R2 Kf (mg/g) n R
2
12.346 0.0141 0.993 0.225 1.225 0.968

South African Journal of Chemical Engineering, vol. 19, 2014, no. 1, pp 31-45 42
Figure 11: Langmuir isotherm model fitted to batch equilibrium data for naphthalene photodegradation by PSA
(pH, 9; PSA dose, 2 g; Temperature, 20oC)
Figure 12: Freundlich isotherm model fitted to batch equilibrium data for naphthalene
photodegradation by PSA (pH, 9; PSA dose, 2 g; Temperature, 20oC)
The high values of the correlation coefficients as shown in Table 6 indicates that the data conformed well to
both isotherm equations; however, a better fit resulted for the case of Langmuir isotherm equation as seen in the
higher value of the correlation coefficient. Values of Kf and n have been reported by various researchers on
adsorption of naphthalene. Pal (2012) reported Kf and n values of 0.3 and 1.12, 0.025 and 1.47 for the adsorption
of naphthalene by sugarcane bagasse and rice husk respectively. Agarry et al. (2013) reported Kf and n values
2.44 and 1.85 respectively for the adsorption of naphthalene on spent tea leaves. Therefore the constants
obtained in this study are comparable to those reported by previous researchers. The difference could be as a
result of difference in the range of concentration, type of material used, pH, temperature and properties of the
adsorbent such as functional groups present on the surface, surface area, pore structure, etc (Agarry and Aremu,
2012). The shape of the adsorption isotherm presented in Figure 11 indicates that it belongs to the L2 category
of isotherm which is the Langmuir type of adsorption (Annadurai et al., 1997). Agarry and Aremu, (2012)
reported that this type of isotherm is usually met with when the adsorbate is strongly attracted to the surface of
the adsorbent.
Intermediates of Naphthalene Degradation Determination of the some intermediate photoproducts of naphthalene photodegradation was carried out by GC-
MS analysis. Results of the analyses revealed a series of peaks at different retention times. The degradation of
naphthalene progressed through the formation of several intermediates as shown in Table 7. The most abundant
of these was 2-formylcinnamaldehyde with a retention time of 21.1 minutes. This compound was also identified
by other researchers as an intermediate degradation product of naphthalene (Lair et al., 2008; Pramauro et al.,
1998). Aside from this, 5-Hydroxy-l,4- naphthoquinone, and naphthols were also present in high amounts
(Hykrdová et al, 2002). Other compounds, 1,2-benzenedicarboxylic acid, phthalic acid, and 1,4-Naphthoquinone
were also present though in smaller amounts.

South African Journal of Chemical Engineering, vol. 19, 2014, no. 1, pp 31-45 43
Table 7: Reaction intermediates indentified by GC-MS
Degradation product Retention time (min)
2-Formylcinnamaldehyde 21.1
1-Naphthol 20.7
2-Naphthol 20.8
1,4-Naphthoquinone 19.4
5-Hydroxy-l,4-naphthoquinone 20.9
1,2-benzenedicarboxylic acid 16.6
phthalic acid 21.0
CONCLUSIONS
The batch photodegradation of naphthalene in aqueous medium using periwinkle shell ash in the presence of
UV from sunlight was investigated. Photodegradation of naphthalene by PSA is influenced by factors such as
contact time, initial naphthalene concentration, PSA dosage, presence of oxidant and solution pH. For the
conditions considered in this study, the optimum values obtained are as follows: contact time, 210 minutes;
initial naphthalene concentration, 25 mg/L; PSA dosage, 2 g; pH, 9. The addition of electron accepting oxidant
(H2O2) enhanced the photodegradation process with almost 100 percent degradation achieved. The adsorption
equilibrium data fitted well to the Langmuir isotherm equation indicating mono layer type adsorption while the
kinetics of the process was well described by the Langmuir-Hinshelwood kinetic model with high correlation
coefficient value. This study has demonstrated that the low cost photocatalyst, PSA from waste materials can be
used for removal of naphthalene from aqueous solution. Also the kinetic information obtained can be used for
designing economically viable treatment systems for naphthalene abatement
REFERENCES
1. Abdollahi, Y., Abdullah, A.H., Zainal, Z. and Yusof, N.A. (2011). Photodegradation of mcresol by
Zinc Oxide under Visible-light Irradiation. International Journal of Chemistry, 3(3), 31-43.
2. Agarry, S. E., and Aremu, M.O. (2012). Batch equilibrium and kinetic studies of
simultaneous adsorption and biodegradation of phenol by pineapple peels immobilized
Pseudomonas aeruginosa NCIB 950. British Biotechnlogy Journal, 2(1), 26-48.
3. Agarry, S.E., Ogunleye, O.O and Aworanti, O.A. (2013). Biosorption equilibrium, kinetic and
thermodynamic modelling of naphthalene removal from aqueous solution onto modified spent
tea leaves. Environmental Technology, 34(7), 825-839
4. Ahmed, S., Rasul, M.G., Martens, W.N., Brown, R., and Hashib, M.A. (2011). Advances in
heterogeneous photocatalytic degradation of phenols and dyes in wastewater: a
review. Water, Air, & Soil Pollution, 215(1-4), 3-29.
5. Aisien, F.A., Amenaghawon, N.A. and Akhidenor, S.A. (2013). Adsorption of Ethylbenzene
from Aqueous Solution using Recycled Rubber from Scrap Tyre. Journal of Scientific
Research and Reports, 2(2), 497-512
6. Aku, S.Y., Yawas, D.S., Madakson, P.B., and Amaren, S.G. (2012).Characterization of
Periwinkle Shell as Asbestos-Free Brake Pad Materials. The Pacific Journal of Science and
Technology, 13(2), 57-63.
7. Alamo-Nole, L.A., Perales-Perez, O., and Roman-Velazquez, F.R. (2011). Sorption study of
toluene and xylene in aqueous solutions by recycled tires crumb rubber. Journal of hazardous
materials, 185(1), 107-111.
8. Amenaghawon, N.A., Aisien, F.A., and Agho, O.E. (2013). Adsorption of Toluene by Waste
Tyre Rubber Granules: Effect of Operating Variables, Kinetic and Isotherm Studies,
International Journal of Scientific Research in Knowledge, 1(10), 427-428.
9. Ania, C.O., Cabal, B., Pevida, C., Arenillas, A., Parra, J.B., Rubiera, F., and Pis, J.J. (2007).Removal
of naphthalene from aqueous solution on chemically modified activated carbons. Water research,
41(2), 333-340.
10. Anirudhan, T.S. and Radhakrishnan, P.G. (2008). Thermodynamics and kinetics of adsorption
of Cu (II) from aqueous solutions onto a new cation exchanger derived from tamarind fruit
shell, Journal of Chemical Thermodynamics 40, 702–709.
11. Annadurai, A., Ling, L.Y. and Lee, J.F. (2007). Biodegradation of phenol by Pseudomonas
pictorum on immobilized with chitin. African Journal of Biotechnology, 6(3), 296-303.
South African Journal of Chemical Engineering, vol. 19, 2014, no. 1, pp 31-45 44
12. Annadurai, G., and Krishnan, M.R.V. (1997). Batch equilibrium adsorption of reactive dye on
to natural biopolymer. Iranian Polymer Journal, 16, 169-172.
13. APHA-AWWA-WPCF (1989). Standard methods for the examination of water and
wastewater. American Public Health Association, New York.
14. ATSDR. (2005). Toxicological Profile for Naphthalene, 1-methylnaphthalene, and 2-
methylnaphthalene; U.S. Department of Health and Human Services, Agency for Toxic
Substances and Disease Registry: Atlanta, GA, USA, 1-291.
15. Bianco-Prevot, A., Baiocchi, C., Brussino, M.C., Pramauro, E., Savarino, P., Augugliaro, V.,
Marci, G. and Palmisano, L. (2001). Photocatalytic degradation of acid blue 80 in aqueous
solutions containing TiO2 suspensions. Environmental science & Technology, 35(5), 971-976.
16. Chang, C.F., Chang, C.Y., Chen, K.H., Tsai, W.T., Shie, J.L. and Chen, Y.H. (2004).
Adsorption of naphthalene on zeolite from aqueous solution. Journal of colloid and Interface
Science, 277(1), 29-34.
17. Gautam, S., Kamble, S.P., Sawant, S.B. and Pangarkar, V.G. (2005). Photocatalytic
degradation of 4-nitroaniline using solar and artificial UV radiation. Chemical Engineering
Journal, 110(1), 129-137.
18. Hallamn, M. (1992). Photodegradation of di-n-butyl-ortho-phthalate in aqueous solution.
Journal of Photochemistry and Photobiology A: Chemistry, 66(2), 215-223.
19. Henner, P., Schiavon, M., Morel, J.L. and Lichtfouse, E. (1997). Polycyclic aromatic
hydrocarbon (PAH) occurrence and remediation methods, Anal. Mag. 25, 56–59.
20. Houas, A., Lachheb, H., Ksibi, M., Elaloui, E., Guillard, C. and Hermann, J.M. (2001).
Photocatalytic degradation pathway of methylene blue in water. Applied Catalysis B:
Environmental, 31(2), 145-157.
21. Hykrdová, L., Jirkovský, J., Mailhot, G. and Bolte, M. (2002). Fe (III) photoinduced and QTiO2
photocatalysed degradation of naphthalene: comparison of kinetics and proposal of
mechanism. Journal of Photochemistry and Photobiology A: Chemistry, 151(1), 181-193.
22. Inamdar, J. and Singh, S.K. (2008). Photocatalytic detoxification method for zero effluent
discharge in dairy industry: Effect of operational parameters. International Journal of
Chemical and Biological Engineering, 1(4), 160-164.
23. Jia, C. and Batterman, S. (2010). A Critical Review of Naphthalene Sources and Exposures
Relevant to Indoor and Outdoor Air. International Journal of Environmental Research and
Public Health, 7, 2903-2939.
24. Kothari, S., Ameta, P. and Ameta, R. (2007). Photocatalytic bleaching of Evans blue over
zinc oxide particulate system. Indian Journal of Chemistry Section A, 46(3), 432-435
25. Kosmulski, M. (2006). pH-dependent surface charging and points of zero charge: III. Update,
Journal of Colloid and Interface Science, 298(2), 730-741
26. Konstantinou, I.K. and Albanis, T.A. (2004). TiO2-assisted photocatalytic degradation of azo
dyes in aqueous solution: kinetic and mechanistic investigations: A review. Applied Catalysis
B: Environmental, 49(1), 1-14.
27. Kosmatka, S.H., Kerkhoff, B. and Panarese, W.C. (2003). Design and Control of Concrete
Mixtures, EB001, 14th edition, Portland Cement Association, Skokie, Illinois, USA.
28. Lachheb, H., Puzenat, E., Houas, A., Ksibi, M., Elaoui, E., Guillard, G. and Hermann, J.M.
(2002). Photocatalytic degradation of various types of dyes (Alizarin S, Crocein Orange G,
Methyl Red, Congo Red, Methylene Blue) in water by UV-irradiated titania, Applied
Catalysis B: Environmental, 39(1), 75-90.
29. Lagergren, S. (1898). Zur theorie der sogenannte, adsorption geloster stoffe, Kungliga
Svenska vetenskaps akademiens. HAndlingar, 24, 1-39.
Lair, A., Ferronato, C., Chovelon, J. and Herrmann, J. (2008). Naphthalene degradation in
water by heterogeneous photocatalysis: An investigation of the influence of inorganic anions.
Journal of Photochemistry and Photobiology A: Chemistry.193, 193–203.
30. Langmuir, I. (1914). The adsorption of gases on plane surfaces of glass, mica and platinum.
Journal of American Chemical Society, 40, 361-368.
31. Lathasree, S., Rao, A., SivaSankar, B., Sadasivam, V. and Rengaraj, K. (2004).
Heterogeneous photocatalytic mineralisation of phenols in aqueous solutions. Journal of
Molecular Catalysis A: Chemical, 223(1-2), 101-105.
32. Legube, B., Guyon, S., Sugimitsu, H., and Dore, M. (1986). Ozonation of Naphthalene in
Aqueous Solution- I: Ozone Consumption and Ozonation Products. Water Research
WATRAG, 20(2).
33. Li, Z., Mulholland, J.A., Romanoff, L.C., Pittman, E.N., Trinidad, D.A., Lewin, M.D. and
Sjödin, A. (2010). Assessment of non-occupational exposure to polycyclic aromatic

South African Journal of Chemical Engineering, vol. 19, 2014, no. 1, pp 31-45 45
hydrocarbons through personal air sampling and urinary biomonitoring. Journal of
Environmental Monitoring, 12(5), 1110-1118.
34. Liu, Z., Jacobson, A.M. and Luthy, R.G. (1995). Biodegradation of naphthalene in aqueous
nonionic surfactant systems. Applied and environmental microbiology, 61(1), 145-151.
35. Mahvi AH, Maleki A, and Eslami A. (2004). Potential of Rice Husk Ash for Phenol Removal
in Aqueous Systems. American Journal of Applied Sciences. 1(4), 321-326.
36. Menkiti, M.C., Nnaji, P.C. and Onukwuli, O.D. (2009). Coag-flocculation kinetics and
functional parameters response of periwinkle shell coagulant (PSC) to pH variation in organic
rich coal effluent medium. Nature and Science, 7(6), 1-18.
37. Nagarajan, N., Gunasekaran, P. and Rajendran, P. (2013). Kinetic Studies of Economically
Viable Sorbents in Aquatic Nickel Solution and their Potential in Electroplating Effluent
Treatment. Advanced Biotech, 13(4), 5-11.
38. Olutoge, F.A., Okeyinka, O.M. and Olaniyan, O.S. (2012). Assessment of the suitability of
periwinkle shell ash (psa) as partial replacement for ordinary portland cement (opc) in
concrete. International Journal of Research and Reviews in Applied Sciences, 10(3), 428-434
39. Owabor, C. N. and Iyaomolere, A. I. (2013). Evaluation of the Influence of Salt Treatment on
the Structure of Pyrolyzed Periwinkle Shell. Journal of Applied Sciences and Environmental
Management, 17(2), 321-327.
40. Pal, D. (2012). Adsorption of polycyclic aromatic hydrocarbons using agricultural wastes:
Effect of lignin content, International Conference on Chemical, Ecology and Environmental
Sciences (ICEES 2012), Bangkok, March 17–18, 2012.
41. Park, D., Yun, Y.S. and Park, J.M. (2005). Studies on hexavalent chromium biosorption by chemically
treated biomass of Ecklonia sp. Chemosphere, 60, 1356-1364
42. Pramauro, E., Prevot, A.B., Vincenti, M. and Gamberini, R. (1998). Photocatalytic
degradation of naphthalene in aqueous TiO2 dispersions: Effect of non-ionic
surfactants. Chemosphere, 36(7), 1523-1542.
43. Qamar, M., Saquib, M., and Muneer, M., (2005). TiO2-mediated photocatalysed degradation
of two selected azo dye derivative chryosidine R and acid red 29 in aqueous suspension.
Desalination, 186, 255-271.
44. Rana, S. and Sharma, T. (2010). Photocatalytic Degradation of 2-Nitroaniline: A Major Water
Pollutant. Dronacharya Research Journal, 2(2), 47-52.
45. Stylidi, M., Kondarides, D.I. and Verykios, X.E. (2003). Pathways of solar light-induced photocatalytic
degradation of azo dyes in aqueous TiO2 suspensions. Applied Catalysis B:
Environmental, 40(4), 271-286.
46. Tsyntsarski, B., Petrova, B., Budinova, T., Petrov, N., Velasco, L. and C.O. Ania, (2011).
Characterization and application of activated carbon from biomass and coal wastes for
naphthalene removal, Bulgarian Chemical Communications 43, 552–557.
47. Umoh, A.A. and Olusola, K.O. (2012). Compressive Strength and Static Modulus of
Elasticity of Periwinkle Shell Ash Blended Cement Concrete. International Journal of
Sustainable Construction Engineering and Technology, 3(2), 45-55.
48. Vasconcelos, T.G., Kümmerer, K., Henriques, D.M. and Martins, A.F. (2009). Ciprofloxacin
in hospital effluent: degradation by ozone and photoprocesses. Journal of hazardous
Materials, 169(1), 1154-1158.
49. Weber W.J. and Morris, J. C. (1963). Kinetics of adsorption on carbon from solution. Journal
of the Sanitary Engineering Division of American Society of Civil Engineering. 89, 31-60.
50. Wilson, N.K., Chuang, J.C., Lyu, C., Menton, R. and Morgan, M.K. (2003). Aggregate
exposures of nine preschool children to persistent organic pollutants at day care and at
home. Journal of Exposure Science and Environmental Epidemiology, 13(3), 187-202.
51. Woo, O.T., Chung, W.K., Wong, K.H., Chow, A. T. and Wong, P.K. (2009). Photocatalytic
oxidation of polycyclic aromatic hydrocarbons: Intermediates identification and toxicity
testing. Journal of Hazardous Materials, 168(2), 1192-1199.
52. Wu, R.J., Chen, C.C., Chen, M.H. and Lu, C.S. (2009). Titanium dioxide-mediated
heterogeneous photocatalytic degradation of terbufos: Parameter study and reaction
pathways. Journal of Hazardous Materials, 162(2), 945-953.
53. Zhou, A., Peng, J., Chen, Z., Du, J., Guo, Z., Ren, N. and Wang, A. (2012). Statistical
Optimization of Operational Parameters for Enhanced Naphthalene Degradation by
TiO2/Fe3O4-SiO2 Photocatalyst. International Journal of Photoenergy. 2012, 1-9.