PHOTOCATALYTIC DEGRADATION OF …ethesis.nitrkl.ac.in/6840/1/PHOTOCATALYTIC_Bagwan_2015.pdfA THESIS...
55
A THESIS ON PHOTOCATALYTIC DEGRADATION OF HAZARDOUS SAFRANIN (O) DYE BY USING SELF SYNTHESIZED TiO 2 NANOPARTICLES Submitted by Mr. SOYAB SALIM BAGWAN Roll No. 213CH1114 In partial fulfilment for the award of the degree of MASTER OF TECHNOLOGY in CHEMICAL ENGINEERING Under the Supervision of Dr. ARVIND KUMAR DEPARTMENT OF CHEMICAL ENGINEERING NATIONAL INSTITUTE OF TECHNOLOGY ROURKELA MAY 2015
Transcript of PHOTOCATALYTIC DEGRADATION OF …ethesis.nitrkl.ac.in/6840/1/PHOTOCATALYTIC_Bagwan_2015.pdfA THESIS...

A
THESIS
ON
PHOTOCATALYTIC DEGRADATION OF HAZARDOUS
SAFRANIN (O) DYE BY USING SELF SYNTHESIZED TiO2
NANOPARTICLES
Submitted by
Mr. SOYAB SALIM BAGWAN
Roll No. 213CH1114
In partial fulfilment for the award of the degree of
MASTER OF TECHNOLOGY
in
CHEMICAL ENGINEERING
Under the Supervision of
Dr. ARVIND KUMAR
DEPARTMENT OF CHEMICAL ENGINEERING
NATIONAL INSTITUTE OF TECHNOLOGY ROURKELA
MAY 2015

NATIONAL INSTITUTE OF TECHNOLOGY ROURKELA
CERTIFICATE
This is to certify that Mr. Soyab Salim Bagwan has carried out a project work on
“Photocatalytic Degradation of Hazardous Safranin (O) Dye by Using Self Synthesized
TiO2 Nanoparticles” in partial fulfilment of the requirements for the award of Master of
Technology degree in Chemical engineering, Department of Chemical Engineering at
National Institute of Technology, Rourkela is an authentic work carried out by him under my
supervision and guidance.
Date: Dr. Arvind Kumar
(Supervisor)

i
ACKNOWLEDGEMENT
In pursuit of this academic endeavour, I feel that I have been singularly fortunate;
inspiration, guidance, direction, co-operation, love and care all came in my way in abundance
and it seems almost an impossible task to acknowledge the same in adequate terms. My
guide, Dr. Arvind Kumar has been an absolute fount of knowledge during the last couple of
months and his patience and inherent kindness have helped me acclimatize, especially in the
beginning, to a culture that was not similar to that of mine. I have always enjoyed my
conversations with him and will carry on with me several valuable lessons that I have
learned. The open-mindedness and freedom of thought encouraged by him was critical as I
learned a lot from this atmosphere while his cheerfulness and his encouragement have
bolstered me numerous times.
I would like to thank the entire faculty of chemical engineering department as whatever
knowledge I earned from them was very useful in this work. I also want to acknowledge all
my friends and seniors (Ph.D. scholars) in Chemical Engineering Department as they helped
me a lot during the work.
Date: Mr. Soyab Bagwan
Roll No. 213CH1114

ii
ABSTRACT
The textile industries generates extremely high amount of colour waste water, which are
mainly poisons. A traditional biological treatment process is not helpful in treating the dye
effluent because of low biodegradability of dyes. The presence of safranin (O) dye causes
distinct acute impact on health therefore the removal of this dye from aqueous solution is
highly desirable. The aim of this study was to assess the efficiency of photo-degradation of
safanin (O) dye with application of nanoparticles of TiO2 as a photocatalyst. For this purpose
nanoparticles of TiO2 were synthesized by a very simple sol-gel method with absence of
additives and hydrolysing agents. The synthesized nanoparticles of TiO2 were characterized
by FTIR, XRD, SEM, BET and UV-vis spectroscopy. It was found that change in
polymorphic phase occurs as temperature changes from 600 to 800 0C and also the
crystallinity of TiO2 increases with annealing temperature. The application of prepared TiO2
nanoparticles for photocatalytic degradation of safranin (O) dye from aqueous solution was
explored. It was determined that anatase phase TiO2 shown highest photo-degradability of
safranin (O) dye. The blank tests investigated for light irradiated to safranin (O) dye solution
without TiO2 catalyst and for the suspension carrying TiO2 and safranin (O) dye in the dark
that revealed both the photocatalyst and light energy were required for the photo-degradation
of safranin (O) dye. The effect of several factors such as catalyst dose, initial concentration,
pH of solution and temperature, was studied on the photocatalytic degradation of safranin (O)
dye and optimized it. Results indicated that photo-degradation of safranin (O) dye increases
at higher alkaline pH. The photo-degradation rate was strongly influenced by activation of
TiO2 photocatalyst with photon and production of hydroxyl radicals’ hence suggested
optimum catalyst dose and initial concentration of dye for photo-degradation process.
KEYWORDS: TiO2 nanoparticles, Sol-gel synthesis, Safranin (O) dye, Photocatalysis.

iii
CONTENTS 1. INTRODUCTION ................................................................................................................................ 2
1.1. OBJECTIVE OF WORK .............................................................................................................. 5
2. LITERATURE REVIEW ..................................................................................................................... 7
2.1. PROPERTIES OF TITANIUM DIOXIDE ................................................................................... 7
2.2. CRYSTAL STRUCTURE OF TiO2 ............................................................................................. 7
2.3. SYNTHESIS PROCEDURE OF TiO2........................................................................................ 10
2.3.1. SOLUTION ROUTE SYNTHESIS .................................................................................... 10
2.3.2. GAS PHASE SYNTHESIS ................................................................................................ 10
2.4. SOL-GEL SYNTHESIS ............................................................................................................. 11
2.4.1. REACTION MECHANISM ............................................................................................... 13
2.5. HETROGENOUS PHOTOCATALYSIS ................................................................................... 15
2.6. TITANIUM DIOXIDE AS A PHOTOCATALYST .................................................................. 16
2.7. SAFRANIN (O) DYE ................................................................................................................. 17
3. EXPERIMENTAL STUDY ................................................................................................................ 20
3.1. CHEMICALS ............................................................................................................................. 20
3.2. INSTRUMENTS USED ............................................................................................................. 20
3.2.1. X-RAY DIFFRACTION SYSTEM .................................................................................... 20
3.2.2. FOURIER TRANSFORM INFRARED (FTIR) SPECTROSCOPY .................................. 21
3.2.3. SECONADARY ELECTRON MICROSCOPE (SEM) ..................................................... 21
3.2.4. UV-VISIBLE SPECTROSCOPY ....................................................................................... 22
3.2.5. BRUNAUER-EMMETT-TELLER (BET) ......................................................................... 22
3.3. EXPERIMENTAL SETUP ......................................................................................................... 23
3.4. EXPERIMENTAL PROCEDURE FOR TiO2 SYNTHESIS ..................................................... 24
3.5. PREPARTION OF STANDARD STOCK SOLUTION ............................................................ 25
4. RESULTS AND DISCUSSION ......................................................................................................... 27
4.1. CHARACTERIZATION OF TiO2 NANOPARTICLES ............................................................ 27
4.1.1. X-RAY DIFFRACTION (XRD) ANALYSIS .................................................................... 27

iv
4.1.2. FOURIER TRANSFORM INFRARED SPECTROSCOPY (FTIR) ANALYSIS ............. 28
4.1.3. SCANNING ELECTRON MICROSCOPE (SEM) ANALYSIS ....................................... 28
4.1.4. ULTRAVIOLET-VISIBLE SPECTROSCOPY ANALYSIS ............................................ 30
4.1.5. BRUNAUER-EMMETT-TELLER (BET) ANALYSIS .................................................... 31
4.2. STUDY OF PHOTOCATALYTIC DEGRADATION .............................................................. 32
4.2.1. CALIBRATION CURVE ................................................................................................... 33
4.2.2. OPTIMIZATION OF VARIABLES IN PHOTODEGRADATION .................................. 34
4.2.3. KINETICS OF PHOTOCATALITIC DEGRADATION ................................................... 38
CONCLUSIONS......................................................................................................................................... 41
FUTURE SCOPE........................................................................................................................................ 41
REFERENCES ........................................................................................................................................... 43

v
LIST OF FIGURES
Figure 1: Crystal structure of the four common TiO2 phases. ................................................................ 8
Figure 2 Sol-gel process. ....................................................................................................................... 12
Figure 3 Sol-gel routes to obtain monoliths adapted from. ................................................................... 12
Figure 4 Scheme of preparation of nanoparticles sol-gel method. ........................................................ 14
Figure 5 Setup for TiO2 synthesis ......................................................................................................... 23
Figure 6 Setup for photocatalysis.......................................................................................................... 24
Figure 7 XRD analysis of TiO2 nano particles calcinated at different temperature .............................. 27
Figure 8 FT-IR spectra of Titanium Oxide samples TiO2-110, TiO2-400, TiO2-600 and TiO2-800 ..... 29
Figure 9 SEM images of (a) TiO2-110 (b) TiO2-400 (c) TiO2-600 (d) TiO2-800 ................................. 30
Figure 10 UV-Visible spectra of (a) TiO2-110, (b) TiO2-400, (c) TiO2-600 and (d) TiO2-800 ............ 31
Figure 11 Photo-degradation of safranin (O) dye on the prepared TiO2 samples ................................. 32
Figure 12 Calibration curve of Safranin (O) dye, λmax=520 nm. ........................................................... 33
Figure 13 Graphical representation of effect of catalyst dose ............................................................... 34
Figure 14 Graphical representation of effect of initial concentration ................................................... 35
Figure 15 Graphical representation of effect of pH .............................................................................. 36
Figure 16 Graphical representation of effect of temperature ................................................................ 37
Figure 17 Kinetics of Photocatalytic degradation by varying initial concentration .............................. 38

vi
LIST OF TABLES
Table 2- Properties of Titanium dioxide (TiO2) [22] .............................................................................. 7
Table 3 Molecular Properties of Safanin (O) dye ................................................................................. 18
Table 4 List of instruments used for synthesis and analysis ................................................................. 20
Table 5 Specific surface area of TiO2 samples by BET theory ............................................................. 31
Table 6 Rate constants of photo-degradation process with different initial concentration ................... 39

vii
NOMENCLATURE
BET = Brunauer-Emmett-Teller
CB = Conduction band
Cs = concentration of safranin (O) dye (in ppm) after a time t in (mins),
Cs0 = concentration of safranin (O) dye (in ppm) at time t=0 min,
CVD = Chemical vapour deposition
D = Average crystallite size in 0A
FTIR = Fourier transform infrared
FWHM = Full width half maximal
GaAs = Gallium arsenide
hυ = Photon energy
k = the pseudo fiest order rate constant of photo-degradation process,
M = metal
PVD = Physical vapour deposition
R = Alkyl group
r = Water to alkoxide ratio
SEM = secondary electron microscope
SPD = spray pyrolysis deposition
t = time in mins.
TiO2-110 = TiO2 dried at 110 0C
TiO2-400 = TiO2 calcinated at 400 0C
TiO2-600 = TiO2 calcinated at 600 0C
TiO2-800 = TiO2 calcinated at 800 0C
TTIP = Tittanium tetra isopropoxide
UV = Ultra violet
VB = Valance band
XRD = X ray diffraction
β = Line width at half maximum intensity
ε = Dielectric constant
θ = Braggs angle
λ = Wavelength of
К = Shape f.actore (0.9 is used)

Page | 1
Chapter 1
INTRODUCTION

Page | 2
1. INTRODUCTION
ABSTRACT: This section includes basic understanding of dyes, safranin (O) dye and TiO2
nanoparticles as well as the impact of dyes especially safranin (O) dye on the environment
and aquatic life has discussed. Various treatments to remove the dye from waste stream were
discussed. Also properties that existed in TiO2 nanoparticles and its applications were
explained. Process of photocatalysis using TiO2 as a photocatalyst was summarized.
BACKGROUND STUDY: There is emerging public concern over the contamination of
wastewater by dyes. Therefore, a major focus of research has been on the removal of dyes
and pigments from wastewater. This is because of the fact that existence of dyes and
pigments in water is highly unwanted, even at very low concentrations, [1]. Total annual
manufacturing of dyes in the world is more than 7×10⁵ tons and about 2% of dyes produced
annually are released in effluent from manufacturing operations [2]. India has become a
notable manufacturer of dyes and pigments during the past 35 years, to satisfy the
requirement of not only the textile industries but also of other industries such as printing inks,
plastics, rubber, paints, paper, art and craft, cosmetics, leather, food and drug [3]. Release of
dye effluents into the environment is presently one of the world’s crucial environmental
problems for both esthetic reasons and toxicological.
Safranin (O) is one of the most frequently used azine dye, which is among the oldest well
known synthetic dyes. Safranin (O) is a water-soluble reddish brown powder, which is
mainly used to dye silk, wool, tannin, cotton, bast fibers, silk, leather and paper. Also it has
wide application in textile, trace, biological laboratory purpose [4]. The presence of safranin
(O) causes distinct acute impact on health like irritation to mouth, tongue, throat, lips and
pain in stomach which may lead to vomiting, nausea and diarrhea [5]. Thus, the `withdrawal
of safranin (O) dye from the aqueous solution is highly desirable. Dye containing effluents
are commonly processed by physical or chemical processes. The conventional methods for
treatment of dye containing wastewater are oxidation, degradation of biological compound,
flocculation, coagulation and physical separation have been extensively explored to remove
various dyes from wastewaters [6–8].
The textile industries generates extremely high amount of color wastewater, which are
mainly poisonous. A mandatory criterion for these dyes in their application is that they
should be exceptionally stable in sun light and during washing. Also they should oppose the

Page | 3
effect of microbial attack. So that, they aren’t easily degrade and by commonly used chemical
effluent treatment systems they are not readily removed from wastewater [9]. A traditional
biological treatment process is not helpful in treating the dye effluent because of low
biodegradability of dyes [10]. A broad range of traditional physical and chemical processes
like oxidation, irradiation, electro-flotation, flocculation, precipitation, membrane filtration,
ion exchange and electro-kinetic coagulation have been examined immensely for
withdrawing dyes from aquatic bodies [11, 12]. However, a broad range of wastewater
containing dyes cannot be effectively treated by these processes and also they are costly [13].
Two convenient technologies for removal of dye are adsorption and oxidation. Out of these
two, the possibly best technology to totally eliminate organic carbons is oxidation methods
The supremacy of photo-degradation process by semiconductors in dye effluent treatment
is because of its advantages over the conventional methods, such as quick oxidation,
oxidation of pollutants and no formation of polycyclic products. It is a powerful and quick
method for the withdrawal of pollutants from effluent [14, 15].
Titanium dioxide (TiO2) is a widely used multifunctional material due to its physical &
chemical properties, excellent stability as well as its non-toxicity, great accessibility and
moderate cost. Commercially they can be found in coatings, paints, pigments and sunscreens
[16, 17]. TiO2 quickly attracted numerous research interests because of its highly active
photocatalytic activity, like its ability to degrade chemical compounds as well as
superhydrophilic, antibacterial properties, and energy-related applications. The UV photon is
capable to excite (activate) the photocatalyst, which results in the excitation of an electron
from the valence band (VB) to the conduction band (CB). Although, one of the major
problem which decrease the effectiveness of photocatalysis process is recombination of
photo-generated electrons and hole pairs. The excellent surface activity and appropriate
electronic band structure favors TiO2 with very promising potentials in hydrogen production,
photovoltaic, photocatalyst, lithium-ion batteries and fuel cells [18]. Fujishima and Honda in
1972, found the phenomenon of splitting of water on a TiO2 photocatalyst under UV light.
After this, a plenty of efforts have been committed to the study of TiO2 material, which has
developed large number of positive applications in various areas from photovoltaic and
photocatalysis to various sensors. These applications can approximately categorized into two
categories, ‘environmental’ and ‘energy’, most of them depend on the properties of the TiO2
material, modifications of the TiO2 material host (e.g., with organic dyes and inorganic dyes)
and also on the interactions of TiO2 materials with the environment [19]. In the past decades,

Page | 4
an enormous development in research activities has been seen in nanotechnology and
nanoscience. A new physical and chemical property emerges when the size of the material
reduced smaller and smaller. TiO2 bears huge faith in helping ease the energy crisis through
efficiently utilization of solar energy based on water-splitting devices and photovoltaic. In
recent years, as continue research work have been made in the preparation, modification, and
applications of TiO2 nanoparticles. TiO2-based nanoparticles recently showed the highest
effectiveness in photocatalytic water splitting by narrowing bandgap energy, to permit visible
light photo activities. Nevertheless, although TiO2 hold such potentials, its relatively
unsatisfactory wide bandgap (∼3.2 eV) and charge transport property are two important
limitations for its present-day utilization in energy harvesting (or storage) and catalysis [20].
In fact, on nanoscale morphologies of TiO2 most of its applications were based, especially
the nanoparticles form. In the nanoscale, Because of the emergence of the quantum
confinement effects, the transport behaviours of electron and hole could be varied, and the
electronic band structure could be shifted. The huge surface-to-volume ratio of nanomaterial
can remarkably increases the reaction sites at surface and can even adjust the surface atoms
catalytic activity. In the nanoscale structures particular high energy surfaces should also
become stable and enhance their catalytic properties. Therefore, on the establishment of
appropriate nano-size structures with well arranged composition, geometry, integration, and
crystallography can further enhanced the performance of TiO2 semiconductor based systems
and devices[21].
In obtaining the final TiO2 material properties, controlling the shape, structure and size of
the colloidal precursor are very important factors. TiO2 powders have been acquired either by
precipitation from solutions of titanium salts or alkoxides or directly from titanium-bearing
minerals. The most ordinary methodologies were relied on the hydrolysis of acidic solutions
of Ti (1V) salts [6]. To prepare finely divided titania powders with high purity, hydrolysis
reactions of titanium alkoxides and the gas-phase oxidation reactions of TiCl4 were used.
However, these titania powders have usually lacked in the properties like constant (uniform)
shape and size, also unagglomerated state required for quantitative studies of colloidal
phenomena [22]. Recently, through controlled nucleation and growth processes in dilute Ti
(IV) solutions, lots of methodologies were published for preparing titania nanoparticles.
Some of them are the sol-gel method and hydrothermal method, which are having advantage
of low reaction temperature. It has been revealed that the initial nanostructure of titanium
dioxide precursors sinthesized by hydrolyzing titanium alkoxide, strongly affects the

Page | 5
characteristics of the final powder and crystallization behaviour [23]. In this report, we have
tried to prepare anatase and rutile TiO2 by relatively simple sol-gel method and an attempt is
made to look at the degradation of the safranin (O) dye in aqueous solution in presence of UV
light by using synthesized TiO2 nanoparticles.
1.1. OBJECTIVE OF WORK
The specific objective of these studies to do investigation for photocatalytic degradation
of basic dye safranin (O) from wastewater using nanoscale self prepared TiO2 Photocatalyst.
Preparation of nanoparticles of TiO2 by sol-gel method from TTIP as Ti source
and isopropyl alcohol as solvent.
Synthesis of TiO2 nanoparticles without using any additives and hydrolysing
agent.
Characterization of prepared TiO2 nanoparticles to determining various properties,
by using XRD, FTIR, UV-vis spectroscopy and SEM etc.
Investigate the potential of synthesized TiO2 nanoparticles as a photocatalyst
under UV radiation for oxidation of safranin (O) dye in aqueous solution.
Study of different operational parameters such as catalyst loading, initial dye
concentration, pH and temperature on the rate of photo-degradation of the safranin
(O) dye.
Study the kinetics of the photo-degradation of safranin (O) dye in presence TiO2
photocatalyst and UV radiation.

Page | 6
Chapter 2
LITERATURE
REVIEW

Page | 7
2. LITERATURE REVIEW
ABSTRACT: Various literatures have been studied on TiO2 nanoparticles and represented
here in this section. The brief discussion on various crystal structures, synthesis procedure
and reaction mechanism of TiO2 nanoparticles were also given. This content contains the
details of photocatalysis process and factors affecting photocatalysis such as catalyst dosage,
pollutant concentration, pH, temperature etc.
2.1. PROPERTIES OF TITANIUM DIOXIDE
Table 1- Properties of Titanium dioxide (TiO2) [22]
Properties of Titanium dioxide (TiO2)
Molecular Formula TiO2
Molecular Weight 79.866 g/mol
Density 4.24 g/cm3 (Rutile)
3.77 g/cm3 (Anatase)
Melting Point 1844 °C
Boiling point 2973 °C
Refractive index (nD) 2.489 (Anatase)
2.584 (Brookite)
2.608 (Rutile)
Appearance White solid
Solubility Insoluble in water
Odour Odourless
2.2. CRYSTAL STRUCTURE OF TiO2
Banfield J. F. et.al., (1992), [23] studied the various crystal structure of TiO2. TiO2
normally exhibits four various types of polymorphic phases, which are anatase, rutile,
TiO2(B), and brookite. Also there are several metastable polymorphic phases, such as TiO2
(H) (hollandite), TiO2 II (columbite), TiO2 III (baddeleyite) and TiO2(R) (ramsdellite) have
been synthesized synthetically. Various polymorphic phases have different types of
properties and therefore needs different types of conditions to obtain desired polymorphic
phases and provide different type of performance.

Page | 8
Figure 1: Crystal structure of the four common TiO2 phases. [23]

Page | 9
Generally, anatase, brookite, and TiO2 (B) are metastable phases, while rutile is the most
stable phase and these anatase, brookite, and TiO2 (B) phases can transform into rutile phase
under high temperature. This phase stability relationship also exists in TiO2 nanomaterial
formations. A polymorphic phase which is commonly obtained in nanomaterials is anatase
phase. Anatase phase always found in low-temperature vapor deposition or solution-based
systems. Annealing or high temperature deposition would generally yield rutile phase
nanostructures of TiO2. TiO2 (B) and Brookite polymorphic phases are typically obtained
from solution-based growth systems and also less common in nature. Using particular types
of precursors and under restrict conditions these other types of metastable phases can be
synthesized. Thus we will not consider these metastable phases in this project because they
rarely obtained as a stable phase in nanomaterial. Figure 1 shows the schematic structure of
crystal of four different TiO2 phases by using the fundamental building block as Ti−O
octahedrons.
These four anatase, rutile, brookite, and TiO2 (B) polymorphic phases have different
nanostructures which always exhibit different growth behaviors and preferred morphologies
as well as shows different symmetry. Rutile phase TiO2 material shows a tetragonal structure
with (Figure 1 [A]). The thermodynamically equilibrium morphology of rutile phase TiO2 is a
trunked octahedron due to its two surface families {011} and {100} have the lowest energy.
Rutile phase is one that mostly observed morphology from synthetic TiO2 powders. The
anatase phase also shows tetragonal crystal structure but has a significantly longer c-axis
compared to the a-axis; Figure 1 [B]). Anatase phase TiO2 shows trunked octahedron
morphology in its nanostructures same as the rutile phase with same lowest energy
surfaces.Brookite shows orthorhombic crystal structure and has a large unit cell consisting of
8 TiO2 groups (Figure 1 [C]). This large unit cell also present in TiO2 (B) with comparatively
more open crystal structure than other polymorphic phases (Figure 1 [D]). TiO2 (B) is
monoclinic having a particularly long a-axis (1.216 nm). Whereas, both brookite and TiO2(B)
phases are less regularly obtained in synthetic TiO2 nanostructures.
Gong X. Q. et al., (2006), [24] concluded that the first step toward reasonable
experimental design for preparing TiO2 nanoparticles with well specified dimension, shape,
crystallinity and phase, which is the primary importance for accomplishing desired
functionality and performance is understanding the crystal structure.

Page | 10
2.3. SYNTHESIS PROCEDURE OF TiO2
The TiO2 can be prepared in the form of different powder, thin films, and crystals forms
by two well defined routes, namely by O. Carp et al., (2004), [25],
1. Solution route synthesis
2. Gas phase synthesis
2.3.1. SOLUTION ROUTE SYNTHESIS
This route is usually used to synthesize thin films of TiO2 because of it is convenient and
easy. Also it gives a control over homogeneity and stoichiometry, the synthesis of composite
materials as well as formation of complex shapes. The demerits of this route lie in its high
cost, large processing time as well as presence of impurities, such as carbon.
Some commonly used solution route synthesis methods are given below,
1. Sol-gel methods
2. Sol-Method
3. Hydrothermal methods
4. Solvothermal methods
5. Precipitation methods
2.3.2. GAS PHASE SYNTHESIS
The specialty of this route is forming coatings to alter different properties, such as the
electrical, thermal, mechanical, optical, wear resistance and corrosion resistance properties of
various substrates. They can be also be used to synthesize composite materials by the process
of infiltration. The commonly used gas phase methods are,
1. Chemical vapour deposition (CVD)
2. Physical vapour deposition (PVD)
3. Spray pyrolysis deposition (SPD)

Page | 11
2.4. SOL-GEL SYNTHESIS
Larry L. H. et al., (1990), [26] concluded that out of these mentioned methods, sol–gel
method is one of the most widely used for synthesizing TiO2 nanaoparticles, due to various
advantages, such as high homogeneity of particles, low processing temperature, synthesis
conditions, stability and versatility of processing. In this sol-gel method, we have to mix to
different solutions and these two solutions are generally called as precursor and hydrolysis
solution. In sol-gel method hydrolysis solution is added dropwise to the precursor solution at
room temperature under vigorous stirring to control the hydrolysis rate and therefore the
particle size of TiO2. It is commonly proclaimed that the most delightful characteristic of sol–
gel processing is the possibility of customizing unique materials, mainly by polymerization of
a metalorganic compounds to obtain a polymeric gel. An important thing is that, designing
the proper monomer that will polymerize to obtain M-O-M structures (where M is the metal
and O is the oxygen atom). Metal alkoxides, M(OR)n, (where M is the metal and R is an
alkyl radical), fulfil these needs. Most reports on sol–gel method for preparation of TiO2
nanoparticles involved titanium alkoxide (titanium isopropoxide [TTIP], titanium butoxide,
titanium ethylhexoxide and tetra-n-butyl titanate) as Ti source material. Few researchers used
TiCl4 as the Ti precursor solution.
Brinker C. J. et al., (1999), [27] was focused the attention on one of the most commonly
used precursors, metal alkoxides, that have an organic ligands attached to a metal or
metalloid atom. Their popularity arises out of their high reactivity with water. The term
ceramic is an 'umbrella' that covers all materials that are metal oxides, nitrides or carbides,
both non-crystalline and crystalline. A sol can be defined as a colloidal suspension of solid
particles (1-1000nm) in a liquid, and that is dominated by short range forces such as Van der
Waals forces and surface charges. While, A gel incorporates two phases having colloidal
dimensions; a continuous liquid phase enclosed by a continuous solid skeleton. A gel is
grown from, either, mechanical mixing of discrete colloidal particles at a pH that prevents
precipitation, or, from an interconnected 3-D network formed during the hydrolysis and poly-
condensation of the precursor.
Jagdale T. C. et al., (2008), [28] described the several routes that can be followed to
obtain sol-gel monoliths are represented in Figure 2. The resultant product obtained when a
gel is dried under ambient conditions by evaporation is called a xerogel. The volumes of
these xerogels are usually 5 to 10 times less than the volume of original gel. However, when
the gel is dried in an autoclave, the resultant product is known as an aerogel.

Page | 12
An aerogel has almost the same volume as the volume of original gel, due to the lack of
capillary pressure while drying.
Figure 2 Sol-gel process [29].
Figure 3 Sol-gel routes to obtain monoliths adapted from [28].

Page | 13
As shown in Figure 3, the structure of the gel based on the gelation route. For gels formed
by the hydrolysis and condensation route, the structure depends heavily on the kinetics of
these reactions. The processes that succeed ageing, drying, stabilization, and densification
steps rely on the gel structure.
2.4.1. REACTION MECHANISM
Lee J. H. et al., (2005), [29] shown the sol-gel method is depends on inorganic
polymerization reactions. This involves various steps such as hydrolysis, poly-condensation,
drying of material and then thermal decomposition (calcination). In the first step, hydrolysis
of the precursors of the metal or non-metal alkoxides carried out with either water or
alcohols.
Ti(OR)4 + 4H2O Ti(OH)4 + 4ROH (hydrolysis)
Where R = alkyl group
Zhang H. et al., (2002), [30] and Oskam G. et al., (2003), [31] explained in addition to
water and alcohol, also a base or an acid helps in the hydrolysis of the precursor solution.
Generally this process begins and continues with the hydrolysis step of titanium (IV)
alkoxide by an acid-catalyzed hydrolysis and followed by condensation. The generation and
growth of Ti-O-Ti chains is recommended with low water content, low rates of hydrolysis
and an excess amount of titanium alkoxide solution in the reaction media. However, close
packing of three dimensional polymeric skeletons are obtained by the establishment of Ti-O-
Ti chains. The generation of titanium hydroxide (Ti-(OH)4) is recommended by high rates of
hydrolysis for a medium amount of water.
Behnajady et al., (2011), [32] represented the presence of a large amount of Ti-OH and
insufficient establishment of three-dimensional polymeric skeletons lead to loosely packed
first-order particles. In the existence of a large excess of water, the polymeric Ti-O-Ti chains
are developed. And via a three-dimensionally developed gel skeleton a closely packed first
order particles are yielded.
Ti(OH)4 TiO2 + 2H2O (condensation)
Calcinations at higher temperature are required to decomposition of the organic precursor.
The flow chart of sol-gel method for the preparation of TiO2 nanoparticles has been shown in
Fig. 5.

Page | 14
Figure 4 Scheme of preparation of nanoparticles sol-gel method. [32]
Burda C. et al., (2005), [33] concluded the size of sol particles depends on the pollution
composition, pH and temperature. By controlling these factors, one can tune the size of the
particles.
Tumma H. et al., (2009), [34] shown that from titanium tetra isopropoxide (TTIP),
triethanolamine, and mild acids like acetic acid are used generally to prepare phase pure
anatase nanoparticles. A fraction of the product normally comprises the brookite phase
nanoparticles, when stronger acids are used. The preparation of brookite phase nanoparticles
has been given by thermolysis of TiCl4 in aqueous solution of HCl. The reaction product
composition was obtained to be strongly dependent on the concentration ratio of Ti:Cl
(approx near about 17–35). Phase pure rutile phase TiO2 nanoparticles have been synthesized
from titanium tetra isopropoxide (TTIP) in nitric acid at pH = 0.5, or from TiCl4 or TiCl3 in
HCl solution.
Loryuenyong V. et al., (2011), [35] studied that the preparation of nanoparticles TiO2 by
a sol-gel method, by using titanium tetra isopropoxide as a precursor and ethanol or 2-
propanol (isopropyl alcohol) as an alcoholic solvent. The prepard mesoporous TiO2 was
annealed at about 300–800°C. It was explained that the anatase to rutile phase transformation,
crystallite growth, and pore collapsing occurred with an increase in calcinations temperature.
To inhibit the anatase to rutile transformation a solvent isopropyl alcohol was used, and this
transformation inhibited by the controlling the rate of hydrolysis. An improvement in the
dropwise
Titanium Precursor
Titanium solution Deionized water
Resultant sol
Ultrasonic
Drying Calcination TiO2 nanoparticles
Solvent

Page | 15
degradation of methylene blue under UV light was observed by the TiO2 photocatalyst
containing predominantly of anatase crystallites. Also an improved photocatalytic activity
was obtained with 2-propanol solvent through the thermal stability of anatase phase as
compared to ethanol.
2.5. HETROGENOUS PHOTOCATALYSIS
The late twentieth century saw the arising of a novel advanced oxidation process (AOP)
called heterogeneous photocatalysis, now holding over a thousand research articles published
annually. This process has since been utilized in a large variety of reactions, specially,
dehydrogenation, water purification treatment and hydrogen transfer. An apt definition of a
photocatalyst is quoted here, from an article by Jean-Marie Herrmann [36], \Photocatalysis
is based on the double aptitude of the photocatalyst (essentially titania) to simultaneously
adsorb both reactants and to absorb efficient photons (h ≥ Eg)".
As reported by Herrmann et al., (2010), [36] the phenomenon may be divided into 5
steps that take place sequentially:
1. Transfer of the reactants from the fluid phase to the surface,
2. Adsorption of the reactants on the surface,
3. At this point, activation of the reaction in the adsorbed phase by the photons (UV or
visible irradiation)on the surface,
4. Desorption of the products,
5. Removal of the products from the interface region.
To enhancing the external quantum efficiency of steady state photocatalytic processes,
which is the percentage of the photons generating an electron-hole pair, it is most important
to focus on increasing either the lifetime of charge-carrier or the interfacial electron transfer.
There is some dispute in the scientific community, over the role of VB holes; some
suggest that they are directly responsible (before trapping) for the degradation of organic
compounds, while others propose that degradation occurs indirectly by trapped holes at the
surface (surface bound hydroxyl ion). It is hard to differentiate between the two mechanisms
as both of them in oxygenated aqueous solutions produces similar products.

Page | 16
It is reported by S. Parra et al., (2002), [37] that for the photo degradation process to
occur, the target molecule (usually pollutant) has to be adsorbed on the surface of
semiconductor. On the other hand, there are some investigations that report that while
adsorption of the target molecule will enhance the rate of the degradation process, it is not a
prerequisite. This is because of the OH radicals can diffuse into the fluid phase and can react
with the target molecule. In conclusion, while there appears to be some contradiction in the
studies obtained regarding the requirement of adsorption of the target molecule, it does seem
to be clear that the degradation rate increases when there is adsorption, and therefore is a vital
factor in the photocatalytic process.
2.6. TITANIUM DIOXIDE AS A PHOTOCATALYST
For an ideal photocatalyst, O. Carp et al. [25] state the following characteristics:
1. Biologically and chemically inert,
2. Photocatalytically stable,
3. Easy to prepare and to use,
4. Effectively activated by sunlight,
5. Able to effectively catalyze reactions,
6. Cheap
7. Non-toxic to the environment and humans.
The semiconductor that comes closest that having the above mentioned criteria is TiO2.
The main disadvantage in using TiO2 is its lack of absorption in the visible region of the
electromagnetic spectrum.
Y. Kubota et al., (2001), [38] the indiscriminate, high-potential (2.80V) oxidizing agents
(holes and OH radicals) generated when TiO2 is exposed to the light are widely used to
degrade environmental pollutants likewise organics, fungi, viruses and bacteria into harmless
products such as H2O, CO2 and into other inorganic harmless molecules. This indiscriminate
response of the TiO2 catalyst has to be controlled in certain applications to prevent severe
damage in these types of cases, as in paints to prevent chalking due to loss of pigments.

Page | 17
Shan Cong et al., (2011), [39] studied that from a point of view of thermodynamics,
anatase phases and rutile phase are both capable of initializing photocatalytic oxidation
because of the similarity in their valence band. But despite this, studies show that the anatase
form has been identified as the more efficient photocatalyst out of these two forms of crystal.
A possible explanation could be due to the lifetime of the charge carriers which has been
shown to be longer for anatase when compared to that of rutile. Other studies show that a
mixture of anatase and rutile phases to be a better photocatalyst than lone anatase phase. This
has been described by the result of a possible synergetic effect due to the combination of the
two phases. In a study by Kurkin et al., (1990), [40] the photocatalytic degradation of
acetone in the gaseous phase increased with the increase in calcination temperature attaining
a maximum photocatalytic activity at 450 0C calcinations temperature. This could be due to
the increase in the number of charge carriers at the crystallite surface as a result of improved
crystallinity. However, after 450 0C calcination temperature, there was a decrease in activity
which is possibly due to the growth in crystallite size leading to a loss in specific surface
area. The difference in efficiency between the two phases may be attributed to several
parameters, such as the charge carrier mobility in the matrix of the material, crystallite,
specific surface area size and absorption of the photons which is affected by crystallite size
and material texture.
Besides its photocatalysis importance, TiO2 is used in several other applications, such as
gas sensors (electrical conductivity varies with the ambient gas composition), biomaterials
(haemocompatible with the human body). Due to high dielectric constant (ε > 100) of rutile
phase, it is used as a dielectric material. The anatase phase is reported to be preferred over the
rutile phase in solar cells, as it is lower temperature phase, has lower density, low dielectric
constant and higher electron mobility.
2.7. SAFRANIN (O) DYE
It is widely used in textile industries and for biological purpose. It is generally used to dye
wool, tannin mordant cotton and silk. Out of the different dyes presently available, basic dyes
are among the brightest class of soluble dyes used by textile industries. Basic dyes are also
known as cationic dyes. It is stain which is positively charged (cationic) which can react with
material which is negatively charged (anionic). The IUPAC name of Safranin (O) dye is 3,7-
Diamino-2,8-dimethyl-5-phenylphenazin-5-lum chloride.

Page | 18
Safranin (O) (known as Basic Red 2) is a typical example of an organic dye that belongs
to Quinone-Imine class.The chemical structure of dye shown below,
N+
N CH3
NH2
H3C
H2N
Cl-
Safranin (Basic Red 2)
In addition to its vast application in dye industries, Safranin is also used as a
biological staining in number of biomedical research laboratories and these biological stains
are well known to be toxic to human and animals.
Table 2 Molecular Properties of Safanin (O) dye
Properties Safranin (O)
C.I. 50,240
Common Name Basic Red 2
Molecular Formula C20H19N4Cl
Molecular weight 350.85 g/mol
Nature Powder
Color Redish
Valance +1
λmax 520 nm

Page | 19
Chapter 3
EXPERIMENTAL
STUDY

Page | 20
3. EXPERIMENTAL STUDY
ABSTRACT: In this section we discussed various chemical used to prepare TiO2
nanoparticles as well as instrument used for experiment and analysis. Also we explained the
experimental setup especially prepared to carry out the experiments and synthesis procedure
for synthesis of TiO2 nanoparticles.
3.1. CHEMICALS
Titanium (IV) isopropoxide (AcrosOrganics, purity98+%) and Isopropyl alcohol (Merck,
99.5%) used were laboratory-grade chemicals; water from a MilliQ system was used.
3.2. INSTRUMENTS USED
A number of instruments were used throughout the project work to make easy and rapid
analysis.
Table 3 List of instruments used for synthesis and analysis
Name of Instrument Company Name and Model Name
XRD Ultima IV Multipurpose XRD system
FTIR Thermofisher, Nicolet is10
SEM Jeol, JSM-6480LV
UV- Visible Spectrophotometer Shimadzu,
UVSPECTROPHOTOMETER
BET Quantachrome Instruments
Magnetic Stirrer Remi Elektronik Ltd., REMI 2MLH
pH Meter Systronics, µpH system 360
Weight Balance Denvar Instrument, SI-234
Mercury Lamp Bajaj, 125W HPMV (220-250 V)
3.2.1. X-RAY DIFFRACTION SYSTEM
X-Ray Diffraction analysis instrument is very important and useful machine to
characterize various materials, to get the information of determination of lattice parameter
and strain as well as for analysis of phase (such as crystalline phase, non-crystalline phase,
elemental phase, inter-mettalic phase) and orientation.

Page | 21
The XRD instrument having model name Ultima IV Multipurpose XRD system was used
to characterize the TiO2 samples synthesized by sol-gel method and calcinated at different
temperatures. The scanning range of 10-800 with scanning speed of 5
0/min and voltage of
acceleration was 30 KV. The X-pert high score software was used, to analyze the peaks and
to identify the various types of phases.
3.2.2. FOURIER TRANSFORM INFRARED (FTIR) SPECTROSCOPY
Fourier Transform Infrared (known as FTIR) spectroscopy used to identification of
polymeric, organic and inorganic (in some cases) materials. It uses the infrared radiation to
scan the sample and to observe the properties (chemical). These infrared (IR) radiations are
allowed to pass through a testing sample. The sample absorbed some amount of IR radiation
and some IR radiation transmitted through the sample. In FTIR spectroscopy system, this
absorption or transmission (IR radiation) phenomena used to create the absorbance spectra
which shows the unique (like fingerprint) chemical bond as well as molecular structure of the
sample. The absorbance spectrum shows the various absorbance peaks and these peaks on the
spectrum represent functional groups (e.g. alkanes, alkyl, alcohol, keton etc). The absorption
of IR radiation at different wavelength indicates different types of bonds and therefore
different functional groups. The analytical spectrum of unknown sample is then compared
with catalogued of known material spectra, to identify the components.
In the present work, we used ‘Nicolet is10, Thermofisher’ model of Fourier Transform
Infrared spectroscopy to measure the absorbance spectra of IR radiation. The samples to be
analyzed were prepared for FTIR analysis by KBr method. In this KBr method, the powdered
TiO2 nanoparticles and KBr mixture were used as sample to be measure.
3.2.3. SECONADARY ELECTRON MICROSCOPE (SEM)
The scanning electron microscope (SEM) which is a type of electron microscope that uses
a high energy electrons beam directed towards sample material. In SEM, the electrons
generated by the hot filament get accelerated by electric and magnetic fields. These
accelerated electrons by interacting with sample material produce the signals and these
signals contains the information of surface topography, composition and various other
properties like electrical conductivity. Primarily the SEM is used to analyze the structure of
bulk sample material and it generates the two dimensional image of sample material of any

Page | 22
size and thickness. It can be used to generate high resolution images of sample material
surface and can provide the information of about less than 1 nanometer (<1nm) in size.
The JEOL JSM-6480LV scanning electron microscope (SEM) was used to analyze the
prepared TiO2 sample and study the particle morphology and structure. The platinum material
was used to coat the samples and then these coated samples were used for SEM analysis.
3.2.4. UV-VISIBLE SPECTROSCOPY
Most of the molecules absorb ultraviolet light or visible light. If there is reduction in
strength of beam thus there is increase in absorption of light in solution. It is based on
principle of Beer-Lambert law (at fixed path length) which states that the absorbance is
directly proportional to the path length of light and the concentration of the sample solution.
Different molecules absorb different wavelengths of light. A spectrum of absorption will
represent number of absorption bands which is corresponds to various structural groups
within the molecule. In this it is very essential to know the how absorbance of solution
changes with the concentration of solution.
By using UV-Visible spectrophotometer (Shimadzu, UVSPECTROPHOTOMETER)
integrated with a computer system (JASCO, V-530, Samsung), the supernatant dye solution
was analyzed at characteristic wavelength λmax= 520 nm for determining the calibration curve
of safranin (O) dye and to obtain the concentration of dye after degradation.
3.2.5. BRUNAUER-EMMETT-TELLER (BET)
Brunauer-Emmett-Teller theory was introduced by Stephen Brunauer, Paul Emmett and
Edward Teller. BET uses the principal of physical adsorption of molecules of gas on the
surface of solid to measure the specific surface area of sample material. BET mostly uses the
non-corrosive gases (like Carbon dioxide, Nitrogen etc) as an adsorbate to determine the
specific surface area. The BET theory concept is based on Langmuir theory which given for
the monolayer adsorption of molecules. BET theory uses this theory for multilayer adsorption
of molecule with the some postulates such as, molecules adsorbed on solid surface by
physical adsorption, no interaction appears in between any adsorption layer and to each layer
the Langmuir theory can be applied.
In this work, to measure the specific surface area of synthesized TiO2 nanoparticles we used
BET instrument manufactured by ‘Quantachrome Instruments’. The TiO2 nanoparticles

Page | 23
calcinated at different temperature were degassed at 110 C for 2 hr before the study of
adsorption and desorption of samples with liquid nitrogen to determine the specific surface
area.
3.3. EXPERIMENTAL SETUP
A three neck 250mL conical flask having two connections off size 24/29 and one
connection for thermometer inlet, one coneection off size 24/29 was equipped with pressure
equalizing funnel for dropwise addition of hydrolysis solution i.e milliQ water into precursor
solution present in conical flask.
Figure 5 Setup for TiO2 synthesis
A CaCl2 drying tube is connected to conical flask through other connection of size 24/29.
The drying tube is a simple tube filled with CaCl2 desiccant substance, having one side open
and other side having connection of size 24/29. It is used for releasing the pressure from flask
while prohibiting moisture to be entered. Because reactions which are evolving gases or
being heated could potentially shatter a sealed vessel, although, it may not be preferable to
allow air moisture to enter the vessel. A drying tube releases pressure inside the reaction

Page | 24
vessel by allowing gases to escape whereas preventing moisture from contaminating the
reactants. Magnetic stirrer used for the stirring the gel at 55-600C for 2hr and then at ambient
temperature for about 15 hrs.
To carry out the photocatalysis degradation reaction, we prepared a photocatalysis reactor
which includes a wooden box (30cm× 30cm× 70cm) having aluminium foil stick to the inner
wall of box to provide reflection of light and hence provide maximum number of photons to
the catalyst. This box connected with a high pressure mercury lamp (Bajaj, 125W) at top,
used as a photon energy source. Magnetic stirrer placed inside the wooden box to supply
stirring action to the reaction medium.
Figure 6 Setup for photocatalysis
3.4. EXPERIMENTAL PROCEDURE FOR TiO2 SYNTHESIS
It is published in the various literatures that the synthesis of catalytically active TiO2
nanoparticles with anatase phase from titanium tetra isopropoxide (TTIP) requires the
addition of various hydrolyzing agents, like CH3COOH–CH3OH, aqueous HCl, H2O2, p-

Page | 25
toluene sulfonic acid, NH4OH or HNO3 and various additives such as urea, hexylene glycol,
carbon, ZnO/Fe2O3, Al2O3, and ZnO2. However, we have reported here a very simple sol– gel
process to synthesize nanoparticles of TiO2 from titanium tetra isopropoxide with absence of
any additives or hydrolyzing agent.
Titanium tetra isopropoxide (25mL) and isopropyl alcohol (2-propanol) (75mL) were
taken at ambient temperature in a 250mL conical flask connected with a pressure equalizing
funnel, a thermometer inlet and a CaCl2 guard tube. Temperature of this TTIP and isopropyl
alcohol mixture (i.e. precursor solution) was increased to 60o C. In this precursor solution
which at 60o C, a water (25.0mL) was slowly added (dropwise) for period of 30min at 55–60
o
C. The thick whitish slurry was found after addition of water, this thick whitish slurry was
stirred for 2.0 hr with a magnetic stirrer at the same temperature (60o C); followed by stirring
at ambient temperature for 15.0hr. Then filtration of the resulting material through Whatmann
filter paper by vacuum filtration was carried. The cake that was obtained by filtration was
washed by 25 mL of water, it is filtered and further obtained cake was washed by 25 ml of 2-
propanol followed by filtration. The obtained doubled washed TiO2 cake was dried in a hot
air oven for about 12.0hr at 110o C. This dried TiO2 cake was crushed and squeezed to obtain
powder and labeled as TiO2-110.The dried TiO2 powder was then calcined at 400, 600 and
800o C for 2.0hr in a muffle furnace. These samples were labeled as TiO2-400, TiO2-600 and
TiO2-800.
3.5. PREPARTION OF STANDARD STOCK SOLUTION
100 mg of safranin (O) dye powder is accurately dissolved in 1000ml of distilled water.
First of all, a 100 mg precisely weighted dye powder was allowed to dissolve in 200ml
double distilled water by shaking thoroughly. After complete dissolution of dye it was
transferred in a volumetric flask (1000ml) then double distilled water was added up to the 1
liter mark of volumetric flask. A stock solution prepared was 100 mg/liter (100 ppm) with
double distilled water. By using this stock solution, next low concentration was prepared by
subsequent dilution. The supernatant dye solution was analyzed at wavelength of 520 nm by
using JEOL UV-Visible spectrophotometer.

Page | 26
Chapter 4
RESULTS
AND
DISCUSSION

Page | 27
4. RESULTS AND DISCUSSION
ABSTRACT: To study the photocatalytic behaviour of prepared TiO2 nanoparticles, the
information in the form of surface morphology, active surface area, crystal phase, purity (or
presence of defects) and band gap energy is very important. These information we obtained
by characterizing the synthesized TiO2 nanoparticles using XRD, SEM, FTIR, BET and UV-
vis spectroscopy analysis. The degradation of safranin (O) dye carried out by TiO2
nanoparticles, optimization study was carried out by optimizing various parameters.
4.1. CHARACTERIZATION OF TiO2 NANOPARTICLES
4.1.1. X-RAY DIFFRACTION (XRD) ANALYSIS
The XRD patterns of the prepared samples are presented in Figure 9.
Figure 7 XRD analysis of TiO2 nano particles calcinated at different temperature
The prepared TiO2 nanparticles dried at 110o C, and annealed at 400
o C (labelled as
TiO2-400) or 600o C (labaled as TiO2-600) shown well-specified diffraction peaks
corresponding to anatase phase (JCPDS 21-1272), whereas TiO2 powder calcined at 800o C

Page | 28
(TiO2-800) showed only rutile phase (JCPDS 21-1276). The size of the crystallites present in
all samples rises with calcination temperature.
The average crystallite size of anatase phase and rutile phase were calculated by the
commonly known Scherer equation using full width at half maximal (FWHM) data of each
phase:
𝐷 =кλ
β cosθ
Where, D is average crystallite size in angstrom unit (Ao)
К is shape factor and 0.9 is used.
λ is wavelength of incident x-ray radiation.
β is line width at half maximum intensity.
θ is Braggs angle
The average crystallite size of prepared TiO2 samples ware calculated by using this
equation were 9.4, 15.4, 18.8 and 54.12nm for TiO2-110, TiO2-400, TiO2-600 and TiO2-800
respectively.
4.1.2. FOURIER TRANSFORM INFRARED SPECTROSCOPY (FTIR)
ANALYSIS
FTIR spectra of TiO2 dried at 110o C (TiO2-110) and TiO2 calcined at 400
o C (TiO2-400),
600o C (TiO2-600) and 800
o C (TiO2-800) are shown in Figure 10. The sharp peaks of TiO2-
400, TiO2-600, TiO2-800, at 2856 and 2926 cm–1
are assigned to the symmetric and
asymmetric vibrations of –CH2- and –CH3 groups respectively. The band at about 1527 cm−1
and 1423 cm−1
corresponds to the C-O-H bending vibration, which is attributed to the
presence of titanium isopropoxide. Bands less than 800 cm−1
are because of the Ti–O
stretching vibration. A very broad band emerges in a range of 500~700 cm–1
, which is due to
the vibration of Ti–O–Ti bonds in TiO2 lattaice.
4.1.3. SCANNING ELECTRON MICROSCOPE (SEM) ANALYSIS
The surface morphologies of prepared nano size particles of TiO2 are given in figure 11,
The prepared nanoparticles have homogeneity in their shape. From figure we can say that, a
tiny part of synthesized TiO2 particles formed with an agglomeration of nanoparticles of
TiO2. It has clearly observed that TiO2-800 sample (TiO2 calcinated at 800o C) has spherical

Page | 29
type structure and this type of structure isn’t seen in TiO2-110, TiO2-400 and TiO2-600
sample. Because TiO2-800 sample (contains rutile form only) has better crystallinity than
other sample (which consist either anatase phase or anatase and rutile mix phase)
Figure 8 FT-IR spectra of Titanium Oxide samples TiO2-110, TiO2-400, TiO2-600
and TiO2-800

Page | 30
(a) (b)
(c) (d)
Figure 9 SEM images of (a) TiO2-110 (b) TiO2-400 (c) TiO2-600 (d) TiO2-800
4.1.4. ULTRAVIOLET-VISIBLE SPECTROSCOPY ANALYSIS
UV-visible diffuse reflectance spectra of nanoparticles of TiO2 are given in figure 11.
From this spectra we can conclude that, slightly increase in the absorption of TiO2 samples
calcinated at different temperatures than TiO2-110 sample in over a wide range of visible
light but in UV light region TiO2-600 and TiO2-800 shows decreased in their absorption
compared to TiO2-110 sample. The TiO2 calcinated at 400o C (TiO2-400) has shown
tremendous absorption, nearly three times than that of TiO2-110 sample in UV light region.
For higher photocatalytic activity, TiO2-400 sample can be employed because it excites to
produce more electron-hole pairs under visible light as well as UV light. The Band gap (Eg)
energies of TiO2-110, TiO2-400, TiO2-600 and TiO2-800 were 3.45, 3.7, 2.8 and 2.85
respectively. These band gap energies determined by plotting the graph between (αhv)^2 on

Page | 31
y-axis and hv on x-axis (allowed direct transitions). Where α is absorbance calculated from
UV and hv is photon energy (calculated by hv= 1280/wavelength)
Figure 10 UV-Visible spectra of (a) TiO2-110, (b) TiO2-400, (c) TiO2-600 and (d) TiO2-
800
4.1.5. BRUNAUER-EMMETT-TELLER (BET) ANALYSIS
The surface area of prepared TiO2 material calcinated at different temperature was
evaluated by BET- nitrogen adsorption technique are shown in table 4,
Table 4 Specific surface area of TiO2 samples by BET theory
Samples Specific surface area
(m2/g)
Average particle size
calculated by XRD (in
nm)
TiO2-110 101.318 9.4
TiO2-400 95.448 15.4
TiO2-600 48.881 18.8
TiO2-800 43.635 54.1
From above table we have noticed that, anatase phase (i.e. TiO2-400) have higher
specific surface area, on comparison with rutile phase (i.e. TiO2-800). Also it shows as
clacination temperature increases the specific surface area of prepared TiO2 nanoparticles

Page | 32
increases, due to increases in particle size when temperature changes from 110 to 800o C and
change of phase occurred.
4.2. STUDY OF PHOTOCATALYTIC DEGRADATION
The photo-degradation of Safranin (O) dye was studied in a simple photo-reactor
(described before in section 3.2 & shown in figure 8) which is fabricated as a part of research
project. The photocatalytic study of prepared TiO2 nanoparticles was done by degradation of
Safranin (O) dye under the irradiation of light. A 50 mg of synthesized TiO2-110 sample was
taken in a 250 ml beaker containing 200 ml of safranin (O) dye solution having concentration
5 ppm. This solution was then kept inside the chamber of photo-reactor with light ON and
stirring was started (~400 rpm). With every 20 minutes 3ml of sample was pipette out till the
color changes to colorless. The taken samples ware then analyzed in the JEOL UV-Visible
Spectrophotometer to determine the absorption spectrum. Same procedure was used for other
synthesized TiO2-400, TiO2-600 and TiO2-800 samples.
Figure 11 Photo-degradation of safranin (O) dye on the prepared TiO2 samples
From above graph we can conclude that, TiO2-400 sample shows the highest photocatalytic
degradation of safranin (O) dye (about 55% in 150 min). So it’s quite clear that, TiO2
calcinated at 400o C (anatase phase) has great potential to degrade safranin (O) dye.
Therefore for further optimization of parameters of photocatalysis process we used only
TiO2-400 sample.
0
10
20
30
40
50
60
0 20 40 60 80 100 120 140 160
% d
egr
adat
ion
of
dye
Time (min)
TiO2-110
TiO2-400
TiO2-600
TiO2-800

Page | 33
4.2.1. CALIBRATION CURVE
A calibration is a common method of obtaining the concentration of a substance in an
unknown solution, by comparing it with, the concentration of substance in a known solution
having set of standard solutions. It is also known as analytic signal because of the plotting of
calibration curve according to the response of instrument and this response varies with
measured substance (analyte) concentration. In calibration curve, a series of standards was
prepared across the range of concentration close to the concentrations of unknown analyte.
The concentrations of the prepared standards must reside under the working range of the
instrument. For most substances a plot between response of instrument (absorbance in UV
analysis) and concentration of analyte shows a linear relationship. However, the non-linearity
in calibration curve can be avoided by diluting the analyte into the linear range or
compensated by using non-linear curve fitting methods.
Figure 12 Calibration curve of Safranin (O) dye, λmax=520 nm.
We can measure the response of unknown analyte by using instrument and by
interpolating this response we can determine the concentration of unknown analyte. A main
y = 0.072x + 0.002R² = 0.998
0
0.2
0.4
0.6
0.8
1
1.2
1.4
1.6
1.8
2
0 5 10 15 20 25 30
Ab
sorb
ance
Concentration (ppm)

Page | 34
advantage of calibration curve method is random errors in preparing and analyzing the
standard analyte solutions were averaged over several standards.
4.2.2. OPTIMIZATION OF VARIABLES IN PHOTODEGRADATION
In this we studied, effect of various operational variables such as effect of catalyst dose,
initial concentration, pH and temperature on the photo-degradation of safranin (O) dye by
using synthesized heterogeneous TiO2 photocatalyst.
4.2.2.1. EFFECT OF CATALYST DOSE
In photocatalytic degradation studies catalyst dose plays an important role because of cost
of photocatalyst used and for an effective degradation of safranin (O) dye. If we use less
amount of catalyst then the rate of degradation will decrease, however, if we use large
amount of catalyst then it will cost more for degrading the given dye. Hence obtaining the
optimum dose is always cost effective for maximum degradation with minimal resource. So
there is a great importance for study the effect of catalyst dose on photocatalytic degradation.
Figure 13 Graphical representation of effect of catalyst dose
0
10
20
30
40
50
60
70
80
0 50 100 150 200 250 300
% D
egr
adat
ion
of
dye
Time (min)
30mg
40 mg
50 mg
60mg
70mg
80 mg
90 mg
100mg

Page | 35
To study the effect of catalyst dosage, different dosages of TiO2 photocatalyst as varies
from 30 mg (0.03g) to 100 mg (0.1g) were taken into 250 ml beaker which contain 200 ml
safrinin (O) dye having concentration 5 ppm (5 mg/l) and pH= 7.78 (measured when we
made the 5 ppm dilution). This sample was kept in photo-reactor for a period of 240 minutes,
with mercury lamp switched ON and sample was stirred by magnetic stirrer (400 rpm) while
doing experiment. A plot of % degradation of safranin (O) dye for various catalyst doses
versus time was plotted figure 12,
From above figure it was found that with increase in TiO2 photocatalyst dosage,
percentage (%) degradation of Safranin (O) was increased and it reaches to an optimum value
of catalyst dose (70 mg) at which the % degradation of dye was maximum (73% degradation)
for the period of 240 mins. After that optimum catalyst dose % degradation was decreased.
These results can be described by, in terms of availability of large number of active sites on
the catalyst surface and penetration of light into the sample suspension. As catalyst dose
increases the number of active surface area of TiO2 nanoparticles were increases, but on the
other hand it increases the turbidity of the safranin (O) solution so the penetration of light into
the safranin (O) solution will decreases as a result of increased effect of scattering. The
optimum dose of catalyst for photo-degradation of safranin (O) dye was found to be 14
mg/200 ml (70 mg/lit).
4.2.2.2. EFFECT OF INITIAL CONCENTRATION
To investigate the effect of initial concentration on photo-degradation process, the
different concentrations of safranin (O) dye were used. The experiments were carried out
with fixed TiO2 photocatalyst dose of 70 mg/lit at varying initial concentration of safranin
(O) dye as 5, 10, 15, 20 and 25 ppm (mg/lit) prepared from stock solution of 100 ppm.
Figure 14 Graphical representation of effect of initial concentration
0
20
40
60
80
0 50 100 150 200 250 300
% d
egr
adti
on
of
dye
Time (min)
5 ppm
10ppm
15 ppm
20 ppm
25 ppm

Page | 36
Obtained data were plotted as the % degradation versus time and the results obtained are
shown in figure 13. From this plot we can conclude that, the percentage degradation of
safranin (O) dye decreases as initial concentration of dye increases. Reason behind this is, as
concentration of safranin (O) dye increases, more amounts of reactant(s) and reaction
intermediate(s) are adsorbed on the surface of TiO2 photocatalyst and it forms the layer on
the surface, hence it will reduce the formation of hydroxyl radicals. This is because; the less
number of active sites available for adsorption of water molecule for formation of hydroxyl
ion as well as increase in turbidity (due to increase in initial dye concentration) will block the
photon to activate the photocatalyst. The highest % degradation obtained at 5 ppm initial
concentration and hence it was taken as optimum initial concentration of dye.
4.2.2.3. EFFECT OF pH
One of the most important factors which control the photo-degradation process is pH
effect. The effect of pH on photocatalytic degradation of safranin (O) dye was studied in the
pH ranging from 4 to 12 with 200ml of 5 ppm of initial concentration of safranin (O) dye and
a dose of 70 mg/lit of TiO2 photocatalyst. The pH of safranin (O) solution was adjusted by
using the 0.1M HCl and 0.1M NaOH before the experiments. Also the pH of safarnin (O)
saolution was measured before and after the process of photocatalytic degradation for
determining the difference in pH.
Figure 15 Graphical representation of effect of pH
As pH increases the degradation of safranin (O) dye also increases. At acidic pH range
the degradation efficiency of safranin (O) dye was less, because of dissolution of TiO2
0
10
20
30
40
50
60
70
80
90
0 50 100 150 200 250 300
% d
egr
adat
ion
Time (min)
5
6
7
8
9
10
11

Page | 37
nanoparticles at low pH [41]. While at basic pH range the photo-degradation found to be
increased due to the pH influenced the surface properties of photocatalyst as well as it
influenced the dissociation of the dye and formation of OH radical in the solution.The main
reason behind the increase in photo-degradation process is formation of hydroxyl ion is
higher at higher pH. The optimum pH was obtained, pH=11, at which % degradation was
maximum.
4.2.2.4. EFFECT OF TEMPERATURE
In this study we also investigated the effect of temperature on photocatalytic degradation
process of safranin (O) catalysed by TiO2 photocatalyst with varying the temperature in the
range from 40 to 70 C at interval of 10 C. Also the study was carried out with 70 mg/lit of
catalyst in a dye solution having initial concentration of 5 ppm exposed to light for a 240
minutes.
Figure 16 Graphical representation of effect of temperature
It can be seen in figure 18, that the photocatalytic degradation of safranin (O) dye
decreases as temperature of dye solution increases, but, in most of the cases the higher the
temperature faster the degradation rate. The results from figure 18 can be explained as; the
rise in temperature of dye solution lowers the absorbability of TiO2 photocatalyst to safranin
(O) dye. The lower absorbability of Safranin (O) will weaken the direct hole oxidation on
TiO2 photocatalyst surface. The maximum degradation of dye occurs at a temperature of 40 C
and taken as a optimum temperature at which rate of degradation was maximum.
0
10
20
30
40
50
60
70
80
0 50 100 150 200 250 300
% d
egr
adti
on
of
dye
Time (min)
40 C
50 C
60 C
70 C

Page | 38
4.2.3. KINETICS OF PHOTOCATALITIC DEGRADATION
The photocatalytic degradation of safranin (O) organic pollutant on the TiO2
nanoparticles surface follows the kinetics of pseudo first order and can be expressed as,
-ln (Cs/Cs0) = kt
Where, Cs = concentration of safranin (O) dye (in ppm) after a time t in (mins),
Cs0 = concentration of safranin (O) dye (in ppm) at time t=0 min,
k = the pseudo fiest order rate constant of photo-degradation process,
t = time in mins.
Figure 17 Kinetics of Photocatalytic degradation by varying initial concentration
A plot of ln(Cs0/Cs) versus irradiation time (t) is shown in figure 14 for safranin (O) dye
degradation. It is quite clear that there exist a linear relation between ln(Cs0/Cs) and time. The
pseudo first order rate constant for photo-degradation process k and R, linear regression
coefficient with various safranin (O) dye concentration are given in table 5. From table, the
least square fit, R2 = 0.9795 and rate constant of degradation 0.0048 min
-1 was evaluated as
evaluated. The linear relationship between the functions with large R2 values was observed.
Increase in initial concentration of dye from 5 ppm to 25 ppm decreases the rate constant
from 0.0048 to 0.0012 min-1
in 240 minutes. There was decrease in photo-degradation rate
constant as increase in initial concentration of safranin (O) dye solution can be described as,
the initial concentration of safranin (O) solution increases the path length of photons which
0
0.2
0.4
0.6
0.8
1
1.2
1.4
0 50 100 150 200 250 300
ln (
Csₒ
/Cs)
Time (min)
5 ppm
10 ppm
15 ppm
20 ppm
25 ppm
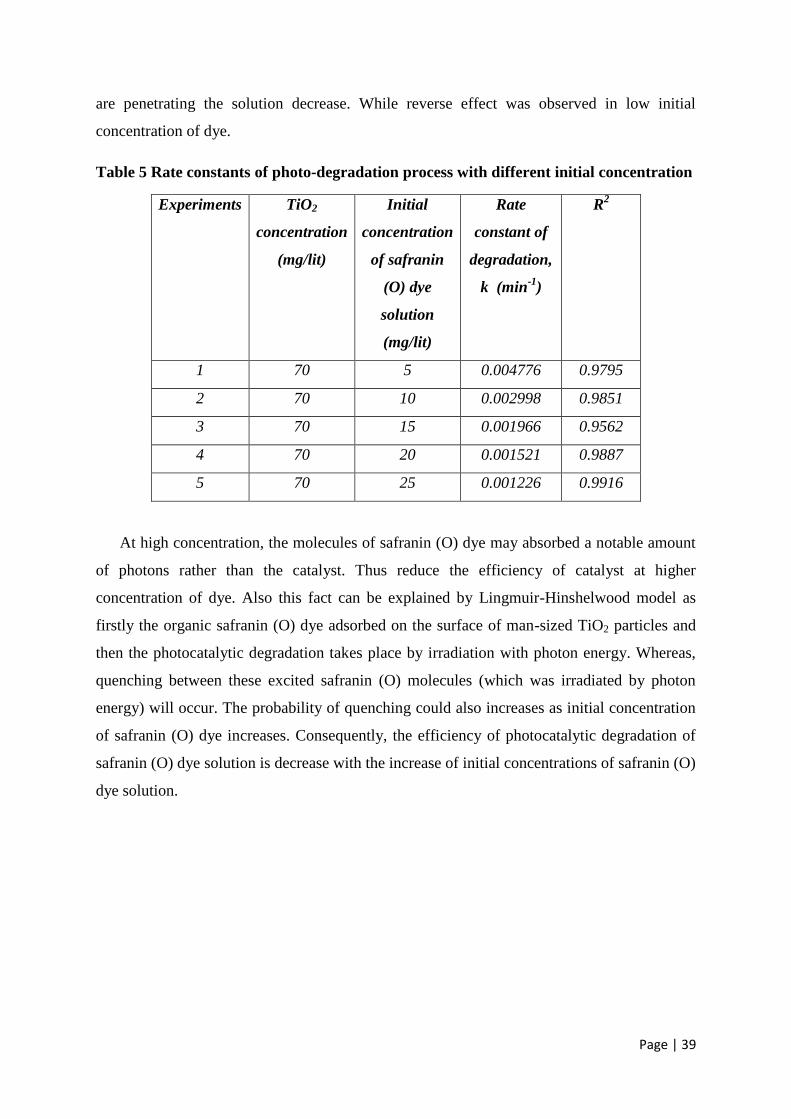
Page | 39
are penetrating the solution decrease. While reverse effect was observed in low initial
concentration of dye.
Table 5 Rate constants of photo-degradation process with different initial concentration
Experiments TiO2
concentration
(mg/lit)
Initial
concentration
of safranin
(O) dye
solution
(mg/lit)
Rate
constant of
degradation,
k (min-1
)
R2
1 70 5 0.004776 0.9795
2 70 10 0.002998 0.9851
3 70 15 0.001966 0.9562
4 70 20 0.001521 0.9887
5 70 25 0.001226 0.9916
At high concentration, the molecules of safranin (O) dye may absorbed a notable amount
of photons rather than the catalyst. Thus reduce the efficiency of catalyst at higher
concentration of dye. Also this fact can be explained by Lingmuir-Hinshelwood model as
firstly the organic safranin (O) dye adsorbed on the surface of man-sized TiO2 particles and
then the photocatalytic degradation takes place by irradiation with photon energy. Whereas,
quenching between these excited safranin (O) molecules (which was irradiated by photon
energy) will occur. The probability of quenching could also increases as initial concentration
of safranin (O) dye increases. Consequently, the efficiency of photocatalytic degradation of
safranin (O) dye solution is decrease with the increase of initial concentrations of safranin (O)
dye solution.

Page | 40
CONCLUSIONS

Page | 41
CONCLUSIONS
Over the past decades, the tremendous effort put into TiO2 nanomaterials has resulted in a
rich database for their synthesis, properties, modifications, and applications. In this project,
we first summarized the structural features of the four TiO2 polymorphs that have been
commonly seen in TiO2 nanostructures. Also we report here a simple method of sol–gel
process to obtain nanoparticles of anatase phase as well as rutile phase TiO2 from titanium
(IV) isopropoxide without using any hydrolyzing agent or additives. The advantage of sol-gel
method are ambient temperature sol preparation and gel processing, high purity of precursors,
product homogeneity, and good control on powder particle size and shape. The combustion
of gel powders, crystallization of the amorphous TiO2 and phase transitions of different
phases are discussed. The photocatalytic activity of prepared various TiO2 sample was
studied on degradation of safranin (O) dye. It was found that TiO2-400 (anatase phase) shows
tremendous photocatalytic activity on safranin (O) dye degradation. This photocatalytic
degradation of safranin (O) was optimized to obtained higher degradation rate. Experiment
results shows that the maximum photocatalytic degradation was obtained at pH=11. The
optimum parameter we determined were, 70 mg/lit of catalyst dose, 5 ppm initial
concentration and 40 C temperature.
FUTURE SCOPE
The following recommendation to be done for further studies:
The photocatalytic studies using various electron scavengers like H2O2, KClO3,
KBrO3, KIO4 and K2S2O8 on decomposition of Safranin (O) dye.
The photocatalytic studies using electron scavenger and TiO2 photocatalyst on
safranin (O) dye.
The synthesis and coating of TiO2 with different materials and its photocatalytic
study.

Page | 42
REFERENCES

Page | 43
REFERENCES
1. M Anbia., S. A. Hariri, S. N. Ashrafizadeh, Adsorptive removal of anioic dyes
modified nanoporous silica SBA-3, Appl. Surf. Sci., 256 (2010) 3228–3233.
2. A.W.M. Ip, J.P. Barford, G. McKay, Reactive Black dye Adsorption/Desorption
onto Different Adsorbents: Effect of Salt, Surface Chemistry, Pore Size and Surface
Area, J. Colloid Interface Sci., 337 (2009) 32–38.
3. M. K. Purkait, S. D. Gupta, S. De, Adsorption of eosin dye on activated carbon and
its surfactant based desorption, J. Environ. Management, 76 (2005) 135–142.
4. K. M. Shah, Handbook of Synthetic Dyes and Pigments, 2nd ed., Multitech
Publishing Co., India, 1998.
5. L. Rejniak, H. Piotrowska,Effect of Malachite Green, Congo Red and Safranin on
Cell Division in Gemmae of Allium cepa,Nature, 209 (1966) 517–518.
6. P. Chowdhury, T. Viraraghavan, Sonochemical degradation of chlorinated organic
compounds, phenolic compounds and organic dyes – A review, Sci. Total Environ,
407 (2009) 2474–2492.
7. E. Forgacs, T. Cserhati, G. Oros, Removal of synthetic dyes from wastewaters: A
review, Environment International, 30 (2004) 953–971.
8. V. K. Gupta, I. Ali, T. A. Saleh, A. Nayak, S. Agarwal, Chemical treatment
technologies for waste-water recycling—an overview, RSC Advances, 2 (2012)
6380–6388.
9. W. Z. Tang, H. An, UV/TiO2 photocatalytic oxidation of commercial dyes in
aqueous solutions, Chemosphere, 31 (1995) 4157-4170.
10. V. K. Garg, R. Gupta, A. B. Yadav, R. Kumar, Dye removal from aqueous solution
by adsorption on treated sawdust, Bioresource Technology, 89 (2003) 121–124.
11. A. K. Golder, N. Hridaya, A. N. Samanta, S. Ray, Electrocoagulation of methylene
blue and eosin yellowish using mild steel electrodes, J. Hazard. Mater., 127 (2005)
134–140.
12. N. K. Lazaridis, T. D. Darapantsios, D. Georgantas, Kinetic analysis for the
removal of a reactive dye from aqueous solution onto hydrotalcite by adsorption,
Water Res., 37 (2003) 3023–3033.
13. C. R. T. Tarley, M. A. Z. Arruda, Biosorption of heavy metals using rice milling
byproducts: characterisation and application for removal of metals from aqueous
effluents, Chemosphere, 54 (2004) 987–995.

Page | 44
14. M. R. Hoffman, S. T. Martin, W. Choi, D. W. Bahnemann, Environmental
applications of semiconductor photocatalysis, Chem. Rev., 95 (1995) 69–96.
15. N. Sobana, M. Muruganadham, M. Swaminathan, Nano-Ag particles doped TiO2
for efficient photodegradation of direct azo dyes, J. Mol. Catal., A 258 (2006) 124-
132.
16. R. Zallen, M. P. Moret, The optical absorption edge of brookite TiO2, Solid State
Commun., 2006, 137, 154.
17. G. Wakefield, M. Green, S. Lipscomb, B. Flutter, Modified titania nanomaterials
for sunscreen applications - reducing free radical generation and DNA damage,
Mater. Sci.Technol., 20 (2004) 985-988.
18. B. Liu, E. S. Aydil, Growth of Oriented Single-Crystalline Rutile TiO2 Nanorods on
Transparent Conducting Substrates for Dye-Sensitized Solar Cells, J. Am. Chem.
Soc., 131 (2009) 3985-3990.
19. A. Fujishima, K. Honda, Electrochemical photolysis of water at a semiconductor
electrode, Nature, 238 (1972) 37-39.
20. X. Chen, S. S. Mao, Synthesis of titanium dioxide (TiO2) nanomaterials., J.
Nanosci. Nanotechnol., 6 (2006) 906-925.
21. E. Roduner, Size matters: why nanomaterials are different, Chem. Soc. Rev., 35
(2006) 583-592.
22. Y. F. Chen, C. Y. Lee, M. Y. Yen, H. T. Chiu, The Effect of Calcination
Temperature on the Crystallinity of TiO2 Nanopowder,” Journal of Crystal Growth,
J.Crystal Growth, 247 (2003) 363-370.
23. J. F. Banfield, D. R. Veblen, Conversion of Perovskite to Anatase and TiO2 (B): A
TEM Study and the Use of Fundamental Building-Blocks for Understanding
Relationship among the TiO2 Minerals, Am. Mineral., 77 (1992) 545-557.
24. X.-Q. Gong, A. Selloni, M. Batzill, U. Diebold, Steps on TiO2 Anatase (101), Nat.
Mater., 5 (2006) 665-670.
25. O. Carp, C. L. Huisman, A. Reller, Photoinduced reactivity of titanium dioxide,
Progress in Solid State Chemistry, 32 (2004) 33-177.
26. L. L. Hench, J. K. West, The sol-gel process, Chem.Rev, 90 (1990) 33-72.
27. C. J. Brinker , G. W. Scherer, Sol-gel Science: The Physics and Chemistry of Sol-
gel Processing, book, Volume 3, Issue 10, October 199, page 522.

Page | 45
28. T C Jagadale, S P Takale, R S Sonawane, N-doped TiO2 nanoparticle based visible
light photocatalyst by modified peroxide sol-gel method, J Phys Chem C., 112
(2008) 14595–14602.
29. J. H. Lee, Y. S. Yang, Effect of hydrolysis conditions on morphology and phase
content in the crystalline TiO2 nanoparticles synthesized from aqueous TiCl4
solution by precipitation, Mater. Chem. Phys., 93(2005) 237-242.
30. H. Zhang, J. F. Banfield, Kinetics of crystallization and crystal growth of
nanocrystalline anatase in nanometer-sized amorphous titania, Chem. Mater., 14
(2002) 4145-4154.
31. G. Oskam, A. Nellore, R. L. Penn, P. C. Searson, The growth kinetics of TiO2
nanoparticles from titanium(IV) alkoxide at high water/titanium ratios, J. Phys.
Chem. B, 107 (2003) 1734-1738.
32. M. A. Behnajady, H. Eskandarloo, N. Modirshahla, M. Shokri, Investigation of the
effect of sol–gel synthesis variables on structural and photocatalytic properties of
TiO 2 nanoparticles, Desalination, 278 (2011) 10-17.
33. C. Burda, X. Chen, R. Narayanan, M. A. El-Sayed, Chemistry and Properties of
Nanocrystals of Different Shapes, Chem. Rev., 105 (2005) 1025-1102.
34. H. Tumma, N. Nagaraju, K. V. Reddy, Titanium (IV) oxide; an efficient and
structure-sensitive heterogeneous catalyst for the preparation of azoxybenzenes in
the presence of hydrogen peroxide, Applied Catalysis A:General, 353 (2009) 54–
60.
35. V. Loryuenyong, K. Angamnuaysiri,J. Sukcharoenpong, A. Suwannasri, Sol–gel
derived mesoporous titania nanoparticles: Effects of calcination temperature and
alcoholic solvent on the photocatalytic behavior, Ceramics Inter., 38 (2012) 2233-
2237.
36. J. M. Herrmann, Fundamentals and misconceptions in photocatalysis, Journal of
Photochemistry and Photobiology A: Chemistry, 216 (2010) 85-93.
37. S. Parra, J. Olivero, C. Pulgarin, Relationships between physicochemical properties
and photoreactivity of four biorecalcitrant phenylurea herbicides in aqueous TiO2
suspension, Appl Catal B: Environ, 36 (2002) 75-85.
38. Y. Kubota, C. Niwa, T. Ohnuma, Y. Ohko, T. Tatsuma, and T. Mori, Protective
effect of TiO2 particles on UV light induced pyrimidine dimer formation, J
Photochem Photobiol A: Chem, 141 (2001) 225-230.
39. S. Cong, Y. Xu, Explaining the High Photocatalytic Activity of a Mixed Phase

Page | 46
TiO2: A Combined Effect of O2 and Crystallinity, J. Phys. Chem. C, 115 (2011)
21161-21168.
40. Kurkin, E.N Vorontsov, E.N. Savinov, Study of TiO2 deactivation during gaseous
acetone photocatalytic oxidation, J. Catal., 186 (1999) 318–324.
41. A. Mukharjee, A. M. Raichur, J. M. Modak, Dissolution studies on TiO2 with
organics, Chemosphere, 61 (2005) 585-588.