Heritage Bank Limited Financial Report 2011/12...sectors, has legal and health qualifications and is...
80
Heritage Bank Limited Financial Report 2011/12
Transcript of Heritage Bank Limited Financial Report 2011/12...sectors, has legal and health qualifications and is...

Heritage Bank Limited
Financial Report 2011/12

Financial Report 2011 / 12 • Heritage Bank Limited • Page 1
Auditors Ernst & Young
Registered Office Heritage Bank Limited 6th Floor 400 Ruthven Street Toowoomba Qld 4350 Australia
Postal Address P.O. Box 190 Toowoomba Qld 4350 Australia
Contact Details Telephone (07) 4690 9000 International 61 7 4690 9000 Internet www.heritage.com.au Contact Centre 13 14 22 Heritage Access Line 13 14 72
Financial Report for the year ended 30 June 2012
Heritage Bank Limited (formerly Heritage Building Society Limited)
ABN 32 087 652 024. AFSL 240984. Australian Credit Licence 240984.
CONTENTSDirectors’ Report . . . . . . . . . . . . . . . . . . . . . . . . . . . . . . . . . . . . . . . . . . 2
Income Statement . . . . . . . . . . . . . . . . . . . . . . . . . . . . . . . . . . . . . . . .11
Statement of Comprehensive Income . . . . . . . . . . . . . . . . . . . . . . . .12
Statement of Financial Position . . . . . . . . . . . . . . . . . . . . . . . . . . . .13
Statement of Changes in Equity . . . . . . . . . . . . . . . . . . . . . . . . . . . .14
Cash Flow Statement . . . . . . . . . . . . . . . . . . . . . . . . . . . . . . . . . . . . .15
Notes to the Financial Statements . . . . . . . . . . . . . . . . . . . . . . . . . .16
Directors’ Declaration . . . . . . . . . . . . . . . . . . . . . . . . . . . . . . . . . . . . .70
Auditor’s Independence Declaration . . . . . . . . . . . . . . . . . . . . . . . .71
Independent Auditor’s Report . . . . . . . . . . . . . . . . . . . . . . . . . . . . .72

Page 2 • Heritage Bank Limited • Financial Report 2011 / 12
Directors’ Report
Your directors submit their report of the consolidated entity (the “Group”), being Heritage Bank Limited (“Heritage” - formerly Heritage Building Society Limited) and its controlled entities, for
the year ended 30 June 2012.
DIRECTORSThe name and details of the directors of the Group in office during the financial year and until the date of this report are as follows. Directors were in office for this entire period unless
otherwise stated.
NAME AND QUALIFICATIONSMr Brian R. Carter AM, LLB, HonDUniv, FAICD Chairman (retired effective 21 June 2012)
Mr Carter is a retired Solicitor and Toowoomba businessman. He served as a Director of Darling Downs Building Society from 1975-81 and was Deputy Chairman in 1980-81. He had been a Director of Heritage since the merger in 1981. He was Deputy Chairman in 1981-82 and had been Chairman of Directors since 1982. Mr Carter was an ex officio member of, and had involvement with, all Board Committees. Mr Carter has also been Chairman of the Council of the Queensland Institute of Medical Research (1997-98) and Chairman of the Board of St. Vincent’s Hospital Toowoomba (1990-96) as well as various other organisations. Mr Carter was appointed a Member in the General Division of the Order of Australia “For service to business and commerce through the building society industry, and to the community through health care and medical research organisations”. He was awarded the Centenary of Federation Medal for distinguished service to the community. Mr Carter was awarded an honorary doctorate at the University of Southern Queensland for his strong advocacy of the university and his significant contribution to the community through his voluntary, charitable and sporting contributions. Mr Carter retired as both the Chairman and as a Director on 21 June 2012.
Mr Kerry J. Betros BBus, FCPA, MAICD Deputy Chairman (Chairman effective 21 June 2012)
Mr Betros is Managing Director of Betros Bros Holdings Pty Limited and associated companies, Darling Downs-based wholesalers and retailers, established in 1938. He graduated from DDIAE (now USQ) with a Bachelor of Business majoring in management and accounting. He has previously served on various other boards and organisations and was awarded the Centenary of Federation Medal for distinguished service to the community. Mr Betros has been a director of Heritage since 1991. He was the inaugural Chairman of Heritage’s Finance Committee, has been
the Chairman of the Internal Audit Committee and has served on a number of other committees. He became the Chairman of Directors on 21 June 2012.
Dr Dennis P. Campbell PhD, MBA, FCHSE, CHE, FAIM (Deputy Chairman effective 21 June 2012)
Dr Campbell was previously a Chief Executive Officer in both the public and private health sectors. He held the position of CEO at St Vincent’s Hospital Toowoomba for ten years. He also served as a Corporate Director with Legal Aid Queensland for ten years. He serves as a member of numerous Boards and Advisory Committees, representing both public and private health sectors, has legal and health qualifications and is involved in organisational health consulting. Dr Campbell joined the Heritage Board in 2000, is a member of the Insurance and Constitution Review Committees and became Chairman of the Finance Committee on 19 July 2012. Dr Campbell became Chairman of Permanent LMI Pty Limited on 1 January 2010. He also serves as a trustee of the Queensland Museum Foundation, is Chairperson of the Management Advisory Committee of the Cobb & Co Museum, Toowoomba and is Deputy Chairman of the Darling Downs Hospital and Health Board. In 2007, he was awarded an Australia Day Medallion for his services to the Australian College of Health Service Executives. In 2008, he was awarded the Gold Medal for Leadership and Achievement in Health Services Management recognising his contribution and professional achievements in shaping health care policy at the institutional, state and national levels. Dr Campbell was appointed Deputy Chairman of Directors on 21 June 2012.
Mrs Vivienne A. Quinn MAHRI, MRCSA, FAICD
Mrs Quinn is the Managing Director of Quinn & Associates Pty Limited, a Brisbane-based staff recruitment consultancy that operates throughout Australia. She has had 30 years in staff recruitment and has a depth of marketing experience. She is also a partner in a primary production / tourism business on the Southern Downs. Mrs Quinn has served on various Federal and State Government Boards and on the State Councils of human resource industry bodies. She has served on the Heritage Board since 1995, is a member of the Audit and Compliance Committee and is Chairman of the Superannuation Policy Committee.
Professor Peter Swannell AM, BSc, PhD, HonDUniv, FIEAust, CPEng(Ret)
Emeritus Professor Swannell was the Vice-Chancellor and President of the University of Southern Queensland from November 1996 until September 2003, having joined the University as Foundation Professor and Dean of the Faculty of Engineering and Surveying in 1990. This appointment followed an
Financial Report 2011 / 12 • Heritage Bank Limited • Page 3
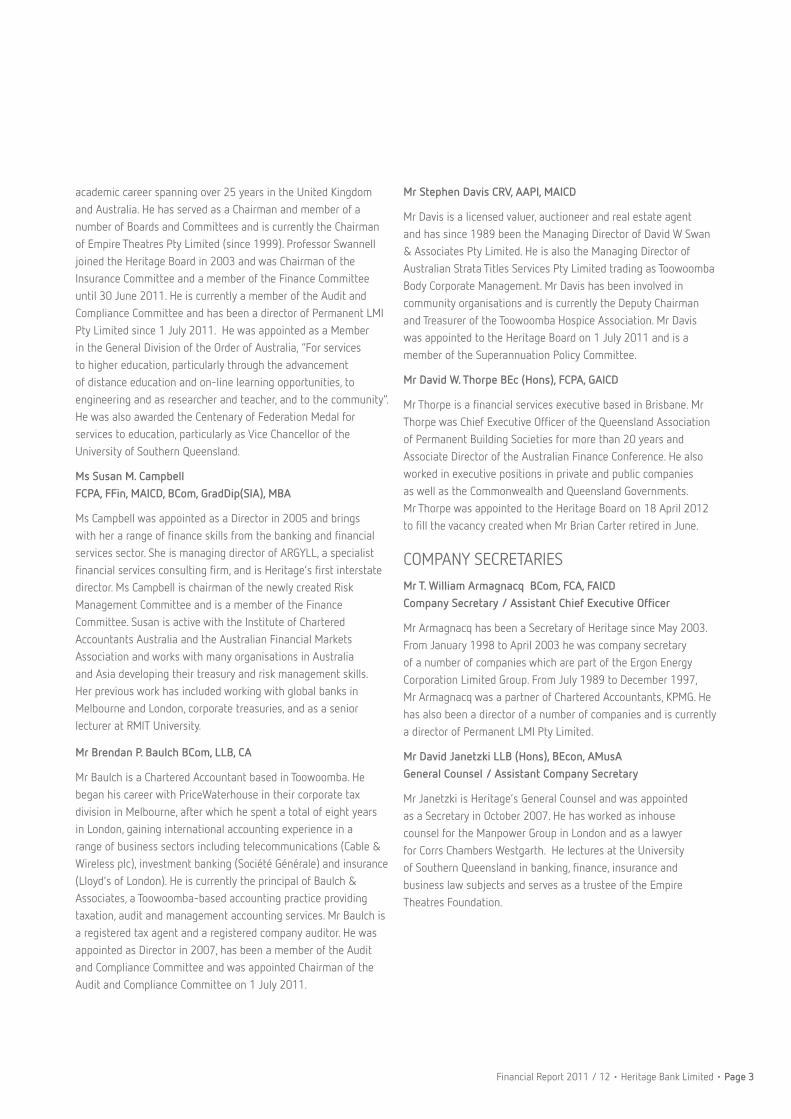
academic career spanning over 25 years in the United Kingdom and Australia. He has served as a Chairman and member of a number of Boards and Committees and is currently the Chairman of Empire Theatres Pty Limited (since 1999). Professor Swannell joined the Heritage Board in 2003 and was Chairman of the Insurance Committee and a member of the Finance Committee until 30 June 2011. He is currently a member of the Audit and Compliance Committee and has been a director of Permanent LMI Pty Limited since 1 July 2011. He was appointed as a Member in the General Division of the Order of Australia, “For services to higher education, particularly through the advancement of distance education and on-line learning opportunities, to engineering and as researcher and teacher, and to the community”. He was also awarded the Centenary of Federation Medal for services to education, particularly as Vice Chancellor of the University of Southern Queensland.
Ms Susan M. Campbell FCPA, FFin, MAICD, BCom, GradDip(SIA), MBA
Ms Campbell was appointed as a Director in 2005 and brings with her a range of finance skills from the banking and financial services sector. She is managing director of ARGYLL, a specialist financial services consulting firm, and is Heritage’s first interstate director. Ms Campbell is chairman of the newly created Risk Management Committee and is a member of the Finance Committee. Susan is active with the Institute of Chartered Accountants Australia and the Australian Financial Markets Association and works with many organisations in Australia and Asia developing their treasury and risk management skills. Her previous work has included working with global banks in Melbourne and London, corporate treasuries, and as a senior lecturer at RMIT University.
Mr Brendan P. Baulch BCom, LLB, CA
Mr Baulch is a Chartered Accountant based in Toowoomba. He began his career with PriceWaterhouse in their corporate tax division in Melbourne, after which he spent a total of eight years in London, gaining international accounting experience in a range of business sectors including telecommunications (Cable & Wireless plc), investment banking (Société Générale) and insurance (Lloyd’s of London). He is currently the principal of Baulch & Associates, a Toowoomba-based accounting practice providing taxation, audit and management accounting services. Mr Baulch is a registered tax agent and a registered company auditor. He was appointed as Director in 2007, has been a member of the Audit and Compliance Committee and was appointed Chairman of the Audit and Compliance Committee on 1 July 2011.
Mr Stephen Davis CRV, AAPI, MAICD
Mr Davis is a licensed valuer, auctioneer and real estate agent and has since 1989 been the Managing Director of David W Swan & Associates Pty Limited. He is also the Managing Director of Australian Strata Titles Services Pty Limited trading as Toowoomba Body Corporate Management. Mr Davis has been involved in community organisations and is currently the Deputy Chairman and Treasurer of the Toowoomba Hospice Association. Mr Davis was appointed to the Heritage Board on 1 July 2011 and is a member of the Superannuation Policy Committee.
Mr David W. Thorpe BEc (Hons), FCPA, GAICD
Mr Thorpe is a financial services executive based in Brisbane. Mr Thorpe was Chief Executive Officer of the Queensland Association of Permanent Building Societies for more than 20 years and Associate Director of the Australian Finance Conference. He also worked in executive positions in private and public companies as well as the Commonwealth and Queensland Governments. Mr Thorpe was appointed to the Heritage Board on 18 April 2012 to fill the vacancy created when Mr Brian Carter retired in June.
COMPANY SECRETARIESMr T. William Armagnacq BCom, FCA, FAICD Company Secretary / Assistant Chief Executive Officer
Mr Armagnacq has been a Secretary of Heritage since May 2003. From January 1998 to April 2003 he was company secretary of a number of companies which are part of the Ergon Energy Corporation Limited Group. From July 1989 to December 1997, Mr Armagnacq was a partner of Chartered Accountants, KPMG. He has also been a director of a number of companies and is currently a director of Permanent LMI Pty Limited.
Mr David Janetzki LLB (Hons), BEcon, AMusA General Counsel / Assistant Company Secretary
Mr Janetzki is Heritage’s General Counsel and was appointed as a Secretary in October 2007. He has worked as inhouse counsel for the Manpower Group in London and as a lawyer for Corrs Chambers Westgarth. He lectures at the University of Southern Queensland in banking, finance, insurance and business law subjects and serves as a trustee of the Empire Theatres Foundation.
Page 4 • Heritage Bank Limited • Financial Report 2011 / 12
Directors’ Report (continued)
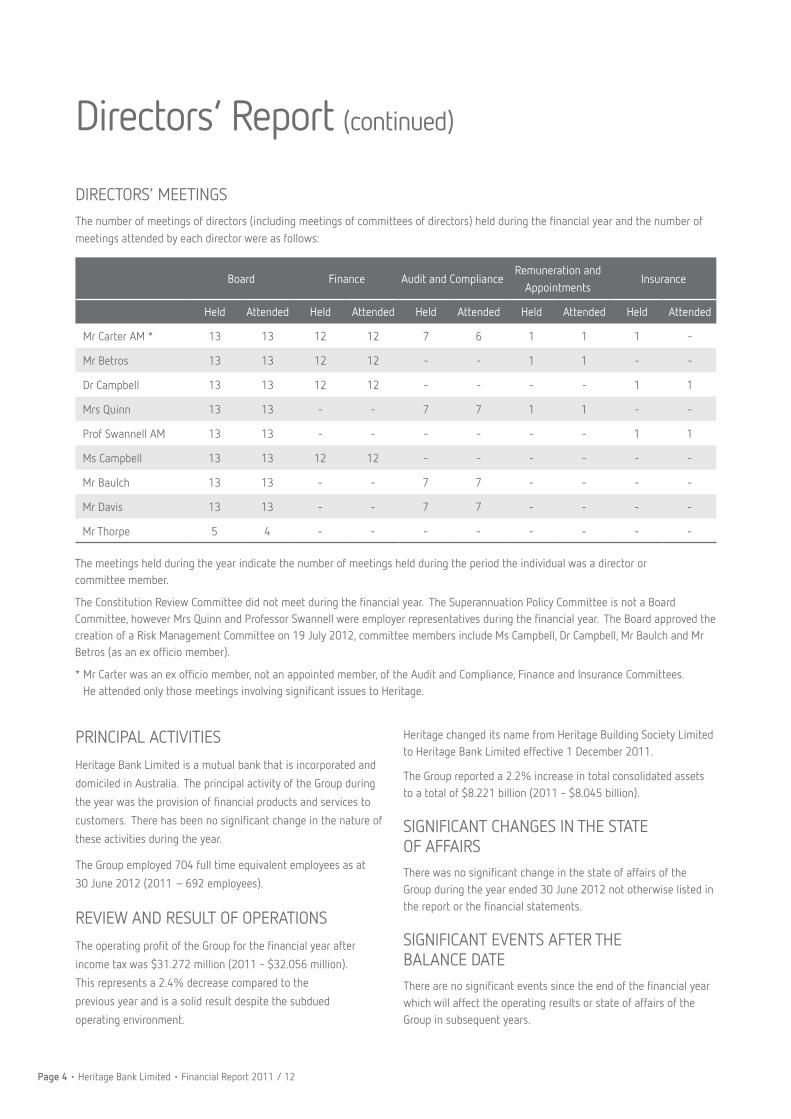
DIRECTORS’ MEETINGSThe number of meetings of directors (including meetings of committees of directors) held during the financial year and the number of meetings attended by each director were as follows:
Board Finance Audit and ComplianceRemuneration and
AppointmentsInsurance
Held Attended Held Attended Held Attended Held Attended Held Attended
Mr Carter AM * 13 13 12 12 7 6 1 1 1 -
Mr Betros 13 13 12 12 - - 1 1 - -
Dr Campbell 13 13 12 12 - - - - 1 1
Mrs Quinn 13 13 - - 7 7 1 1 - -
Prof Swannell AM 13 13 - - - - - - 1 1
Ms Campbell 13 13 12 12 - - - - - -
Mr Baulch 13 13 - - 7 7 - - - -
Mr Davis 13 13 - - 7 7 - - - -
Mr Thorpe 5 4 - - - - - - - -
The meetings held during the year indicate the number of meetings held during the period the individual was a director or committee member.
The Constitution Review Committee did not meet during the financial year. The Superannuation Policy Committee is not a Board Committee, however Mrs Quinn and Professor Swannell were employer representatives during the financial year. The Board approved the creation of a Risk Management Committee on 19 July 2012, committee members include Ms Campbell, Dr Campbell, Mr Baulch and Mr Betros (as an ex officio member).
* Mr Carter was an ex officio member, not an appointed member, of the Audit and Compliance, Finance and Insurance Committees. He attended only those meetings involving significant issues to Heritage.
PRINCIPAL ACTIVITIES
Heritage Bank Limited is a mutual bank that is incorporated and
domiciled in Australia. The principal activity of the Group during
the year was the provision of financial products and services to
customers. There has been no significant change in the nature of
these activities during the year.
The Group employed 704 full time equivalent employees as at
30 June 2012 (2011 – 692 employees).
REVIEW AND RESULT OF OPERATIONS
The operating profit of the Group for the financial year after
income tax was $31.272 million (2011 - $32.056 million).
This represents a 2.4% decrease compared to the
previous year and is a solid result despite the subdued
operating environment.
Heritage changed its name from Heritage Building Society Limited to Heritage Bank Limited effective 1 December 2011.
The Group reported a 2.2% increase in total consolidated assets to a total of $8.221 billion (2011 - $8.045 billion).
SIGNIFICANT CHANGES IN THE STATE OF AFFAIRSThere was no significant change in the state of affairs of the Group during the year ended 30 June 2012 not otherwise listed in the report or the financial statements.
SIGNIFICANT EVENTS AFTER THE BALANCE DATEThere are no significant events since the end of the financial year which will affect the operating results or state of affairs of the Group in subsequent years.
Financial Report 2011 / 12 • Heritage Bank Limited • Page 5
LIKELY DEVELOPMENTS AND EXPECTED RESULTSA statement on the likely developments in the operations of the Group, and the expected results of these operations has not been included in the report because, in the opinion of the Directors, it could prejudice the interest of the economic entity.
INDEMNIFICATION AND INSURANCE OF DIRECTORS AND OFFICERSDuring the financial year, the Group paid premiums in respect of insurance contracts which insure each person who is or has been a director or executive officer of the Group against certain liabilities arising in the course of their activities to the Group.
The directors have not included details of the nature of the liabilities covered, or the amount of the premium paid, as such disclosure is prohibited under the terms of the contract.
REMUNERATION REPORT (AUDITED)This Remuneration Report for the year ended 30 June 2012 outlines the remuneration arrangements of the Group in accordance with section 300A of the Corporations Act 2001. The information provided in the Remuneration Report has been audited as required by section 308(3C) of the Corporations Act 2001.
Introduction
The Remuneration Report provides members with information relating to the Group’s remuneration policies and practices and outlines remuneration arrangements for the Group’s "key management personnel". This Remuneration Report forms part of the Directors' Report.
“Key management personnel” are defined as “those persons having authority and responsibility for planning, directing and controlling the major activities of the entity, directly or indirectly, including any director (whether executive or otherwise) of that entity”.
Governance and Risk Management
The Remuneration and Appointments Committee is appointed and authorised by Heritage’s Board to assist the Board in fulfilling its regulatory obligations.
Accordingly, the Remuneration and Appointments Committee exercises the authority and power delegated to it by the Board.
The Remuneration and Appointments Committee’s role is to report to the Board and review, oversee and provide appropriate advice and recommendations on matters relating to:
• Remuneration policies (including incentive payments);
• Appointment and remuneration of the CEO; and
• Senior executive appointments and senior executive remuneration in conjunction with the CEO.
Key responsibilities include, among others:
• Conduct regular reviews of, and make recommendations to the Board on the remuneration policy and related policies; and
• Make annual recommendations to the Board on the remuneration of the CEO and senior executives, other persons whose activities may in the opinion of the Remuneration and Appointments Committee affect the financial soundness of Heritage and any other person specified by APRA.
In exercising its responsibilities, the Remuneration and Appointments Committee assesses the appropriateness of the nature and amount of remuneration of non-executive directors and senior executives on an annual basis with the overarching objective of ensuring maximum member benefit from the retention of a high quality and high performing Board and senior executive group.
All members of the Remuneration and Appointments Committee are non-executive directors. Members of the Remuneration and Appointments Committee during the period to 30 June 2012 have been Mr Kerry Betros and Mrs Vivienne Quinn. Mr Brian Carter served as Chairman of the Remuneration and Appointments Committee until his retirement as director and Chairman of Heritage on 21 June 2012.
Page 6 • Heritage Bank Limited • Financial Report 2011 / 12
Directors’ Report (continued)
REMUNERATION REPORT (AUDITED) (continued)
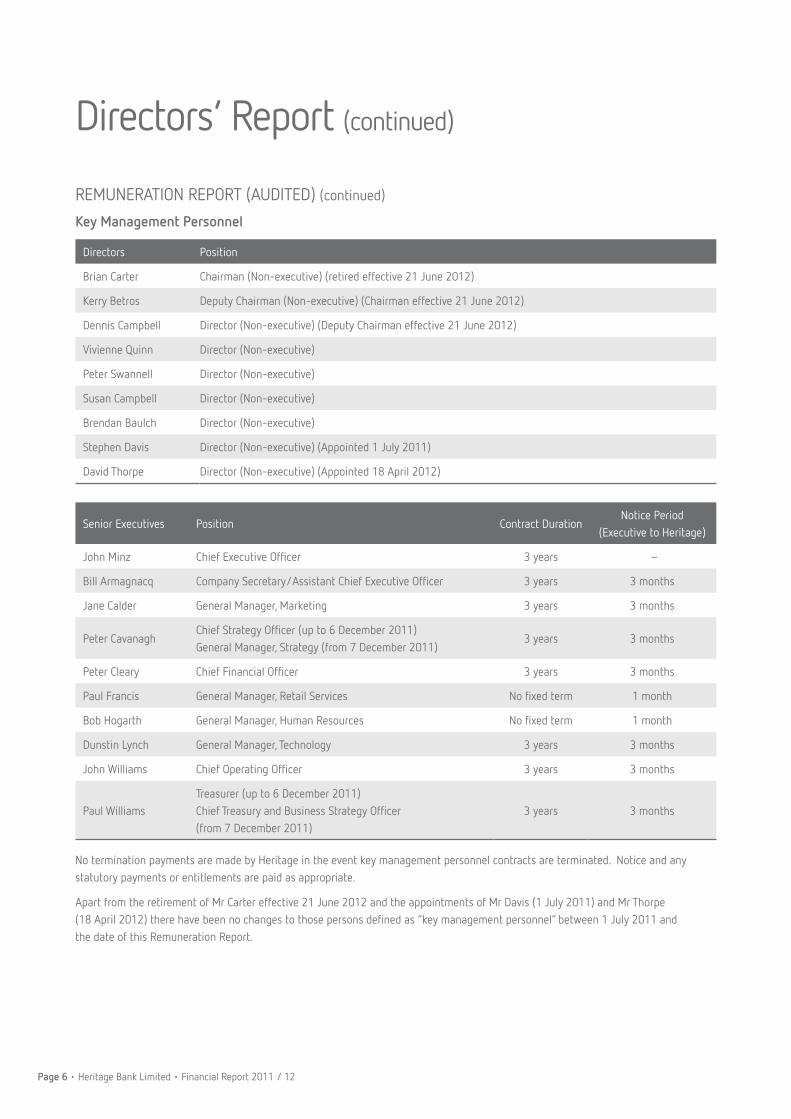
Key Management Personnel
Directors Position
Brian Carter Chairman (Non-executive) (retired effective 21 June 2012)
Kerry Betros Deputy Chairman (Non-executive) (Chairman effective 21 June 2012)
Dennis Campbell Director (Non-executive) (Deputy Chairman effective 21 June 2012)
Vivienne Quinn Director (Non-executive)
Peter Swannell Director (Non-executive)
Susan Campbell Director (Non-executive)
Brendan Baulch Director (Non-executive)
Stephen Davis Director (Non-executive) (Appointed 1 July 2011)
David Thorpe Director (Non-executive) (Appointed 18 April 2012)
Senior Executives Position Contract DurationNotice Period
(Executive to Heritage)
John Minz Chief Executive Officer 3 years –
Bill Armagnacq Company Secretary/Assistant Chief Executive Officer 3 years 3 months
Jane Calder General Manager, Marketing 3 years 3 months
Peter CavanaghChief Strategy Officer (up to 6 December 2011) General Manager, Strategy (from 7 December 2011)
3 years 3 months
Peter Cleary Chief Financial Officer 3 years 3 months
Paul Francis General Manager, Retail Services No fixed term 1 month
Bob Hogarth General Manager, Human Resources No fixed term 1 month
Dunstin Lynch General Manager, Technology 3 years 3 months
John Williams Chief Operating Officer 3 years 3 months
Paul WilliamsTreasurer (up to 6 December 2011)Chief Treasury and Business Strategy Officer (from 7 December 2011)
3 years 3 months
No termination payments are made by Heritage in the event key management personnel contracts are terminated. Notice and any statutory payments or entitlements are paid as appropriate.
Apart from the retirement of Mr Carter effective 21 June 2012 and the appointments of Mr Davis (1 July 2011) and Mr Thorpe (18 April 2012) there have been no changes to those persons defined as “key management personnel” between 1 July 2011 and the date of this Remuneration Report.

Financial Report 2011 / 12 • Heritage Bank Limited • Page 7
REMUNERATION REPORT (AUDITED) (continued) Non-Executive Directors' Remuneration
Background
Directors’ remuneration is reviewed annually by the Remuneration
and Appointments Committee. Based on the review undertaken
by the Remuneration and Appointments Committee, the Board
may make recommendations to members at the Annual General
Meeting taking into account an individual's responsibilities,
performance, qualifications, experience, industry standards,
Heritage's profitability and fees paid by comparable institutions.
Much of this information is derived from independent
remuneration sources.
Recommendations also take into account the need to
attract and retain appropriately qualified and experienced
non-executive directors.
Directors’ fees are set by members at the Annual General Meeting
in the aggregate and the individual allocation is determined and
approved by the Board.
Directors' Fees
The non-executive directors’ aggregate fee amount as set by
members at the Annual General Meeting on 19 October 2011
was $980,000 plus a pro-rata amount in the event an additional
director was appointed. Mr Thorpe was appointed on 18 April
2012. The individual allocation is provided in the table on page
9. This amount does not include superannuation, retirement
allowances or any other entitlements.
Directors are entitled to payment of superannuation contributions
at the rate of 9% of fees paid, payment of directors' liability
and personal accident insurance and related fringe benefits tax.
Under Heritage's Constitution, directors are entitled to a lump
sum retiring allowance calculated as one-fourth of the aggregate
amount of directors’ fees which the director has received or has
become entitled to receive. With the consent of the Board all
or part of the retiring allowance to which a director has or will
become entitled may be paid to a superannuation fund of which
the director is a member.
No part of non-executive director remuneration is based on the
financial performance of Heritage or the performance of the
director and is not otherwise at risk.
Non-executive directors do not participate in Heritage incentive
schemes. Heritage does not have share capital and non-executive
directors do not receive any shares, award rights, share options,
securities or any other benefit howsoever arising.
Directors may maintain loan and credit facilities from Heritage at normal member rates of interest and therefore no additional remuneration is obtained by way of a benefit.
Directors’ fees are not payable to senior executives for serving as directors or company secretaries on any subsidiary, associated or joint venture companies or industry organisations in which Heritage has an interest or membership.
Other Directors' Fees
Mr Kerry Betros received additional remuneration and superannuation contributions as Chairman of HBS Custodian Pty Limited. HBS Custodian Pty Limited is wholly owned by Heritage Bank Limited and had been the Manager of Heritage's securitisation activities up to 31 December 2011. Application has recently been made to ASIC to de-register the company and revoke its Australian Financial Services Licence.
Dr Campbell and Professor Swannell received fees and associated superannuation as directors of Permanent LMI Pty Limited, which is a joint venture arrangement between Heritage Bank Limited and QBE Lenders' Mortgage Insurance Limited. Dr Campbell is also the Chairman of Permanent LMI Pty Limited. Permanent LMI Pty Limited is licensed as an insurer to undertake lender's mortgage insurance and only insures loans written by Heritage.
Senior Executives' Remuneration
Background
A key objective of Heritage’s remuneration philosophy is to enable Heritage to attract, motivate and retain high performing senior executives.
Remuneration, including any performance based component, is designed to appropriately reward senior executives (and all employees) to encourage behaviour that supports Heritage’s long-term financial soundness and risk management framework. In this regard, Heritage’s Human Resources department has a set of policies and procedures in connection with remuneration including incentives, commissions and other benefits.
For senior executives, any performance-based component of remuneration is designed to align remuneration with prudent risk-taking and incorporate adjustments to reflect:
• the outcomes of business activities;
• the risks related to the business activities taking account, where relevant, of the cost of the associated capital; and
• the time necessary for the outcomes of those business activities to be reliably measured.
Page 8 • Heritage Bank Limited • Financial Report 2011 / 12
REMUNERATION REPORT (AUDITED) (continued)
Senior Executives’ Remuneration (continued)
Background (continued)
The Board may adjust performance-based components of senior executive remuneration downwards, to zero if appropriate, if such adjustments are necessary to:
• protect the financial soundness of Heritage; or
• respond to significant unexpected or unintended consequences that were not foreseen by the Remuneration and Appointments Committee.
Senior Executive Remuneration
Senior executive remuneration is currently a mix of fixed salary and short term (yearly) incentive payments.
Fixed Remuneration
Senior executives are paid a competitive fixed component of remuneration that reflects their core performance requirements and the expectations associated with their particular position. The fixed component of remuneration includes matters such as salary, superannuation, motor vehicle novated leases and leave entitlements. Senior executive base salary is reviewed annually taking into account the individual executive’s position, external market trends and personal performance.
Short Term Incentive Benefits
No senior executive is provided with a yearly incentive payment on the basis of Heritage's financial performance.
However, Heritage provides an opportunity for senior executives to be paid a yearly incentive dependent on the individual’s performance throughout the year and the duties and responsibilities undertaken. Any incentive payments are made on the basis of specified, quantifiable results, which may include the completion of a particular business project or the introduction of a new system which improves Heritage’s ability to provide products and services to its members.
The opportunity for senior executives to be granted a yearly incentive payment is designed to support Heritage’s overall remuneration policy by focussing senior executives on achieving yearly personal performance goals which contribute to sustainable Heritage growth and member value.
Linking short-term incentive payments to individual performance ensures that senior executives establish a People first culture that continually supports Heritage's long-term financial soundness.
Long Term Incentive Benefits
Heritage does not offer any long-term incentive benefits to senior executives. Heritage does not have share capital and senior executives do not receive any shares, award rights, share options, securities or any other long-term benefits howsoever arising.
Senior Executive Performance
Heritage’s senior executive employment contracts are either a fixed term or open-ended in nature. The terms and conditions of such employment contracts are commensurable with the banking and finance industry in which Heritage operates.
Senior executives complete an annual performance review with the CEO at which time their performance and remuneration will be discussed. The CEO completes an annual performance review with the Chairman of the Board.
In the case of the CEO, any decisions in respect of remuneration are made on the recommendation of the Remuneration and Appointments Committee and approved by the Board. In the case of senior executives, any decisions in respect of remuneration are made on the recommendation of the CEO and approved by the Remuneration and Appointments Committee and the Board.
Directors’ Report (continued)

Financial Report 2011 / 12 • Heritage Bank Limited • Page 9
Remuneration TableThis section provides the remuneration details for non-executive directors and executives.
Short Term Benefits Long Term Benefits
FeesOther
Group Company Fees
Non-Cash Benefits
Superannuation Contributions
Retiring Allowance Total
$ ' 000 $ ' 000 $ ' 000 $ ' 000 $ ' 000 $ ' 000Non - Executive DirectorsMr B.R. Carter AM Chairman retired effective 21 June 2012
2012 243 - 2 22 61 328 2011 239 - 3 22 59 323
Mr K.J. Betros Deputy Chairman from 1 July 2011 Chairman effective 21 June 2012
2012 191 3 2 17 48 261
2011 140 13 3 14 35 205
Dr D.P. Campbell Deputy Chairman effective 21 June 2012
2012 87 - 2 8 22 119 2011 82 - 3 7 21 113
Mr G.G. Kidd Deputy Chairman retired effective 30 June 2011
2012 - - - - - - 2011 148 - 3 13 37 201
Mrs V.A. Quinn Director
2012 86 - 2 8 21 117 2011 82 - 3 7 21 113
Professor P. Swannell AM Director
2012 86 - 2 8 21 117 2011 82 - 3 7 21 113
Ms S.M. Campbell Director
2012 86 - 2 8 21 117 2011 82 - 3 7 21 113
Mr B.P. Baulch Director
2012 112 - 2 10 28 152 2011 82 - 3 7 21 113
Mr S. Davis Director
2012 86 - 2 8 21 117 2011 - - - - - -
Mr D.W. Thorpe Director
2012 17 - - 2 4 23 2011 - - - - - -
Total for 2012 994 3 16 91 247 1,351 Total for 2011 940 13 22 84 236 1,294
Non-executive directors do not participate in Heritage incentive schemes.
Short Term Benefits Long Term Benefits
TotalSalary Incentive Non-Cash
BenefitsSuperannuation Contributions
Long Service Leave
Entitlements$ ' 000 $ ' 000 $ ' 000 $ ' 000 $ ' 000 $ ' 000
ExecutivesJohn Minz Chief Executive Officer
2012 559 55 24 99 21 758 2011 520 50 23 99 25 717
Bill Armagnacq Company Secretary / Assistant CEO
2012 247 35 22 50 7 361 2011 234 28 22 50 5 339
Jane Calder General Manager, Marketing
2012 231 35 15 29 5 315 2011 206 28 7 32 4 277
Peter Cavanagh Chief Strategy Officer
2012 250 27 14 26 5 322 2011 242 27 15 25 5 314
Peter Cleary Chief Financial Officer
2012 272 35 6 50 8 371 2011 266 36 - 48 7 357
Paul Francis General Manager, Retail Services
2012 272 40 19 49 9 389 2011 260 38 15 50 3 366
Bob Hogarth General Manager, Human Resources
2012 190 35 17 53 8 303 2011 172 34 19 49 6 280
Dunstin Lynch General Manager, Technology
2012 187 30 27 33 5 282 2011 169 35 18 36 18 276
John Williams Chief Operating Officer
2012 240 38 20 52 6 356 2011 225 38 12 39 22 336
Paul Williams Chief Treasury & Business Strategy Officer
2012 311 40 - 38 13 402 2011 276 38 - 39 6 359
Total for 2012 2,759 370 164 479 87 3,859 Total for 2011 2,570 352 131 467 101 3,621
Page 10 • Heritage Bank Limited • Financial Report 2011 / 12
AUDITOR’S INDEPENDENCE DECLARATION In relation to the Auditor’s Independence, the Directors have sought and received a report that there has been no breaches of the Auditor Independence requirement of the Corporations Act 2001. The report is shown on page 71.
ROUNDING The amounts contained in this report and the financial report have been rounded to the nearest $1,000 (where rounding is applicable) under the option available to the company under ASIC Class Order 98/0100. The company is an entity to which the Class Order applies.
Signed in accordance with a resolution of the directors:
TOOWOOMBA 23 August 2012
KERRY J. BETROS Chairman
DENNIS P. CAMPBELL Deputy Chairman
Directors’ Report (continued)

Financial Report 2011 / 12 • Heritage Bank Limited • Page 11
Income Statement
INCOME STATEMENTFor the year ended 30 June 2012
Note CONSOLIDATED PARENT
2012$'000
2011$'000
2012$'000
2011$'000
Interest revenue 3 (a) 503,065 508,229 522,131 527,695
Interest expense 4 (a) (382,263) (392,447) (414,625) (429,357)
Net interest income 120,802 115,782 107,506 98,338
Other income 3 (b) 35,504 32,011 47,326 47,843
Total income 156,306 147,793 154,832 146,181
Impairment losses on loans and receivables 4 (b) (2,092) (2,040) (2,092) (2,040)
Marketing expense (7,237) (6,199) (7,237) (6,199)
Occupancy expense (10,133) (9,374) (10,133) (9,374)
Employee benefits expense 4 (c) (57,299) (53,034) (57,299) (53,034)
Administrative expense (23,179) (19,942) (21,705) (18,330)
Other expense 4 (d) (12,594) (14,335) (12,594) (14,335)
Share of net profit of associates 3 (c) 585 1,017 585 1,017
Profit before tax 44,357 43,886 44,357 43,886
Income tax expense 5 (a) (13,085) (11,830) (13,085) (11,830)
Profit after tax 31,272 32,056 31,272 32,056
The accompanying notes form part of these financial statements

Page 12 • Heritage Bank Limited • Financial Report 2011 / 12
Statement of Comprehensive Income
STATEMENT OF COMPREHENSIVE INCOMEFor the year ended 30 June 2012
Note CONSOLIDATED PARENT
2012$'000
2011$'000
2012$'000
2011$'000
Profit after tax 31,272 32,056 31,272 32,056
Other comprehensive income
Actuarial gain / (loss) on defined benefit plan (1,802) (535) (1,802) (535)
Gain / (loss) on cash flow hedge taken to members' funds (7,270) 7,187 1,165 (2,388)
Net gain on sale of Visa shares reclassified to the Income Statement (2,464) - (2,464) -
Gain / (loss) on revaluation of available for sale financial investments 2,741 (287) 2,741 (287)
Income tax gain / (expense) on items of other comprehensive income 5 (b) 2,098 (2,136) (433) 737
Other comprehensive income / (loss) for the year, net of tax (6,697) 4,229 (793) (2,473)
Total comprehensive income / (loss) for the year, net of tax 24,575 36,285 30,479 29,583
The accompanying notes form part of these financial statements

Financial Report 2011 / 12 • Heritage Bank Limited • Page 13
The accompanying notes form part of these financial statements
STATEMENT OF FINANCIAL POSITIONAs at 30 June 2012
Note CONSOLIDATED PARENT
2012$'000
2011$'000
2012$'000
2011$'000
Assets
Cash and cash equivalents 7 133,081 40,649 123,769 37,919
Receivables due from other financial institutions 8 277,809 398,956 229,559 361,556
Other receivables 9 48,959 57,096 48,593 56,635
Loans and receivables 10 6,637,957 6,486,295 6,637,957 6,486,295
Held to maturity financial assets 12 1,079,857 1,020,973 1,079,857 1,020,973
Investments accounted for using the equity method 13 3,948 4,111 3,948 4,111
Available for sale financial investments 14 4,299 5,421 4,299 5,421
Derivatives 3,180 1,101 16,280 8,587
Other investments 16 - - 327,335 285,620
Property, plant and equipment 17 20,593 21,029 20,593 21,029
Other assets 18 1,509 1,341 1,509 1,341
Intangibles 19 1,049 1,408 1,049 1,408
Deferred tax assets 5 (d) 8,841 6,468 7,458 6,468
Total Assets 8,221,082 8,044,848 8,502,206 8,297,363
Liabilities
Deposits and borrowings 20 7,585,481 7,400,553 5,863,993 5,332,716
Accounts payable and other liabilities 21 220,507 214,504 2,242,087 2,573,554
Derivatives 35,810 43,528 6,097 1,136
Current tax liabilities 2,471 4,075 2,471 4,075
Deferred tax liabilities 5 (e) 3,732 2,834 5,987 3,942
Provisions 22 10,041 9,288 10,041 9,288
Retirement benefit liability 23 (b) 2,424 849 2,424 849
Subordinated debt 24 64,020 97,196 64,020 97,196
Total Liabilities 7,924,486 7,772,827 8,197,120 8,022,756
Net Assets 296,596 272,021 305,086 274,607
Members' Funds
Retained profits 292,411 262,941 292,411 262,941
Reserves 25 4,185 9,080 12,675 11,666
Total Members' Funds 296,596 272,021 305,086 274,607
Statement of Financial Position

Page 14 • Heritage Bank Limited • Financial Report 2011 / 12
The accompanying notes form part of these financial statements
STATEMENT OF CHANGES IN EQUITYFor the year ended 30 June 2012
CONSOLIDATED
Retained profits
Asset revaluation
reserve
Cash flow hedge reserve
Available for sale asset
reserveTotal
$'000 $'000 $'000 $'000 $'000
Balance 1 July 2011 262,941 5,714 1,860 1,506 272,021
Profit for the year 31,272 - - - 31,272
Other comprehensive income (1,802) - (5,089) 194 (6,697)
Total as at 30 June 2012 292,411 5,714 (3,229) 1,700 296,596
Balance 1 July 2010 231,420 5,714 (3,105) 1,707 235,736
Profit for the year 32,056 - - - 32,056
Other comprehensive income (535) - 4,965 (201) 4,229
Total as at 30 June 2011 262,941 5,714 1,860 1,506 272,021
PARENT
Retained profits
Asset revaluation
reserve
Cash flow hedge reserve
Available for sale asset
reserveTotal
$'000 $'000 $'000 $'000 $'000
Balance 1 July 2011 262,941 5,714 4,446 1,506 274,607
Profit for the year 31,272 - - - 31,272
Other comprehensive income (1,802) - 815 194 (793)
Total as at 30 June 2012 292,411 5,714 5,261 1,700 305,086
Balance 1 July 2010 231,420 5,714 6,183 1,707 245,024
Profit for the year 32,056 - - - 32,056
Other comprehensive income (535) - (1,737) (201) (2,473)
Total as at 30 June 2011 262,941 5,714 4,446 1,506 274,607
Statement of Changes in Equity
Financial Report 2011 / 12 • Heritage Bank Limited • Page 15
The accompanying notes form part of these financial statements
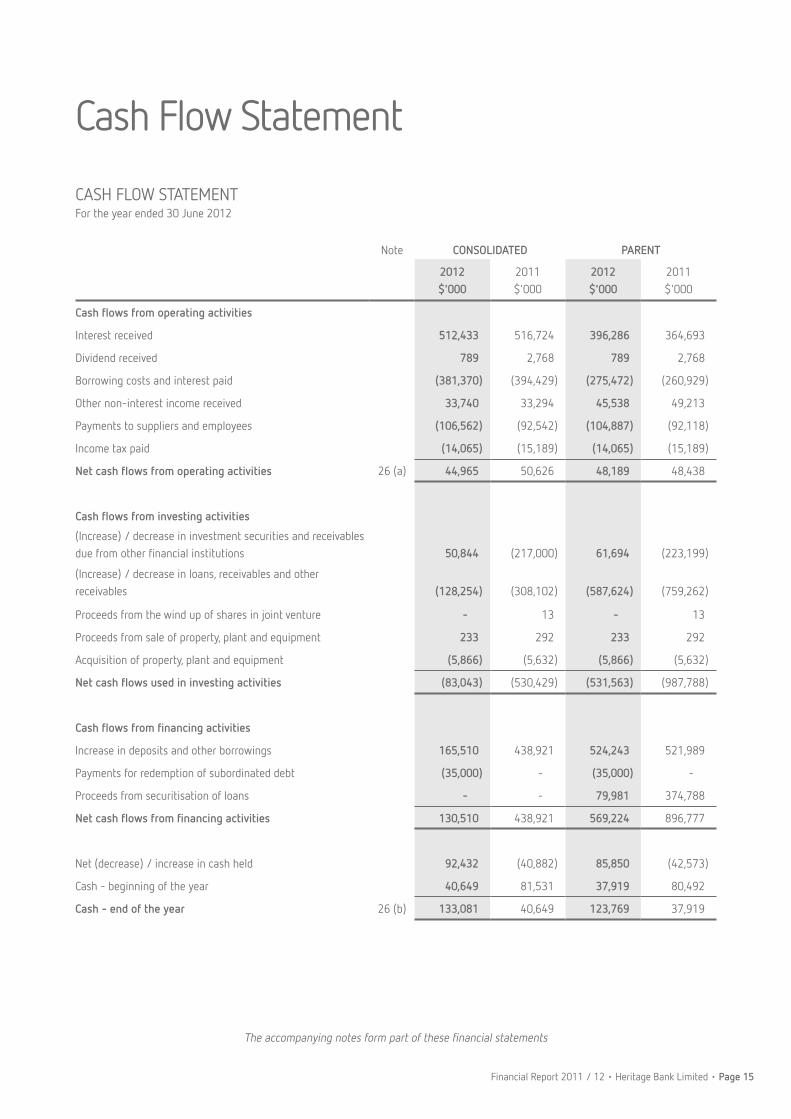
CASH FLOW STATEMENTFor the year ended 30 June 2012
Note CONSOLIDATED PARENT
2012$'000
2011$'000
2012$'000
2011$'000
Cash flows from operating activities
Interest received 512,433 516,724 396,286 364,693
Dividend received 789 2,768 789 2,768
Borrowing costs and interest paid (381,370) (394,429) (275,472) (260,929)
Other non-interest income received 33,740 33,294 45,538 49,213
Payments to suppliers and employees (106,562) (92,542) (104,887) (92,118)
Income tax paid (14,065) (15,189) (14,065) (15,189)
Net cash flows from operating activities 26 (a) 44,965 50,626 48,189 48,438
Cash flows from investing activities
(Increase) / decrease in investment securities and receivables due from other financial institutions 50,844 (217,000) 61,694 (223,199)
(Increase) / decrease in loans, receivables and other receivables (128,254) (308,102) (587,624) (759,262)
Proceeds from the wind up of shares in joint venture - 13 - 13
Proceeds from sale of property, plant and equipment 233 292 233 292
Acquisition of property, plant and equipment (5,866) (5,632) (5,866) (5,632)
Net cash flows used in investing activities (83,043) (530,429) (531,563) (987,788)
Cash flows from financing activities
Increase in deposits and other borrowings 165,510 438,921 524,243 521,989
Payments for redemption of subordinated debt (35,000) - (35,000) -
Proceeds from securitisation of loans - - 79,981 374,788
Net cash flows from financing activities 130,510 438,921 569,224 896,777
Net (decrease) / increase in cash held 92,432 (40,882) 85,850 (42,573)
Cash - beginning of the year 40,649 81,531 37,919 80,492
Cash - end of the year 26 (b) 133,081 40,649 123,769 37,919
Cash Flow Statement
Page 16 • Heritage Bank Limited • Financial Report 2011 / 12
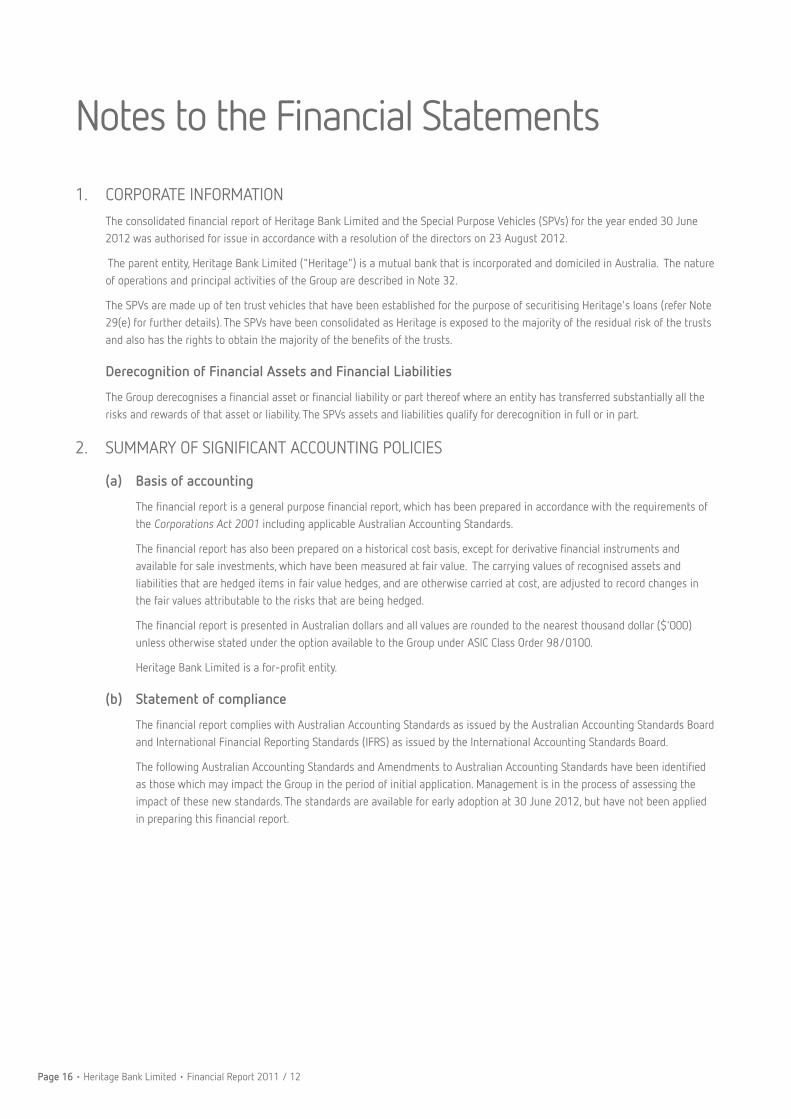
1. CORPORATE INFORMATION The consolidated financial report of Heritage Bank Limited and the Special Purpose Vehicles (SPVs) for the year ended 30 June
2012 was authorised for issue in accordance with a resolution of the directors on 23 August 2012.
The parent entity, Heritage Bank Limited ("Heritage") is a mutual bank that is incorporated and domiciled in Australia. The nature of operations and principal activities of the Group are described in Note 32.
The SPVs are made up of ten trust vehicles that have been established for the purpose of securitising Heritage's loans (refer Note 29(e) for further details). The SPVs have been consolidated as Heritage is exposed to the majority of the residual risk of the trusts and also has the rights to obtain the majority of the benefits of the trusts.
Derecognition of Financial Assets and Financial Liabilities
The Group derecognises a financial asset or financial liability or part thereof where an entity has transferred substantially all the risks and rewards of that asset or liability. The SPVs assets and liabilities qualify for derecognition in full or in part.
2. SUMMARY OF SIGNIFICANT ACCOUNTING POLICIES
(a) Basis of accounting
The financial report is a general purpose financial report, which has been prepared in accordance with the requirements of the Corporations Act 2001 including applicable Australian Accounting Standards.
The financial report has also been prepared on a historical cost basis, except for derivative financial instruments and available for sale investments, which have been measured at fair value. The carrying values of recognised assets and liabilities that are hedged items in fair value hedges, and are otherwise carried at cost, are adjusted to record changes in the fair values attributable to the risks that are being hedged.
The financial report is presented in Australian dollars and all values are rounded to the nearest thousand dollar ($'000) unless otherwise stated under the option available to the Group under ASIC Class Order 98/0100.
Heritage Bank Limited is a for-profit entity.
(b) Statement of compliance
The financial report complies with Australian Accounting Standards as issued by the Australian Accounting Standards Board and International Financial Reporting Standards (IFRS) as issued by the International Accounting Standards Board.
The following Australian Accounting Standards and Amendments to Australian Accounting Standards have been identified as those which may impact the Group in the period of initial application. Management is in the process of assessing the impact of these new standards. The standards are available for early adoption at 30 June 2012, but have not been applied in preparing this financial report.
Notes to the Financial Statements

Financial Report 2011 / 12 • Heritage Bank Limited • Page 17
Reference Title Nature of change to accounting policy
Application date of standard
Application date for Group
AASB 2011-9 Amendments to Australian Accounting Standards - Presentation of Other Comprehensive Income
Group items on the basis that they might be reclassified subsequently to profit or loss.
1 July 2012 1 July 2012
AASB 10 Consolidated Financial Statements **
AASB 10 establishes a new control model that applies to all entities which broadens the situations when an entity is considered to be controlled by another entity.
1 January 2013 1 July 2013
AASB 11 Joint Arrangements ** AASB 11 uses the principle of control established in AASB 10, it also removes the option to account for jointly controlled entities using proportionate consolidation.
1 January 2013 1 July 2013
AASB 12 Disclosure of Interests in Other Entities
AASB 12 includes all disclosures relating to an entity's interests in subsidiaries, joint arrangements, associates and structured entities.
1 January 2013 1 July 2013
AASB 13 Fair Value Measurement
AASB 13 establishes a single source of guidance for determining the fair value of assets and liabilities.
1 January 2013 1 July 2013
AASB 119 Employee Benefits Requires the liabilities arising from defined benefit fund plans to be recognised in full in other comprehensive income.
1 January 2013 1 July 2013
AASB 1053 Application of Tiers of Australian Accounting Standards
The standard establishes a differential financial reporting framework consisting of two Tiers of reporting requirements.
1 July 2013 1 July 2013
AASB 9 Financial Instruments Improve and simplify the approach for classification and measurement of financial assets.
1 January 2015 1 July 2015
** The impact of these standards is being assessed for the investment in Permanent LMI Pty Limited, (refer note 13) which is currently being accounted for using the equity method. If it is determined that the entity is controlled by Heritage it will be required to be consolidated, if it is determined not to be controlled by Heritage it will continue to be accounted for using the equity method.
2. SUMMARY OF SIGNIFICANT ACCOUNTING POLICIES (continued)
(b) Statement of compliance (continued)
Page 18 • Heritage Bank Limited • Financial Report 2011 / 12
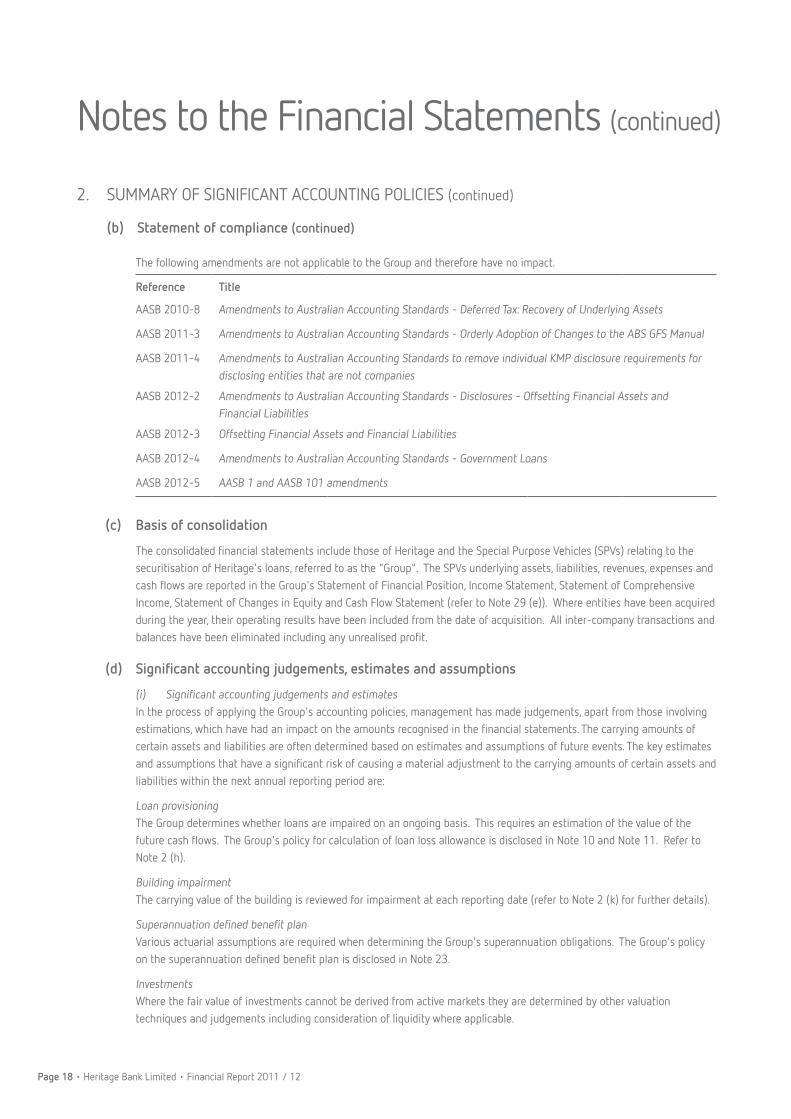
(c) Basis of consolidation
The consolidated financial statements include those of Heritage and the Special Purpose Vehicles (SPVs) relating to the securitisation of Heritage's loans, referred to as the "Group". The SPVs underlying assets, liabilities, revenues, expenses and cash flows are reported in the Group's Statement of Financial Position, Income Statement, Statement of Comprehensive Income, Statement of Changes in Equity and Cash Flow Statement (refer to Note 29 (e)). Where entities have been acquired during the year, their operating results have been included from the date of acquisition. All inter-company transactions and balances have been eliminated including any unrealised profit.
(d) Significant accounting judgements, estimates and assumptions
(i) Significant accounting judgements and estimates In the process of applying the Group's accounting policies, management has made judgements, apart from those involving
estimations, which have had an impact on the amounts recognised in the financial statements. The carrying amounts of certain assets and liabilities are often determined based on estimates and assumptions of future events. The key estimates and assumptions that have a significant risk of causing a material adjustment to the carrying amounts of certain assets and liabilities within the next annual reporting period are:
Loan provisioning The Group determines whether loans are impaired on an ongoing basis. This requires an estimation of the value of the
future cash flows. The Group's policy for calculation of loan loss allowance is disclosed in Note 10 and Note 11. Refer to Note 2 (h).
Building impairment The carrying value of the building is reviewed for impairment at each reporting date (refer to Note 2 (k) for further details).
Superannuation defined benefit plan Various actuarial assumptions are required when determining the Group's superannuation obligations. The Group's policy
on the superannuation defined benefit plan is disclosed in Note 23.
Investments Where the fair value of investments cannot be derived from active markets they are determined by other valuation
techniques and judgements including consideration of liquidity where applicable.
2. SUMMARY OF SIGNIFICANT ACCOUNTING POLICIES (continued)
(b) Statement of compliance (continued)
The following amendments are not applicable to the Group and therefore have no impact.
Reference Title
AASB 2010-8 Amendments to Australian Accounting Standards - Deferred Tax: Recovery of Underlying Assets
AASB 2011-3 Amendments to Australian Accounting Standards - Orderly Adoption of Changes to the ABS GFS Manual
AASB 2011-4 Amendments to Australian Accounting Standards to remove individual KMP disclosure requirements for disclosing entities that are not companies
AASB 2012-2 Amendments to Australian Accounting Standards - Disclosures - Offsetting Financial Assets and Financial Liabilities
AASB 2012-3 Offsetting Financial Assets and Financial Liabilities
AASB 2012-4 Amendments to Australian Accounting Standards - Government Loans
AASB 2012-5 AASB 1 and AASB 101 amendments
Notes to the Financial Statements (continued)
Financial Report 2011 / 12 • Heritage Bank Limited • Page 19
(e) Revenue recognition
(i) Interest income Revenue is recognised as interest accrues using the effective interest method. This is a method of calculating the
amortised cost of a financial asset and allocating the interest income over the relevant period using the effective interest
rate. This is the rate that exactly discounts estimated future cash receipts through the expected life of the financial asset to
the net carrying amount of the financial asset.
Payments made to brokers for the introduction of mortgage loan borrowers to Heritage are expensed over three years from
the date of payment to match the cost of acquiring the loan to the income derived from it. In line with the effective interest
rate method mortgage commission is reclassified to interest revenue.
Set up costs incurred for securitisation are carried forward and amortised over the period of probable future economic
benefits, approximately four years. In line with the effective interest rate method securitisation establishment costs are
reclassified to interest revenue.
(ii) Dividend income Revenue is recognised when the Group's right to receive the payment is established.
(iii) Fees and commissions Fees and commissions that form an integral part of interest are classified as part of interest revenue. Revenue is recognised
as interest accrues using the effective interest method.
(f) Cash and cash equivalents
Cash in the Statement of Financial Position and Cash Flow Statement comprises of cash at bank and on hand.
(g) Derivative financial instruments and hedging
The Group uses derivative financial instruments such as interest rate, basis and cross currency swaps to hedge its risks
associated with interest rate and currency fluctuations. These instruments are initially recognised at cost on the date on
which a derivative contract is entered into and are subsequently remeasured to fair value. Derivatives are carried as assets
when their fair value is positive and as liabilities when their fair value is negative. Any gains or losses arising from changes
in the fair value of derivatives, except for those that qualify as effective cash flow hedges, are taken directly to net profit or
loss for the year.
The fair value of swap contracts is determined by reference to market values for similar instruments.
At the inception of a hedge relationship, the Group formally designates and documents the hedge relationship to which the
Group wishes to apply hedge accounting and the risk management objective and strategy for undertaking the hedge. The
documentation includes identification of the hedging instrument, the hedged item or transaction, the nature of the risk
being hedged and how the entity will assess the hedging instrument's effectiveness in offsetting the exposure to changes
in the hedged item's fair value or cash flows attributable to the hedged risk. Such hedges are expected to be highly
effective in achieving offsetting changes in fair value or cash flows and are assessed on an ongoing basis to determine that
they actually have been highly effective throughout the financial reporting periods for which they were designated.
Hedges that meet the strict criteria for hedge accounting are accounted for as follows:
(i) Fair value hedges Fair value hedges are hedges of the Group's exposure to changes in the fair value of a recognised asset or liability. For fair
value hedges, the carrying amount of the hedged item is adjusted for gains and losses attributable to the risk being hedged.
The derivative is remeasured to fair value and gains and losses from both are taken to the Income Statement.
2. SUMMARY OF SIGNIFICANT ACCOUNTING POLICIES (continued)
Page 20 • Heritage Bank Limited • Financial Report 2011 / 12
(ii) Cash flow hedges Cash flow hedges are hedges of the Group's exposure to variability in cash flows that is attributable to a particular risk
associated with a recognised asset or liability. The effective portion of the gain or loss on the hedging instrument is recognised directly in equity, while the ineffective portion is recognised in the Income Statement.
Amounts taken to equity are transferred to the Income Statement when the hedged transaction affects the Income Statement, such as when hedged income or expenses are recognised.
Refer to Note 2 (l) for further detail.
(h) Loan provisioning
Loan impairment will only be recognised when objective evidence is available that a loss event has occurred and as a consequence it is not likely that all amounts owed will be received. Outlined below are the relevant accounting policies.
Specific provision A specific provision is raised for losses that may be incurred for individual loans that are known to be impaired by assessing
the recoverability against the security value.
Collective provision Loans that are not known to be impaired are grouped together according to their risk characteristics and are then assessed
for impairment. Based on historical loss data and current available information for assets with similar risk characteristics, the appropriate collective provision is raised. From the analysis performed, the provision has been consistent with the historical level of bad debts experienced in those portfolios.
Impairment losses Impairment losses are written off in the year in which they are recognised. If a provision for impairment has been
recognised in relation to the loan, write-offs are made against the provision. If no provision for impairment has previously been recognised, write-offs for impairment losses are recognised as expenses in the Income Statement.
(i) Income tax
Deferred income tax liabilities are recognised for all taxable temporary differences except:
- when the deferred income tax liability arises from the initial recognition of goodwill or of an asset or liability in a transaction that is not a business combination and that, at the time of the transaction, effects neither the accounting profit nor taxable profit or loss; or
- when the taxable temporary difference is associated with investments in subsidiaries, associates or interests in joint ventures, and the timing of the reversal of the temporary difference can be controlled and it is probable that the temporary difference will not reverse in the foreseeable future.
Deferred income tax assets are recognised for all deductible temporary differences, to the extent that it is probable that taxable profit will be available against the deductible temporary differences, except:
- when the deferred income tax asset relating to the deductible temporary differences arises from the initial recognition of an asset or liability in a transaction that is not a business combination and, at the time of the transaction, affects neither the accounting profit nor taxable profit or loss; or
- when the deductible temporary difference is associated with investments in subsidiaries, associates or interests in joint ventures, in which case a deferred tax asset is only recognised to the extent that it is probable that the temporary difference will reverse in the foreseeable future and taxable profit will be available against which temporary differences can be utilised.
2. SUMMARY OF SIGNIFICANT ACCOUNTING POLICIES (continued)
(g) Derivative financial instruments and hedging (continued)
Notes to the Financial Statements (continued)

Financial Report 2011 / 12 • Heritage Bank Limited • Page 21
Tax effect accounting is applied using the balance sheet method whereby deferred income tax is provided on all temporary differences at the balance sheet date between the tax bases of assets and liabilities and their carrying amounts for financial reporting purposes.
Deferred income tax assets and liabilities are measured at the tax rates that are expected to apply to the year when the asset is realised or the liability is settled, based on the tax rates that have been enacted at the balance sheet date.
The carrying amount of deferred income tax assets is reviewed at each balance sheet date and reduced to the extent that it is no longer probable that sufficient taxable profit will be available to allow all or part of the deferred income tax asset to be utilised.
Unrecognised deferred income tax assets are reassessed at each balance sheet date and are recognised to the extent that it has become probable that future taxable profit will be available to allow all or part of the deferred income tax asset to be utilised.
(j) Goods and Services Tax (GST)
Revenues, expenses and assets are recognised net of the amount of GST, except where the amount of GST incurred is not recoverable from the Australian Taxation Office. In these circumstances the GST is recognised as part of the cost of acquisition of the asset or as part of an item of the expense. Receivables and payables in the Statement of Financial Position are shown inclusive of GST.
(k) Property, plant and equipment
Plant and equipment is stated at cost less accumulated depreciation and any accumulated impairment losses.
Land and buildings are measured at cost less accumulated depreciation on buildings. An impairment loss is recognised for the amount by which the asset's carrying value exceeds its recoverable amount.
Depreciation is calculated on a straight-line basis over the estimated useful life of the assets as follows: Building - 40 years Leasehold improvements - the lease term Plant and equipment - 3 to 8 years
(i) Impairment The carrying values of property, plant and equipment are reviewed for impairment at each reporting date, with recoverable
amounts being estimated when events or changes in circumstance indicate the carrying value may be impaired.
An impairment loss exists when the carrying value of an asset or cash-generating units exceeds its estimated recoverable amount. The asset or cash-generating unit is then written down to its recoverable amount.
(l) Classification of financial assets and financial instruments
(i) Financial instruments (derivatives) Those derivatives that the Group does not apply hedge accounting to are classified as 'held for trading' financial assets.
These are measured at fair value, with fair value changes charged to the Income Statement. Those derivatives where the Group is applying hedge accounting are designated and qualify as either cash flow hedges or fair value hedges. The various derivatives entered into are as follows:
(a) Cash flow hedge of variable rate liabilities The Group's policy is to enter into pay fixed / receive floating swaps with approved external counterparties to mitigate
against variability in cash flows of a portfolio of floating rate liabilities.
2. SUMMARY OF SIGNIFICANT ACCOUNTING POLICIES (continued)
(i) Income tax (continued)
Page 22 • Heritage Bank Limited • Financial Report 2011 / 12
(b) Cash flow hedge of variable rate assets The Group's policy is to enter into pay floating / receive fixed swaps to counteract against variability in cash flows of a
portfolio of floating rate assets.
(c) Cash flow hedge of Euro denominated notes The Group's policy is to enter into a cross currency swap to effectively convert the floating Euro denominated debt to
floating Australian dollar debt.
(d) Fair value hedge The Group has entered into a pay floating / receive fixed swap with approved external counterparties to mitigate against
changes in the fair value of term subordinated debt due to movement in interest rates.
The Group has entered into a pay fixed / receive floating swap with approved external counterparties to mitigate against changes in the fair value of a fixed rate asset bond due to movement in interest rates.
(ii) Financial assets Financial assets are classified into one of the following categories:
Loans and receivables These are non-derivative financial assets with fixed or determinable payments that are not quoted in an active market.
These assets are carried at amortised cost using the effective interest method.
Held to maturity financial assets These are non-derivative financial assets with fixed or determinable payments and fixed maturity and where the Group
has the intention and ability to hold to maturity. These assets are measured at amortised cost using the effective interest method less any impairment.
Available for sale financial investments These are those non-derivative financial assets that are not classified in any of the above categories. After initial
measurement, available for sale financial investments are subsequently measured at fair value or cost where the fair value is unable to be measured reliably. Unrealised gains and losses are recognised directly in the Statement of Changes in Equity in the available for sale asset reserve.
Impairment - loans and receivables Refer Note 2(h) for details.
Impairment of financial assets other than loans and receivables The Group assesses at each reporting date whether there is objective evidence that a financial asset or a group of assets is
impaired. A financial asset is deemed to be impaired if there is objective evidence of impairment as a result of an event that has occured after initial recognition of the asset and that event has had an impact on the estimated future cash flows of the financial asset.
Impairment - financial assets carried at amortised cost For financial assets carried at amortised cost, the Group assesses individually whether objective evidence of impairment
exists or collectively for financial assets that are not individually significant or have no individual impairment. If there is objective evidence that an impairment loss has been incurred the amount of loss is measured as the difference between the asset's carrying amount and the present value of estimated future cash flows.
Impairment - Available for sale financial investments The Group assesses whether there is objective evidence of impairment based on there being a significant or prolonged
decline in fair value.
2. SUMMARY OF SIGNIFICANT ACCOUNTING POLICIES (continued)
(l) Classification of financial assets and financial instruments (continued)
Notes to the Financial Statements (continued)
Financial Report 2011 / 12 • Heritage Bank Limited • Page 23
(m) Employee benefits
Provision has been made for the liability to pay annual leave for all employees at the remuneration rates which are expected to be paid when the liability is settled. Provision for the liability to pay long service leave is made for all employees from their date of commencement at discounted expected future values in accordance with AASB 119 Employee Benefits.
In accordance with AASB 119 the net position of the defined benefit plan is recognised in the Statement of Financial Position. Any gains or losses with the exception of the actuarial gain or loss, arising from changes in the net position between reporting periods is recognised through the profit and loss account. Actuarial gains or losses are recognised directly through retained earnings and disclosed in Other Comprehensive Income.
(n) Provision for directors' retiring allowance
Provision has been made for all directors in accordance with Rule 69.5 of the Constitution of Heritage. The retiring allowance is calculated as one-fourth of the aggregate amount of directors' fees which have been approved at the annual general meeting. All or part of this retiring allowance can be paid to a complying superannuation fund.
(o) Make good provision and asset
A provision is made for the anticipated costs of restoring leased premises at the end of the leased term that reflects the present obligation to restore the premises. The estimate of the costs has been calculated by reviewing current and historical defit costs and calculating an average cost per square metre. A cost per branch has been calculated depending on its size. A provision and asset has then been recorded to reflect the cost at the end of each lease term. The asset is amortised over the lease term. Both the asset and liability is reassessed at the end of each financial year to account for new, amended and expired leases.
(p) Intangible assets
Intangible assets include the value of computer software which are measured on initial recognition at cost. Following initial recognition, intangible assets are carried at cost less any accumulated amortisation and impairment losses. Amortisation is calculated on the straight line basis over three years.
(q) Subordinated debt
Subordinated debt includes debt listed with Australian Securities Exchange and other unlisted debt. The listed debt is initially recognised at fair value net of direct issue costs. Changes in the fair value are recognised in the Income Statement. The unlisted debt is measured at amortised cost using the effective interest rate method.
(r) Leasing
The determination of whether an arrangement is a lease, or it contains a lease, is based on the substance of the arrangement and requires an assessment of whether the fulfilment of the arrangement is dependent on the use of a specific asset or assets and the arrangement conveys a right to use the asset.
Leases which do not transfer to Heritage substantially all the risks and benefits incidental to ownership of the leased items are operating leases. Operating lease payments are recognised as an expense in the Income Statement on a straight line basis over the lease term.
(s) Accounting for associates
An associate is an entity over which the Group has significant influence and that is neither a subsidiary nor an interest in a joint venture. Significant influence is the power to participate in the financial and operating policy decisions of the investee. The results, assets and liabilities of associates are incorporated using the equity method of accounting.
2. SUMMARY OF SIGNIFICANT ACCOUNTING POLICIES (continued)

Page 24 • Heritage Bank Limited • Financial Report 2011 / 12
(t) Guarantees
Guarantees are issued to third parties by Heritage in favour of bodies such as councils or electricity supply boards, relative to work or construction to be carried out by those clients.
The member is required to lodge funds as a term deposit equal to the guarantee amount. This deposit is then held as security. For business customers, residential or commercial mortgages are held as security.
Heritage charges a fee equal to 1% of the guarantee amount annually.
2. SUMMARY OF SIGNIFICANT ACCOUNTING POLICIES (continued)
CONSOLIDATED PARENT
2012$'000
2011$'000
2012$'000
2011$'000
3. INCOME
(a) Interest revenue
Deposits and investment securities 67,187 58,976 64,235 57,272
Loans and receivables 441,919 458,747 446,776 464,033
Interest rate swaps 1,971 722 19,132 16,606
Gain on fair value hedges 1,870 - 1,870 -
Gain on derivatives held at fair value 209 - 209 -
Add: Loan application direct revenue 1,973 2,120 1,973 2,120
Less: Commission and agent direct costs (11,164) (11,668) (11,164) (11,668)
Less: Securitisation establishment costs (900) (668) (900) (668)
Total interest revenue 503,065 508,229 522,131 527,695
(b) Other income
Fees and commissions 30,603 29,543 42,425 45,375
Dividends - other corporations 41 22 41 22
Income from property 428 419 428 419
Impairment losses on loans recovered 516 191 516 191
Realised gain on sale of Visa shares transferred from Other Comprehensive Income 2,464 - 2,464 -
Other revenue 1,452 1,836 1,452 1,836
Total other income 35,504 32,011 47,326 47,843
(c) Share of net profit of associate using the equity method 585 1,017 585 1,017
Notes to the Financial Statements (continued)

Financial Report 2011 / 12 • Heritage Bank Limited • Page 25
CONSOLIDATED PARENT
2012$'000
2011$'000
2012$'000
2011$'000
4. EXPENSES
(a) Interest expense
Deposits 263,780 243,052 267,864 247,741
Subordinated debt including fair value adjustment 8,392 8,138 8,392 8,138
Interest bearing notes 106,865 139,297 - -
Interest rate swaps 2,713 1,705 2,713 1,723
Loss on fair value hedges 254 255 254 255
Loss on derivatives held at fair value 259 - 259 -
Inter entity interest expense - - 135,143 171,500
Total interest expense 382,263 392,447 414,625 429,357
(b) Impairment losses on loans and receivables 2,092 2,040 2,092 2,040
(c) Employee benefits expense
Salaries, wages and allowances 43,196 40,353 43,196 40,353
Net defined benefit fund expense 348 309 348 309
Contribution to accumulation fund 4,009 3,794 4,009 3,794
Other employee costs 9,746 8,578 9,746 8,578
Total employee benefits expense 57,299 53,034 57,299 53,034
(d) Other expense
Depreciation
Plant and equipment 4,435 4,719 4,435 4,719
Buildings 584 835 584 835
5,019 5,554 5,019 5,554
Amortisation 872 994 872 994
Communication 4,118 5,107 4,118 5,107
Fees and commissions 2,515 2,538 2,515 2,538
Net loss on disposal of property, plant and equipment 70 142 70 142
7,575 8,781 7,575 8,781
Total other expense 12,594 14,335 12,594 14,335

Page 26 • Heritage Bank Limited • Financial Report 2011 / 12
CONSOLIDATED PARENT
2012$'000
2011$'000
2012$'000
2011$'000
5. INCOME TAX
(a) Income tax expense
The major components of income tax expense are:
Income statement
Current income tax
Current income tax charge 12,491 14,362 12,491 14,362
Under / (over) provision of previous year (28) (101) (28) (101)
Deferred income tax
Deferred income tax relating to temporary differences 622 (2,431) 622 (2,431)
Income tax expense 13,085 11,830 13,085 11,830
(b) Other comprehensive income
Cash flow hedges 2,181 (2,222) (350) 651
Available for sale asset reserve (83) 86 (83) 86
Income tax gain / (expense) on items of other comprehensive income 2,098 (2,136) (433) 737
(c) Reconciliation of income tax expense to prima facie tax payable
Profit from ordinary activities before tax 44,357 43,886 44,357 43,886
Tax at the tax rate of 30% 13,307 13,166 13,307 13,166
Tax effect of amounts which are not deductible (taxable) in calculating taxable income:
Depreciation of buildings 32 32 32 32
Dividend credits from share of associate (225) (824) (225) (824)
Defined benefit fund (68) (441) (68) (441)
Other items (net) 67 (2) 67 (2)
Under / (over) provision of the previous year - non deductible expense (28) (101) (28) (101)
Income tax expense 13,085 11,830 13,085 11,830
Notes to the Financial Statements (continued)
Financial Report 2011 / 12 • Heritage Bank Limited • Page 27
CONSOLIDATED PARENT
2012$'000
2011$'000
2012$'000
2011$'000
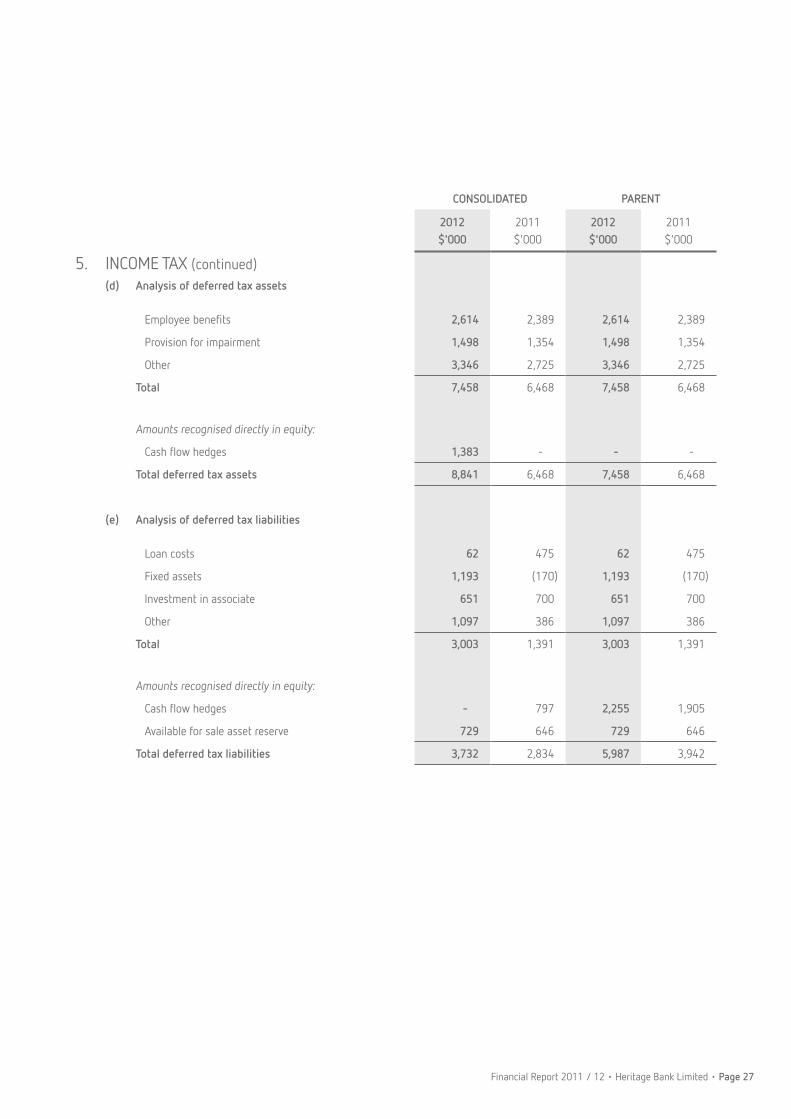
5. INCOME TAX (continued)(d) Analysis of deferred tax assets
Employee benefits 2,614 2,389 2,614 2,389
Provision for impairment 1,498 1,354 1,498 1,354
Other 3,346 2,725 3,346 2,725
Total 7,458 6,468 7,458 6,468
Amounts recognised directly in equity:
Cash flow hedges 1,383 - - -
Total deferred tax assets 8,841 6,468 7,458 6,468
(e) Analysis of deferred tax liabilities
Loan costs 62 475 62 475
Fixed assets 1,193 (170) 1,193 (170)
Investment in associate 651 700 651 700
Other 1,097 386 1,097 386
Total 3,003 1,391 3,003 1,391
Amounts recognised directly in equity:
Cash flow hedges - 797 2,255 1,905
Available for sale asset reserve 729 646 729 646
Total deferred tax liabilities 3,732 2,834 5,987 3,942

Page 28 • Heritage Bank Limited • Financial Report 2011 / 12
6. MATURITY ANALYSIS OF ASSETS AND LIABILITIESThe table below shows an analysis of assets and liabilities analysed according to when they are expected to be recovered or settled.
CONSOLIDATED
Less than 12 months
$'000
Over 12 months
$'000
Total
$'000As at 30 June 2012
Assets
Cash and cash equivalents 133,081 - 133,081
Receivables due from other financial institutions 277,809 - 277,809
Other receivables 48,959 - 48,959
Loans and receivables 563,425 6,074,532 6,637,957
Held to maturity financial assets 800,704 279,153 1,079,857
Investments accounted for using the equity method - 3,948 3,948
Available for sale financial investments 4,299 - 4,299
Derivatives - 3,180 3,180
Property, plant and equipment - 20,593 20,593
Other assets 1,407 102 1,509
Intangibles - 1,049 1,049
Deferred tax assets - 8,841 8,841
Total Assets 1,829,684 6,391,398 8,221,082
Liabilities
Deposits and borrowings 5,543,351 2,042,130 7,585,481
Accounts payable and other liabilities 220,507 - 220,507
Derivatives 1,000 34,810 35,810
Current tax liabilities 2,471 - 2,471
Deferred tax liabilities - 3,732 3,732
Provisions 4,364 5,677 10,041
Retirement benefit liability - 2,424 2,424
Subordinated debt 1,002 63,018 64,020
Total Liabilities 5,772,695 2,151,791 7,924,486
Net Assets (3,943,011) 4,239,607 296,596
Notes to the Financial Statements (continued)

Financial Report 2011 / 12 • Heritage Bank Limited • Page 29
6. MATURITY ANALYSIS OF ASSETS AND LIABILITIES (continued)
CONSOLIDATED
Less than 12 months
$'000
Over 12 months
$'000
Total
$'000As at 30 June 2011
Assets
Cash and cash equivalents 40,649 - 40,649
Receivables due from other financial institutions 398,956 - 398,956
Other receivables 57,096 - 57,096
Loans and receivables 556,613 5,929,682 6,486,295
Held to maturity financial assets 849,005 171,968 1,020,973
Investments accounted for using the equity method - 4,111 4,111
Available for sale financial investments - 5,421 5,421
Derivatives - 1,101 1,101
Property, plant and equipment - 21,029 21,029
Other assets 1,161 180 1,341
Intangibles - 1,408 1,408
Deferred tax assets - 6,468 6,468
Total Assets 1,903,480 6,141,368 8,044,848
Liabilities
Deposits and borrowings 4,747,904 2,652,649 7,400,553
Accounts payable and other liabilities 214,504 - 214,504
Derivatives 17,246 26,282 43,528
Current tax liabilities 4,075 - 4,075
Deferred tax liabilities - 2,834 2,834
Provisions 4,029 5,259 9,288
Retirement benefit liability - 849 849
Subordinated debt 1,149 96,047 97,196
Total Liabilities 4,988,907 2,783,920 7,772,827
Net Assets (3,085,427) 3,357,448 272,021
Page 30 • Heritage Bank Limited • Financial Report 2011 / 12
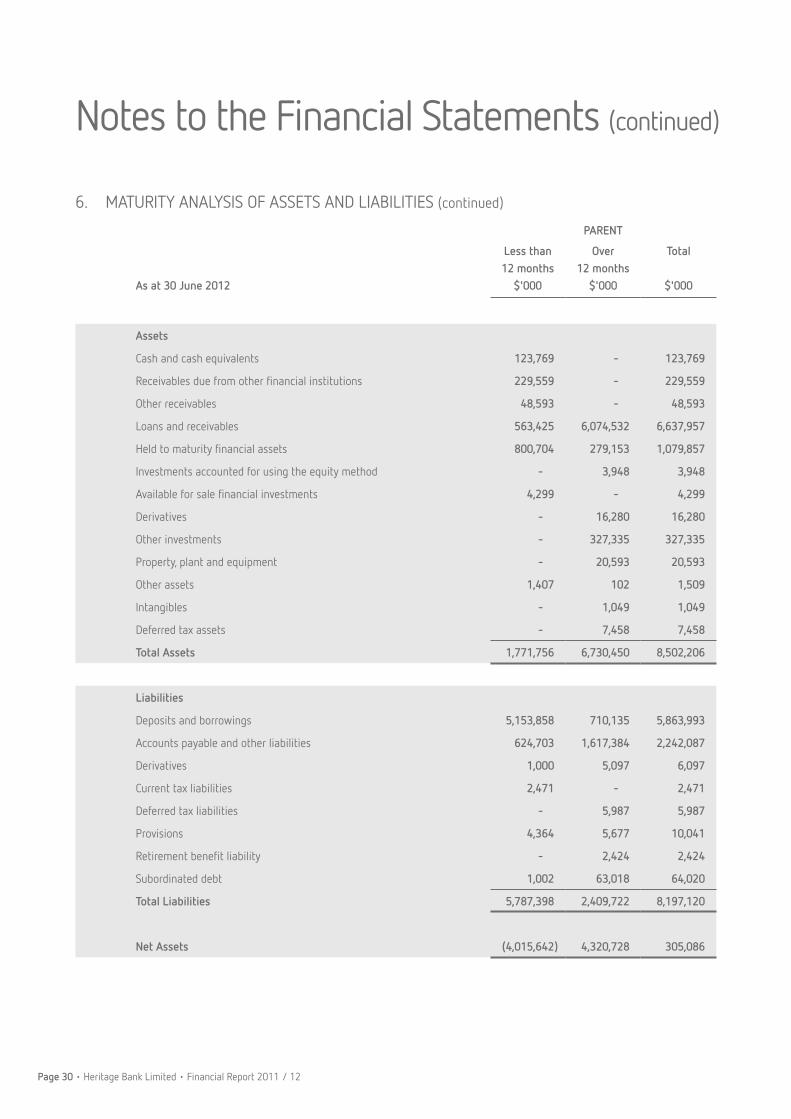
6. MATURITY ANALYSIS OF ASSETS AND LIABILITIES (continued)
PARENT
Less than 12 months
$'000
Over 12 months
$'000
Total
$'000As at 30 June 2012
Assets
Cash and cash equivalents 123,769 - 123,769
Receivables due from other financial institutions 229,559 - 229,559
Other receivables 48,593 - 48,593
Loans and receivables 563,425 6,074,532 6,637,957
Held to maturity financial assets 800,704 279,153 1,079,857
Investments accounted for using the equity method - 3,948 3,948
Available for sale financial investments 4,299 - 4,299
Derivatives - 16,280 16,280
Other investments - 327,335 327,335
Property, plant and equipment - 20,593 20,593
Other assets 1,407 102 1,509
Intangibles - 1,049 1,049
Deferred tax assets - 7,458 7,458
Total Assets 1,771,756 6,730,450 8,502,206
Liabilities
Deposits and borrowings 5,153,858 710,135 5,863,993
Accounts payable and other liabilities 624,703 1,617,384 2,242,087
Derivatives 1,000 5,097 6,097
Current tax liabilities 2,471 - 2,471
Deferred tax liabilities - 5,987 5,987
Provisions 4,364 5,677 10,041
Retirement benefit liability - 2,424 2,424
Subordinated debt 1,002 63,018 64,020
Total Liabilities 5,787,398 2,409,722 8,197,120
Net Assets (4,015,642) 4,320,728 305,086
Notes to the Financial Statements (continued)

Financial Report 2011 / 12 • Heritage Bank Limited • Page 31
6. MATURITY ANALYSIS OF ASSETS AND LIABILITIES (continued)
PARENT
Less than 12 months
$'000
Over 12 months
$'000
Total
$'000As at 30 June 2011
Assets
Cash and cash equivalents 37,919 - 37,919
Receivables due from other financial institutions 361,556 - 361,556
Other receivables 56,635 - 56,635
Loans and receivables 556,613 5,929,682 6,486,295
Held to maturity financial assets 849,005 171,968 1,020,973
Investments accounted for using the equity method - 4,111 4,111
Available for sale financial investments - 5,421 5,421
Derivatives 83 8,504 8,587
Other investments - 285,620 285,620
Property, plant and equipment - 21,029 21,029
Other assets 1,161 180 1,341
Intangibles - 1,408 1,408
Deferred tax assets - 6,468 6,468
Total Assets 1,862,972 6,434,391 8,297,363
Liabilities
Deposits and borrowings 4,624,928 707,788 5,332,716
Accounts payable and other liabilities 356,293 2,217,261 2,573,554
Derivatives - 1,136 1,136
Current tax liabilities 4,075 - 4,075
Deferred tax liabilities - 3,942 3,942
Provisions 4,029 5,259 9,288
Retirement benefit liability - 849 849
Subordinated debt 1,149 96,047 97,196
Total Liabilities 4,990,474 3,032,282 8,022,756
Net Assets (3,127,502) 3,402,109 274,607

Page 32 • Heritage Bank Limited • Financial Report 2011 / 12
CONSOLIDATED PARENT
2012$'000
2011$'000
2012$'000
2011$'000
7. CASH AND CASH EQUIVALENTS
Cash at bank and on hand 133,081 40,649 123,769 37,919
These are interest and non-interest bearing.
8. RECEIVABLES DUE FROM OTHER FINANCIAL INSTITUTIONS
Interest earning deposits (b) 253,437 375,207 205,187 337,807
Deposits with other authorised deposit-taking institutions (c)
24,372 23,749 24,372 23,749
277,809 398,956 229,559 361,556
(a) Impairment losses
No impairment losses have been recognised during the year on the receivables due from other financial institutions (2011 - nil).
(b) Interest earning deposits
The weighted average effective interest rate for the interest earning deposits is 3.84% (2011 - 5.20%).
(c) Deposits with other authorised deposit-taking institutions
The deposits with other authorised deposit-taking institutions do not have a specified maturity date. They are carried at amortised cost.
9. OTHER RECEIVABLES
Interest receivable 7,263 8,831 7,018 8,516
Securitisation deposits 33,621 45,645 33,621 45,645
Other 8,075 2,620 7,954 2,474
48,959 57,096 48,593 56,635
No impairment losses have been recognised during the year for other receivables (2011 - nil).
Notes to the Financial Statements (continued)

Financial Report 2011 / 12 • Heritage Bank Limited • Page 33
NOTE CONSOLIDATED PARENT
2012$'000
2011$'000
2012$'000
2011$'000
10. LOANS AND RECEIVABLES
Credit cards 76,055 77,495 76,055 77,495
Term loans 4,536,277 4,057,879 4,536,277 4,057,879
Securitised loans 2,021,730 2,348,296 2,021,730 2,348,296
Other 387 443 387 443
Related parties (a) 29 2,096 1,808 2,096 1,808
6,636,545 6,485,921 6,636,545 6,485,921
Provision for impairment (c) (4,993) (4,515) (4,993) (4,515)
Add: Securitisation establishment costs 2,354 998 2,354 998
Add: Commission and agent direct costs 4,051 3,891 4,051 3,891
Net loans and advances 6,637,957 6,486,295 6,637,957 6,486,295
(a) Aggregate amounts receivable from related parties
Key management personnel 2,096 1,808 2,096 1,808
Provision for impairment - - - -
2,096 1,808 2,096 1,808
(b) Concentration of risk
The loan portfolio of the Group does not include any loan or groups of related loans which represent 10% or more of capital.

Page 34 • Heritage Bank Limited • Financial Report 2011 / 12
Consolidated 2011
Specific provision
Opening balance 290 539 176 1,005
Impairment losses provided for / (reversed) during the year 238 261 35 534
Closing balance 528 800 211 1,539
Collective provision
Opening balance 1,201 1,490 286 2,977
Impairment losses provided for / (reversed) during the year 170 (97) (74) (1)
Writeback of provision to members funds - - - -
Closing balance 1,371 1,393 212 2,976
Total provision for impairment 1,899 2,193 423 4,515
Charges to operating profit before tax for impairment losses on loans and receivables comprises:
Specific provision 238 261 35 534
Collective provision 170 (97) (74) (1)
Impairment losses recognised directly 1,169 307 31 1,507
1,577 471 (8) 2,040
10. LOANS AND RECEIVABLES (continued)
(c) Provision for impairmentCredit Cards
Term Loans
Other Total
$'000 $'000 $'000 $'000
Consolidated 2012
Specific provision
Opening balance 528 800 211 1,539
Impairment losses provided for / (reversed) during the year (17) 13 (60) (64)
Closing balance 511 813 151 1,475
Collective provision
Opening balance 1,371 1,393 212 2,976
Impairment losses provided for / (reversed) during the year 103 367 72 542
Writeback of provision to members funds - - - -
Closing balance 1,474 1,760 284 3,518
Total provision for impairment 1,985 2,573 435 4,993
Charges to operating profit before tax for impairment losses on loans and receivables comprises:
Specific provision (17) 13 (60) (64)
Collective provision 103 367 72 542
Impairment losses recognised directly 1,065 551 (2) 1,614
1,151 931 10 2,092
Notes to the Financial Statements (continued)
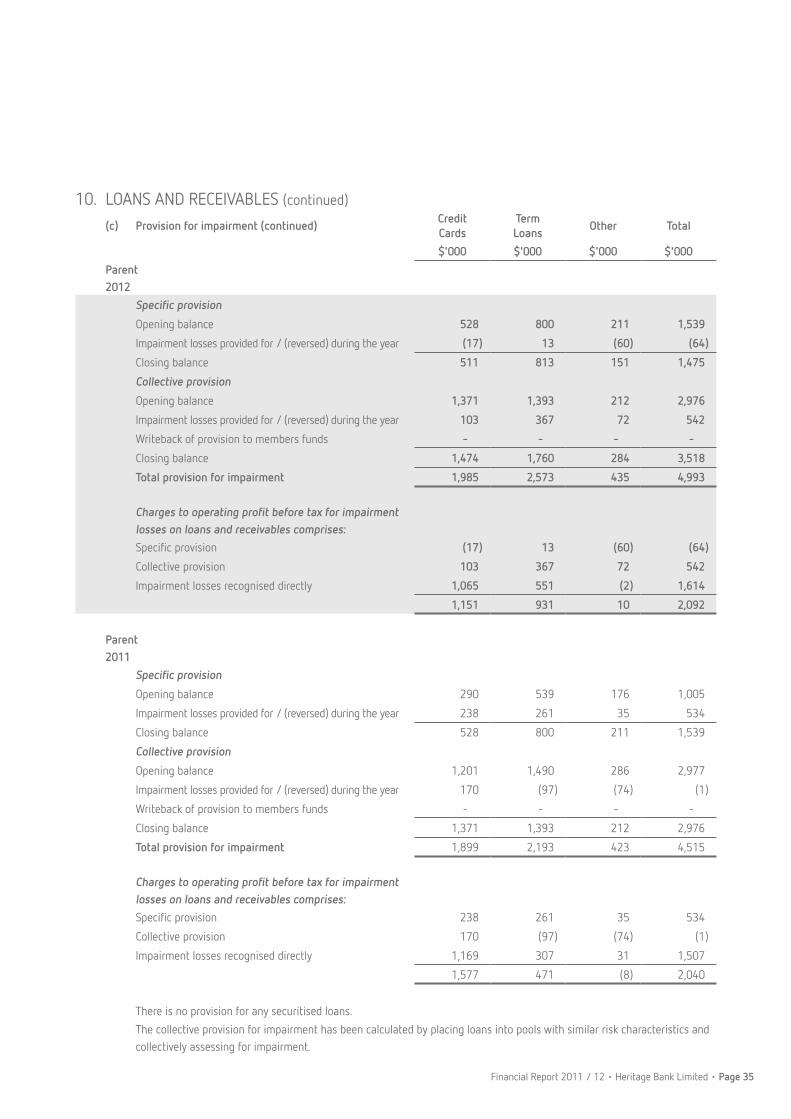
Financial Report 2011 / 12 • Heritage Bank Limited • Page 35
10. LOANS AND RECEIVABLES (continued)
(c) Provision for impairment (continued)Credit Cards
Term Loans
Other Total
$'000 $'000 $'000 $'000
Parent 2012
Specific provision
Opening balance 528 800 211 1,539
Impairment losses provided for / (reversed) during the year (17) 13 (60) (64)
Closing balance 511 813 151 1,475
Collective provision
Opening balance 1,371 1,393 212 2,976
Impairment losses provided for / (reversed) during the year 103 367 72 542
Writeback of provision to members funds - - - -
Closing balance 1,474 1,760 284 3,518
Total provision for impairment 1,985 2,573 435 4,993
Charges to operating profit before tax for impairment losses on loans and receivables comprises:Specific provision (17) 13 (60) (64)
Collective provision 103 367 72 542
Impairment losses recognised directly 1,065 551 (2) 1,614
1,151 931 10 2,092
Parent 2011
Specific provision
Opening balance 290 539 176 1,005
Impairment losses provided for / (reversed) during the year 238 261 35 534
Closing balance 528 800 211 1,539
Collective provision
Opening balance 1,201 1,490 286 2,977
Impairment losses provided for / (reversed) during the year 170 (97) (74) (1)
Writeback of provision to members funds - - - -
Closing balance 1,371 1,393 212 2,976
Total provision for impairment 1,899 2,193 423 4,515
Charges to operating profit before tax for impairment losses on loans and receivables comprises:Specific provision 238 261 35 534
Collective provision 170 (97) (74) (1)
Impairment losses recognised directly 1,169 307 31 1,507
1,577 471 (8) 2,040
There is no provision for any securitised loans.
The collective provision for impairment has been calculated by placing loans into pools with similar risk characteristics and collectively assessing for impairment.
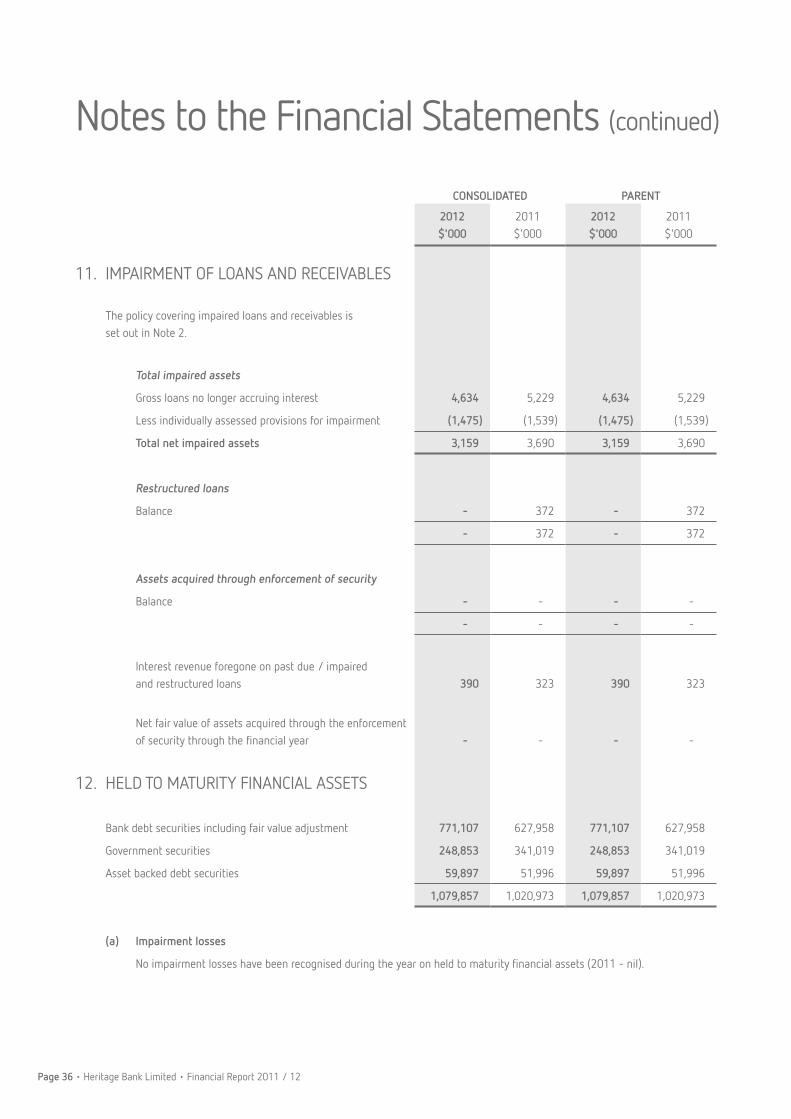
Page 36 • Heritage Bank Limited • Financial Report 2011 / 12
CONSOLIDATED PARENT
2012$'000
2011$'000
2012$'000
2011$'000
11. IMPAIRMENT OF LOANS AND RECEIVABLES
The policy covering impaired loans and receivables is set out in Note 2.
Total impaired assets
Gross loans no longer accruing interest 4,634 5,229 4,634 5,229
Less individually assessed provisions for impairment (1,475) (1,539) (1,475) (1,539)
Total net impaired assets 3,159 3,690 3,159 3,690
Restructured loans
Balance - 372 - 372
- 372 - 372
Assets acquired through enforcement of security
Balance - - - -
- - - -
Interest revenue foregone on past due / impaired and restructured loans 390 323 390 323
Net fair value of assets acquired through the enforcement of security through the financial year - - - -
12. HELD TO MATURITY FINANCIAL ASSETS
Bank debt securities including fair value adjustment 771,107 627,958 771,107 627,958
Government securities 248,853 341,019 248,853 341,019
Asset backed debt securities 59,897 51,996 59,897 51,996
1,079,857 1,020,973 1,079,857 1,020,973
(a) Impairment losses
No impairment losses have been recognised during the year on held to maturity financial assets (2011 - nil).
Notes to the Financial Statements (continued)
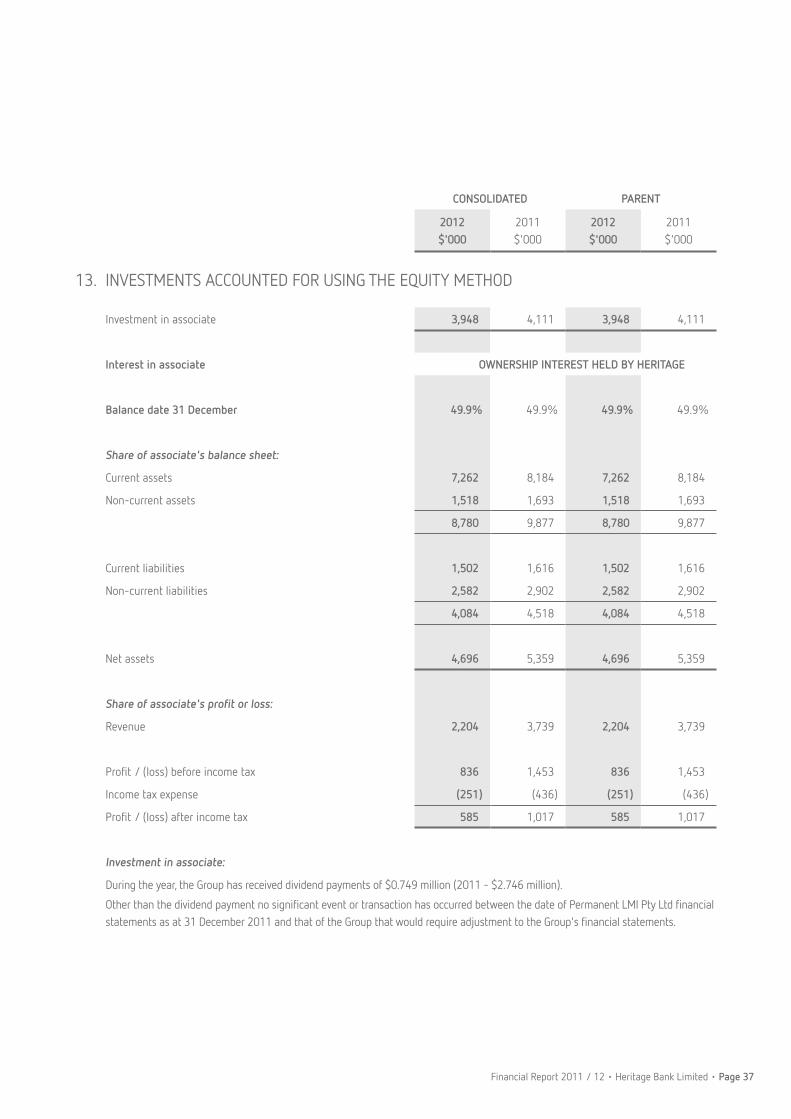
Financial Report 2011 / 12 • Heritage Bank Limited • Page 37
CONSOLIDATED PARENT
2012$'000
2011$'000
2012$'000
2011$'000
13. INVESTMENTS ACCOUNTED FOR USING THE EQUITY METHOD
Investment in associate 3,948 4,111 3,948 4,111
Interest in associate OWNERSHIP INTEREST HELD BY HERITAGE
Balance date 31 December 49.9% 49.9% 49.9% 49.9%
Share of associate's balance sheet:
Current assets 7,262 8,184 7,262 8,184
Non-current assets 1,518 1,693 1,518 1,693
8,780 9,877 8,780 9,877
Current liabilities 1,502 1,616 1,502 1,616
Non-current liabilities 2,582 2,902 2,582 2,902
4,084 4,518 4,084 4,518
Net assets 4,696 5,359 4,696 5,359
Share of associate's profit or loss:
Revenue 2,204 3,739 2,204 3,739
Profit / (loss) before income tax 836 1,453 836 1,453
Income tax expense (251) (436) (251) (436)
Profit / (loss) after income tax 585 1,017 585 1,017
Investment in associate:
During the year, the Group has received dividend payments of $0.749 million (2011 - $2.746 million).
Other than the dividend payment no significant event or transaction has occurred between the date of Permanent LMI Pty Ltd financial statements as at 31 December 2011 and that of the Group that would require adjustment to the Group's financial statements.

Page 38 • Heritage Bank Limited • Financial Report 2011 / 12
CONSOLIDATED PARENT
2012$'000
2011$'000
2012$'000
2011$'000
14. AVAILABLE FOR SALE FINANCIAL INVESTMENTS
Investments
Visa shares (a) 3,821 4,943 3,821 4,943
Unlisted shares (b) 257 257 257 257
Other (c) 221 221 221 221
4,299 5,421 4,299 5,421
(a) Visa shares
On 27 June 2012 the Group sold 31,503 Visa shares resulting in a realised gain of $2.464 million that was transferred from Other Comprehensive Income to the Income Statement.
The remaining Visa shares relate to 31,500 Class C (Series 1) common stock.
The Visa shares have been measured at fair value using the $US share price converted to Australian dollars at the applicable exchange rate. Any changes to fair value is reflected in the available for sale asset reserve.
(b) Unlisted shares
Unlisted shares that do not have a quoted market price in an active market and whose fair value cannot be reliably measured, are measured at cost. These are shares in Australian Settlements Limited.
Also included in unlisted shares are shares in HBS Superannuation Nominees Pty Limited. HBS Superannuation Nominees Pty Limited previously acted solely in a fiduciary capacity for the members of the superannuation fund for which it was trustee, and therefore was not controlled by Heritage Bank Limited. The company is no longer a trustee for the superannuation fund and is now a non-operating company.
(c) Other
The other category comprises the Australian Settlements Limited subordinated debt, which is measured at cost as the fair value is unable to be measured reliably.
Notes to the Financial Statements (continued)

Financial Report 2011 / 12 • Heritage Bank Limited • Page 39
15. FINANCIAL INSTRUMENTS AND RISK MANAGEMENTThe Board and Management of Heritage are responsible for implementing a risk management process to limit risks to prudent levels. The Finance Committee and Audit & Compliance Committee have been established by the Board to develop and monitor risk management policies within their specific areas.
Heritage’s risk management policy and supporting framework are in place to enable the risks faced by Heritage to be identified and analysed, evaluated, and monitored over time. Risk management policies are reviewed regularly to reflect changes from sources both internal and external to Heritage.
The Audit & Compliance Committee is responsible for monitoring compliance with Heritage’s risk management policies and procedures, and reviewing the adequacy of the risk management framework. The Audit & Compliance Committee is assisted in this role by Internal Audit. Internal Audit perform reviews of risk management processes and controls, reporting the results to the Audit & Compliance Committee.
Heritage has exposure to the following risks from its use of financial instruments:
Market risk
Liquidity risk
Credit risk
Operational risk.
(a) Market risk
Market risk is the risk that changes in market prices, such as interest rates and exchange rates, will affect Heritage’s income or the value of its holdings of financial instruments. The objective of market risk is to manage and control market risk exposures within acceptable parameters, while optimising the return on risk.
Management of Market Risks
Heritage does not undertake trading activities and all exposure to market risk is in its non-trading portfolio.
Overall authority for market risk is vested in the Board and delegated to the Finance Committee. Treasury is responsible for the development of detailed risk management policies (subject to review by Finance Committee and approval by Board) and for the day-to-day review of their implementation.
Interest Rate Risk
Interest rate risk is the potential for loss of earnings to Heritage due to adverse movements in interest rates.
Heritage utilises two key risk management strategies; a pricing committee facilitates direct (pricing) intervention strategies and the Finance Committee facilitates indirect (hedging) intervention strategies.
Forward Rate Agreements, Interest Rate Swaps, Options (including Interest Rate Caps and Floors), Interest Rate Futures and Options on Interest Rate Futures are all authorised hedging instruments but are subject to approval by the Finance Committee where they have not been utilised within the previous 12 months.
Interest rate risk is managed principally through monitoring interest rate gaps and by having pre-approved limits for repricing bands (set with reference to prudential capital base). The Finance Committee is the monitoring body for compliance with these limits and is assisted by the monitoring activities implemented by Treasury in its day-to-day operations.
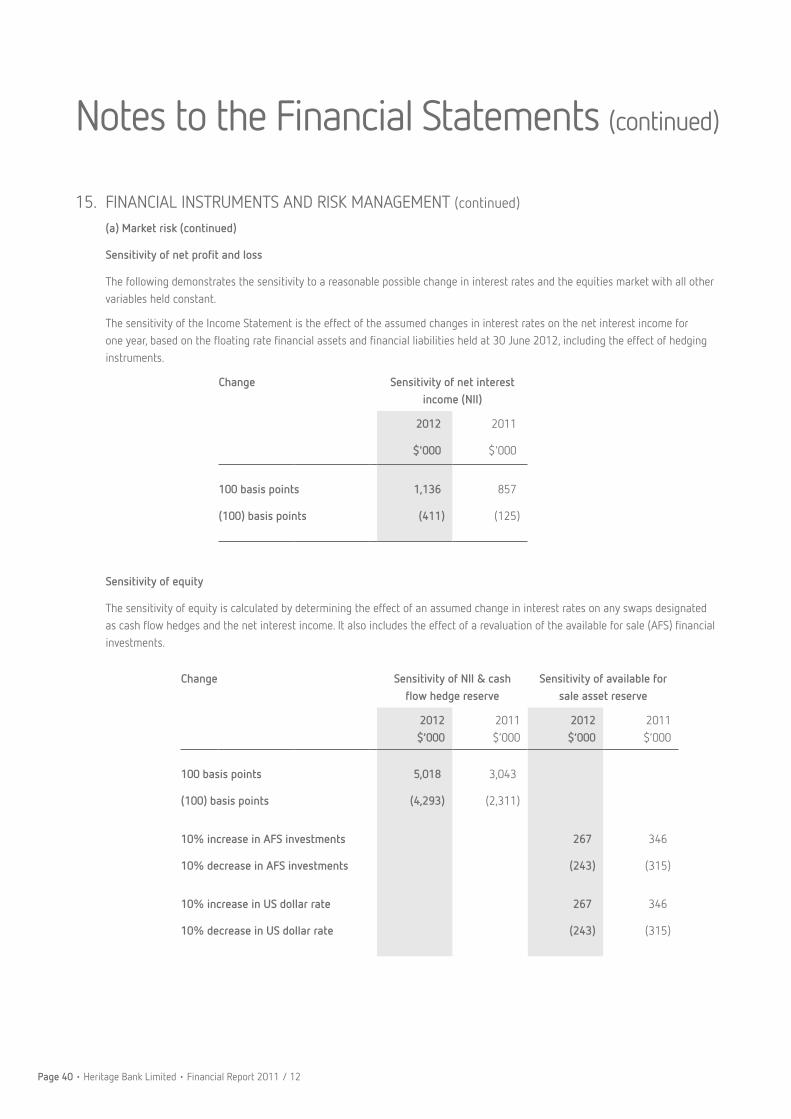
Page 40 • Heritage Bank Limited • Financial Report 2011 / 12
15. FINANCIAL INSTRUMENTS AND RISK MANAGEMENT (continued)
(a) Market risk (continued)
Sensitivity of net profit and loss
The following demonstrates the sensitivity to a reasonable possible change in interest rates and the equities market with all other variables held constant.
The sensitivity of the Income Statement is the effect of the assumed changes in interest rates on the net interest income for one year, based on the floating rate financial assets and financial liabilities held at 30 June 2012, including the effect of hedging instruments.
Change Sensitivity of net interest income (NII)
2012 2011
$'000 $'000
100 basis points 1,136 857
(100) basis points (411) (125)
Sensitivity of equity
The sensitivity of equity is calculated by determining the effect of an assumed change in interest rates on any swaps designated as cash flow hedges and the net interest income. It also includes the effect of a revaluation of the available for sale (AFS) financial investments.
Change Sensitivity of NII & cash flow hedge reserve
Sensitivity of available for sale asset reserve
2012 $’000
2011 $’000
2012 $’000
2011 $’000
100 basis points 5,018 3,043
(100) basis points (4,293) (2,311)
10% increase in AFS investments 267 346
10% decrease in AFS investments (243) (315)
10% increase in US dollar rate 267 346
10% decrease in US dollar rate (243) (315)
Notes to the Financial Statements (continued)
Financial Report 2011 / 12 • Heritage Bank Limited • Page 41
15. FINANCIAL INSTRUMENTS AND RISK MANAGEMENT (continued)
(a) Market risk (continued)
Currency Risk
Other than the Visa shares denominated in US dollars, Heritage is not exposed to any significant currency risk.
One SPV has Euro denominated notes paying floating Eurobor. In order to remove the foreign exchange risk the SPV has transacted a pay Australian dollar, receive Eurobor cross currency swap. The receive Eurobor leg of the swap perfectly matches the Eurobor note cashflows, effectively converting the floating Eurobor debt to floating Australian dollar debt. As such there is no exposure to currency risk.
The Group maintains nine foreign currency accounts (US, GBP, EURO, NZ, HKD, SGD, BAHT, CAD, JPY) which are used as float accounts to meet foreign currency card load obligations. The Income Statement exposure relating to these accounts is limited to any unrealised and realised gains and losses as a result of converting the fee revenue earned on the floats from the overseas denominated currencies to Australian dollars.
Prepayment Risk
Prepayment risk is the risk that Heritage will incur a financial loss because its customers and counterparties repay or request repayment earlier or later than expected. Heritage manages the risk by monitoring the prepayment rate on the loans and taking the rate into account when adopting appropriate hedging strategies.
(b) Liquidity risk
Liquidity risk is the inability to access sufficient funds, both anticipated and unforseen that may lead to Heritage being unable to meet its cash flow and funding obligations as they arise.
Management of Liquidity Risk
Heritage’s approach to managing liquidity is to ensure, as much as possible, that it will always have sufficient liquidity to meet its liabilities when due, under both normal or stressed conditions, without incurring unacceptable losses or risking damage to Heritage’s reputation.
Heritage has a Liquidity Management Policy that is supervised by the Chief Executive Officer and administered by the Chief Financial Officer, the Manager of Accounting Services and the Chief Treasury and Business Strategy Officer. To ensure liquidity requirements are met, Heritage maintains minimum liquidity holdings relative to its balance sheet liabilities including irrevocable commitments but excluding eligible capital. The minimum liquidity holdings comprise high quality liquid assets held within a Liquid Assets Portfolio.
The daily liquidity position is monitored and regular liquidity stress testing is conducted under a variety of scenarios covering both normal and more severe market conditions. A daily report covers the daily liquidity position, liquidity forecasts are generated weekly and summary reports are provided to Finance Committee monthly.
Analysis of financial liabilities by remaining contractual maturities
The tables below summarises the maturity profile of the Group's financial liabilities, commitments and contingencies. This is based on contractual undiscounted cash flows and will not agree directly to the amounts recognised in the Statement of Financial Position. The derivatives have been calculated using existing contractual terms and rates prevailing at 30 June 2012. The amount will differ accordingly from the Statement of Financial Position.
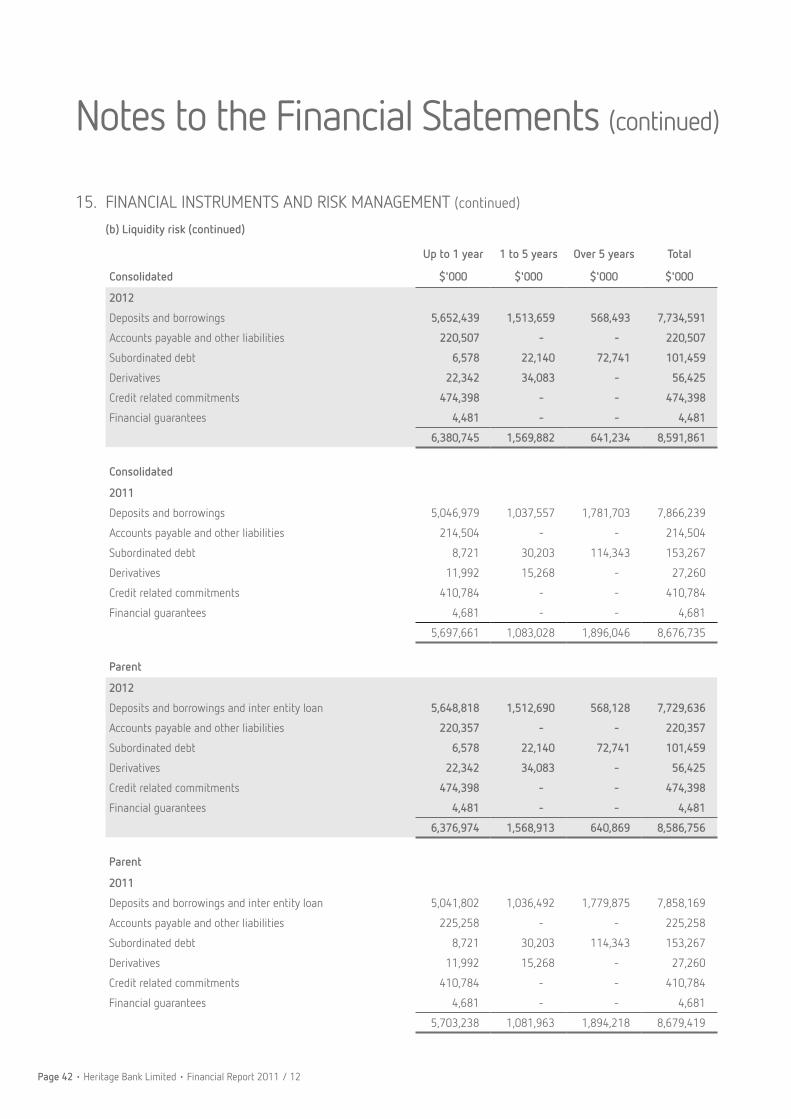
Page 42 • Heritage Bank Limited • Financial Report 2011 / 12
15. FINANCIAL INSTRUMENTS AND RISK MANAGEMENT (continued)
(b) Liquidity risk (continued)
Up to 1 year 1 to 5 years Over 5 years Total
Consolidated $'000 $'000 $'000 $'000
2012
Deposits and borrowings 5,652,439 1,513,659 568,493 7,734,591
Accounts payable and other liabilities 220,507 - - 220,507
Subordinated debt 6,578 22,140 72,741 101,459
Derivatives 22,342 34,083 - 56,425
Credit related commitments 474,398 - - 474,398
Financial guarantees 4,481 - - 4,481
6,380,745 1,569,882 641,234 8,591,861
Consolidated
2011
Deposits and borrowings 5,046,979 1,037,557 1,781,703 7,866,239
Accounts payable and other liabilities 214,504 - - 214,504
Subordinated debt 8,721 30,203 114,343 153,267
Derivatives 11,992 15,268 - 27,260
Credit related commitments 410,784 - - 410,784
Financial guarantees 4,681 - - 4,681
5,697,661 1,083,028 1,896,046 8,676,735
Parent
2012
Deposits and borrowings and inter entity loan 5,648,818 1,512,690 568,128 7,729,636
Accounts payable and other liabilities 220,357 - - 220,357
Subordinated debt 6,578 22,140 72,741 101,459
Derivatives 22,342 34,083 - 56,425
Credit related commitments 474,398 - - 474,398
Financial guarantees 4,481 - - 4,481
6,376,974 1,568,913 640,869 8,586,756
Parent
2011
Deposits and borrowings and inter entity loan 5,041,802 1,036,492 1,779,875 7,858,169
Accounts payable and other liabilities 225,258 - - 225,258
Subordinated debt 8,721 30,203 114,343 153,267
Derivatives 11,992 15,268 - 27,260
Credit related commitments 410,784 - - 410,784
Financial guarantees 4,681 - - 4,681
5,703,238 1,081,963 1,894,218 8,679,419
Notes to the Financial Statements (continued)

Financial Report 2011 / 12 • Heritage Bank Limited • Page 43
15. FINANCIAL INSTRUMENTS AND RISK MANAGEMENT (continued)(c) Credit risk
Credit risk refers to the risk that a counterparty will default on its contractual obligations resulting in financial loss to the entity. The management of credit risk is supervised by the Chief Executive Officer and administered by the Company Secretary for loans and receivables. For cash, liquid investments and derivatives these are administered by the Chief Financial Officer and the Chief Treasury and Business Strategy Officer. Management of credit risk for loans and receivables includes:
· Formulating credit policies including credit assessment, documentary and legal procedures and compliance with regulatory and statutory requirements.
· Establishing the authorisation structure for the approval and renewal of credit facilities. Authorisation limits are allocated to branch managers and loan assessment officers.
· Reviewing and assessing credit risk. The Chief Executive Officer, Company Secretary together with the credit committee assesses credit exposures in excess of designated limits, prior to facilities being committed to customers.
The table below shows the maximum exposure to credit risk:
Gross Maximum Exposure
CONSOLIDATED PARENT
2012$'000
2011$'000
2012$'000
2011$'000
Cash and cash equivalents 133,081 40,649 123,769 37,919
Receivables due from other financial institutions 277,809 398,956 229,559 361,556
Other receivables 48,959 57,096 48,593 56,635
Loans and receivables 6,637,957 6,486,295 6,637,957 6,486,295
Held to maturity financial assets 1,079,857 1,020,973 1,079,857 1,020,973
Available for sale financial investments 4,299 5,421 4,299 5,421
Other investments - - 327,335 285,620
8,181,962 8,009,390 8,451,369 8,254,419
Financial guarantees 4,481 4,681 4,481 4,681
Credit related commitments 474,398 410,784 474,398 410,784
478,879 415,465 478,879 415,465
8,660,841 8,424,855 8,930,248 8,669,884
Counterparty Risk
As part of Heritage's investment policy individual counterparties need to have the appropriate investment grading and are monitored in respect to their limits and credit rating. The appropriate credit rating and limit levels ensures Heritage is not exposed to any significant individual counterparty exposure.

Page 44 • Heritage Bank Limited • Financial Report 2011 / 12
15. FINANCIAL INSTRUMENTS AND RISK MANAGEMENT (continued)(c) Credit risk (continued)
CONSOLIDATED PARENT
2012$'000
2011$'000
2012$'000
2011$'000
Credit exposure by credit rating
The following table outlines the credit ratings of the Group's investments with counterparties:
AAA to AA- 780,695 1,003,232 732,445 965,832
A+ to A- 345,076 133,238 345,076 133,238
BBB+ to BBB- 176,116 214,624 176,116 214,624
Unrated 55,779 68,835 55,779 68,835
1,357,666 1,419,929 1,309,416 1,382,529
Credit risk of the loan portfolio
Heritage lending is made up of predominantly residential properties. A credit assessment is completed for each loan which includes information about applicant's cost of living, capacity to repay, previous credit conduct and value of security. The majority of Heritage's loan portfolio is secured with mortgages over relevant properties and as a result manages credit risk by using the loan to value ratio (LVR). The LVR is calculated by dividing the total of the loan by the lower of Heritage approved valuation amount or the purchase price. The average of the Group's LVRs (by value) are as follows:
CONSOLIDATED PARENT
LVR 2012 2011 2012 2011
% % % %
0-60% 38 38 38 38
61-80% 45 45 45 45
81-90% 14 14 14 14
91-100% 3 3 3 3
> 100% - - - -
100 100 100 100
Security
For mortgage lending the registered mortgage is held as security. Where the loan to valuation ratio is greater than 80% mortgage insurance is required.
Past due but not impaired loans
These relate to loans where the contractual interest or principal payments are past due but the Group believes that impairment is not appropriate on the basis of the level of security / collateral available and / or the stage of collection of amounts owed to the Group.
Notes to the Financial Statements (continued)

Financial Report 2011 / 12 • Heritage Bank Limited • Page 45
15. FINANCIAL INSTRUMENTS AND RISK MANAGEMENT (continued)(c) Credit risk (continued)
Less than 30 days
31 to 60 days
61 to 90 days
More than 90 days
Total
($'000) ($'000) ($'000) ($'000) ($'000)
Past due items by individual facility as at 30 June are:
2012
Residential owner occupied 201 42 72 295 610
Residential investor 83 17 30 121 251
Credit card 96 - 48 86 230
Other personal 191 - 169 293 653
571 59 319 795 1,744
2011
Residential owner occupied 341 28 20 213 602
Residential investor 140 11 8 88 247
Credit card 96 - 41 59 196
Other personal 185 - 192 325 702
762 39 261 685 1,747
The total security relating to the above past due items greater than 90 days is $12,472,000 (2011 - $9,497,000).
Impaired loans
Impaired loans are loans for which the Group determines that it is probable that it will be unable to collect all principal and interest due according to the contractual terms of the loan.
Allowances for impairment
The Group establishes an allowance for impairment losses that represents its estimate of incurred losses in its loan portfolios. The main components of this allowance are a specific loss component that relates to individually significant exposures, including a prescribed provision in accordance with the Australian Prudential Regulation Authority’s (APRA) methodology, and a collective provision. The collective assessment takes account of impairment that is likely to be present in the portfolio even though there is not yet objective evidence of the impairment in an individual assessment. A model is maintained to identify the inherent risk of various portfolios. The model is used in determining whether impairment provisions may be required.
Write off policy
The Group writes off a loan when it is determined that the loan is uncollectible. This determination is reached after considering information such as the occurrence of significant changes in the borrower’s financial position such that the borrower can no longer pay the obligation or that proceeds from collateral will not be sufficient to pay back the entire exposure.

Page 46 • Heritage Bank Limited • Financial Report 2011 / 12
15. FINANCIAL INSTRUMENTS AND RISK MANAGEMENT (continued)(c) Credit risk (continued)
Concentrations of credit risk
The Group minimises concentrations of credit risk by undertaking transactions with a large number of customers within the specified category. However, the majority of customers are concentrated in Queensland.
Concentrations of credit risk on loans arise in the following categories:
Maximum credit risk exposure* for each concentration
CONSOLIDATED
Percentage of total loans receivable (%)
$'000
Geographic 2012 2011 2012 2011
Queensland residents 68% 67% 4,491,559 4,331,123
Other 32% 33% 2,139,993 2,150,283
100% 100% ** 6,631,552 ** 6,481,406
Maximum credit risk exposure* for each concentration
PARENT
Percentage of total loans receivable (%)
$'000
Geographic 2012 2011 2012 2011
Queensland residents 68% 67% 4,491,559 4,331,123
Other 32% 33% 2,139,993 2,150,283
100% 100% ** 6,631,552 ** 6,481,406
* The maximum credit risk exposure does not take into account the value of any collateral or other security held, in the event other entities/parties fail to perform their obligations under the financial instruments in question.
** The total loans and receivables figure differs from that presented in the Statement of Financial Position in Note 10 by the securitisation establishment costs of $2.354 million (2011 - $0.998 million) and the broker commission of $4.051 million (2011 - $3.891 million), as the securitisation establishment costs and broker commission are reclassifications, as a result of the effective interest rate method and are not applicable for the analysis of the concentration of credit risk.
Notes to the Financial Statements (continued)

Financial Report 2011 / 12 • Heritage Bank Limited • Page 47
15. FINANCIAL INSTRUMENTS AND RISK MANAGEMENT (continued)(d) Fair Values
The net fair value of financial assets and financial liabilities are categorised under a three level hierarchy, reflecting the availability of observable market inputs when estimating the fair value. The three levels are:Level 1: Valued by reference to quoted prices in active markets for identical assets and liabilities. These quoted prices
represent actual and regularly occurring market transactions on an arm's length basis.Level 2: Valued using inputs other than quoted prices included within level 1 that are observable for the asset or liability,
either directly (as prices) or indirectly (derived from prices) including:(a) quoted prices in active markets for similar assets or liabilities,
(b) quoted prices in markets in which there are few transactions for identical or similar assets or liabilities, and
(c) other inputs that are not quoted prices but are observable for the asset or liability, for example interest rate yield curves.
Level 3: Valued in whole or in part using valuation techniques or models that are based on unobservable inputs that are neither supported by prices from observable current market transactions in the same instrument nor based on available market data.
The following table shows an analysis of financial instruments recorded at fair value by each level of the fair value hierarchy:
Level 1 Level 2 Level 3Total Fair
Value$'000 $'000 $'000 $'000
Consolidated
2012 Assets
Available for sale financial investments 3,821 - - 3,821
Derivatives - 3,180 - 3,180
3,821 3,180 - 7,001
Liabilities
Subordinated debt 53,018 - - 53,018
Derivatives - 35,810 35,810
53,018 35,810 - 88,828
2011 Assets
Available for sale financial investments 4,943 - - 4,943
Derivatives - 1,101 - 1,101
4,943 1,101 - 6,044
Liabilities
Subordinated debt 51,047 - - 51,047
Derivatives - 43,528 - 43,528
51,047 43,528 - 94,575
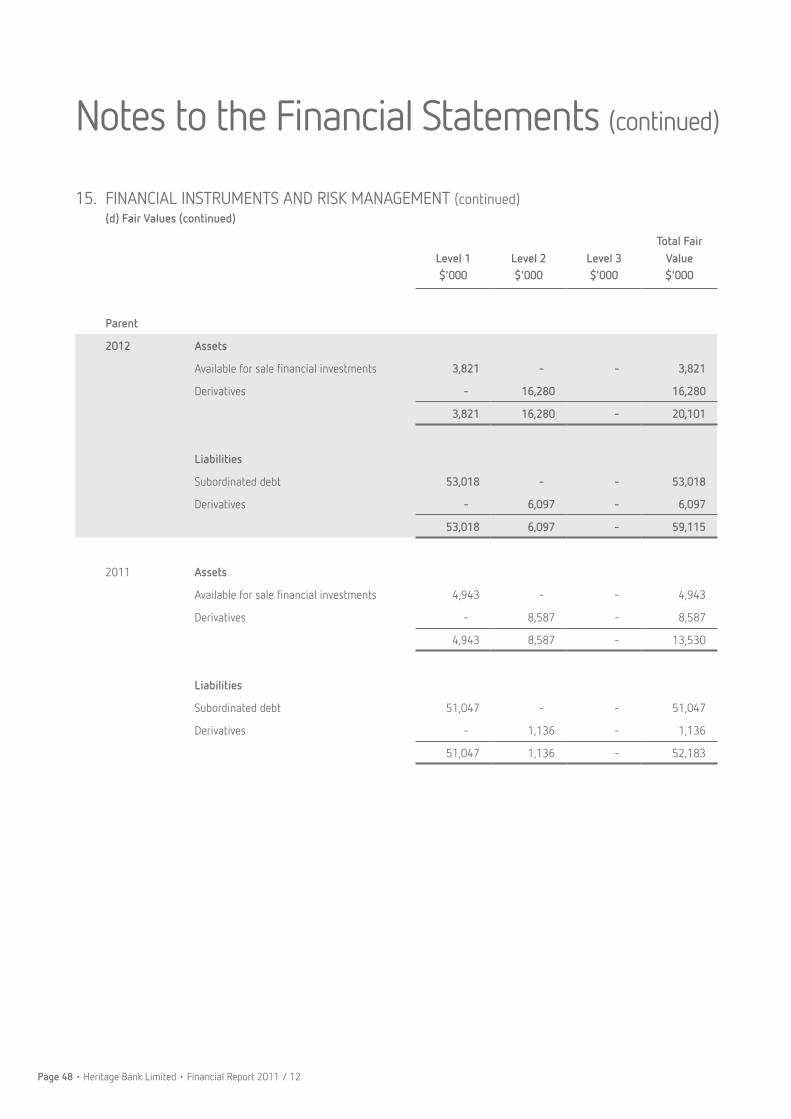
Page 48 • Heritage Bank Limited • Financial Report 2011 / 12
15. FINANCIAL INSTRUMENTS AND RISK MANAGEMENT (continued)(d) Fair Values (continued)
Level 1 Level 2 Level 3Total Fair
Value$'000 $'000 $'000 $'000
Parent
2012 Assets
Available for sale financial investments 3,821 - - 3,821
Derivatives - 16,280 16,280
3,821 16,280 - 20,101
Liabilities
Subordinated debt 53,018 - - 53,018
Derivatives - 6,097 - 6,097
53,018 6,097 - 59,115
2011 Assets
Available for sale financial investments 4,943 - - 4,943
Derivatives - 8,587 - 8,587
4,943 8,587 - 13,530
Liabilities
Subordinated debt 51,047 - - 51,047
Derivatives - 1,136 - 1,136
51,047 1,136 - 52,183
Notes to the Financial Statements (continued)

Financial Report 2011 / 12 • Heritage Bank Limited • Page 49
15. FINANCIAL INSTRUMENTS AND RISK MANAGEMENT (continued)(d) Fair Values (continued)
The following table summarises the carrying amounts and fair values (inclusive of accrued interest), of those financial assets and financial liabilities not presented at their fair value on the Group's Statement of Financial Position.
Carrying amount per Statement of Financial
PositionAggregate Net Fair Value
2012$'000
2011$'000
2012$'000
2011$'000
Consolidated
Financial Assets
Held to maturity financial assets 1,079,857 1,020,973 1,084,704 1,034,116
Loans and receivables 6,637,957 6,486,295 6,668,750 6,474,244
7,717,814 7,507,268 7,753,454 7,508,360
Financial Liabilities
Term debt 902,640 704,373 908,544 714,076
Interest bearing notes 1,716,534 2,059,767 1,793,031 2,155,931
Subordinated debt 10,000 45,000 10,042 45,248
2,629,174 2,809,140 2,711,617 2,915,255
Parent
Financial Assets
Held to maturity financial assets 1,079,857 1,020,973 1,084,704 1,034,116
Loans and receivables 6,637,957 6,486,295 6,668,750 6,474,244
7,717,814 7,507,268 7,753,454 7,508,360
Financial Liabilities
Term debt 902,640 704,373 908,544 714,076
Inter entity loan 2,021,730 2,348,296 2,030,922 2,346,896
Subordinated debt 10,000 45,000 10,042 45,248
2,934,370 3,097,669 2,949,508 3,106,220

Page 50 • Heritage Bank Limited • Financial Report 2011 / 12
15. FINANCIAL INSTRUMENTS AND RISK MANAGEMENT (continued)(d) Fair Values (continued)
Financial Assets
Cash and cash equivalents and receivables due from other financial institutions
The carrying amounts approximate fair value because of their short term to maturity or are receivable on demand.
Other receivables, accounts payable and other liabilities
The carrying amounts approximate fair value as they are short term in nature.
Held to maturity financial assets
For financial instruments traded in organised financial markets, fair value is the current quoted market price for an asset or offer price for a liability, adjusted for transaction costs necessary to realise the asset.
Loans and receivables
The fair value of loans are estimated using discounted cash flow analysis based on current incremental lending rates for similar types of lending arrangements.
Available for sale financial investments
The fair value is determined with reference to the actual quoted market price at reporting date.
Financial Liabilities
Deposits and borrowings
The carrying amount approximates fair value because 87% (2011 - 81%) of deposits have a short date to maturity. For longer term deposits, their current interest rates are similar to market rates.
Interest bearing notes
The estimated fair value is determined by a discounted cash flow model based on a current yield curve appropriate for the remaining term to maturity.
Term debt
The estimated fair value is determined by a discounted cash flow model based on a current yield curve appropriate for the remaining term to maturity.
Interest rate, basis and cross currency swaps
The fair value is determined as the present value of the future interest cash flows.
(e) Derivative financial instruments
Derivative financial instruments are measured at fair value and recorded in the Statement of Financial Position as assets and liabilities. Changes in values of derivative financial instruments are recognised in the Income statement unless they qualify as cash flow hedges for accounting purposes, as set out in Note 2 (g).
The Group uses derivative financial instruments to hedge financial risk from movements in interest rates and foreign exchange rates. A description of these financial instruments is given on the following page.
Notes to the Financial Statements (continued)
Financial Report 2011 / 12 • Heritage Bank Limited • Page 51
15. FINANCIAL INSTRUMENTS AND RISK MANAGEMENT (continued)(e) Derivative financial instruments (continued)
Interest rate swaps - cash flow hedges
The Group has adopted a cash flow hedging strategy where it transacts pay fixed / receive floating swaps with approved external counterparties to mitigate against variability in cash flows of a portfolio of floating rate liabilities.
At balance sheet date, the Group has interest rate swap agreements with a notional amount of $350 million (2011 - $160 million), on which it pays 2.923% to 5.555% interest and receives Bank Bill Swap Rate (BBSW). The swaps expire between July 2012 and May 2015.
The Group has adopted a cash flow hedging strategy where it transacts pay floating / receive fixed swaps (some of an amortising nature) with SPVs to counteract against variability in cash flows of a portfolio of floating rate assets.
At balance sheet date, there is a portfolio balance of $584 million pay floating / received fixed interest rate swaps that Heritage has transacted with SPVs.
Interest rate swap - fixed rate bonds
The Group has entered into pay fixed / receive floating swaps to mitigate against changes in the fair value of the fixed rate bonds.
At balance sheet date, there is a portfolio balance of $27.2 million pay fixed / receive floating interest rate swaps.
Interest rate swap - fair value hedge
The Group has adopted a fair value hedging strategy where it transacts pay floating / receive fixed swaps with approved external counterparties to mitigate against changes in the fair value of term subordinated debt due to movement in interest rates.
At balance sheet date, there was a portfolio balance of $50 million pay floating / receive fixed interest rate swaps.
Basis swaps
The Parent is a basis swap provider to a number of SPVs. As a swap provider, the basis swaps are taken up in the Parent's income or expense. At consolidation, these swaps are eliminated from the Statement of Financial Position.At balance sheet date, the Parent has basis swap agreements with a notional amount of $1,163 million (2011 - $1,417 million). The swaps are provided to the SPVs to hedge the basis between the pool assets and the note holder interest. Hedge accounting is not being applied to the basis swaps.
Cross currency swaps
One of the SPVs entered into a cross currency swap agreement. The Group has adopted the cash flow strategy for the designation of this swap. At balance sheet date, the Group has a cross currency swap agreement with a value of $29.712 million net liability (2011 - $42.392 million net liabilities relating to two SPVs). The swap is used to convert the Euro dollar note holder obligation to Australian dollar obligation.
(f) Operational Risk
Operational risk is risk arising from inadequate or failed internal processes, people and information systems, or from external events (other than credit, market, and liquidity risks). Operational risks arise from Heritage’s operational activities.
Heritage’s objective is to manage the risks associated with its activities to realise opportunities and minimise the impact of undesired and unexpected events on its business activities.
Management of risks through the implementation of appropriate control strategies is supported by a programme of periodic reviews undertaken by Internal Audit. The results of the reviews are provided to the responsible management of the subject business unit and reported to the Audit & Compliance Committee.
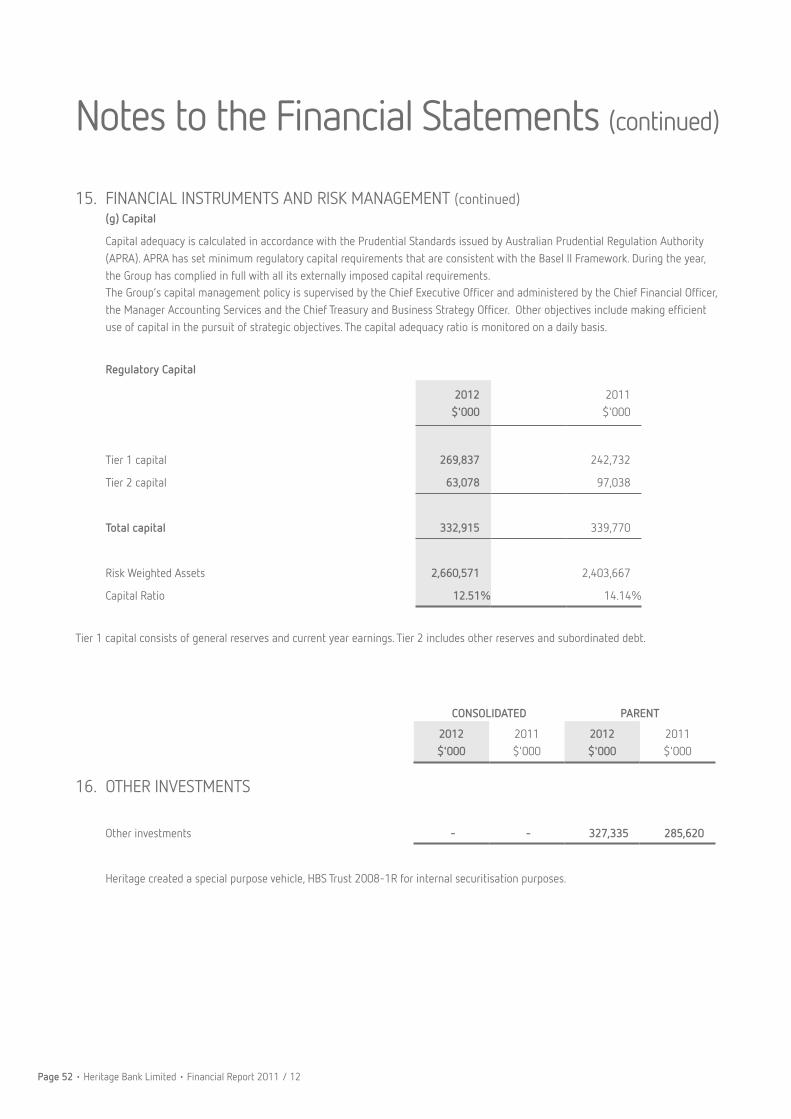
Page 52 • Heritage Bank Limited • Financial Report 2011 / 12
15. FINANCIAL INSTRUMENTS AND RISK MANAGEMENT (continued)(g) Capital
Capital adequacy is calculated in accordance with the Prudential Standards issued by Australian Prudential Regulation Authority (APRA). APRA has set minimum regulatory capital requirements that are consistent with the Basel II Framework. During the year, the Group has complied in full with all its externally imposed capital requirements.The Group’s capital management policy is supervised by the Chief Executive Officer and administered by the Chief Financial Officer, the Manager Accounting Services and the Chief Treasury and Business Strategy Officer. Other objectives include making efficient use of capital in the pursuit of strategic objectives. The capital adequacy ratio is monitored on a daily basis.
Regulatory Capital
2012 $'000
2011 $'000
Tier 1 capital 269,837 242,732
Tier 2 capital 63,078 97,038
Total capital 332,915 339,770
Risk Weighted Assets 2,660,571 2,403,667
Capital Ratio 12.51% 14.14%
Tier 1 capital consists of general reserves and current year earnings. Tier 2 includes other reserves and subordinated debt.
CONSOLIDATED PARENT
2012$'000
2011$'000
2012$'000
2011$'000
16. OTHER INVESTMENTS
Other investments - - 327,335 285,620
Heritage created a special purpose vehicle, HBS Trust 2008-1R for internal securitisation purposes.
Notes to the Financial Statements (continued)

Financial Report 2011 / 12 • Heritage Bank Limited • Page 53
17. PROPERTY, PLANT AND EQUIPMENTCONSOLIDATED
Freehold land
Heritage Plaza
building units
Furniture, fittings,
plant and equipment
Total
$'000 $'000 $'000 $'000
Year ended 30 June 2012
At 1 July 2011, net of accumulated depreciation and impairment 1,800 8,090 11,139 21,029
Additions - 130 4,756 4,886
Disposals - - (303) (303)
Depreciation charge for the year - (584) (4,435) (5,019)
As at 30 June 2012, net of accumulated depreciation and impairment 1,800 7,636 11,157 20,593
At 30 June 2012
Cost 1,800 11,590 48,510 61,900
Accumulated depreciation and impairment (a) - (3,954) (37,353) (41,307)
Net carrying amount 1,800 7,636 11,157 20,593
Year ended 30 June 2011
At 1 July 2010, net of accumulated depreciation and impairment 1,800 8,553 11,105 21,458
Additions - 372 5,182 5,554
Disposals - - (429) (429)
Depreciation charge for the year - (835) (4,719) (5,554)
As at 30 June 2011, net of accumulated depreciation and impairment 1,800 8,090 11,139 21,029
At 30 June 2011
Cost 1,800 11,461 46,536 59,797
Accumulated depreciation and impairment (a) - (3,371) (35,397) (38,768)
Net carrying amount 1,800 8,090 11,139 21,029

Page 54 • Heritage Bank Limited • Financial Report 2011 / 12
17. PROPERTY, PLANT AND EQUIPMENT (continued)
PARENT
Freehold land
Heritage Plaza
building units
Furniture, fittings,
plant and equipment
Total
$'000 $'000 $'000 $'000
Year ended 30 June 2012
At 1 July 2011, net of accumulated depreciation and impairment 1,800 8,090 11,139 21,029
Additions - 130 4,756 4,886
Disposals - - (303) (303)
Depreciation charge for the year - (584) (4,435) (5,019)
As at 30 June 2012, net of accumulated depreciation and impairment 1,800 7,636 11,157 20,593
At 30 June 2012
Cost 1,800 11,590 48,510 61,900
Accumulated depreciation and impairment (a) - (3,954) (37,353) (41,307)
Net carrying amount 1,800 7,636 11,157 20,593
Year ended 30 June 2011
At 1 July 2010, net of accumulated depreciation and impairment 1,800 8,553 11,105 21,458
Additions - 372 5,182 5,554
Disposals - - (429) (429)
Depreciation charge for the year - (835) (4,719) (5,554)
As at 30 June 2011, net of accumulated depreciation and impairment 1,800 8,090 11,139 21,029
At 30 June 2011
Cost 1,800 11,461 46,536 59,797
Accumulated depreciation and impairment (a) - (3,371) (35,397) (38,768)
Net carrying amount 1,800 8,090 11,139 21,029
(a) Impairment of property, plant and equipment
An impairment loss is recognised for the amount by which the assets carrying value exceeds its recoverable amount. The freehold land and buildings at 400 Ruthven Street Toowoomba is tested for impairment. The major drivers and triggers of impairment were identified and reviewed, and have not given rise to any identified impairment loss. Therefore, no impairment loss or gain has been recognised in the 2011 or 2012 financial statements.
Notes to the Financial Statements (continued)

Financial Report 2011 / 12 • Heritage Bank Limited • Page 55
CONSOLIDATED PARENT
2012$'000
2011$'000
2012$'000
2011$'000
18. OTHER ASSETS
Prepayments 1,407 1,161 1,407 1,161
Make good asset 1,326 1,326 1,326 1,326
Less: Amortisation (1,224) (1,146) (1,224) (1,146)
102 180 102 180
1,509 1,341 1,509 1,341
19. INTANGIBLES
Computer Software
Opening balance, net of accumulated amortisation and impairment 1,408 1,849 1,408 1,849
Additions 435 445 435 445
Disposals - - - -
Amortisation charge for the year (794) (886) (794) (886)
Closing balance, net of accumulated amortisation and impairment 1,049 1,408 1,049 1,408
20. DEPOSITS AND BORROWINGS
Customer deposits 4,909,821 4,579,363 4,909,821 4,579,363
Term debt 902,489 704,373 902,489 704,373
Accrued interest on deposits / notes 54,845 56,189 49,891 48,119
Interest bearing notes 1,716,534 2,059,767 - -
Related parties 1,792 861 1,792 861
7,585,481 7,400,553 5,863,993 5,332,716
(a) Aggregate deposit and borrowings of related parties
Key management personnel 1,792 861 1,792 861

Page 56 • Heritage Bank Limited • Financial Report 2011 / 12
Note CONSOLIDATED PARENT
2012$'000
2011$'000
2012$'000
2011$'000
20. DEPOSITS AND BORROWINGS (continued)
(b) Concentration of deposits
Queensland depositors 4,313,945 4,147,689 4,266,750 3,853,659
Other 3,271,536 3,252,864 1,597,243 1,479,057
7,585,481 7,400,553 5,863,993 5,332,716
The Group's deposit portfolio does not include any deposit which represents 10% or more of total liabilities.
21. ACCOUNTS PAYABLE AND OTHER LIABILITIES
Trade creditors 220,507 214,504 220,357 225,258
Inter entity loan (interest bearing) - - 2,021,730 2,348,296
220,507 214,504 2,242,087 2,573,554
22. PROVISIONS
Employee benefits 8,173 7,315 8,173 7,315
Directors’ retiring allowance 542 647 542 647
Make good provision 1,326 1,326 1,326 1,326
10,041 9,288 10,041 9,288
Make good provision
Current 488 427 488 427
Non-current 838 899 838 899
1,326 1,326 1,326 1,326
Notes to the Financial Statements (continued)
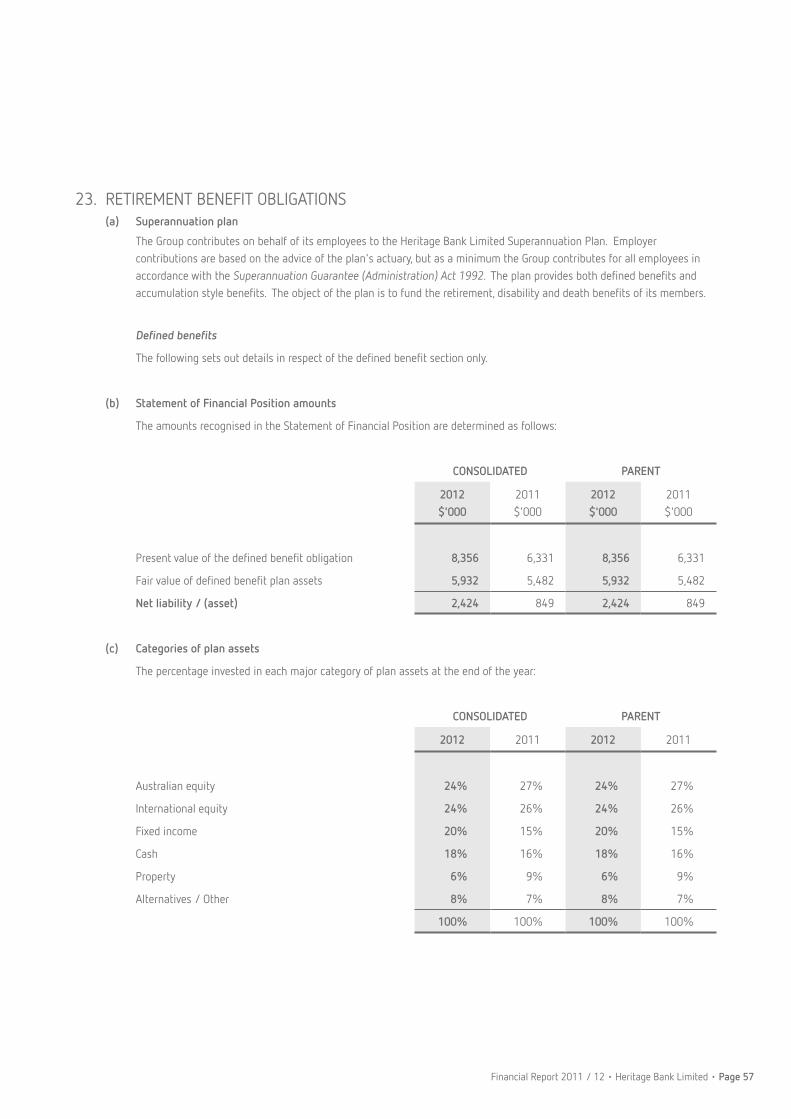
Financial Report 2011 / 12 • Heritage Bank Limited • Page 57
23. RETIREMENT BENEFIT OBLIGATIONS(a) Superannuation plan
The Group contributes on behalf of its employees to the Heritage Bank Limited Superannuation Plan. Employer contributions are based on the advice of the plan's actuary, but as a minimum the Group contributes for all employees in accordance with the Superannuation Guarantee (Administration) Act 1992. The plan provides both defined benefits and accumulation style benefits. The object of the plan is to fund the retirement, disability and death benefits of its members.
Defined benefits
The following sets out details in respect of the defined benefit section only.
(b) Statement of Financial Position amounts
The amounts recognised in the Statement of Financial Position are determined as follows:
CONSOLIDATED PARENT
2012$'000
2011$'000
2012$'000
2011$'000
Present value of the defined benefit obligation 8,356 6,331 8,356 6,331
Fair value of defined benefit plan assets 5,932 5,482 5,932 5,482
Net liability / (asset) 2,424 849 2,424 849
(c) Categories of plan assets
The percentage invested in each major category of plan assets at the end of the year:
CONSOLIDATED PARENT
2012 2011 2012 2011
Australian equity 24% 27% 24% 27%
International equity 24% 26% 24% 26%
Fixed income 20% 15% 20% 15%
Cash 18% 16% 18% 16%
Property 6% 9% 6% 9%
Alternatives / Other 8% 7% 8% 7%
100% 100% 100% 100%

Page 58 • Heritage Bank Limited • Financial Report 2011 / 12
CONSOLIDATED PARENT
2012$'000
2011$'000
2012$'000
2011$'000
23. RETIREMENT BENEFIT OBLIGATIONS (continued)(d) Reconciliations
Reconciliation of the present value of the defined benefit obligation:
Balance at the beginning of the year 6,331 5,757 6,331 5,757
Current service cost 432 409 432 409
Interest cost 266 269 266 269
Contributions by plan participants 17 17 17 17
Actuarial (gain) / loss 1,460 441 1,460 441
Benefits paid - (443) - (443)
Taxes, premiums and expenses paid (150) (119) (150) (119)
Balance at the end of the year 8,356 6,331 8,356 6,331
Reconciliation of the fair value of plan assets:
Balance at the beginning of the year 5,482 5,228 5,482 5,228
Expected return on plan assets 350 369 350 369
Actuarial gain / (loss) (342) (94) (342) (94)
Employer contributions 575 524 575 524
Contributions by plan participants 17 17 17 17
Benefits paid - (443) - (443)
Taxes, premiums and expenses paid (150) (119) (150) (119)
Balance at the end of the year 5,932 5,482 5,932 5,482
(e) Principal actuarial assumptions
The principal actuarial assumptions adopted for the calculations were:
CONSOLIDATED PARENT
2012 2011 2012 2011
Discount rate 2.4% pa 4.4% pa 2.4% pa 4.4% pa
Expected rate of return on plan assets 6.2% pa 6.3% pa 6.2% pa 6.3% pa
Expected salary increase rate 5.0% pa 4.5% pa 5.0% pa 4.5% pa
The expected return on assets assumption is determined by weighting the expected long-term return for each asset class by the target allocation of assets to each asset class and allowing for the correlations of the investment returns between asset classes. The returns used for each asset class are net of investment tax and investments fees.
Notes to the Financial Statements (continued)
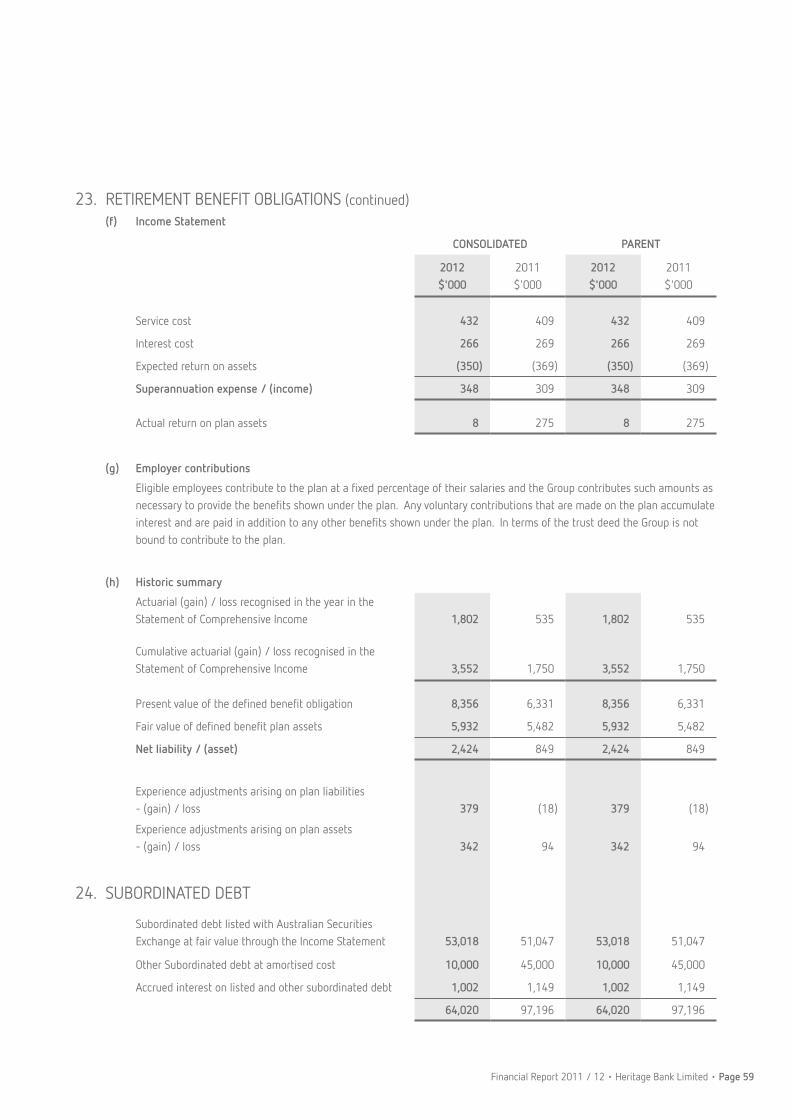
Financial Report 2011 / 12 • Heritage Bank Limited • Page 59
23. RETIREMENT BENEFIT OBLIGATIONS (continued)(f) Income Statement
CONSOLIDATED PARENT
2012$'000
2011$'000
2012$'000
2011$'000
Service cost 432 409 432 409
Interest cost 266 269 266 269
Expected return on assets (350) (369) (350) (369)
Superannuation expense / (income) 348 309 348 309
Actual return on plan assets 8 275 8 275
(g) Employer contributions
Eligible employees contribute to the plan at a fixed percentage of their salaries and the Group contributes such amounts as necessary to provide the benefits shown under the plan. Any voluntary contributions that are made on the plan accumulate interest and are paid in addition to any other benefits shown under the plan. In terms of the trust deed the Group is not bound to contribute to the plan.
(h) Historic summary
Actuarial (gain) / loss recognised in the year in the Statement of Comprehensive Income 1,802 535 1,802 535
Cumulative actuarial (gain) / loss recognised in the Statement of Comprehensive Income 3,552 1,750 3,552 1,750
Present value of the defined benefit obligation 8,356 6,331 8,356 6,331
Fair value of defined benefit plan assets 5,932 5,482 5,932 5,482
Net liability / (asset) 2,424 849 2,424 849
Experience adjustments arising on plan liabilities - (gain) / loss 379 (18) 379 (18)
Experience adjustments arising on plan assets - (gain) / loss 342 94 342 94
24. SUBORDINATED DEBT
Subordinated debt listed with Australian Securities Exchange at fair value through the Income Statement 53,018 51,047 53,018 51,047
Other Subordinated debt at amortised cost 10,000 45,000 10,000 45,000
Accrued interest on listed and other subordinated debt 1,002 1,149 1,002 1,149
64,020 97,196 64,020 97,196

Page 60 • Heritage Bank Limited • Financial Report 2011 / 12
24. SUBORDINATED DEBT (continued)CONSOLIDATED PARENT
2012$'000
2011$'000
2012$'000
2011$'000
(a) Aggregate subordinated debt of related parties
Key management personnel 177 177 177 177
Concentration of subordinated debt
Queensland debt holders - face value 33,091 31,143 33,091 31,143
Other - face value 26,909 63,857 26,909 63,857
60,000 95,000 60,000 95,000
Subordinated debt matures between October 2017 and October 2019 (2011 - December 2016 and October 2019) with an effective interest rate of 9.25% (2011 - 7.96%).
25. RESERVES(a) Reserves
Asset revaluation reserve
Balance 1 July 5,714 5,714 5,714 5,714
Revaluation of land - - - -
Revaluation of buildings - - - -
Balance 30 June 5,714 5,714 5,714 5,714
Cash flow hedge reserve
Balance 1 July 1,860 (3,105) 4,446 6,183
Transfer to profit - - - -
Gain / (loss) on cash flow hedging instruments (7,270) 7,187 1,165 (2,388)
Deferred tax 2,181 (2,222) (350) 651
Balance 30 June (3,229) 1,860 5,261 4,446
Available for sale asset reserve
Balance 1 July 1,506 1,707 1,506 1,707
Net gain on proceeds from Visa sale reclassified to the Income Statement (2,464) - (2,464) -
Revaluation of shares 2,741 (287) 2,741 (287)
Deferred tax (83) 86 (83) 86
Balance 30 June 1,700 1,506 1,700 1,506
Total Reserves 4,185 9,080 12,675 11,666
Notes to the Financial Statements (continued)

Financial Report 2011 / 12 • Heritage Bank Limited • Page 61
25. RESERVES (continued)(b) Nature and purpose of reserves
(i) Asset revaluation reserve
The property, plant and equipment revaluation reserve was used to record increments and decrements on the revaluation of non-current assets up until the transition to IFRS. The asset revaluation reserve will not be used under the existing accounting policy on property plant and equipment (refer Note 2 (k)).
(ii) Cash flow hedge reserve
The hedging reserve is used to record gains or losses on a hedging instrument in a cash flow hedge that are recognised directly in equity, as described in Note 2 (g). As the underlying transaction occurs the balance will be transferred back to the Income Statement.
(iii) Available for sale asset reserve
This reserve is used to record increments and decrements on the revaluation of the Visa shares described in Note 14 (a).

Page 62 • Heritage Bank Limited • Financial Report 2011 / 12
CONSOLIDATED PARENT
2012$'000
2011$'000
2012$'000
2011$'000
26. CASH FLOW STATEMENT RECONCILIATION
(a) Reconciliation of the operating profit after tax to the net cash flows from operations
Operating profit after tax 31,272 32,056 31,272 32,056
Non cash items
Share of associates' net profits 164 1,729 164 1,729
Impairment losses on loans 2,092 2,040 2,092 2,040
Defined benefit fund (227) (215) (227) (215)
Depreciation 5,019 5,554 5,019 5,554
Amortisation - loans and receivables 900 668 900 668
Amortisation - computer software and make good asset 872 994 872 994
Amortisation - establishment cost of borrowings 741 740 741 740
Provision for employee benefits 858 425 858 425
Changes in assets
Loss from sale of property, plant and equipment 70 142 70 142
Realised gain on sale of investments (2,464) - (2,464) -
Accrued interest on investments 1,568 (1,500) 1,498 (1,498)
Intangibles (434) (442) (434) (442)
Sundry debtors (995) (539) (1,019) (550)
Prepayments (405) 321 (405) 321
Expenditure carried forward (2,256) (952) (2,256) (952)
Swap asset (2,292) 34 (2,292) 34
Deferred tax asset (2,373) 1,133 (990) (292)
Changes in liabilities
Accrued investors interest (1,491) 8,074 1,625 6,984
Current tax liability (1,604) (926) (1,604) (926)
Revaluation of term subordinated debt 1,500 150 1,500 150
Sundry creditors 11,046 4,744 11,249 3,656
Swap liability 513 - 513 -
Directors' retiring allowance (105) (40) (105) (40)
Deferred tax liability 2,996 (3,564) 1,612 (2,140)
Net cash flows from operating activities 44,965 50,626 48,189 48,438
Notes to the Financial Statements (continued)
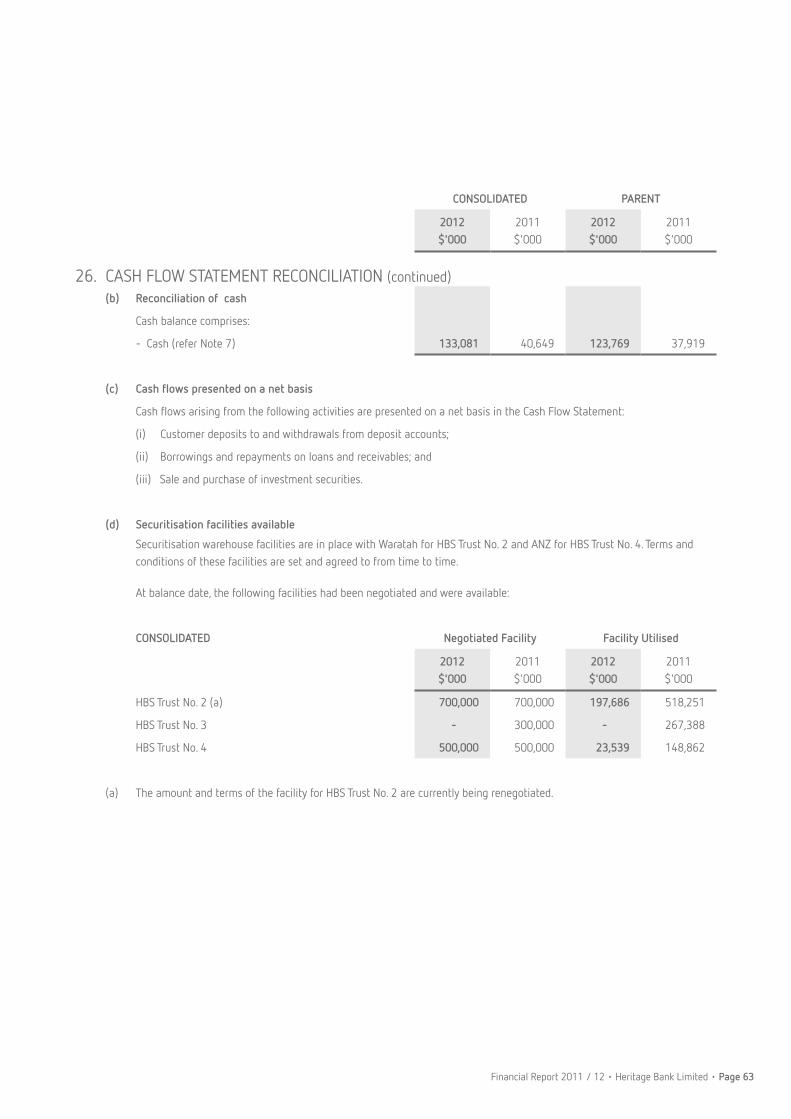
Financial Report 2011 / 12 • Heritage Bank Limited • Page 63
CONSOLIDATED PARENT
2012$'000
2011$'000
2012$'000
2011$'000
26. CASH FLOW STATEMENT RECONCILIATION (continued)(b) Reconciliation of cash
Cash balance comprises:
- Cash (refer Note 7) 133,081 40,649 123,769 37,919
(c) Cash flows presented on a net basis
Cash flows arising from the following activities are presented on a net basis in the Cash Flow Statement:
(i) Customer deposits to and withdrawals from deposit accounts;
(ii) Borrowings and repayments on loans and receivables; and
(iii) Sale and purchase of investment securities.
(d) Securitisation facilities available
Securitisation warehouse facilities are in place with Waratah for HBS Trust No. 2 and ANZ for HBS Trust No. 4. Terms and conditions of these facilities are set and agreed to from time to time.
At balance date, the following facilities had been negotiated and were available:
CONSOLIDATED Negotiated Facility Facility Utilised
2012$'000
2011$'000
2012$'000
2011$'000
HBS Trust No. 2 (a) 700,000 700,000 197,686 518,251
HBS Trust No. 3 - 300,000 - 267,388
HBS Trust No. 4 500,000 500,000 23,539 148,862
(a) The amount and terms of the facility for HBS Trust No. 2 are currently being renegotiated.

Page 64 • Heritage Bank Limited • Financial Report 2011 / 12
CONSOLIDATED PARENT
2012$'000
2011$'000
2012$'000
2011$'000
27. EXPENDITURE COMMITMENTS
(a) Lease expenditure commitments
Estimated lease expenditure contracted for at balance date but not provided for:
Operating leases (non-cancellable)
Not later than 1 year 8,037 7,401 8,037 7,401
Later than 1 and not later than 5 years 23,624 12,526 23,624 12,526
Later than 5 years 4,285 408 4,285 408
Aggregate lease expenditure contracted for at balance date 35,946 20,335 35,946 20,335
These commitments represent payments due under non-cancellable operating leases for various premises occupied. The average lease term is five years.
28. CONTINGENT LIABILITIES AND CREDIT COMMITMENTS
In the normal course of business the Group enters into various types of contracts that give rise to contingent or future obligations. These contracts generally relate to the financial needs of customers. The Group uses the same credit policies and assessment criteria in making commitments and conditional obligations for off-balance sheet risks as it does for on-balance sheet loan assets. The Group holds collateral supporting these commitments where it is deemed necessary.
(a) Credit related commitments
Binding commitments to extend credit are agreements to lend to a customer as long as there is no violation of any condition established in the contract.
Approved but undrawn loans and credit limits 474,398 410,784 474,398 410,784
Notes to the Financial Statements (continued)

Financial Report 2011 / 12 • Heritage Bank Limited • Page 65
CONSOLIDATED PARENT
2012$'000
2011$'000
2012$'000
2011$'000
29. RELATED PARTY DISCLOSURES
(a) Remuneration of key management personnel
Remuneration of the key management personnel of the Group is as follows:
BENEFITS
Short-term
Salary and fees 3,756 3,524 3,756 3,524
Cash bonus 370 352 370 352
Other 180 151 180 151
Long-term
Long service leave entitlements 87 100 87 100
Post employment
Superannuation 570 553 570 553
Retirement benefits 247 235 247 235
Total
Total remuneration 5,210 4,915 5,210 4,915
Total performance related (%) 7% 7% 7% 7%
(b) Loans to key management personnel
All loans to key management personnel and their related parties are on similar terms and conditions available to members.
The following tables provide details of loans made to key management personnel and their related parties.
Balance 1 July 2011
Written off Interest charged
Interest not charged
Balance 30 June
2012
Number in group
$'000 $'000 $'000 $'000 $'000
Key management personnel and their related parties
1,894 - 113 - 2,011 6
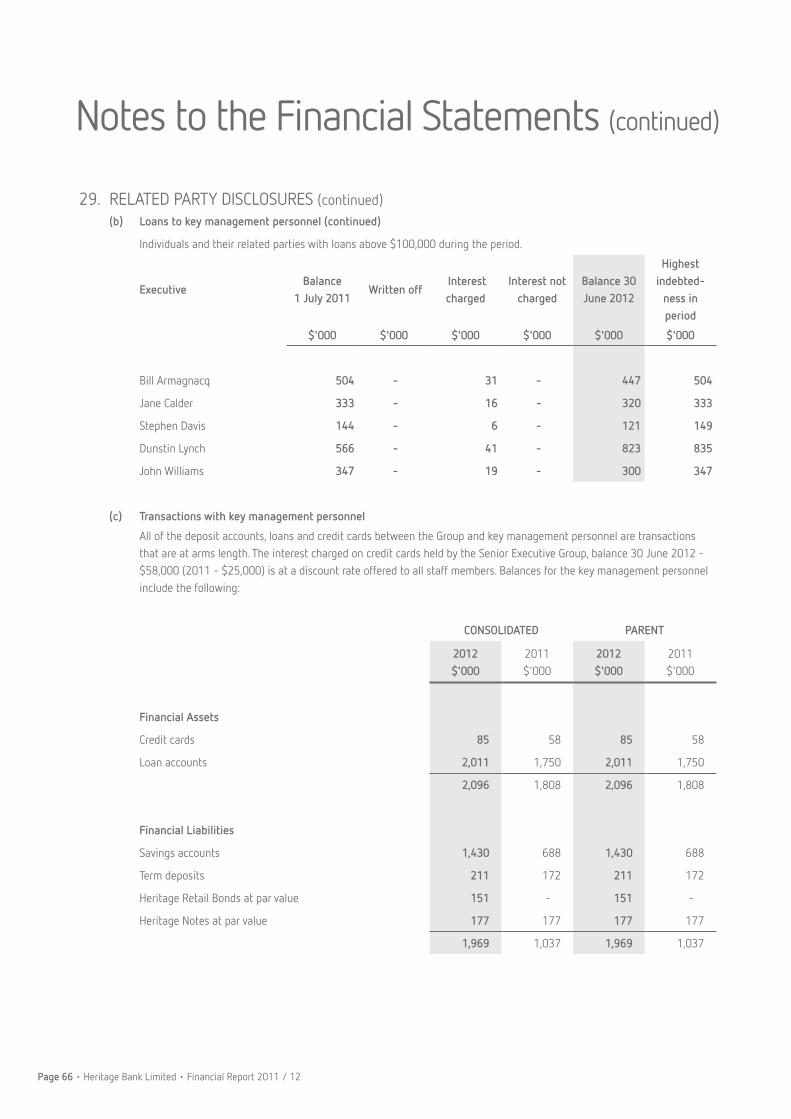
Page 66 • Heritage Bank Limited • Financial Report 2011 / 12
29. RELATED PARTY DISCLOSURES (continued)(b) Loans to key management personnel (continued)
Individuals and their related parties with loans above $100,000 during the period.
ExecutiveBalance
1 July 2011 Written off
Interest charged
Interest not charged
Balance 30 June 2012
Highest indebted-
ness in period
$'000 $'000 $'000 $'000 $'000 $'000
Bill Armagnacq 504 - 31 - 447 504
Jane Calder 333 - 16 - 320 333
Stephen Davis 144 - 6 - 121 149
Dunstin Lynch 566 - 41 - 823 835
John Williams 347 - 19 - 300 347
(c) Transactions with key management personnel
All of the deposit accounts, loans and credit cards between the Group and key management personnel are transactions that are at arms length. The interest charged on credit cards held by the Senior Executive Group, balance 30 June 2012 - $58,000 (2011 - $25,000) is at a discount rate offered to all staff members. Balances for the key management personnel include the following:
CONSOLIDATED PARENT
2012$'000
2011$'000
2012$'000
2011$'000
Financial Assets
Credit cards 85 58 85 58
Loan accounts 2,011 1,750 2,011 1,750
2,096 1,808 2,096 1,808
Financial Liabilities
Savings accounts 1,430 688 1,430 688
Term deposits 211 172 211 172
Heritage Retail Bonds at par value 151 - 151 -
Heritage Notes at par value 177 177 177 177
1,969 1,037 1,969 1,037
Notes to the Financial Statements (continued)

Financial Report 2011 / 12 • Heritage Bank Limited • Page 67
29. RELATED PARTY DISCLOSURES (continued)(d) Other transactions and balances with key management personnel
Mr Kerry J. Betros is the Managing Director of Betros Bros Holdings Pty Limited. A member of this group of companies, Betros Bros Pty Limited, acts as an investing agent. All transactions with the company were performed in the ordinary course of business and on normal commercial terms and conditions. Commissions and rental paid to Betros Bros Pty Limited during the year were $76,000 (2011 - $76,000).
Mr Brian R. Carter is Managing Director of Bricar Pty Limited. During the year $2,000 (2011 - nil) was paid to Bricar Pty Limited for reimbursement of secretarial costs.
Mr Stephen Davis is Managing Director of David W Swan & Associates Pty Limited. During the year $90,000 was paid to the company in relation to real estate valuations.
(e) Special Purpose Vehicles (SPVs)
The SPVs which form part of the consolidated results include the following trusts:
HBS Trust No. 1 HBS Trust 2004-1
HBS Trust No. 2 HBS Trust 2005-1E
HBS Trust No. 3 HBS Trust 2006-1
HBS Trust No. 4 HBS Trust 2008-1R
HBS Trust 2003-1E HBS Trust 2011-1
Refer to Note 21 for disclosure of the inter entity loan.
Heritage provides a number of facilities and services to the SPVs. The facilities and services can include the following:
Servicer
The role of servicer requires Heritage to collect monies and administer the securitised loans. During the year fee income of $7,522,000 (2011 - $8,500,000) was received for performing these functions.
Liquidity and redraw facility provider
Heritage provides a facility to fund any redraws made by members in relation to the securitised loans. It also provides a liquidity arrangement ensuring the SPV is able to meet its cash flow obligations. During the year fee income of $85,000 (2011 - $135,000) was received for performing these functions.
Swap provider
Heritage enters into swaps with the SPVs. Interest revenue or expense in respect of these swaps is dependent on prevailing interest rates.
Heritage received $1,668,000 (2011 - $2,134,000) in interest relating to the securitisation deposits during the year. The average balance of the securitisation deposits held was $37,658,000 (2011 - $46,952,000).
Custodian and management fee
Heritage provided custodian and management services to HBS Trust No. 4 and HBS Trust 2011-1 for the full financial year. HBS Custodian Pty Limited retired from its role as custodian and manager of the remaining SPVs effective 31 December 2011. For the remainder of the year Heritage undertook this role. During the year fee income of $298,000 (2011 - $16,000) was received for performing this function.

Page 68 • Heritage Bank Limited • Financial Report 2011 / 12
29. RELATED PARTY DISCLOSURES (continued)(f) Other
Details of interest in controlled entities are set out in Note 31. There are no further dealings with these entities.
Details of interest in associated companies are set out in Note 13. During the year, dividends of $748,800 (2011 - $2,746,000) were received from Permanent LMI Pty Limited.
During the financial year fee income for the provision of management and accounting services of $125,000 (2011 - $364,000) was received from HBS Custodian Pty Limited. A dividend of $156,000 was paid to Heritage as a result of the retirement of HBS Custodian Pty Limited.
CONSOLIDATED PARENT
2012$'000
2011$'000
2012$'000
2011$'000
30. AUDITOR'S REMUNERATION
Amounts received or due and receivable by the auditors for:
An audit and review of the financial report of the Group 440 420 362 340
Taxation services 67 112 47 92
Accounting advice - financing and taxation 24 70 24 70
Regulatory review 61 - 61 -
Securitisation services 94 73 24 -
686 675 518 502
Amounts received or due and receivable by non Ernst & Young audit firms for:
Other non-audit services in relation to the Group - - - -
- - - -
686 675 518 502
Notes to the Financial Statements (continued)

Financial Report 2011 / 12 • Heritage Bank Limited • Page 69
31. CONTROLLED ENTITIES
Name of EntityBook value of investment
% of
shares held
Country of incorpor-
ation
Contribution to consolidated
profit after tax2012$'000
2011$'000
2012%
2011%
2012$'000
2011$'000
Parent Entity
Heritage Bank Limited - - - - Australia - -
Special Purpose Vehicles (SPVs)
The SPVs relate to the securitisation of Heritage's loans and include the following trusts: (Refer to Note 2 (c) for further details). (a) 327,335 285,620 N/A N/A N/A - -
HBS Trust No. 1
HBS Trust No. 2
HBS Trust No. 4
HBS Trust 2004-1
HBS Trust 2005-1E
HBS Trust 2006-1
HBS Trust 2008-1R
HBS Trust 2011-1
(a) Refer Note 16 for details.
The clean up option for HBS Trust 2003-1E was exercised on 19 September 2011. On this date, pursuant to Clause 11.1 of the Series Notice, the Trust extinguished all of its right, title and interest in the remaining loans in favour of Heritage.
The clean up option for HBS Trust No. 3 was exercised on 8 December 2011. On this date, pursuant to Clause 10.1 of the Series Notice, the Trust extinguished all of its right, title and interest in the remaining loans in favour of Heritage.
32. SEGMENT INFORMATION
The Group operated predominantly in the finance industry within Australia. The operations comprise the provision of financial products and services to members.
Specific segmentation of loans and deposits are set out in Notes 10 and 20.
33. EVENTS SUBSEQUENT TO REPORTING DATE
There are no significant events since the end of the financial year which will affect the operating results or state of affairs of the Group in subsequent years.

Page 70 • Heritage Bank Limited • Financial Report 2011 / 12
DIRECTORS' DECLARATION In accordance with a resolution of the directors of Heritage Bank Limited, we state that:
In the opinion of the directors:
(a) the financial statements and notes of Heritage are in accordance with the Corporations Act 2001, including: (i) giving a true and fair view of Heritage’s financial position as at 30 June 2012 and of their performance for the year ended
on that date; and
(ii) complying with Accounting Standards and Corporations Regulations 2001; and
(b) the financial statements also complies with International Financial Reporting Standards as issued by the International Accounting Standards Board; and
(c) there are reasonable grounds to believe that Heritage will be able to pay its debts as and when they become due and payable. On behalf of the Board
TOOWOOMBA KERRY J. BETROS DENNIS P. CAMPBELL23 August 2012 Chairman Deputy Chairman
Directors’ Declaration

Financial Report 2011 / 12 • Heritage Bank Limited • Page 71
Auditor’s Independence Declaration
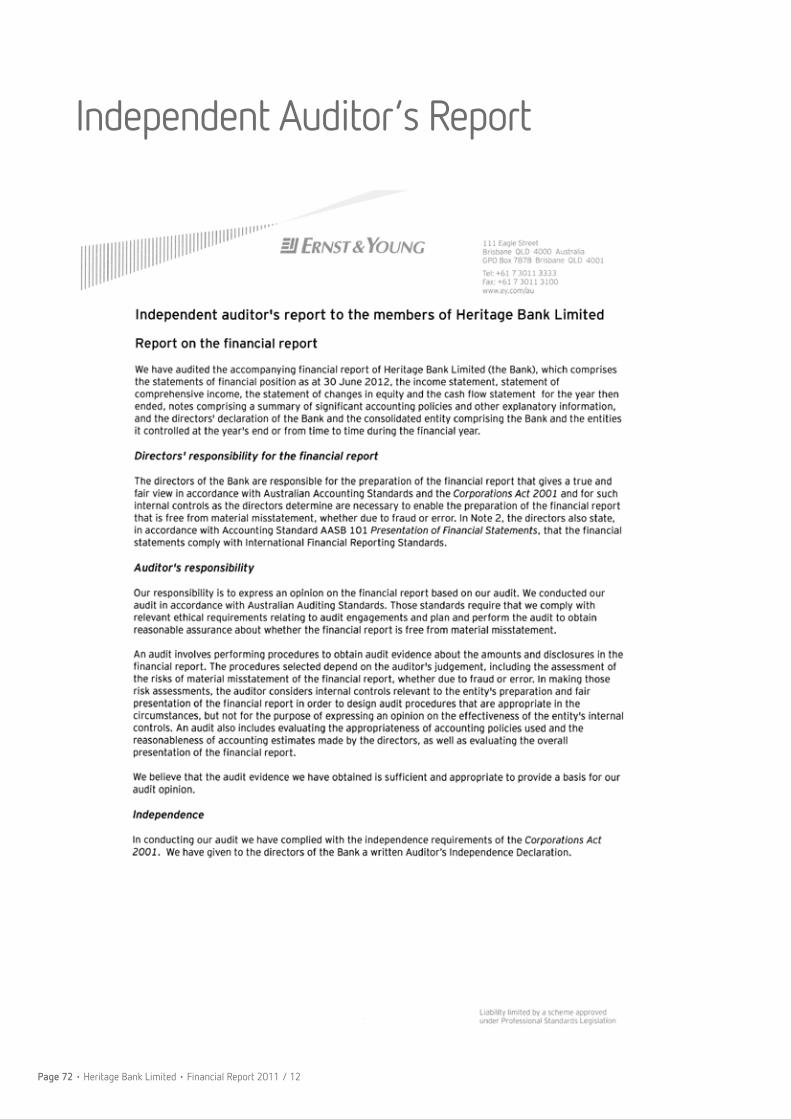
Page 72 • Heritage Bank Limited • Financial Report 2011 / 12
Independent Auditor’s Report

Financial Report 2011 / 12 • Heritage Bank Limited • Page 73

Page 74 • Heritage Bank Limited • Financial Report 2011 / 12
THIS PAGE LEFT INTENTIONALLY BLANK
Financial Report 2011 / 12 • Heritage Bank Limited • Page 75
THIS PAGE LEFT INTENTIONALLY BLANK

Page 76 • Heritage Bank Limited • Financial Report 2011 / 12
THIS PAGE LEFT INTENTIONALLY BLANK