article Analysis of Heritability and Shared Heritability ...

HERITABILITY OF QUASI-CONTINUOUS SKELETAL TRAITS IN A RANDOMBRED POPULATION OF HOUSE MICE
STEVEN G. SELF1 AND LARRY LEAMY
Department of Biology, California State Uniuersity, Long Beach, Long Beach, California 90S40
Manuscript received August 1, 1977 Revised copy received September 12, 1977
ABSTRACT
Heritabilities of 11 quasi-continuous skeletal traits were estimated in randombred house mice 3f three separate ages (1, 3, and 5 months). Three separate methods-regression, maximum likelihood correlation, and Falconer's Method-were used to obtain heritabilities for each of the separate age groups. Significant differences in the incidences of seven of the skeletal traits were found among ages, but they did not affect the heritability estimates, these esti- mates being pooled over ages. Heritabilities calculated from female parents were consistently higher (by about 13%) than those from male parents, indi- cating the presence of maternal effects. Mid-parent estimates made by all three methods gave very similar mean levels (0.17 - 0.20). Although low, this level compared favorably with that expected on the basis of previously esti- mated rates of accumulation of genetic variance. Maternal effects estimated from full sib correlations averaged 0.08.
quasi-continuous trait (FALCONER 1960; GRUNEBERG 1963) has an under- A lying, continuously distributed liability for the expression of the trait. The variation of this liability is both genetic and environmental in origin (FALCONER 1960). Discrete phenotypic classes are formed by imposing thresholds on this distribution of liabilities such that if an individual has a liability above a given threshold, one form of the trait will be expressed, whereas below the threshold, another f o r m of the trait will be expressed. Polydactyly in guinea pigs (WRIGHT 1934a, b), minor skeletal variations in many mammals (BROTHWELL 1958; BERRY 1968; BERRY and DAVIS 1970), and some diseases such as diabetes metlitus (FALCONER 1965, 1967) are examples of quasi-continuous traits.
Quasi-continuous skeletal traits (for example, the absence or presence of fora- mina in the skull and vertebral column, the fusion or nonfusion of bones in the skull, etc.) have been extensively used to differentiate various kinds of mam- malian populations. These include wild rodent populations in systematic and ecological studies (BERRY 1963, 1964, 1969; REES 1969; BERRY and JAKOBSON 1974, 1975; PATTON 1975), inbred laboratory rodent pupulations in subline divergence studies (DEOL et at. 1957; HOI-SEN 1972) and human populations in demographic studies (BERRY 1964). The usefulness of these characters in dis-
' Present address: Department of Biomathematics, University of Washington, Seattle, Washington 98195.
Genetics 88: 109-120 January, 1978.

110 S. G. SELF AND L. LEAMY
criminating among populations is presumably due to the fact that they are easily scored, their underlying continuous variation provides a broad genetic base upon which mutations may accumulate (DEOL et a2. 1957), and there are relatively low correlations among most of the characters (TRUSLOVE 1961).
Some of the compmen ts of variance, both genetic (sex and subline differences) and environmental (maternal effects and asymmetry differences) , of the liability for quasi-continuous skeletal traits have been estimated from inbred strains of house mice (SEARLE 1954a; DEOL and TRUSLOVE 1957). These sources often significantly affected the various skeletal traits, but their overall percentage contribution was relatively low, over 80% of the total variation for most of the traits being ascribable to intangible factors ( SEARLE 1954a). Although significant parent-offspring correlations in randombred house mice ( GRUNEBERG 1963) and in wild-derived Microtus (HILBORN 1974) offer corroborative evidence for a genetic basis for quasi-continuous skeletal traits, insofar as is known, no direct estimate of the genetic component of these traits has been made.
The principal purpose of this study is to estimate the proportion of additive genetic variance of the liability of each of a suite of quasi-continuous skeletal traits in a randombred population of house mice. This proportion, known as the heritability ( hz) , is a quantitative genetical parameter of considerable practical and theoretical significance. Several different techniques-regression, correlation (TALLIS 1962), and response to selection (FALCONER 1965)-are utilized to esti- mate heritabilities of these traits in mice in each of three separate age groups. This allows a comparison of the techniques as well as the estimates among the age groups.
MATERIALS AND METHODS
House mice of randombred strain CV1 used in this study were obtained in 1968 from Cumber- land View Farms, Clinton, Tennessee. When received, they had undergone the equivalent of roughly 52 generations of random mating since the creation of the strain in 1959 as a derivative of the long inbred (and presumably isogenic) strain 101. These mice previously have been utilized in a heritability study of osteometric traits (LEAMY 1974), from which further details may be found.
All individuals were maintained in standard fashion in an animal room at room temperature, Purina Mouse Chow and water being provided ad libitum. A total of 200 random, single-pair matings eventually resulted in over 1000 offspring (first litters only). All litters containing more than 6 individuals were reduced to 6 within two days of their birth. In those litters with fewer than 6, all offspring were retained. Three sublitters (two mice each) were then sacrificed, one at each of three ages: 35 days (1 month), 90 days (3 months), and 150 days (5 months). Each sublitter consisted of one male and one female when possible, although by the fifth month no choice was left SG that most of these sublitters consisted of two mice of the same sex. The 5-month sublitters were also smallest in total numbers compared to the 1- and 3-month sub- litters, since some litters contained less than 6 offspring. All parents were sacrificed at 5 months. Skeletons of the mice were prepared by exposure to dermestid beetles.
A total of 28 quasi-continuous skeletal variants, all either on the skull o r mandible, were chosen at random from lists used in previous studies. Of these 28 traits, 6 were discarded due io ambiguity in their scoring criteria. Of 22 traits that could be scored with confidence, 11 were found to be monomorphic (frequency less than 0.05), and also were discarded. Table 1 gives a list of the remaining 11 variants (10 bilateral and l-parted frontal-medial) and the refer-

SKELETAL TRAITS IN MICE 111
ences from which the description of each variant and the criteria for scoring it was taken. TWO of the variants (preorbital foramen and foramen hypoglossi) exhibited three character states and were scored as 0, 1, or 2. The other 9 variants had two character states and were scored as 0 or 1. In order to have the data for each of the 11 traits balanced across ages, only those families with all eight members (2 parents and 6 offspring) present and scorable for that trait were used. This resulted in a different number of families for each character (these numbers are also presented in Table 1).
Heritabilities conventionally are estimated by parent-offspring regression or sib correlation. Doubling the regression coefficient of offspring on either male or female parent estimates herit- ability (FALCONER 1960). Regression on the male parent is considered the better estimate when significant maternal effects are present. Strong materna1 effects previously have been observed in these quasi-continuous traits, although they have been found to act primarily through the maternal diet (SEARLE 1954b; DEOL and TRUSLOVE 1957). If the regression coefficients of off- spring on the male and female parents are not significantly different, a regression on the mid- parent (which is a direct estimate of the heritability) may be calculated.
Since quasi-continuous traits do not have a normal (Gaussian) phenotypic distribution, con- ventional regression methods ordinarily are not applicable. However, in the present data, both sides (for bilateral traits) of both parents in each family may be pooled so that five phenotypic classes (0-4) are generated. After converting these scores to frequencies by dividing by the num- ber of sides per pair of individuals and transforming these frequencies by the angular trans- formation (SNEDECOR and COCHRAN 1973), the resulting values are approximately normally distributed. Regression of similarly calculated values for pairs of individuals within sublitters on these mid-parent scores were performed to yield estimates of the heritabilities of the skeletal characters for each age group.
Methods that do not require the assumption of a normal phenotypic distribution produce better estimates of heritability for quasi-continuous traits. The maximum likelihood correlation (TALLIS 1962; KENDELL and STUART 1963) between parent and offspring is considered the best of such methods (TURNER and YOUNG 1969; EDWARDS 1969). Due to difficulties in computation, however, approximations to the maximum likelihood equation typically are used (MENDELL and ELSTON 1974). With the assumption of equal variances in parents and offspring, a correlation coefficient becomes equivalent to a regression coefficient, so heritabilities are estimated from each statistic in a similar manner. The maximum likelihood method assumes an underlying, bivariate normal distribution with thresholds imposed upon it to give discrete classes. The parameters of the continuous distribution, specifically the correlation cocfficient and the threshold values, are then estimated such that the probability of the observed sample being selected from that distribu- tion is maximized. The data may be tested by Chi-square for their fit to a bivariate normal
TABLE 1
A list of the skeletal variants, sample sizes (no. of families), and references for their description
1. Mandibular Foramen (93) (BERRY 1963) 2. Maxillary Foramen I (91) (BERRY 1963) 3. Maxillary Foramen I1 (91) (BERRY 1963) 4. Foramen palatinus minus anterior (94) (BERRY 1963) 5. Foramen palatinus minus posterior (90) (BERRY 1963) 6. Foramen ovale double (96) (DEOL 1955) 7. Foramen pterygoideus (95) (BERRY 1963) 8. Preoptic Sutures (36) (TRUSLOVE 1954) 9. Preorbital Foramen (96) (BERRY and SEARLE 1963)
10. Foramen hypoglossi (82) (DEOL 1955) 11. Parted Frontal (95) (TRUSLOVE 1952)

112 S. G. SELF AND L. LEAMY
distribution, values calculated from the maximum likelihood distribution being the expected values (TALLIS 1962). Thus, heritabilities of the skeletal traits also were estimated from maxi- mum likelihood owrelations between offspring and male parent, female parent, and mid-parent.
FALCONER (1965, 1967) proposed a method of estimating heritabilities of quasi-continuous traits whkh is particularly applicable to human diseases such as diabetes mellitus. This method is based on the equation R = h2S, where S is the selection differential and R is the response to selection. Both S and R are expressed as deviations from the population mean, this latter value being obtained from a probit transformation of the incidence of the trait in the overall popula- tion. In applying this method, the mean of the parents exhibiting the trait (affected individuals) is estimated by the mean score of that portion of a normal curve above the threshold. This value, after subtracting the mean of all parents in the population, is the selection differential (S). These S values are tabulated in FALCONER (1965) for any given incidence of affected individuals in the overall population. The response to selection (R) is the difference between the mean value of the offspring of the affected individuals (calculated by a probit transformation of the incidence in those individuals) and the mean of all offspring in the population. Since the ratio of R to S is equivalent to a parent-offspring regression coefficient, this is a direct estimate of the heritability if both parents are used and an estimate of of the heritability if only a single parent is used. FALCONER (1965) has proposed several modifications of this basic formula for different sampling schemes. His Method 111 (FALCONER 1965) was utilized to provide another heritability estimate for each of the 11 skeletal traits.
RESULTS
Incidences for the 11 skeletal traits in parents and each of the three age classes of offspring are presented in Table 2. In the 10 bilateral traits, incidences for the right and left sides were compared by the McNemar test (SOKAL and ROHLF 1969) for each age and sex. Because none of these tests reached significance, the right and left sides for the bilateral traits are pooled in Table 2 and throughout
TABLE 2
Incidences of the skeletal traits in prrrents and each of three age groups of offspring with the leuels of significance of age differences among the offspring
Parents Offspring Age ____ -~
5 Months 1 Month 3 Months 5 Months difference
1.
2. 3. 4. 5. 6. 7. 8. 9.
IO. 11.
Mandibular Foramen
Maxillary Foramen I Maxillary Foramen I1 Foramen palatinus minus anterior Foramen palatinus minus posterior Foramen ovale double Foramen pterygoideus Preoptic Sutures Preorbital Foramen Foramen hypoglossi Parted Frontal
Means
0.85 0.53
0.52 0.68 0.62 0.69 0.27 0.17 0.56 0.50 0.96 0.87 0.41 0.14 8.78 0.69 0.41 0.43 0.19 0.42 0.37 0.15 0.54 0.48
8 0.91 0 0.67
0.52 0.68 0.21 0.56 0.34 0.38 0.77 0.38 0.17 0.42 0.53
** 0.92
** 0.54 0.68 0.29 0.48 0.91 0.37 0.81 0.41 0.23 0.42 0.55
**
* * *
* * * *
* P < 0.05. * * P < 0.01.

SKELETAL TRAITS I N MICE 113
the analysis. Cochran’s Q-test was used to test for sex differences in the parents and the 1- and 3-month offspring groups, using only those offspring from sub- litters in which both a male and female were present. Only one (mandibular foramen, 3 months) of the 33 tests reached significance (P<O.Ol), the incidences for males and females in this case being presented separately in Table 2. Chi- square tests for proportions in independent samples ( SNEDECOR and COCHRAN 1973) were used to test for sex differences in the 5-month offspring group because most of these sublitters consisted of two individuals of the same sex, the few unlike-sexed sublitters being eliminated in these tests. Again, no significant differences for any of the 11 characters were found in this group. Incidences for males and females, therefore, are pooled in Table 2. The mean incidences for parents and 3- and 5-month offspring groups are similar (about 54%), although that for the l-month group is about 6% lower.
To test for age differences among the offspring, a two-way analysis of variance without replication was performed on values obtained from an angular transfor- mation (SNEDECOR and COCHRAN 1973) of the frequencies from each sublitter. Seven of the eleven traits reached significance with the levels of significance for these traits being indicated in Table 2. The significant offspring age differences in the incidences of the traits are generated primarily by the differences between the one uersus the three and five-month groups. A preliminary multivariate dis- criminant analysis using the BMD07M program ( DIXON 1971 ) also confirmed both the pattern and significance of an age, but not a sex, difference.
Variances of a quasi-continuous trait in two groups may be compared if the trait exhibits 3 or more character states (FALCONER 1960). The standard devi- ation of the trait is considered roughly proportional to the distance between two thresholds as calculated from a probit transformation and expressed in standard deviation units, The squared ratio of the distances between the thresholds in two populations then approximates an F value. By scoring bilateral traits on a per individual basis, rather than per side, three possible character states for each individual may be recorded. In this manner, the variances of the bilateral and multi-state characters were tested between parents and off spring, ages, and sexes, and were found to be homogeneous.
Heritability estimates, calculated by maximum likelihood correlation, for each of the 11 traits were made using male and female parents separately with each of the 3 age groups of offspring. These estimates for each age were calculated from contingency tables constructed from the scores of the parents and each of the parents’ two offspring, the sample sizes for these estimates being twice the number of families (Table 1) used. Because the trait mandibular foramen (at 3 months) showed significant differences in incidence between sexes (Table 2), estimates for this trait were first made using daughters with dams and sons with sires. Because these estimates were not significantly different, both sexes of off- spring were pooled in this and subsequent heritability estimates for this trait. The heritability estimates fo r each trait were tested for differences among ages by Chi-square tests of the correlation coefficients (SNEDECOR and COCHRAN 1973).
114 S. G . SELF AND L. LEAMY
Because none of the tests reached significance, pooled estimates were obtained by combining the off spring over all ages and then recalculating a correlation coeffi- cient; for those traits with significant differences in incidence among ages, the single correlation coefficients were pooled (using Fisher’s r- to z transformation). This procedure was used in pooling all subsequent heritability estimates over ages. The estimates range from -0.11 to 0.85 with the overall level being about 0.27. This level, however, is somewhat inflated by the high heritability of a single trait (preoptic sutures), and drops from 0.20 to 0.14 (male parent estimate) and from 0.34 to 0.30 (female parent estimate) if this trait is excluded.
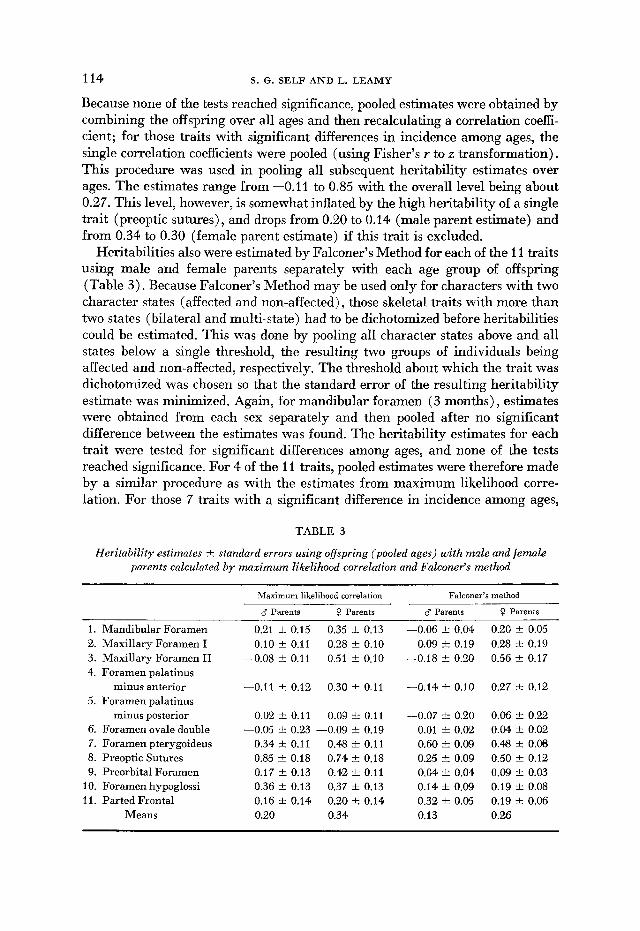
Heritabilities also were estimated by Falconer’s Method for each of the 11 traits using male and female parents separately with each age group of offspring (Table 3). Because Falconer’s Method may be used only for characters with two character states (affected and non-affected), those skeletal traits with more than two states (bilateral and multi-state) had to be dichotomized before heritabilities could be estimated. This was done by pooling all character states above and all states below a single threshold, the resulting two groups of individuals being affected and non-affected, respectively. The threshold about which the trait was dichotomized was chosen so that the standard error of the resulting heritability estimate was minimized. Again, for mandibular foramen (3 months), estimates were obtained from each sex separately and then pooled after no significant difference between the estimates was found. The heritability estimates for each trait were tested for significant differences among ages, and none of the tests reached significance. For 4 of the 11 traits, pooled estimates were therefore made by a similar procedure as with the estimates from maximum likelihood corre- lation. For those 7 traits with a significant difference in incidence among ages,
TABLE 3
Heritability estimates k standard errors using offspring (pooled ages) with male and female parents calculated by maximum likelihood correlation and Falconer’s method
1. 2. 3. 4.
5.
6. 7. 8. 9.
IO . 11.
Maximum likelihood correlation Falconer’s method
9 Parents d Parents $’ Parents d Parents
Mandibular Foramen 0.21 t 0.15 0.35 t 0.13 -0.06 F 0.04 0.20 F 0.0’5 Maxillary Foramen I Maxillary Foramen I1 Foramen palatinus
minus anterior Foramen palatinus
minus posterior Foramen ovale double Foramen pterygoideus Preoptic Sutures Preorbital Foramen Foramen hypoglossi Parted Frontal
Means
0.10 f 0.11 -0.08 t 0.11
-0.11 t 0.12
0.02 t 0.11 -0.05 F 0.23
0.34 t 0.11 0.85 t 0.18 0.17 f 0.13 0.36 t 0.13 0.16 k 0.14 0.20
0.28 -+ 0.10 0.51 f 0.10
0.09 F 0.19 -0.18 f 0.20
0.30 t 0.11 -0.14 F 0.10
0.03 t 0.11 -0.09 F 0.19
0.48 f 0.11 0.74 t 0.18 0.42 F 0.11 0.37 t 0.13 0.20 t 0.14 0.34 0.13
-0.07 k 0.20 0.01 F 0.02 0.60 f 0.09 0.25 2 0.09 0.04 F 0.04 0.14 F 0.09 0.32 t 0.05
0.28 f 0.19 0.56 f 0.17
0.27 f 0.12
0.06 t 0.22 0.04 f 0.02 0.48 t 0.08 0.50 t 0.12 0.09 F 0.03 0.19 t 0.08 0.19 t 0.06 0.26

SKELETAL TRAITS IN MICE 115
however, a weighted mean of the single regression coefficients was calculated with the reciprocal of the sampling variance being the weight of each value (FALCONER 1965). These estimates are presented in Table 3 and range from -0.18 to 0.60 with the overall level being about 0.20. As with the maximum likelihood method, female parent estimates are generally higher (by about 13%) than male parent estimates.
Although the trend of a higher heritability with female rather than with male parents is generally considered to be due to maternal effects (FALCONER 1960; HANRAHAN and EISEN 1973), most of the estimates for the individual skeletal traits using male and female parents are not significantly different. Heritability estimates, therefore, also were calculated for each of the 11 traits using each age group of offspring with mid-parent by both maximum likelihood correlation and Falconer’s Method. In addition, as explained previously, it was possible to calcu- late heritabilities from regression of off spring on mid-parent. The estimates for each trait were tested for differences among ages by analysis of covariance (regression method estimates) , by all painvise Student t-tests (Falconer’s Method estimates) and by Chi-square tests (maximum likelihood estimates) and, again, no significant differences were found. The estimates presented in Table 4, there- fore, represent values obtained from pooling over all ages. The maximum likeli- hood estimates range from 0.06 to 0.45, the overall level (0.20) actually being the same as that for previous estimates using male parents. Thus, they do not appear to be inflated by maternal effects, and considering the improvement in the magnitudes of the standard errors, probably represent the best estimates of heritability. The overall levels of heritability from all three methods are very close (0.17-0.20) with the individual estimates calculated from regression being quite similar to those from the maximum likelihood method.
The correlation between full sibs is an estimate of ( 1/2VA + 1/4VD 4- V,,) /Vp
TABLE 4
Heritability estimates rir standard errors using offspring (pooled ages) with mid-parent calculated b y regression, maximum likelihood correlation, and Falconer’s method
1. Mandibular Foramen 2. Maxillary Foramen I 3. Maxillary Foramen I1 4. Foramen palatinus minus anterior 5. Foramen palatinus minus posterior 6. Foramen ovale double 7. Foramen pterygoideus 8. Preoptic Sutures 9. Preorbital Foramen
I O . Foramen hypoglossi 11. Parted Frontal
Means
Maximum likelihood correlation
0.24 f 0.09 0.15 f 0.07 0.21 f 0.07 0.21 t 0.08 0.06 f 0.07 0.19 f 0.12 0.16 t 0.08 0.45 2 0.14 0.16 +- 0.09 0.21 t 0.09 0.19 t 0.10 0.20
Regression
0.21 f 0.07 0.15 t 0.07 0.18 f 0.07 0.08 f 0.06 0.02 2 0.06 0.02 f 0.08 0.22 t 0.05 0.46 f 0.10 0.08 f 0.06 0.35 I- 0.09 0.15 f 0.07 0.17
Falconer’s method
0.03 t 0.10 0.22 f 0.10 0.32 t 0.07 0.03 f 0.03
0.03 f 0.03 0.47 t 0.06 0.26 f 0.05 0.11 t 0.06 0.16 t 0.15 0.31 f 0.08 0.18
-0.08 t 0.16

116 S. G. S E L F A N D L. LEAMY
(FALCONER 1960), where Vn is the additive genetic variance, Vo is the dominance variance, V,, is the variance due to the common environmental effects, and V p is the total phenotypic variance. If the dominance variance is ignored, common environmental effects may be estimated by subtracting 1/2 of the heritability from this value. Estimates of common environmental effects are typically con- sidered to estimate maternal effects although other factors such as cage effects may contribute to the VEc. Therefore, such estimates of maternal effects should be considered upper limits. Contingency tables for each age of offspring in each of the 11 traits were constructed from the scores of the first and second individuals in each sublitter, the first individual being chosen at random. Maximum likeli- hood correlations were calculated from these tables and tested by Chi-square for age differences. Because no significant age differences were found, the values were pooled over ages by the same procedure that was used in pooling heritability estimates over ages. These correlations between full sibs for each trait are pre- sented in Table 5 , their overall level being about 0.18. One-half of the best esti- mates of heritability (maximum likelihood estimates using mid-parent) were subtracted from these values to estimate maternal effects. These estimates of maternal effects also are presented in Table 5 , and range from 0 (two negative values set at 0) to 0.16 with a mean level of 0.08.
DISCUSSION
The general pattern of differences in the incidences of the quasi-continuous skeletal traits among ages is very similar to the pattern in the means of con- tinuous skeletal traits previously found in this same population of mice (LEAMY 1974). This is to be expected for continuous traits, since far more growth occurs from one to three months than from three to five months of age. This pattern of growth also can be used to explain changes in the incidences of quasi-continuous
TABLE 5
Maximum likelihood correlation coeficienis f standard errors between full sibs (pooled ages) and estimates of maternal effects for the 11 skeletal traits
Correlation coeff. Maternal efiects
1. Mandibular Foramen 2. Maxillary Foramen I 3. Maxillary Foramen I1 4. Foramen palatinus minus anterior 5. Foramen palatinus minus posterior 6. Foramen ovale double 7. Foramen pierygoideus 8. Preoptic Sutures 9. Preorbital Foramen
IO. Foramen hypoglossi 11. Parted Frontal
Means
0.16 * 0.10 0.17 f 0.07 0.26 & 0.07 0.21 f 0.08 0.14 * 0.08 0.09 k 0.13 0.17 -C 0.08 0.36 f 0.14 0.w * 0.10 0.24 -C 0.03 0.15 2 0.09 0.18
0.M 0.10 0.16 0.10 0.11 0.00 0.09 0.14 0.00 0.14 0.06 0.08

SKELETAL TRAITS IN MICE 117
traits with age, especially those traits (such as parted frontals) that involve gaps or fusions between bones that are growing throughout the period in which the change in incidence of the trait is observed. The traits involving the presence or absence of foramina, however, are basically variations in the degree and position of branching in the vascular system (FROUD 1959) and/or peripheral nerves which have happened to leave their mark on the associated skeletal structure (GRUNEBERG 1963). A change in incidence of this type of quasi-continuous skeletal trait with age, therefore, implies a change in the corresponding non- skeletal structure. Because the change in incidence for both types of traits (by whatever mechanism) occurs primarily before three months, however, the assumption of age independence that often has been made for wild mammalian populations (BERRY 1963; PATTON 1975) probably is valid since only adult individuals typically are included in such samples.
Fortunately, significant age differences in the incidences of the traits did not generate differences among the single heritability estimates, so that pooling was possible. Also, since most of the individual estimates using male and female parents separately were not significantly different, mid-parent estimates could be made. This resulted in an improvement of the mean levels of the standard errors from about 13% (for single parent estimates) to about 8%. The standard errors of the estimates calculated by Falconer’s Method were comparable to those from the maximum likelihood method but varied more. Presumably this is because the sampling variance for Falconer’s Method depends on both the sample size and the overall incidence of the trait.
The maximum likelihood estimates of heritability are probably the most reliable because the basic assumption in using the method (underlying normal distribution with thresholds imposed upon it) is identical to the “biological” assumpton of the mode of inheritance of quasi-continuous traits. In addition, a test of this assumption is provided at the same time the estimate is made. I t is interesting to note that none of these Chi-square tests came close to significance.
The estimates from regression yielded surprisingly reasonable, and easily cal- culated, values by comparison with the maximum likelihood estimates, this in spite of the normal distribution approximation. This suggests that given a sampling scheme which allows the pooling of enough individuals (and sides for bilateral traits) to achieve at least 5 character states, simple regression (after appropriate transformation) will result in estimates comparable to those from much more complicated methods. However, if only regression on mid-parent may be calculated, maternal effects must be assumed to be not significant.
The overall levels of heritability of the skeletal traits calculated from Falconer’s Method were comparable to the other mid-parent estimates, but for single parent estimates, were slightly lower than those from the maximum likelihood method. This difference can in part be attributed to the difference between an estimate of the correlation between scores on the underlying variate (maximum likelihood estimate) and an estimate of the correlation between scores on the observable variable (such as from Falconer’s Method). RUTLEDGE (1977) has compared

118 S . G. SELF A N D L. LEAMY
these two types of estimates and found the latter to yield lower values. If the levels of heritability from Falconer’s Method are systematically lower than those from the maximum likelihood method, the relatively higher level of the mid- parent estimates may be due to inflation from maternal effects. The individual estimates from Falconer’s Method varied more than those from the other methods presumably because of the loss of information from dichotomizing multi-state characters, and because of the differences in the sampling scheme from that for which the method was originally devised (human populations).
Insofar as is known, this is the first time that heritabilities of quasi-continuous skeletal traits in randombred mice have been estimated. Heretofore it has been assumed that differences in the incidences of these traits among wild mammalian populations reflected genetic differences, this assumption being based on evidence from inbred strains. Heritabilities of these traits significantly different from zero from a randombred population, therefore, provide further support for this assumption.
The general low level of heritability exhibited by most of the 11 traits usually is associated with major fitness traits (FALCONER 1960). However, considering the origin of this population (approximately 52 generations removed from an inbred strain), there may not have been sufficient time for more genetic vari- ability to be generated. Because the rates of accumulation of genetic variability for quasi-continuous skeletal traits are well documented ( GREWAL 1962; HOI-SEN 1972), it is possible to estimate the level of heritability that should have been generated and compare this value with the general level found in this study. Since approximately 0.01 “mutational events” occur per character per generation (DEOL et al. 1957; HOI-SEN 1972), 0.52 events per character are expected to have occurred since the origin of the population. Moreover, each event has an average effect of approximately 0.61 standard deviation units (HOI-SEN 1972), or 0.37 of the variance within an inbred strain. Therefore, if one assumes that the total variance for these characters in this randombred population is approximately equal to the variance within an inbred strain, the expected level of heritability is (0.37) x (0.52) or 0.194. Obviously this is a big assumption, but when made, the expected level is surprisingly close to that generated (0.20) in this study. If it is assumed that the variance of the randombred population is larger than that of the inbred strain, however, the resulting expected level of heritability will be even lower. Therefore, the level of heritability found in this study does not seem unreasonably low when compared with these expected level.
The general level of heritability of the quasi-continuous traits also may be compared to that previously found for continuous skeletal traits in these same mice (LEAMY 1974). The overall level of heritability for continuous skeletal traits was found to be slightly over twice (0.41) that for the 11 quasi-continuous skeletal traits. However, these continuous traits exhibit moderate to high genetic correlations (LEAMY 1977), so that a single mutation would be expected to affect more than a single trait, whereas the 11 quasi-continuous traits exhibited low phenotypic (and presumably genetic) correlations. Therefore, by comparison

SKELETAL TRAITS IN MICE 119
with continuous skeletal traits and assuming approximately equal mutation rates for both types of traits, the general low level of heritability found for the quasi- continuous characters, again, does not seem unreasonable.
Maternal effects on the 11 skeletal traits were evident from both the higher heritability estimates from female parents (compared with male parents) , and the inflated full-sib correlations. SEARLE ( 1954a) found evidence for significant maternal effects acting through such factors as maternal age, parity, litter size, and length of gestation, in 14 of the 21 skeletal variants he utilized. The total maternal impact averaged over these variants, however, amounted to only about 10% of the total variation, in excellent agreement with the level (8%) found in this study. The maternal diet apparently plays a large role in generating maternal effects, and a change in diet is sufficient to alter considerably the maternal contri- bution (SEARLE 1954b; DEOL and TRUSLOVE 1957).
We should like to thank DRS. ROBERT CLOVER and RONALD KROMAN for their suggestions and comments during the preparation of this manuscript, MELISSA JEAN SELF for her assistance in collecting the data, and DR. MARY SMOKE for statistical advice. The work was supported in part by a faculty grant awarded by the Long Beach, California State University Foundation on recommendation of the University Research Committee.
LITERATURE CITED
BERRY, R. J., 1963 Epigenetic polymorphism in wild populations of Mus musculus. Genet. Res. 4: 193-220. - , 1964 The evolution of an island population of the house mouse. Evolution 18: 468-483. -- , 1968 The Biology of Non-metrical Variation in Mice and Men. pp. 103-133. In: The Skeletal Biology of Earlier Human Populations. Edited by D. R. BROTHWELL. Pergamon Press, London. - , 1969 Non-metrical variation in two Scottish colonies of the Grey seal. J. Zool. 157: 11-18.
BERRY, R. J. and P. E. DAVIS, 1970 Polymorphism and behavior in the Arctic skua. (Stercorarius paraisticus (L.)). Proc. Roy. Soc. 175: 255-267.
BERRY, R. J. and M. E. JAKOBSON, 1974 Vagility in an island population of the house mouse. J. Zool. 173: 341-354. -, 1975 Ecological genetics of an island population of the hmse mouse (Mus musculus). J. Zool. 175: 523-540.
BERRY, R. J. and A. G. SEARLE, 1963 Epigenetic polymorphism in rodents. Proc. Zool. Soc. Lond. 140: 577-615.
BROTHWELL, D. R., 1958 The use of non-metrical characters of the skull in differentiating populations. Dt. Ges. Anthrop. 6: 103-109.
DEOL, M. S., 1955 Genetical studies on the skeleton of the mouse. XIV. Minor variations of the skull. J. Genet. 53: 498-602.
DEOL, M. S., H. GRUNEBERG, A. G. SEARLE and G. M. TRUSLOVE, 1957 Genetical differentiation involving morphological characters in an inbred strain of mice. I. A British branch of the C57BL strain. J. Morph. 100: 345-375.
DEOL, M. S. and G. M. TRUSLOVE, 1957 Genetical studies on the skeleton of the mouse. xx. Maternal physiology and variation in the skeleton of C57BL mice. J. Genet. 55: 288-312.
DIXON, W. J. (Ed.), 1971 BMD Biomedical Computer Programs. University of California Press, Los Angeles.
EDWARDS, 5. H., 1969 FALCONER, D. S., 1960
Familial predisposition in man. Br. Med. Bull. 25: 58-64. Introduction to Quantitative Genetics. Ronald Press, New York. --,
1965 The inheritance of liability to certain diseases, estimated from the incidence among relatives. Ann. Hum. Genet. 29: 51-76. __ , 1967 The inheritance of liability €0 dis-
120 S. G. S E L F AND L. LEAMY
eases with variable age of onset with particular reference to diabetes mellitus. Ann. Hum. Genet. 31 : 1-20.
Studies on the arterial system of three inbred strains of mice. J. Morph.
The rate of genetic divergence of sublines in the C57BL strain of mice.
The Pathology of Deuelopment. Wiley, New Yolk.
FROUD, M. D., 1959
GREWAL, M. S., 1962
GRUNEBERG, H., 1963 HANRAHAN, J. P. and E. J. EISEN, 1973
104: 441-478.
Genet. Res. 3: 226-237.
Sexual dimorphism and direct and maternal genetic
Inheritance of skeletal polymorphism in Microtus callfornicus. Heredity
Is subline differentiation a continuing process in inbred strains of mice? Genet. Res. 19: 53-59.
The Advanced Theory of Statistics Vol. 2. Hafner Pub. Co., New York.
Heritability of osteometric traits in a randombred population of mice. J. Heredity 65: 109-120. - , 1977 Genetic and environmental correlations of morpho- metric traits in randombred house mice. Evolution 31: 357-369.
Multifactorial qualitative traits: Genetic analysis and prediction of recurrence risks. Biometrics 30: 41-57.
Genetic and morphological divergence among introduced rat populations (Rattus rattus) of the Galapagos Archipelago, Ecuador. Syst. ZOO.
Morphological variation in the cranium and mandible of the white-tailed deer (Odocoileus virginianus) : A comparative study of geographical and four biological distances. J. Morph. 128: 95-112.
effects on body weight in mice. Theoret. Appl. Genet. 43: 39-45. HILBORN, R., 1974
33: 87-89. HOI-SEN, Y., 1972
KENDELL, M. G. and A. STUART, 1963
LEAMY, L., 1974
MENDELL, N. R. and R. C. ELSTON, 1974
PATTON, J. L., S. Y. YANG and P. MYERS, 1975
24: 296-310. REES, J. W., 1969
RUTLEDGE, J. J., 1977 SEARLE, A. G., 1954a
Repeatability of threshold traits. Biometrics 33: 395-399. Genetical studies on the skeleton of the mouse. IX. Causes of skeletal
variation within pure lines. J. Genet. 52: 68-102. - , 19541, Genetical studies on the skeleton of the mouse. XI. The influence of diet on variation within pure lines. J. Genet. 52: 413-424.
Statistical Methods. The Iowa State University Press, Ames, Iowa.
Biometry. W. H. Freeman and Co., San Francisco, California.
The maximum likelihood estimation of correlation from contingency tables. Biometrics 18: 342-353.
Genetical studies on the skeleton of the mouse. V. Interfrontal and Parted Frontals. J. Genet. 51: 115-122. -, 1954 Genetical studies on the skeleton of the mouse. XIII. Variations in the presphenoid. J. Genet. 52: 589-602. __ , 1961 Genetical studies on the skeleton of the mouse. XXV. A search for correlations between some minor variants. Genet. Res. 2: 431-438.
Quaniitatiue Genetics in Sheep Breeding. Cornell
Polydactylous guinea pigs. Two types respectively heterozygous and homo- 19341, An analysis of
Corresponding editor: J. F. KIDWELL
SNEDECOR, G. W. and W. G. COCHRAN, 1973
SOKAL, R. R. and F. J. ROHLF, 1969
TALLIS, G. M., 1962
TRUSLOVE, G. M., 1952
TURNER, H. N. and S. S. Y. YOUNG, 1969 University Press, Ithaca, New York.
zygous in the same mutant gene. J. Hered. 25: 359-362. variability in number of digits in an inbred strain of guinea pigs. Genetics 19: 506-536.
WRIGHT, S., 1934a -- ,