Low heritability-high variance controversy for dairy...
35
Department of Animal Breeding and Genetics Low heritability-high variance controversy for dairy cattle disease traits Maja Winther Iversen Examensarbete / Swedish University of Agricultural Sciences Department of Animal Breeding and Genetics 448 Uppsala 2014 Master’s Thesis, 30 hp Master’s Programme – Animal Science
-
Upload
phungtuong -
Category
Documents
-
view
220 -
download
0
Transcript of Low heritability-high variance controversy for dairy...
Department of Animal Breeding and Genetics
Low heritability-high variance controversy for dairy cattle disease traits Maja Winther Iversen
Examensarbete / Swedish University of Agricultural Sciences Department of Animal Breeding and Genetics
448
Uppsala 2014
Master’s Thesis, 30 hp
Master’s Programme – Animal Science

Department of Animal Breeding and Genetics
Low heritability-high variance controversy for dairy cattle disease traits Maja Winther Iversen Supervisor: Hossein Jorjani, SLU, Department of Animal Breeding and Genetics
Examiner: Erling Strandberg, SLU, Department of Animal Breeding and Genetics Credits: 30 HEC Course title: Degree project in Animal Science Course code: EX0556 Programme: Master’s Programme – Animal Science Level: Advanced, A2E Place of publication: Uppsala Year of publication: 2014 Name of series: Examensarbete / Swedish University of Agricultural Sciences Department of Animal Breeding and Genetics, 448 On-line publication: http://epsilon.slu.se Key words: Coefficient of variation, genetic variance, health traits, heritability, progeny groups


1
Low heritability-high variance controversy for dairy cattle disease traits
CONTENTS
Abstract ............................................................................................................................................ 2
Introduction ...................................................................................................................................... 3
Litterature Review ............................................................................................................................ 3
Disease, fertility and fitness traits ................................................................................................ 3
Disease Traits ........................................................................................................................... 3
Fertility traits ............................................................................................................................ 4
Fitness traits .............................................................................................................................. 4
Variation of traits.......................................................................................................................... 4
Genetic resemblance of relatives .............................................................................................. 5
Within-family variance versus between-family variance ......................................................... 5
Coefficient of variation ............................................................................................................ 5
Aim of study ................................................................................................................................. 6
Materials and Methods ..................................................................................................................... 7
Data .............................................................................................................................................. 7
Statistical analysis ........................................................................................................................ 8
Results ............................................................................................................................................ 10
Coefficients of variation for all traits ......................................................................................... 10
Trait categories ........................................................................................................................... 12
Year trends ................................................................................................................................. 14
Coefficients of variation (CV) and heritability .......................................................................... 17
Discussion ...................................................................................................................................... 19
Validity of coefficients of variation with different means ......................................................... 19
Coefficients of variation for all traits ......................................................................................... 19
Trait categories ........................................................................................................................... 20
Year trends ................................................................................................................................. 21
Coefficients of variation and heritability .................................................................................... 22
Conclusion .................................................................................................................................. 23
References ...................................................................................................................................... 24
Appendices ..................................................................................................................................... 27
Appendix 1 ................................................................................................................................. 27
Appendix 2 ................................................................................................................................. 29

2
ABSTRACT
Traits with low heritability estimates such as health and fertility are often assumed to have low
genetic variance. However, the heritability is a ratio of additive genetic variance over all variance,
and thus, the genetic variation of these traits may only be proportionally small. Health in dairy
cattle is important, not only in its own right but also for human health and animal welfare. The
coefficient of variation (CV) can be used to express genetic variance without units, allowing for
comparison between traits regardless of their measurement units, in the same way heritability can
be used. The CV is the standard deviation of the trait divided by the mean. In addition, the use of
within-family variances may allow for more accurate investigation of genetic variance, because
when within-family variances are large, between family variance (which is the basis for
heritability estimation) is low. However, for international genetic and genomic evaluations,
phenotypic measurements are not always available.
Therefore, the aim of this study was to investigate the usefulness of using CV for observations
based on estimated or relative breeding values (EBV/RBV), and to investigate whether the low
heritability seen for health traits, is related to low genetic variance, as defined by CV. Data for
Brown Swiss cattle from 6 countries available from the Interbull evaluation of April 2014 were
used and CV was calculated for within sire family variances and for the population as a whole
based on international estimated breeding values (IEBV) using SAS 9.3. The breeding values
were standardised differently for different countries, and were separated accordingly. However,
there are reasons to believe that the interpretation of the results may be complicated because of
this, and thus the validity of the CV for this evaluation may not be justified. If this is ignored for
the time being, the following results were found. For all traits, population CVs were larger than
sire-family CVs. Traits had either means for breeding values of 100 or 0 depending on the
country, but there was no correlation between these two types of means for individual traits.
Differences were found between countries for overall mean CV. Differences between different
categories of traits (e.g. calving, fertility, production) were found, with production and fertility
traits having the lowest overall CV across countries. Within countries, ranking of trait categories
were somewhat different, but generally workability and udder health traits had high CVs. No
significant correlations were found between the CV of traits and their heritability estimates,
except when separating traits by country. This was only significant for Germany-Austria. Overall,
the CV is useful for comparing the variance of traits with different measurement units. However,
because of the nature of the breeding values in this study, it may not be appropriate to use the CV.
Therefore, it is concluded that CV, although useful in itself, is not a good approach when
evaluating relative breeding values across countries.
3
INTRODUCTION
Traits that are related to health often have low heritability estimates and it is often assumed that
this means that there is low genetic variance for these traits. Health is an element of fitness and in
theory, favourable alleles for fitness traits will be driven to fixation by natural selection and thus
the additive genetic variance is expected to be greatly reduced (Cotter et al., 2004, Kruuk et al.,
2000). This appears not to be the case in real life however, and could be due to trade-offs with the
maintenance of variation for these traits (e.g. antagonistic pleiotropy) (Cotter et al., 2004).
Examples of fitness-related traits are diseases in livestock which affect not only animal
productivity and welfare, but also human health (Jovanovic et al., 2009). Animal breeding has
focused largely on production traits such as milk, meat and egg production, which has likely
affected the livestock population’s ability to resist or tolerate disease (Jovanovic et al., 2009).
The hypothesis of antagonistic pleiotropy suggests that, even with strong selection for other
traits, e.g. artificial selection for production traits, genetic variation in traits related to fitness
should still be maintained (Cotter et al., 2004). If an animal is infected and die before it
reaches reproductive age, its direct fitness is eliminated (Cotter et al., 2004). Therefore,
maintaining variance for traits related to fitness is important for the population’s survival.
LITTERATURE REVIEW
Disease, fertility and fitness traits
In general, traits associated with fitness, such as disease and fertility, have low heritability
estimates, and selection for traits with low heritability is difficult because the accuracy of
selection is limited by the information available in the nucleus (Shook, 1989, Hansen Axelsson et
al., 2011). On the other hand, the heritability is the ratio of additive genetic variance over
phenotypic variance, and therefore a low heritability may simply be because of the large
environmental variance associated with these traits, and if scaled differently, they may actually
have larger genetic variance than many production traits (Barton and Keightley, 2002, Philipsson,
1981, Shook, 1989). Indeed, other scientists have arrived at the conclusion that the environmental
variance of for example fitness traits is much higher than for morphological and production traits
and thus the heritability is lower, but when scaled in relation to the mean and thus removing units
of measurement, the genetic variance is higher (Barton and Keightley, 2002, Houle, 1998, Kruuk
et al., 2000). In order to quantify true genetic variation in for example resistance to disease, it is
necessary to account for the impact of environmental factors (Bishop and Woolliams, 2010). The
accuracy of measurements is also important, because when measuring disease resistance, the
heritability is often underestimated if the specificity and sensitivity of the diagnostic test is not
perfect (Bishop and Woolliams, 2010).
Disease Traits
In terms of genetic diseases, such as dwarfism and congenital chondrodystrophy, a popular
hypothesis suggests that in the population at large, the alleles responsible for common diseases are
quite common (Pritchard, 2001). On the contrary, Cirulli and Goldstein (2010) reported that rare
and deleterious variants have a strong influence on the risk of common diseases. Sometimes, a
4
large effect for a rare allele will cause genetic variation to be small, but this is very difficult to
examine in practice (Yang et al., 2010). Shook (1989) suggest that a large number of loci are
likely involved in disease resistance since there is a large array of disease resistance mechanisms.
Research suggests that disease outbreaks are less likely in populations where there is great
heterogeneity (Beldomenico and Begon, 2010). Indeed, the increase in homozygosity with
ensuing inbreeding depression supports the idea that heterozygosity is advantageous for traits
related to fitness (Charlesworth and Charlesworth, 1999, Thoß et al., 2011). Correlations between
individual heterozygosity and fitness-related traits have been seen in many species over several
decades, especially with regards to MHC heterozygosity and fitness, but the association may be
difficult, if not impossible, to prove using statistical methods because of confounding with
genome-wide heterozygosity and inbreeding (Kardos et al., 2014, Thoß et al., 2011).
Fertility traits
Fertility traits are important components of fitness in dairy cattle because an animal’s ability to
become pregnant determines its usefulness for breeding, and also for producing milk. The
heritability of fertility traits is usually low (1-5%), but several researchers have concluded that the
additive genetic variance is quite high (Philipsson, 1981). Philipsson (1981) suggest that better
estimates of true genetic variation may be found by studying progeny-group means or estimated
breeding values of bulls for daughter fertility.
Fitness traits
Fitness traits is an overarching term used to describe an animal’s ability to pass on its genes to the
next generation, and therefore include traits related to health, disease resistance and fertility.
These traits are often affected by other classes of traits such as conformation and behavioural
traits, and because these have an underlying variation, the additive genetic variance of fitness
traits is maintained even at equilibrium (Price and Schluter, 1991). This can be explained by a
scenario in which a conformation trait (e.g. size) affects the behaviour of an animal (e.g. feed
intake) which may in turn affect a trait related to fitness (e.g. fertility), and this adds ‘extra’
environmental variance along the chain, which will in turn make the additive genetic variance for
the fitness trait proportionally small, resulting in low heritability estimates (Price and Schluter,
1991).
Opposite to what is found for studies looking at heritability, when taking measures standardized
by the mean (e.g. the coefficient of variation, CV), traits related to fitness are more variable than
morphological traits (Houle, 1992).
Variation of traits
The degree to which most traits are inherited depends on how much the trait is affected by
genetics and how much it is affected by environmental factors (Shook, 1989, Hill and Mulder,
2010, Shen et al., 2012). However, the genetic variation of a trait also plays a role because,
intuitively, low variation means that regardless of what parents an individual has it will likely not
be much different than other animals in the same environment. Thus, the degree to which an
individual resembles its parents more than other individuals is to some degree affected by the
genetic variation of a particular trait.

5
Genetic resemblance of relatives
Segregation and linkage are random processes that affect the number of alleles that are identical
by descent (IBD) and determines the resemblance between relatives. The number of IBD alleles is
also the basis when estimating additive genetic variance and heritability, as well as dominance
variance (Visscher, 2009). This is because in a non-inbred population, relatives share an expected
number of alleles IBD and this is expressed as the relationship coefficient, which is used to
estimate the additive genetic covariance between a pair of individuals (Visscher et al., 2006).
However, due to Mendelian sampling (MS), the proportion of IBD alleles varies greatly, as for
any given pair, the actual number of IBD alleles will deviate from the expectation (Hill, 2013,
Visscher et al., 2006). In addition, family members may be even more correlated than expected
because they share a common environment (Hill, 2013).
Inbreeding changes Mendelian segregation or within-family variance, and the intensity and
accuracy of the selection practiced changes the between-family variance (when the infinitesimal
model is considered) (Hill, 2010).
Within-family variance versus between-family variance
Traditional heritability estimates are based on between-family variance (Hill, 2013), and will
intuitively be high when within-family variance is low. If only within-family differences are used,
family effects are fixed, which eliminates errors due to common environment. The within-family
variance is σ2w= (1-A) σ2
A + σ2E, where A is the numerator relationship within families.
Phenotypic variance is σ2P= Aσ2
A + σ2C + σ2
w, where σ2C is the variance due to common
environment. The environmental variance is thus: σ2E= σ2
w - ½σ2A (Hill, 2013). The within-family
variance also accounts for half the total genetic variance (Wray et al., 2007), so it would make
sense to utilize it. A problem with within-family variance for full sib families is the high
confounding between additive and dominance effects (Hill, 2013). However, in general
dominance and epistatic effects are ignored when modelling disease because evidence indicates
that the genetic variance of disease is mainly additive, even when genes interact (Wray et al.,
2007). The standard error for within-family variances is smaller when a few large families are
used than when many small families are used for the calculations (Hill, 2013). One of the
conclusions by Charlesworth & Charlesworth (1999), was that family data may provide better
estimates of fitness than population studies.
Coefficient of variation
The traditional estimation of heritability may not give a fair picture of the genetic variance of a
particular trait. The reason for using the coefficient of variation (CV) is so that values from
different populations can be compared (regardless of environmental variance), based on the
assumption that two variables, X and Y, are actually identical (be that a value or a distribution),
except that Y is k times as large as X ( i.e. Y=kX) (Lewontin, 1966). It may for example be of
interest to compare two populations for the same trait to see if one population is more or less
variable than the other, or compare different traits within a population that are measured on
different scales, which is where CV becomes convenient. The coefficient of variation is the
standard deviation divided by the mean for that population (CV= s/ ̅) (Sokal and Rohlf, 1981).
Thus, the CV eliminates the units for traits and can therefore be used to compare distributions
based on different units of measurement (Abdi, 2010). However, the CV is only meaningful for

6
traits that have a real zero (i.e. 0 is a natural lower limit for the trait) (Abdi, 2010), and this may
thus be problematic for looking at breeding values rather than trait values. Houle (1992) argues
that standardizing by the mean is implicit when a character or trait is considered to be variable.
The CV can take on a value between 0 and √(N-1) for finite samples (where N is the sample size)
with non-negative numbers (Abdi, 2010). An F-test can be used to compare variation within and
between populations when CVs are <30% by using the squared CVs (Lande, 1977).
It is important to keep in mind that differences in CVs between traits can be due to many other
factors that are difficult to quantify, such as mutation or balancing selection for genetic CVs
(Houle, 1992). In addition, the extent to which CVs correct for the relationship between the
variances and the means determines its importance (Houle, 1992).
The idea to use of the CV for comparing genetic variation between traits of different distributions
and populations (Houle, 1992) is based on the convenience of this for phenotypic measurements,
where zero is the natural lower limit. There is a need for comparison of genetic variation across
traits and populations also for international and genetic and genomic evaluation. For this context,
a common concern would be whether the model for genomic evaluation of all countries for the
same trait (say protein yield for the six countries in the InterGenomics project (Jorjani et al.,
2012)) should contain the same level of polygenic effect. This is however, complicated by
phenotypic measurements not being available for international genetic and genomic evaluations,
and instead nationally estimated breeding values (EBV) and relative breeding values (RBV) are
used. These breeding values (EBV and RBV) are commonly standardized to a certain mean and
variance or have a mean of zero, unlike phenotypic measurements.
Aim of study
The aim of this study was therefore to look at the usefulness of using the coefficient of variation
(CV) for observations based on EBV and/or RBV. The purpose was to investigate the CV within
and between sire family EBV/RBV values for various traits related to health, in dairy cattle. The
degree to which the CV can be useful to determine whether traits with low heritability, such as
traits related to fitness, also have low genetic variance, was of special interest.

7
MATERIALS AND METHODS
Data
Data on the international estimated breeding values (IEBVs) of Brown Swiss cattle for various
traits (Table 1) that was available from Interbull evaluation of April 2014 were used for the
calculations.
Table 1. List of traits used for analysis with descriptions, category and number of countries with
records on the trait
Trait Category Description Nr of countries
with records
dce Calving Direct calving ease 3
mce Calving Maternal calving ease 3
ang Conformation Angularity 3
bde Conformation Body depth 5
cwi Conformation Chest width 6
fan Conformation Foot angle 6
ftl Conformation Front teat length 6
ftp Conformation Front teat placement 5
fua Conformation Fore udder attachment 6
hde Conformation Heel depth/hoof height 5
ocs Conformation Overall conformation score 6
ofl Conformation Overall feet and legs score 6
ous Conformation Overall udder score 6
ran Conformation Rump angle 6
rls Conformation Rear leg set 6
rtp Conformation Rear teat placement 5
ruh Conformation Rear udder height 6
ruw Conformation Rear udder width 6
rwi Conformation Rump width 4
sta Conformation Stature 6
ude Conformation Udder depth 6
usu Conformation Udder support 6
cc1 Fertility Lactating cow’s ability to conceive (1) 4
cc2 Fertility Lactating cow’s ability to conceive (2) 5
crc Fertility Lactating cow’s ability to recycle after calving 5
hco Fertility Maiden heifer’s ability to conceive 3
int Fertility Calving-conception interval 3
dlo Longevity Direct longevity 6
fat Production Milk fat 6
mil Production Milk yield 6
pro Production Milk protein 6
mas Udder health Clinical mastitis 6
scs Udder health Milk somatic cell 6
msp Workability Milking speed 4
Each dataset consisted of animal id, breed, trait, country, IEBV, reliability of IEBV, parent
average IEBV and parent average reliability. The datasets consisted of 177 country-trait
combinations and the pedigree consisted of 230,930 animals. Records were used for bulls born
from 1981 onwards according to Interbull’s data editing rules (Interbull Code of Practice,

8
http://www.interbull.org/ib/codeofpractice, accessed 2014-05-11). Only sires born from 1976
onwards, with at least 5 sons were included in the estimations of within-family variances to avoid
bias due to very small families. Full sib families were not considered because there were not
enough large full sib families. The IEBV for different countries may vary in size according to the
practice in that country. The value reported to Interbull can be the relative breeding value (RBV)
and is calculated as follows:
RBV= (
)*c+d, where a= mean EBV, b= standard deviation of EBV, c=standard deviation
of RBV and d=mean RBV, where c and d are set by the individual countries. Some countries set
d=100, which gives a mean value for EBVs of 100; others use zero, and consequently get a mean
value around zero (Fig. 1). Because the interpretation of CV values from EBV and RBV are
problematic, the countries were separated based on the mean value of IEBV.
Figure 1. Ranges for IEBV depends on the size of d. Choosing d with value 0 leads to a mean for IEBV
of 0. Choosing d=100 standardizes the values of IEBV and shortens the range. Neither is ideal for
coefficient of variance (CV) estimation.
Statistical analysis
All statistical analyses were performed in SAS 9.3 (SAS Institute Inc., 2011). The coefficient of
variation (CV) for the IEBVs of sons of each sire was estimated using PROC MEANS with IEBV
as the variable, weighted by reliability, and grouped by sire. Absolute values for CV were used for
further analysis for the traits with mean IEBV around 0, because it was the size of the CV, not the
sign that was of interest. The CVs were then grouped by the birth year (1976-2000) of the sire
(separate values for each country), weighted by number of sons for each sire, and the average for
each year was calculated. PROC MEANS was again used to calculate the mean CV for each birth
year regardless of country and then the mean value of CV for each trait was calculated.
Population CVs for each trait was estimated based on IEBVs for all animals in the dataset (born
1981-2005) for each respective trait, weighted by reliability and grouped by birth year and
country. Mean CV for each birth year across countries was estimated for each trait, and then the
mean of these values were taken as the single CV for each trait.
Where traits had mean IEBV of both 0 and 100 from different countries, PROC CORR was used
to test for correlations between these two CVs for each trait.

9
Further, the above analyses were done while keeping traits separated by country, in order to get a
CV for each trait for each country and year within country.
PROC GLM with Tukey’s t-test was used to test for differences between country mean CV and
for mean CV per trait category.
Traits within the same category (e.g. fertility, calving) were grouped and the mean CV for each
type of trait was estimated to investigate whether there were differences between the different
categories of traits and not simply on traits by themselves (both across and within countries).
Heritability estimates were extracted from the values reported from each country to the Interbull
Centre. The heritability estimate for each country-trait combination was paired with the respective
country-trait CV and the correlations between these were estimated using PROC CORR to
investigate if there was a relationship between them.

10
RESULTS
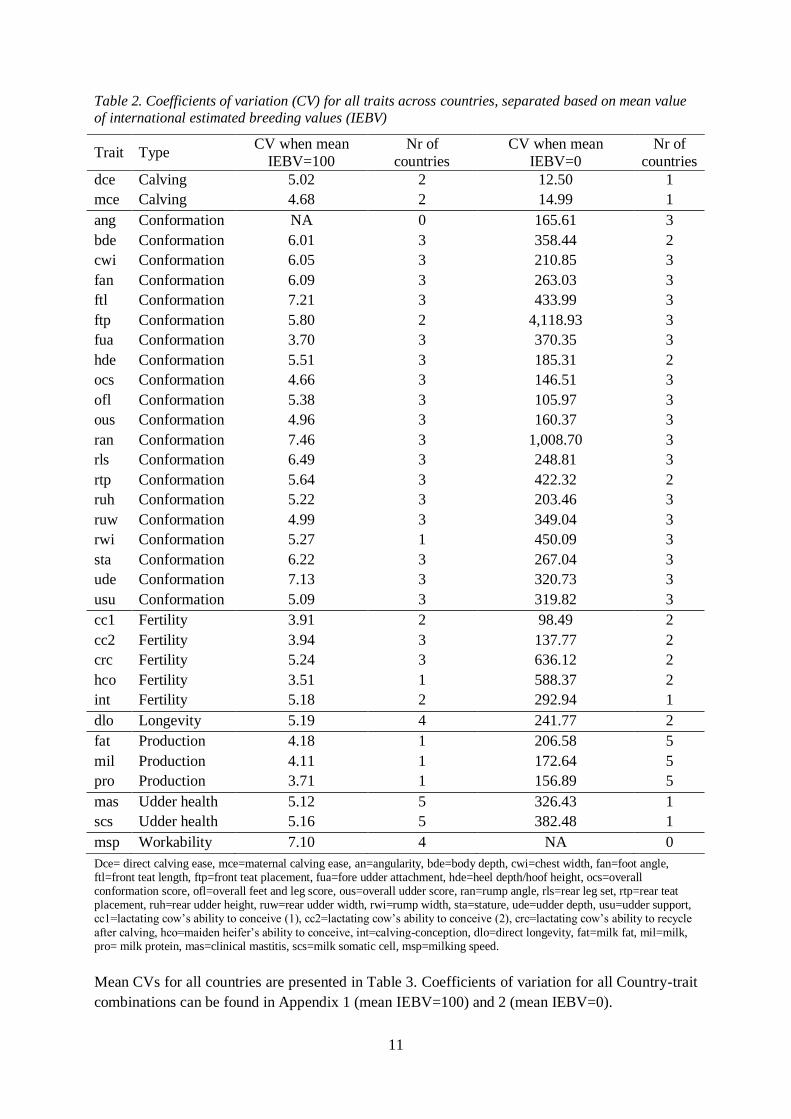
Coefficients of variation for all traits
Values for CV for each trait were similar when based on within sire-family variances (Appendix 1
and 2) and population variances (results not shown). All CVs based on sire families were lower
than population values and the difference between them was very similar across traits (mean
difference=0.91). Therefore, only sire-family estimates are presented here. Coefficients of
variation, averaged across countries, for all traits for both types of mean IEBV are presented in
Table 2 along with the number of countries with records for each trait. Within traits, there was no
significant correlation between CVs for mean IEBV=100 and mean IEBV=0 (r=0.20, p-
value=0.26). Calving, longevity and udder health traits appear to have similar CV estimates when
mean IEBV=100, whereas conformation traits have a much larger range. The largest CV under
mean IEBV=100 was found for ftl (front teat length) and ude (udder depth), both conformation
traits. The lowest CV was found for hco (maiden heifer’s ability to conceive), a fertility trait.
When mean IEBV=0, the highest CV was found for ftp (front teat placement) and ran (rump
angle), both conformation traits, and the lowest CV was found for the two calving traits (dce and
mce).
11
Table 2. Coefficients of variation (CV) for all traits across countries, separated based on mean value
of international estimated breeding values (IEBV)
Trait Type CV when mean
IEBV=100
Nr of
countries
CV when mean
IEBV=0
Nr of
countries
dce Calving 5.02 2 12.50 1
mce Calving 4.68 2 14.99 1
ang Conformation NA 0 165.61 3
bde Conformation 6.01 3 358.44 2
cwi Conformation 6.05 3 210.85 3
fan Conformation 6.09 3 263.03 3
ftl Conformation 7.21 3 433.99 3
ftp Conformation 5.80 2 4,118.93 3
fua Conformation 3.70 3 370.35 3
hde Conformation 5.51 3 185.31 2
ocs Conformation 4.66 3 146.51 3
ofl Conformation 5.38 3 105.97 3
ous Conformation 4.96 3 160.37 3
ran Conformation 7.46 3 1,008.70 3
rls Conformation 6.49 3 248.81 3
rtp Conformation 5.64 3 422.32 2
ruh Conformation 5.22 3 203.46 3
ruw Conformation 4.99 3 349.04 3
rwi Conformation 5.27 1 450.09 3
sta Conformation 6.22 3 267.04 3
ude Conformation 7.13 3 320.73 3
usu Conformation 5.09 3 319.82 3
cc1 Fertility 3.91 2 98.49 2
cc2 Fertility 3.94 3 137.77 2
crc Fertility 5.24 3 636.12 2
hco Fertility 3.51 1 588.37 2
int Fertility 5.18 2 292.94 1
dlo Longevity 5.19 4 241.77 2
fat Production 4.18 1 206.58 5
mil Production 4.11 1 172.64 5
pro Production 3.71 1 156.89 5
mas Udder health 5.12 5 326.43 1
scs Udder health 5.16 5 382.48 1
msp Workability 7.10 4 NA 0
Dce= direct calving ease, mce=maternal calving ease, an=angularity, bde=body depth, cwi=chest width, fan=foot angle, ftl=front teat length, ftp=front teat placement, fua=fore udder attachment, hde=heel depth/hoof height, ocs=overall conformation score, ofl=overall feet and leg score, ous=overall udder score, ran=rump angle, rls=rear leg set, rtp=rear teat placement, ruh=rear udder height, ruw=rear udder width, rwi=rump width, sta=stature, ude=udder depth, usu=udder support, cc1=lactating cow’s ability to conceive (1), cc2=lactating cow’s ability to conceive (2), crc=lactating cow’s ability to recycle
after calving, hco=maiden heifer’s ability to conceive, int=calving-conception, dlo=direct longevity, fat=milk fat, mil=milk, pro= milk protein, mas=clinical mastitis, scs=milk somatic cell, msp=milking speed.
Mean CVs for all countries are presented in Table 3. Coefficients of variation for all Country-trait
combinations can be found in Appendix 1 (mean IEBV=100) and 2 (mean IEBV=0).

12
Table 3. Mean coefficient of variation (CV) for all countries across traits, depending on trait mean.
Countries with different letters after CV are statistically different at p<0.05 according to Tukey’s test
Country
CV when
mean
IEBV=100 Nr of traits
CV when
mean
IEBV=0 Nr of traits
Total nr of
traits for each
country
CHE 4.97a 9 313.09
e 23 32
DEA 4.86a 30 132.80
e 3 33
FRA NA 0 252.58e
30 30
ITA 5.62b 24 215.00
e 3 27
SVN 6.38c 25 NA 0 25
USA 3.15†d
2 739.60e
28 30 CHE=Switzerland, DEA=Germany-Austria, FRA=France, ITA=Italy, SVN=Slovenia, USA=United States of America.
†=Mean IEBV was not 100 for udder health traits, but CV was following the same trends.
When mean IEBV=100, SVN and ITA had the highest CVs and USA had the smallest CV. When
mean IEBV=0, USA had a much higher CV than other countries (a couple of traits had very high
CVs compared to others), with CHE having the second biggest CV and DEA having the smallest
CV, although no Country CV was significantly different to other countries for this type of mean
IEBV.
Trait categories
Coefficients of variation (CV) for the different categories of traits are displayed in Table 4.
Table 4. Mean Coefficient of variation (CV) for each type of trait. Letter following CV indicates
statistical difference according to Tukey’s t-test, identical letter indicates no significant difference (within type of mean IEBV)
Type Nr of traits within
class
CV when mean
IEBV=100
CV when mean
IEBV=0
Calving 2 4.85ab 13.72f
Conformation 19 5.73c 516.07f
Fertility 5 4.36bd 355.36f
Longevity* 1 5.19ac 241.77f
Production 3 4.00d 178.70f
Udder health 2 5.14a 354.45f
Workability* 1 7.10e NA
*Only one trait in this category, thus not a mean value.
When mean IEBV=100, workability traits had a significantly higher CV than other trait
categories. Conformation traits and longevity had the second highest CV and were not
significantly different from each other. Fertility and production traits had the smallest CV. There
was no significant correlation (correlation=0.09) between number of traits within category and
CV.
When mean IEBV=0, the highest CV was found for conformation traits, with fertility and udder
health as second largest, and calving traits had the lowest CV, but none of these differences were
statistically significant.

13
When the trait categories were grouped by countries (Table 5 and 6), the ranking changed
according to country, but generally, for traits with mean IEBV=100, workability, udder health and
conformation traits had the highest CV and fertility, longevity and production (only one country)
had the lowest CVs. When traits with mean IEBV=0 were considered conformation traits had the
highest CV, and for countries with more than one trait category, production traits had the lowest
CV.
Table 5. Mean coefficient of variation (CV) per trait category within country when mean IEBV=100. Categories with the same lowercase letter are not significantly different within country. Capital letters
indicates whether there are differences between countries within a category (same letter means no
significant difference)
Category\Country CHE DEA FRA ITA SVN USA∆
Calving 5.37aA
4.33deB
Conformation 4.86dfC
5.66hiD
6.75lE
Fertility 4.15bF
4.39eF
4.95kG
Longevity 3.76bH
5.49fgI
5.06ijkI
6.46lJ
Production 4.00m
Udder health 5.40aK
6.11gL
6.25hL
4.79mM
3.15N
Workability 7.03cO 5.24
dgP 6.10
hjOP 10.01
nQ
∆=No estimates of difference within country due to only one category. CHE=Switzerland, DEA=Germany-Austria, FRA=France, ITA=Italy, SVN=Slovenia, USA=United States of America.
For mean IEBV=100, within countries workability traits were highest, although for DEA it was
not significantly different from udder health, conformation and calving traits, and for ITA it was
not significantly different from conformation or udder health traits. SVN was the only country
with production traits with mean IEBV=100 and these had the smallest CV along with udder
health traits. Within trait categories, only conformation traits had significant differences between
all countries with measures for these traits. CHE and DEA did not differ significantly for fertility
traits, and DEA and ITA did not differ significantly for longevity, udder health and workability
traits. CHE and ITA did not differ significantly for workability traits either.
Table 6. Mean coefficient of variation (CV) per trait category within country when mean IEBV=0. No
significant differences were found between categories within countries or within categories between countries
Category\Country CHE DEA FRA ITA SVN USA
Calving 13.72
Conformation 323.54 288.21 1,010.64
Fertility† 149.27 521.24
Longevity 244.00 239.54
Production 243.39 132.80 87.71 215.0 214.61
Udder health 354.45
Workability CHE=Switzerland, DEA=Germany-Austria, FRA=France, ITA=Italy, SVN=Slovenia, USA=United States of America.
†=country differences within fertility approaches significance with p-value=0.059
For mean IEBV=0, no differences were found between trait categories within countries or within
categories between countries, although within fertility, differences between countries approaches
significance (p-value=0.059).

14
Year trends
In general there was an increase in CV across years regardless of trait, but when sire families were
considered there was a drop in the year 2000 (the last year considered) (Fig. 2). This was only the
case when traits with mean IEBV=100 were considered. No trends were seen for traits with mean
IEBV=0.
Figure 2. The coefficient of variation (CV) for all traits across birth year of the sire when sire families were considered and mean IEBV=100.
When traits were considered individually (mean IEBV=100), some traits had clear upwards trends
across the birth years of sires, while others had no clear trend. For example, cc2, tended to have an
upwards trend, but a decrease was seen from 1994 onwards (Fig. 3), dlo had a relatively flat trend
(Fig. 4) and mas had a weak upwards trend (Fig. 5).

15
Figure 3. Trend in coefficient of variation (CV) across the birth year of sires for lactating cow’s ability to conceive 2 (cc2), a fertility trait. CHE=Switzerland, DEA=Germany-Austria, ITA=Italy.
Figure 4. Trend in coefficient of variation (CV) across the birth year of sires for direct longevity (dlo), a longevity trait. CHE=Switzerland, DEA=Germany-Austria, ITA=Italy, SVN=Slovenia.
0
1
2
3
4
5
6
7
1970 1975 1980 1985 1990 1995 2000 2005
Co
eff
icie
nt
of
vari
atio
n (C
V)
Birth year of sire
Year trend for cc2
CHE
DEA
ITA
0
1
2
3
4
5
6
7
8
9
1970 1975 1980 1985 1990 1995 2000 2005
Co
eff
icie
nt
of
vari
atio
n (C
V)
Birth year of sire
Year trend for dlo
CHE
DEA
ITA
SVN
16
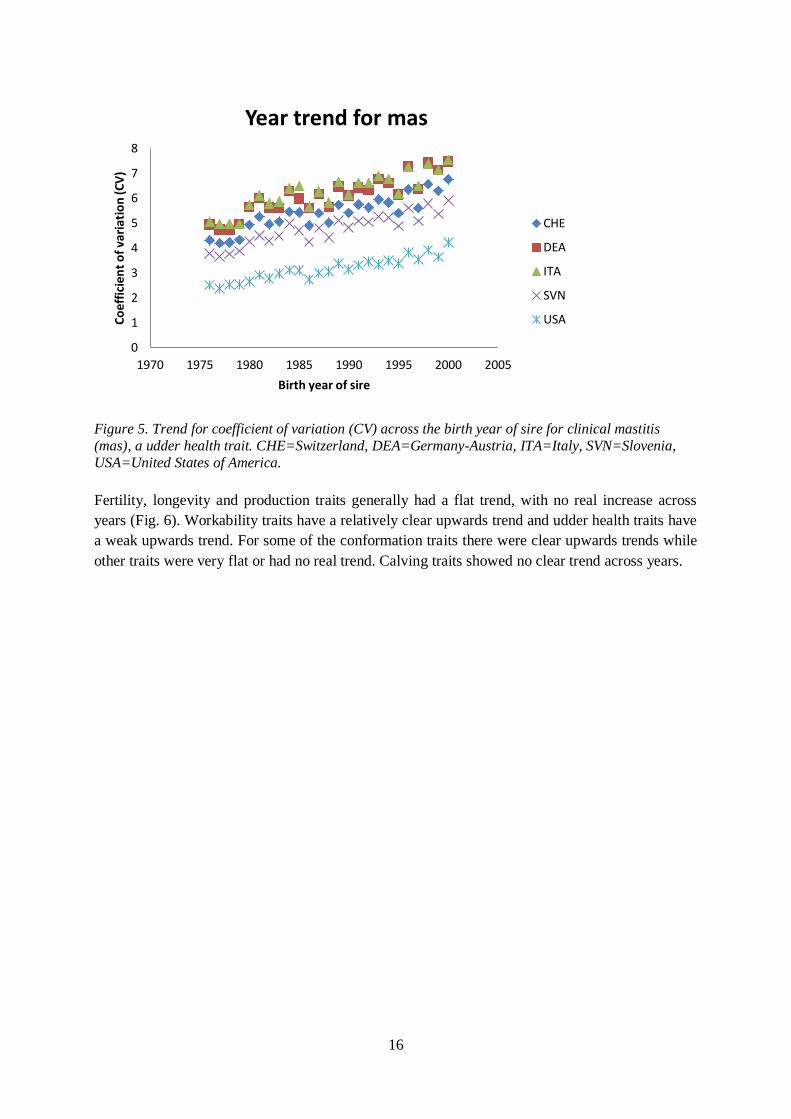
Figure 5. Trend for coefficient of variation (CV) across the birth year of sire for clinical mastitis
(mas), a udder health trait. CHE=Switzerland, DEA=Germany-Austria, ITA=Italy, SVN=Slovenia,
USA=United States of America.
Fertility, longevity and production traits generally had a flat trend, with no real increase across
years (Fig. 6). Workability traits have a relatively clear upwards trend and udder health traits have
a weak upwards trend. For some of the conformation traits there were clear upwards trends while
other traits were very flat or had no real trend. Calving traits showed no clear trend across years.
0
1
2
3
4
5
6
7
8
1970 1975 1980 1985 1990 1995 2000 2005
Co
eff
icie
nt
of
vari
atio
n (C
V)
Birth year of sire
Year trend for mas
CHE
DEA
ITA
SVN
USA

17
Figure 6. Trends for coefficient of variation (CV) the various trait categories across the birth year of
the sires. Calv=calving, conf=conformation, fert=fertility, long=longevity, prod=production,
uder=udder health, work=workability.
Coefficients of variation (CV) and heritability
Correlations between CVs and heritability estimates were 0.12 (p-value=0.25) and 0.02 (p-
value=0.82) for traits with mean IEBV of 100 and 0 respectively. Neither was significantly
different from zero. Correlations were also estimated per country (Table 7). The only significant
correlation (positive) between CV and heritability estimates was found for DEA for traits with
mean IEBV=100.
Table 7. Correlations between coefficients of variation (CV) and heritability estimates within countries. P-values in parentheses
Country Mean IEBV=100 Mean IEBV=0
CHE 0.30 (0.44) -0.12 (0.59)
DEA 0.45 (0.01)* 0.80 (0.41)
FRA NAb
0.30 (0.10)
ITA 0.35 (0.09) -0.92 (0.25)
SVN -0.18 (0.38) NAb
USA NAa 0.13 (0.50)
*= significant at p=0.01, a=only two traits available, so no estimate of correlation calculated, b=no traits with this mean available for this country. CHE=Switzerland, DEA= Germany-Austria, FRA=France, ITA=Italy, SVN=Slovenia, USA=United States of America

18
There is no clear trend in the correlations between CV and heritability estimates across countries,
with some countries having positive correlations and others having negative correlations, although
the majority were positive.

19
DISCUSSION
Within sire-family coefficients of variation (CV) were lower than population CVs for all traits. On
trait level (regardless of country and birth year of sire), there were no correlation for traits
between mean IEBV=100 and mean IEBV=0. There were differences between countries in overall
mean CV across traits, with SVN having the highest and USA having the lowest CV (mean
IEBV=100). There were also differences between some trait categories, with fertility and
production traits having the lowest CV. Within country, CV for various categories differed
according to country. Generally, there was an increase in CV for traits across the birth year of
sires, although this was not the case for all traits. No significant correlation was found between the
CV of traits and heritability estimates, except for Germany-Austria (DEA) when countries were
evaluated separately.
Validity of coefficients of variation with different means
It is stated in literature that coefficients of variation (CV) are only meaningful when traits contain
real zeroes (Abdi, 2010). The data used in this study have two different types of means; one where
the mean IEBV is close to 100 and one where mean IEBV is close to zero, thus ranging on both
sides of zero. Therefore, it is likely that traits with mean IEBV close to zero do not have
meaningful CVs and therefore interpretation of CV is difficult. The very large CVs found for this
type of mean and the lack of differences between traits also supports this conclusion.
As mentioned, when the mean is around 100, the trait, or in this case IEBV, have been
standardized, changing the variance of the sample (see Fig. 1). Thus, the calculated CV is
different from the real CV. However, it may be possible to still compare these traits with each
other, and draw some conclusions, but perhaps not with traits that are not standardized in this
way. Therefore, the further discussion will look only at the traits with mean IEBV around 100.
Coefficients of variation for all traits
Irrespective of the validity of the concept of CV for RBV, sire families had lower CVs than the
population for all traits. This makes sense, because they are estimates of within-family variances,
which are expected to be smaller than the variance for the whole population. This is due to
removing family effects, and thus variance due to common environment (Hill, 2013).
The differences in mean CV for countries may be due to several factors such as differences in
breeding stock, total number of available animals for breeding, size of country, infrastructure,
importance put on various traits and their definition, data included and evaluation procedures etc.
In terms of trait definitions, especially conformation traits vary between countries (Schaeffer et
al., 1996). Depending on the country, which traits are prioritized as focus of selection depends on
whether only traits with high economic value are considered important or if more traits are
included and often coincides with the economy of the country/industry (Mark, 2004). For
example, for Holstein cattle, in 2005, of the countries in this study, France put the most emphasis
on health (25%), closely followed by the US Net Merit (20%) (Miglior et al., 2005). For
production traits, the German and Swiss selection indices placed the least emphasis of the ones
under study, on protein yield, while USA had the largest emphasis on fat yield (Miglior et al.,
2005). In addition, the emphasis on female fertility was largest in France (Miglior et al., 2005).
For most countries, calving traits will have been one of the last to be included in the selection

20
index (Mark, 2004). Genotype x environment interaction could also affect the variance of traits
because the expression of the trait may be environment dependent (Mark, 2004, Tsiokos et al.,
2009), and this may be more significant for some traits than others. Grazing countries and
countries that use seasonal calving often have very different conditions compared to intensive
production systems where cows are kept indoors and calve year round (Zwald et al., 2001). This
may not affect the genetic variation however, but may affect the expression of traits. However, it
has been shown that for production, health and fertility traits, genetic analyses are not majorly
affected by environments (Windig et al., 2005).
In addition, some countries that are very large (e.g. USA) may have several different
environments within the country and some of these may be more similar to environments in other
countries (Zwald et al., 2001). Management practices may also vary, for instance, in 2001, the
USA had 4,8 million cows in 42,865 herds whereas Germany had around 3,5 million cows in
63,643 herds and Switzerland 50,472 cows in 2,736 herds (Zwald et al., 2001), and Slovenia had
an average herd size in 2004-2008 of 39.5 cows (range 3-236) (Bakucs et al., 2013).
Consequently, average herd sizes differ between these countries, and therefore management likely
differs as well. In addition, Slovenia only entered the EU in May 2004, whereas France was one
of the founding countries, and thus the development of the farm industries are very different
(Bakucs et al., 2013). Market conditions and policies have influenced development in France and
likely in other EU countries involved from the start, whereas in Slovenia, the communist
collectivization failed, and thus small-scale farming continued (Bakucs et al., 2013). It is possible
that the size of farms or countries will affect the strength of selection, and that smaller farms have
a less intense selection because there are fewer animal to choose from, and may need to find
replacements from other farms as well, thus large variation between individuals exist (assuming
the population is not inbred). This may help explain why the CVs for Slovenia and Italy are larger
than for USA for example, but is likely not the only factor. Alternatively, a small population may
mean that each sire has more offspring, and thus within-family variances are likely higher than for
sires with fewer offspring.
Across-country comparisons are however difficult, because even breeding values that are
standardized to have the same mean, may have been standardized to have different standard
deviations, and thus countries may appear to differ in the genetic variance when this is simply due
to a standardization practice.
Trait categories
The concept of CV is probably more problematic for traits that do not have a continuous
distribution, such as some conformation, calving and fertility traits. When categories of traits were
considered, it is probably not useful to evaluate longevity and workability against other categories
as these categories only consisted of one trait and thus is the trait mean rather than the mean of the
category. However, it is still interesting to see how it compares to other categories. If these are
excluded, conformation traits have the highest CV and production and fertility have the lowest,
although fertility was not significantly different from calving. As mentioned, calving was likely
one of the last categories of trait to have been included in selection indices for countries (Mark,
2004), and this is also likely the case for some fertility traits. However, production traits were
likely the first to be included. Therefore, the history of selection for these traits is likely not the
21
explanation for the low CV of calving and fertility traits. Low CV represents small differences
within a sire-family and this may be expected for traits under strong selection, such as production
traits, because the aim is for offspring to inherit the ‘good’ genes of its parents and thus, selection
of mates may be more careful than for instance for conformation traits which may have less
emphasis than production. However, Hill and Mulder (2010) reported that morphological traits
(here conformation traits) usually have smaller CV than traits related to reproduction. It is
interesting to see that in this setting production traits have lower CV than other traits considered to
have low variation such as calving traits (due to size of heritability estimates), which is in
agreement with using proper scaling to estimate variances (i.e. CV) (Houle, 1998, Kruuk et al.,
2000, Barton and Keightley, 2002). It may be important to keep in mind that there were more
conformation traits (n=19) than other categories (n=1-5), and this may have made it more variable
as some traits will likely be much higher and some will likely be much lower than for some other
categories (as can be seen in Table 2). However, the correlation between number of traits in
category and mean CV is low (0.09) and not significant. If conformation traits had been further
divided into subcategories, the results may have been different, but it may be difficult to decide
which trait would then belong in which subcategory.
The differences between CV for the different trait categories may partly be due to how the traits
are measured, e.g. whether they are continuous, such as milk yield or rely on a scale or classes
such as most fertility and calving traits. On the other hand, the use of CV should eliminate the
effect of different scales between traits (Abdi, 2010), and this is therefore probably not the reason
for the differences observed.
As mentioned, across-country evaluations may be difficult to validate, the ranking of the trait
categories were similar also when countries were separated, which give reasons to suggest that
there is a consistency in the genetic variation of trait categories also across countries.
Year trends
The results least affected by the possible improper use of CV is the year trend of CV for
individual country-traits (because across trait and country comparisons are not involved). There
was a general increase in CV across the birth year of sires. The drop in CV in the last year (2000)
could be explained by sires born in this year having fewer sons than sires born earlier, and thus
the variation between the sons of these sires are likely to be smaller than if these sires had many
sons. There were also fewer observations in the last year, and not all traits had sires with at least 5
sons born in this year.
For individual traits, random drops in CV in any given year, e.g. 1983 (Fig. 6), could possibly be
due to a change in the trait definition for that trait (Mark, 2004). The differences between traits in
degree to which CV increases could partly be due to the emphasis put on these traits as some traits
have been under selection for a long time (i.e. production traits), whereas others have only
recently been included in selection indices (Mark, 2004). It is be expected that all else being
equal, genetic variance decreases for trait that is under the focus of selection (Houle, 1998),
however, one explanation is that when more traits are included in the selection index, selection on
certain traits are relaxed, allowing more variable animals to be produced. In a study by Makino
and Iwata (1989) they showed that the size of CV of birth weight (in humans) was dependent on

22
the proportion of infants born with a low body weight, where the birth of a larger number of small
infants led to increases in CV and vice versa. It is possible that this is also the case for the traits in
this study, where for instance an increase in good workability scores or udder health led to
increases in CV for these traits across the birth year of sires. The lack of increase in CV for some
of the other categories of traits may be, by this logic, due to good/bad values for these traits
already existing, and thus an increase in CV is not seen. In the context of these traits, production
traits have been under selection for a long time, and therefore, most animals under evaluation
have relatively high breeding values for these traits, and thus, the variability between sons of sires
is unlikely to change much across years. Another possible explanation is that methods of
measurements have likely improved in accuracy over the years, and thus more variation can be
captured between animals. Additionally, the generation of new variance simply differs between
traits (Houle, 1998).
Coefficients of variation and heritability
Ignoring the conceptual difficulties of using CV on RBV, there were no significant correlations
between CV for country-trait combinations and heritability estimates, when all countries were
considered. This is contradictory to the hypothesis that traits with high heritability estimates have
higher variance than traits with low heritability and in agreement with findings by others (Barton
and Keightley, 2002, Philipsson, 1981, Shook, 1989). However, within countries, most
correlations, although not significant, were positive, and thus there may be some relationship
between heritability and size of genetic variance, and this relationship may have been obscured by
the standardization of RBVs. On the other hand, Hill and Mulder (2010) reported that there is
usually a negative correlation between heritability estimates and CV. Therefore, it is even more
interesting to note that the only significant correlation in this study (Germany-Austria, DEA) was
positive. When looking more closely at the specific results for DEA (appendices), it may be worth
noting that the only traits not measured with mean IEBV of 100, were production traits. This was
also the case for Italy (ITA), and ITA is approaching significance (p<0.10). Additionally, the only
country with production traits in this category was Slovenia (SVN), and here a negative
correlation was found (although not significant). Taking into consideration that production traits
generally have moderate to high heritability estimates, and were here estimated as one of the
categories with the lowest CV, this may help to explain why the correlation is negative for SVN,
but does not wholly explain why only DEA has a significant correlation. It is also interesting to
note that, CHE, which had no significant correlation (and not approaching significance), only had
9 traits for this type of IEBV mean, compared to 24-30 for other countries (except USA), and that
DEA had the most traits (30). Thus, it is possible that there were not sufficient numbers of traits to
find any significant correlations. However, SVN which had 25 traits was not even close to
approaching significance, so this is likely not the only explanation.
It is also important to keep in mind that the CV, as calculated here, captures the variation of
breeding values within sire-families, whereas the heritability estimates reflect the genetic variation
of the population as a whole. In addition, the standardization the RBVs may further complicate
the relationship with the heritability estimates.

23
Conclusion
The aim of this study was to see if the use of the coefficient of variation (CV) to quantify the
genetic variation of several traits in dairy cattle could lead to interpretable results regarding the
claim that traits of low heritability have low genetic variance. The use of the coefficient of
variation could potentially allow for a different evaluation of genetic variance for traits in dairy
cattle. It was seen that a larger variation could be found for health traits in proportion to
production traits than what would be expected based on the heritability. However, due to the
nature of the standardization of the trait values by changing the d-value, CV may not be as
appropriate for the traits under study when using RBV as would have been ideal. It would have
been better to use actual mean values rather than mean of breeding values (if available), but
overall, the use of the CV to investigate variance in traits may be a good approach when different
traits need to be compared. The lack of correlation found between heritability estimates and CV
supports the suggestions by other researchers that heritability does not give a fair estimate of the
genetic variance. The CV may have more of an informative use, and can say something about the
variability of a trait, and could potentially also be used when evaluating sires, as the CV for sire
families may say something about how likely the offspring is to resemble the sire and how
important mate choice may be for a particular sire. However, based on the results in this study, it
is not appropriate to use CV for breeding values, especially when they have been standardised.
When using CV to evaluate genetic variation it would be recommended that actual mean of trait
values are used.

24
REFERENCES
ABDI, H. 2010. Coefficient of Variation. In: SAKIND, N. (ed.) Encyclopedia of Research
Design. Thousand Oaks, CA: Sage.
BAKUCS, Z., BOJNEC, S., FERTO, I. & LATRUFFE, L. 2013. Farm size and growth in
field crop and dairy farms in France, Hungary and Slovenia. Spanish Journal of
Agricultural Research, 11, 869-881.
BARTON, N. & KEIGHTLEY, P. 2002. Understanding quantitative genetic variation. Nature
Reviews Genetics, 3, 11-21.
BELDOMENICO, P. M. & BEGON, M. 2010. Disease spread, susceptibility and infection
intensity: vicious circles? Trends in Ecology & Evolution, 25, 21-27.
BISHOP, S. C. & WOOLLIAMS, J. A. 2010. On the genetic interpretation of disease data.
PLoS One, 5, e8940.
CHARLESWORTH, B. & CHARLESWORTH, D. 1999. The genetic basis of inbreeding
depression. Genetical Research, 74, 329-340.
CIRULLI, E. T. & GOLDSTEIN, D. B. 2010. Uncovering the roles of rare variants in
common disease through whole-genome sequencing. Nature Reviews Genetics, 11,
415-425.
COTTER, S., KRUUK, L. & WILSON, K. 2004. Costs of resistance: genetic correlations and
potential trade-offs in an insect immune system. Journal of Evolutionary Biology, 17,
421-429.
HANSEN AXELSSON, H., JOHANSSON, K., ERIKSSON, S., PETERSSON, K. J.,
RYDHMER, L. & PHILIPSSON, J. 2011. Selection of bull dams for production and
functional traits in an open nucleus herd. Journal of Dairy Science, 94, 2592-2600.
HILL, W. G. 2010. Understanding and using quantitative genetic variation. Philosophical
Transactions of the Royal Society B-Biological Sciences, 365, 73-85.
HILL, W. G. 2013. On estimation of genetic variance within families using genome-wide
identity-by-descent sharing. Genetics, Selection, Evolution, 45, (3 September 2013)-(3
September 2013).
HILL, W. G. & MULDER, H. A. 2010. Genetic analysis of environmental variation. Genetics
Research, 92, 381-395.
HOULE, D. 1992. Comparing evolvability and variability of quantitative traits. Genetics, 130,
195-204.
HOULE, D. 1998. How should we explain variation in the genetic variance of traits?
Genetica, 102-103, 241-253.
JORJANI, H., JAKOBSEN, J., HJERPE, E., PALUCCI, V. & DÜRR, J. 2012. Stauts of
Genomic Evaluation in the Brown Swiss Populations. Interbull Bulletin 46: 46-54.
JOVANOVIC, S., SAVIC, M. & ZIVKOVIC, D. 2009. Genetic variation in disease resistance
among farm animals. Biotechnology in Animal Husbandry, 25, 339-347.
KARDOS, M., ALLENDORF, F. W. & LUIKART, G. 2014. Evaluating the role of
inbreeding depression in heterozygosity-fitness correlations: how useful are tests for
identity disequilibrium? Molecular Ecology Resources, 14, 519-530.

25
KRUUK, L. E. B., CLUTTON-BROCK, T. H., SLATE, J., PEMBERTON, J. M.,
BROTHERSTONE, S. & GUINNESS, F. E. 2000. Heritability of fitness in a wild
mammal population. Proceedings of the National Academy of Sciences, 97, 698-703.
LANDE, R. 1977. COMPARING COEFFICIENTS OF VARIATION. Systematic Zoology,
26, 214-217.
LEWONTIN, R. C. 1966. On the Measurement of Relative Variability. Systematic Zoology,
15, 141-142.
MAKINO, S. & IWATA, H. 1989. Changes in the coefficient variations of live birth weight
in Japan, 1969-1985. Asia-Pacific journal of public health / Asia-Pacific Academic
Consortium for Public Health, 3, 285-90.
MARK, T. 2004. Applied genetic evaluations for production and functional traits in dairy
cattle. Journal of Dairy Science, 87, 2641-2652.
MIGLIOR, F., MUIR, B. & VAN DOORMAAL, B. 2005. Selection indices in Holstein cattle
of various countries. Journal of Dairy Science, 88, 1255-1263.
PHILIPSSON, J. 1981. Genetic aspects of female fertility in dairy cattle. Livestock
Production Science, 8, 307-319.
PRICE, T. & SCHLUTER, D. 1991. ON THE LOW HERITABILITY OF LIFE-HISTORY
TRAITS. Evolution, 45, 853-861.
PRITCHARD, J. K. 2001. Are Rare Variants Responsible for Susceptibility to Complex
Diseases? The American Journal of Human Genetics, 69, 124-137.
SAS INSTITUTE INC. 2011. SAS ® 9.3 System Options: Reference, Second Edition. Cary,
NC: SAS Institute Inc.
SCHAEFFER, L., REENTS, R. & JAMROZIK, J. 1996. Factors influencing international
comparisons of dairy sires. Journal of Dairy Science, 79, 1108-1116.
SHEN, X., PETTERSSON, M., RÖNNEGÅRD, L. & CARLBORG, Ö. 2012. Inheritance
beyond plain heritability: variance-controlling genes in Arabidopsis thaliana. PLoS
genetics, 8, e1002839.
SHOOK, G. E. 1989. Selection for Disease Resistance. Journal of Dairy Science, 72, 1349-
1362.
SOKAL, R. R. & ROHLF, F. 1981. Biometry (2nd edn). New York: WH Feeman and
Company.
THOß, M., ILMONEN, P., MUSOLF, K. & PENN, D. J. 2011. Major histocompatibility
complex heterozygosity enhances reproductive success. Molecular Ecology, 20, 1546-
1557.
TSIOKOS, D., CHATZIPLIS, D. & GEORGOUDIS, A. 2009. Factors affecting the genetic
improvement of dairy cattle in Greece. Agricultural Science and Technology, 1, 1-6.
VISSCHER, P. 2009. Whole genome approaches to quantitative genetics. Genetica, 136, 351-
358.
VISSCHER, P. M., MEDLAND, S. E., FERREIRA, M. A. R., MORLEY, K. I., ZHU, G.,
CORNES, B. K., MONTGOMERY, G. W. & MARTIN, N. G. 2006. Assumption-free
estimation of heritability from genome-wide identity-by-descent sharing between full
siblings. Plos Genetics, 2, 316-325.
26
WINDIG, J., CALUS, M. & VEERKAMP, R. 2005. Influence of herd environment on health
and fertility and their relationship with milk production. Journal of Dairy Science, 88,
335-347.
WRAY, N. R., GODDARD, M. E. & VISSCHER, P. M. 2007. Prediction of individual
genetic risk to disease from genome-wide association studies. Genome Research, 17,
1520-1528.
YANG, J., BENYAMIN, B., MCEVOY, B. P., GORDON, S., HENDERS, A. K., NYHOLT,
D. R., MADDEN, P. A., HEATH, A. C., MARTIN, N. G., MONTGOMERY, G. W.,
GODDARD, M. E. & VISSCHER, P. M. 2010. Common SNPs explain a large
proportion of the heritability for human height. Nature Genetics, 42, 565-U131.
ZWALD, N., WEIGEL, K., FIKSE, W. & REKAYA, R. 2001. Characterization of dairy
production systems in countries that participate in the International Bull Evaluation
Service. Journal of Dairy Science, 84, 2530-2534.

27
APPENDICES
Appendix 1
All Country-trait coefficients of variation (CV) when mean IEBV=100.
Country Trait CV
CHE cc1 4.06
cc2 3.03
crc 5.35
dce 5.69
dlo 3.76
mas 5.38
mce 5.04
msp 7.03
scs 5.42
DEA bde 4.94
cc1 3.76
cc2 4.49
crc 5.61
cwi 4.41
dce 4.35
dlo 5.49
fan 4.35
ftl 5.49
ftp 5.21
fua 2.69
hco 3.51
hde 3.98
int 4.55
mas 6.09
mce 4.31
msp 5.24
ocs 5.41
ofl 4.01
ous 4.84
ran 5.56
rls 4.85
rtp 4.70
ruh 5.23
ruw 5.14
rwi 5.27
scs 6.12
sta 5.80
ude 5.72
usu 4.79
ITA bde 6.23
cc2 4.31

28
crc 4.76
cwi 5.58
dlo 5.06
fan 5.78
ftl 7.20
fua 4.46
hde 4.96
int 5.80
mas 6.23
msp 6.10
ocs 3.73
ofl 4.71
ous 4.99
ran 7.13
rls 6.66
rtp 5.68
ruh 4.75
ruw 4.96
scs 6.27
sta 6.65
ude 7.33
usu 5.49
SVN bde 6.86
cwi 8.16
dlo 6.46
fan 8.13
fat 4.18
ftl 8.93
ftp 6.39
fua 3.94
hde 7.59
mas 4.75
mil 4.11
msp 10.01
ocs 4.85
ofl 7.42
ous 5.05
pro 3.71
ran 9.68
rls 7.95
rtp 6.55
ruh 5.67
ruw 4.86
scs 4.83
sta 6.20
ude 8.35

29
usu 4.99
USA mas 3.15
scs 3.15
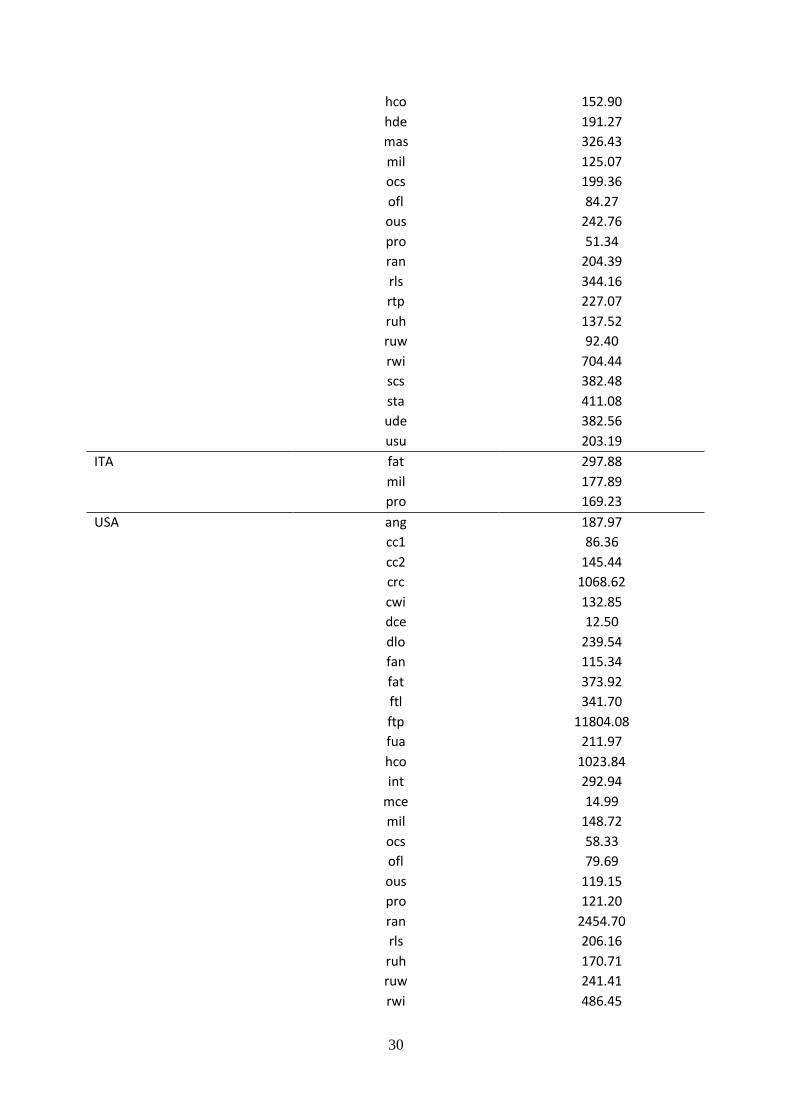
Appendix 2
All Country-trait coefficients of variation (CV) when mean IEBV=0.
Country Trait CV
CHE ang 87.72
bde 631.12
cwi 355.90
fan 320.15
fat 166.05
ftl 123.28
ftp 281.71
fua 525.57
hde 179.35
mil 245.94
ocs 181.84
ofl 153.94
ous 119.19
pro 318.20
ran 367.01
rls 196.10
rtp 617.57
ruh 302.15
ruw 713.31
rwi 159.36
sta 241.61
ude 312.59
usu 601.41
DEA fat 108.33
mil 165.57
pro 124.51
FRA ang 221.14
bde 139.76
cc1 110.63
cc2 130.09
crc 203.62
cwi 143.80
dlo 244.00
fan 353.59
fat 86.73
ftl 837.00
ftp 270.98
fua 373.50
30
hco 152.90
hde 191.27
mas 326.43
mil 125.07
ocs 199.36
ofl 84.27
ous 242.76
pro 51.34
ran 204.39
rls 344.16
rtp 227.07
ruh 137.52
ruw 92.40
rwi 704.44
scs 382.48
sta 411.08
ude 382.56
usu 203.19
ITA fat 297.88
mil 177.89
pro 169.23
USA ang 187.97
cc1 86.36
cc2 145.44
crc 1068.62
cwi 132.85
dce 12.50
dlo 239.54
fan 115.34
fat 373.92
ftl 341.70
ftp 11804.08
fua 211.97
hco 1023.84
int 292.94
mce 14.99
mil 148.72
ocs 58.33
ofl 79.69
ous 119.15
pro 121.20
ran 2454.70
rls 206.16
ruh 170.71
ruw 241.41
rwi 486.45

31
sta 148.43
ude 267.03
usu 154.85


![Estimation of genetic variation and SNP- heritability … · [Visscheret al. 2010, Twin Research and Human Genetics] 13 Checking for population structure. Genetic variance associated](https://static.fdocuments.in/doc/165x107/5b9512b709d3f2de4a8b8428/estimation-of-genetic-variation-and-snp-heritability-visscheret-al-2010.jpg)