HERG1 Currents in Native K562 Leukemic Cells - Springer · HERG1 Currents in Native K562 Leukemic...
13
HERG1 Currents in Native K562 Leukemic Cells Marı ´a S. Cavarra Silvana M. del Mo ´naco Yanina A. Assef Cristina Ibarra Basilio A. Kotsias Received: 18 June 2007 / Accepted: 18 June 2007 / Published online: 1 September 2007 Ó Springer Science+Business Media, LLC 2007 Abstract The human ether-a-go-go related gene (HERG1) K + channel is expressed in neoplastic cells, in which it was proposed to play a role in proliferation, dif- ferentiation and/or apoptosis. K562 cells (a chronic myeloid leukemic human cell line) express both the full- length (herg1a) and the N-terminally truncated (herg1b) isoforms of the gene, and this was confirmed with Western blots and coimmunoprecipitation experiments. Whole-cell currents were studied with a tail protocol. Seventy-eight percent of cells showed a HERG1-like current: repolari- zation to voltages negative to 40 mV produced a transient peak inward tail current, characteristic of HERG1 chan- nels. Cells were exposed to a HERG-specific channel blocker, E4031. Half-maximal inhibitory concentration (IC 50 ) of the blocker was 4.69 nM. The kinetics of the HERG1 current in K562 cells resembled the rapid com- ponent of the native cardiac delayed rectifier current, known to be conducted by heterotetrameric HERG1 channels. Fast and slow deactivation time constants at 120 mV were 27.5 and 239.5 ms, respectively. Our results in K562 cells suggest the assembling of heterotetrameric channels, with some parameters being dominated by one of the isoforms and other parameters being intermediate. Hydrogen peroxide was shown to increase HERG1a K + current in heterologous expression systems, which consti- tutes an apoptotic signal. However, we found that K562 HERG1 whole-cell currents were not activated by H 2 O 2 . Keywords HERG1 K + channel H 2 O 2 E4031 K562 Introduction The ether-a-go-go-related gene 1 (erg1) codes the con- ducting a-subunit of the voltage-activated K + channel ERG1 (Warmke & Ganetzky, 1994). Four a-subunits co- assemble to form the conducting core of ERG channels; each a-subunit consists of six transmembrane a-helical domains and intracellular N and C termini (Warmke & Ganetzky, 1994). The human erg1 gene (herg1), located on chromosome 7, is composed of 15 exons (Curran et al., 1995; Itoh et al., 1998) and encodes for at least four iso- forms: HERG1a, HERG1b, HERG-USO and HERG-sm. HERG1a was the first characterized isoform and is the longest one since the others have shorter N-terminal (1b) or C-terminal (USO, sm) regions (Warmke & Ganetzky, 1994; Kupershmidt et al., 1998; Lees-Miller et al., 1997; Shoeb, Malykhina & Akbarali, 2003). HERG1 was found to be abundantly expressed in the heart, where it is responsible for the rapid component of the delayed rectifier K + current (I Kr ), playing a critical role in normal cardiac repolarization (Sanguinetti et al., 1995; Curran et al., 1995; Li et al., 1996). Moreover, it has been linked to the long QT syndrome type 2 (LQT2), an inher- ited or acquired cardiac disorder (Curran et al., 1995; Sanguinetti et al., 1995). Several kinetic and pharmacological features define both expressed HERG1 and native I Kr currents. First, HERG1 M. S. Cavarra S. M. del Mo ´naco Y. A. Assef B. A. Kotsias (&) Laboratorio de Neurofisiologı ´a, Instituto de Investigaciones Me ´dicas Alfredo Lanari, Universidad de Buenos Aires- CONICET, C. de Malvinas 3150, Buenos Aires 1427, Argentina e-mail: [email protected] C. Ibarra Laboratorio de Fisiopatogenia, Facultad de Medicina, Universidad de Buenos Aires, Paraguay 2155, Buenos Aires 1121, Argentina 123 J Membrane Biol (2007) 219:49–61 DOI 10.1007/s00232-007-9060-x
Transcript of HERG1 Currents in Native K562 Leukemic Cells - Springer · HERG1 Currents in Native K562 Leukemic...

HERG1 Currents in Native K562 Leukemic Cells
Marıa S. Cavarra Æ Silvana M. del Monaco ÆYanina A. Assef Æ Cristina Ibarra Æ Basilio A. Kotsias
Received: 18 June 2007 / Accepted: 18 June 2007 / Published online: 1 September 2007
� Springer Science+Business Media, LLC 2007
Abstract The human ether-a-go-go related gene
(HERG1) K+ channel is expressed in neoplastic cells, in
which it was proposed to play a role in proliferation, dif-
ferentiation and/or apoptosis. K562 cells (a chronic
myeloid leukemic human cell line) express both the full-
length (herg1a) and the N-terminally truncated (herg1b)
isoforms of the gene, and this was confirmed with Western
blots and coimmunoprecipitation experiments. Whole-cell
currents were studied with a tail protocol. Seventy-eight
percent of cells showed a HERG1-like current: repolari-
zation to voltages negative to �40 mV produced a transient
peak inward tail current, characteristic of HERG1 chan-
nels. Cells were exposed to a HERG-specific channel
blocker, E4031. Half-maximal inhibitory concentration
(IC50) of the blocker was 4.69 nM. The kinetics of the
HERG1 current in K562 cells resembled the rapid com-
ponent of the native cardiac delayed rectifier current,
known to be conducted by heterotetrameric HERG1
channels. Fast and slow deactivation time constants at
�120 mV were 27.5 and 239.5 ms, respectively. Our results
in K562 cells suggest the assembling of heterotetrameric
channels, with some parameters being dominated by one of
the isoforms and other parameters being intermediate.
Hydrogen peroxide was shown to increase HERG1a K+
current in heterologous expression systems, which consti-
tutes an apoptotic signal. However, we found that K562
HERG1 whole-cell currents were not activated by H2O2.
Keywords HERG1 K+ channel � H2O2 � E4031 �K562
Introduction
The ether-a-go-go-related gene 1 (erg1) codes the con-
ducting a-subunit of the voltage-activated K+ channel
ERG1 (Warmke & Ganetzky, 1994). Four a-subunits co-
assemble to form the conducting core of ERG channels;
each a-subunit consists of six transmembrane a-helical
domains and intracellular N and C termini (Warmke &
Ganetzky, 1994). The human erg1 gene (herg1), located on
chromosome 7, is composed of 15 exons (Curran et al.,
1995; Itoh et al., 1998) and encodes for at least four iso-
forms: HERG1a, HERG1b, HERG-USO and HERG-sm.
HERG1a was the first characterized isoform and is the
longest one since the others have shorter N-terminal (1b) or
C-terminal (USO, sm) regions (Warmke & Ganetzky,
1994; Kupershmidt et al., 1998; Lees-Miller et al., 1997;
Shoeb, Malykhina & Akbarali, 2003).
HERG1 was found to be abundantly expressed in the
heart, where it is responsible for the rapid component of the
delayed rectifier K+ current (IKr), playing a critical role in
normal cardiac repolarization (Sanguinetti et al., 1995;
Curran et al., 1995; Li et al., 1996). Moreover, it has been
linked to the long QT syndrome type 2 (LQT2), an inher-
ited or acquired cardiac disorder (Curran et al., 1995;
Sanguinetti et al., 1995).
Several kinetic and pharmacological features define both
expressed HERG1 and native IKr currents. First, HERG1
M. S. Cavarra � S. M. del Monaco � Y. A. Assef �B. A. Kotsias (&)
Laboratorio de Neurofisiologıa, Instituto de Investigaciones
Medicas Alfredo Lanari, Universidad de Buenos Aires-
CONICET, C. de Malvinas 3150, Buenos Aires 1427, Argentina
e-mail: [email protected]
C. Ibarra
Laboratorio de Fisiopatogenia, Facultad de Medicina,
Universidad de Buenos Aires, Paraguay 2155, Buenos Aires
1121, Argentina
123
J Membrane Biol (2007) 219:49–61
DOI 10.1007/s00232-007-9060-x

channels slowly open when depolarized to positive volt-
ages but inactivate extremely quickly, thus suppressing the
efflux of intracellular K+ during the depolarization. Second,
upon repolarization, channels rapidly recover from inacti-
vation, producing a resurgent current as they revisit the
open state before slowly closing. Net ion movement
through these channels over a depolarization-hyperpolar-
ization cycle is inward when isomolar K+ concentrations
are used at both sides of the membrane. Third, they are
selectively blocked by methanesulfonanilides like E4031
(Sanguinetti & Jurkiewicz, 1990; Sanguinetti et al., 1995;
Schonherr & Heinemann, 1996; Spector et al., 1996a,
1996b; Wang et al., 1997a).
Several functions have been attributed to native ERG1
channels in excitable cells, such as regulation of cardiac
and smooth muscle action potential, spike frequency
adaptation in neurons, oxygen sensing and modulation of
hormone release in neuroendocrine cells (for review, see
Schwarz & Bauer, 2004). It has also been observed that its
pattern of expression varies during normal development of
cardiac and nervous tissues, suggesting a role in differen-
tiation-maturation (Wang et al., 1996; Crociani et al.,
2000).
Expression of erg1 was also found in cancerous cells,
derived from both excitable and nonexcitable tissues. In
these cells, modulation of proliferation, apoptosis, differ-
entiation and migration by this channel has been also
postulated (for review, see Wang, 2004; Arcangeli, 2005).
In particular, overexpression of the herg1 gene has been
reported in various types of neoplastic hematopoietic cells
(Smith et al., 2002; Pillozzi et al., 2002), although elec-
trophysiological characterization of kinetic parameters of
HERG1-like currents was not reported. For this reason,
functional studies of HERG1 currents could be of partic-
ular interest, contributing to a better knowledge of the role
they play in cellular signaling in tumor cells.
The human myeloid cell line K562, established by cul-
turing leukemic cells from the pleural effusion of a patient
in blastic transformation, is composed mainly of undiffer-
entiated blasts (Lozzio & Lozzio, 1975; Klein et al., 1976),
which can be induced to differentiate along the erythroid
lineage in response to various stimuli (Hoffman et al.,
1979; Rutherford, Clegg & Weatherall, 1979; Tsiftsoglou
et al., 1991). These cells are also able to acquire resistance
to several cytotoxic drugs (Hamada & Tsuruo, 1988). Thus,
the K562 cell line can serve as a useful model for channel
studies at different stages of maturation or multidrug
resistance (Assef & Kotsias, 2002; Assef et al., 2003,
2005).
In the present work, we study the expression of HERG1
channels and characterize the kinetics and drug sensitivity
of HERG1 native currents in undifferentiated K562 cells.
We find that K562 cells express both the full-length
(herg1a) and the N-terminally truncated (herg1b) isoforms
of the gene, which coassemble to form fully active het-
erotetrameric channels with distinctive properties.
Materials and Methods
Cell Culture
The K562 cell line (American Type Culture Collection,
Rockville, MD) was grown in RPMI 1640 culture medium
(HyClone, Logan, UT), supplemented with 10% fetal
bovine serum (FBS; GIBCO, Carlsbad, CA). Cells were
kept at 37�C in humid air (5% CO2).
The HEK293 cell line stably transfected with the herg1a
cDNA (HEK-HERG cells), kindly provided by Dr. C.
January (University of Wisconsin, Madison, WI), was used
as positive control of herg1 expression in reverse-trans-
criptase polymerase chain reaction (RT-PCR) experiments.
HEK-HERG cells were maintained and propagated in
Dulbecco’s modified Eagle medium (DMEM, Hyclone)
supplemented with 10% FBS and G418 400 lg/ml (A. g.
Scientific, Inc., San Diego, CA) at 37�C in humid air (5%
CO2).
PCR
Total RNA from wild-type K562 or HEK-HERG cells was
isolated using the SV Total RNA isolation system. DNase
was used during the total RNA extraction. Reverse tran-
scription of mRNA was achieved by incubation of total
RNA with oligo(dT) primers, Moloney murine leukemia
virus reverse transcriptase (MMLV-RT) and dNTPs in the
presence of RNAsin at 42�C for 60 min. All reagents and
enzymes were purchased from Promega (Madison, WI).
Expression of total herg1 or herg1a and herg1b isoforms
in K562 cells was evaluated using the primers detailed in
Table 1, which amplify specific sequences of these tran-
scripts from the whole population of retrotranscribed
cDNA. PCR consisted of 30–50 cycles of 94�C for 1 min,
58�C for 1 min, 72�C for 1 min and 6 min at 72�C for final
extension. Some of these primers amplify sequences
comprised of more than one exon and thus served as
genomic DNA contamination controls. ß-Actin primers
(Biodynamics) were used as internal control. RT-PCR
products were separated on ethidium bromide-stained 1–
3% agar gels in TBE 1x buffer. Images of gels were
acquired with Foto Analyst Investigator (Fotodyne, New
Berlin, WI). pUC19 DNA/MspI(HpaII) molecular weight
marker was a kind gift from Dr. M. Costas (Instituto de
Investigaciones Medicas, Alfredo Lanari, Universidad de
Buenos Aires, Buenos Aires, Argentina).
50 J Membrane Biol (2007) 219:49–61
123

Western Blot
K562 cells were washed with cold phosphate-buffered
saline (PBS) and resuspended in a small volume of lysis
buffer (50 mM 4-[2-hydroxyethyl]-1-piperazineethanesulf-
onic acid [HEPES], 250 mM NaCl, 1 mM
ethylenediaminetetraacetic acid [EDTA], 1% NP-40 [pH
8], supplemented with a mix of protease inhibitors). Cell
lysates were centrifuged at 10,000 rpm for 5 min at 4�C.
Total protein in each sample was quantified using the
Bradford assay.
For Western blot studies, 100 lg of total proteins from
K562 cells were dissolved in loading buffer (4% sodium
dodecyl sulfate, 0.125 M Tris-HCl [pH 6.8], 0.2 M dith-
iothreitol, 0.02% bromophenol blue, 20% glycerol). The
preparation was heated to 100�C for 10 min, resolved on
8% polyacrylamide gel and electrotransferred onto Immun-
Blot1 polyvinylidene difluoride (PVDF) membranes (Bio-
Rad, Richmond, CA). These membranes were blocked in
Tris-buffered saline (TBS) containing 10% (w/v) nonfat
dry milk and 0.05% Tween-20 for 1 h at room temperature
and incubated overnight with HERG antibodies. In human
tissues two herg transcripts encode proteins differing in
their amino-terminal sequences, HERG1a and HERG1b
(Jones et al., 2004). We used two isoform-specific anti-
bodies directed to this divergent amino-terminal region
which allow us to differentiate the two isoforms. We
detected HERG1a using a rabbit polyclonal antibody
directed against amino acid residues 140–153 of HERG1a
transcript, at a dilution 1:100. For HERG1b, we used a
rabbit polyclonal antibody directed against amino acid
residues 9–23 of HERG1b transcript, at a dilution 1:1,000.
Both antibodies were a kind gift from Dr. Gail Robertson
(University of Wisconsin, Madison, WI), who previously
demonstrated antibody specificity (Jones et al., 2004).
Membranes were then washed with TBS-Tween 0.05% (T-
TBS) and incubated with a horseradish peroxidase-conju-
gated secondary antibody (Vector Laboratories,
Burlingame, CA; 1:5,000) for 1 h at room temperature. The
bands were detected using an enhanced chemilumines-
cence system. Each Western blot was carried out at least
three times.
Coimmunoprecipitation
After washing K562 with cold PBS, cells were resuspended
in 1 ml of lysis buffer (see above, ‘‘Western Blot’’). Cell
lysates were incubated for 20 min in ice and centrifuged at
8,000 rpm for 5 min at 4�C. Proteins were immunopre-
cipitated overnight with HERG1a (1:20) or HERG1b
(1:100) antibodies on a rotating platform at 4�C. G-coupled
Sepharose beads (10 ll; Pharmacia Biotech, Gaithersburg,
MD) were added, and samples were incubated at 4�C for an
additional 90 min. Proteins bound to the beads were
washed three times with lysis buffer, eluted by boiling the
samples in loading buffer, analyzed by sodium dodecyl
sulfate-polyacrylamide gel electrophoresis and transferred
to PVDF membranes. The membranes were incubated
overnight with T-TBS containing 5% bovine serum albu-
min and the appropriate primary antibody at the
concentration reported above. Membranes were then pro-
cessed as described for Western blot analysis. Controls
consisted of a sample with total protein lysate and a sample
where total rabbit serum was added to cell lysate instead of
primary antibody.
Drugs and Reagents
The membrane-permeable ERG-selective blocker E4031,
1-(2-[6-methyl-2-pyridyl]-ethyl)-4-(4-methylsulfonylamino-
benzoyl)piperidine, a methanesulfonanilide (class III anti-
arrhythmic agent) (Sanguinetti & Jurkiewicz, 1990;
Spector et al., 1996b), was purchased from Alomone Labs
(Jerusalem, Israel). E4031 was diluted in sterile distilled
Table 1 Data of primer pairs used for PCR experiments
Primer Product size (bp) Exon Recognizes Reference
Herg1 F Sequence
50CTCAAGGCCGTGTGGGACT30552 6–7 herg1 S1 domain
(both isoforms)
Bauer et al., 2003
Herg1 R 50CAGGTTGTGCAGCCAGCCGA30
Herg1b F 50CGATTCCAGCCGGGAAGGC30 361 1b-6 herg1b N terminus Crociani et al., 2003
Herg1b R 50TGATGTCCACGATGAGGTCC30
herg1a F 50CTCAACTCCACCTCGGACTC30 160 5 herg1a N terminus (PubMed NCBI) NM_000238
herg1a R 50TGTGGGTTCGCTCCTTTATC30
b-actin F 50CGGAACCGCTCATTGCC30 289 -
b-actin R 50ACCCACACTGTGCCCATCTA30
J Membrane Biol (2007) 219:49–61 51
123
water, and a stock solution was kept at�20�C. Bath solution
containing E4031 at the desired final concentration was
prepared weekly and stored at �4�C. ATP-Mg was
purchased from Sigma-Aldrich (St. Louis, MO) and H2O2
from Parafarm (Droguerıa Saporiti, Buenos Aires,
Argentia).
Electrical Recordings
The electrical activity of K562 cells was recorded in the
whole-cell configuration with standard patch-clamp tech-
nology using a PC-501A amplifier (Warner, Hamden, CT).
All experiments were performed at room temperature (20–
24�C). Stimulation and digitalization of the signal were
achieved using Pclamp6.0 software (Axon Instruments,
Burlingame, CA). Electrical signals were acquired at 10
kHz and filtered at 1 kHz. Microelectrodes were pulled
from standard borosilicate glass (1.5 mm optical density)
and fire-polished to a final resistance of 2–4 MX when
filled with intracellular solution. Gigaseal’s resistances (1–
10 GX) were obtained in standard NaCl bath solution.
After whole-cell configuration was attained, the bath
solution was replaced by high-K+ bath solution for current
measurements. Currents were measured several times in
this solution before any treatment was performed, to assess
their stability.
Junction potentials were minor to 5 mV; thus, they were
not corrected. For measurement of the kinetic parameters
of the HERG1-like currents, we carefully corrected pipette
and cell capacitance and the series resistance was com-
pensated before each voltage-clamp protocol ramp. Pipette
solution contained (mM) K-glutamate 84, KCl 46, MgCl2 1,
Mg-ATP 5, HEPES 10, sucrose 60 and 1,2-bis(o-amino-
phenoxy)ethane-N,N,N0,N0-tetraacetic acid (BAPTA) 0.3
(final [Ca2+] 100 nM) (pH 7.4). Standard NaCl bath solution
contained (mM) NaCl 150, KCl 5, CaCl2 1, MgCl2 1 and
HEPES 10 (pH 7.4). High-K+ bath solution contained (mM)
K-glutamate 88, KCl 42, CaCl2 1, MgCl2 1, sucrose 34 and
HEPES 10 (pH 7.4). Two well-known voltage-clamp pro-
tocols commonly used for the study of HERG1 currents
were tested in K562 cells. Protocol 1 consisted of a 2-s
depolarizing step to +40 mV (in order to activate/inactivate
HERG1 channels), followed by a family of hyperpolarizing
test pulses (from �120 to +40 mV), during which inward
resurgent tail current was measured. Protocol 2 consisted of
a 2-s hyperpolarizing step to �70 mV (in order to close
HERG1 channels), followed by a family of test pulses from
�70 to +40 mV, at which voltage-dependent activation/
inactivation of the channels occurs, and a final hyperpo-
larizing step to �120 mV, at which tail current values
correlate with the proportion of channels that opened in the
preceding test pulse.
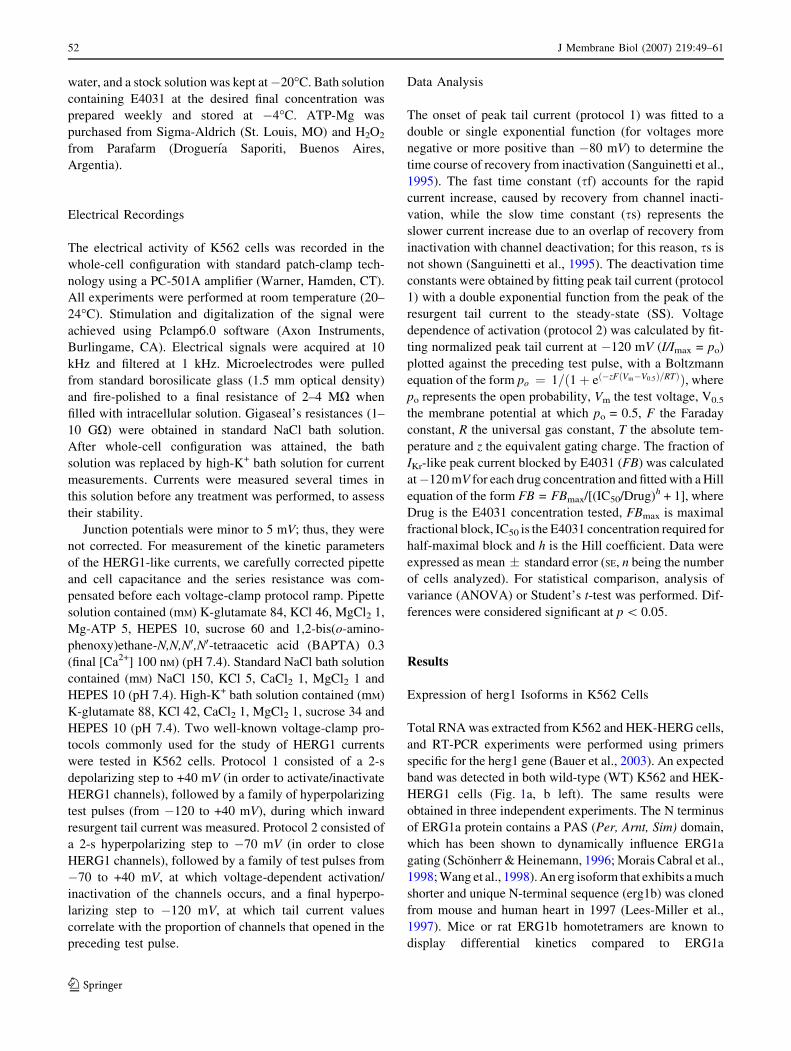
Data Analysis
The onset of peak tail current (protocol 1) was fitted to a
double or single exponential function (for voltages more
negative or more positive than �80 mV) to determine the
time course of recovery from inactivation (Sanguinetti et al.,
1995). The fast time constant (sf) accounts for the rapid
current increase, caused by recovery from channel inacti-
vation, while the slow time constant (ss) represents the
slower current increase due to an overlap of recovery from
inactivation with channel deactivation; for this reason, ss is
not shown (Sanguinetti et al., 1995). The deactivation time
constants were obtained by fitting peak tail current (protocol
1) with a double exponential function from the peak of the
resurgent tail current to the steady-state (SS). Voltage
dependence of activation (protocol 2) was calculated by fit-
ting normalized peak tail current at �120 mV (I/Imax = po)
plotted against the preceding test pulse, with a Boltzmann
equation of the form po ¼ 1=ð1þ eð�zFðVm�V0:5Þ=RTÞÞ, where
po represents the open probability, Vm the test voltage, V0.5
the membrane potential at which po = 0.5, F the Faraday
constant, R the universal gas constant, T the absolute tem-
perature and z the equivalent gating charge. The fraction of
IKr-like peak current blocked by E4031 (FB) was calculated
at�120 mV for each drug concentration and fitted with a Hill
equation of the form FB = FBmax/[(IC50/Drug)h + 1], where
Drug is the E4031 concentration tested, FBmax is maximal
fractional block, IC50 is the E4031 concentration required for
half-maximal block and h is the Hill coefficient. Data were
expressed as mean � standard error (SE, n being the number
of cells analyzed). For statistical comparison, analysis of
variance (ANOVA) or Student’s t-test was performed. Dif-
ferences were considered significant at p \ 0.05.
Results
Expression of herg1 Isoforms in K562 Cells
Total RNA was extracted from K562 and HEK-HERG cells,
and RT-PCR experiments were performed using primers
specific for the herg1 gene (Bauer et al., 2003). An expected
band was detected in both wild-type (WT) K562 and HEK-
HERG1 cells (Fig. 1a, b left). The same results were
obtained in three independent experiments. The N terminus
of ERG1a protein contains a PAS (Per, Arnt, Sim) domain,
which has been shown to dynamically influence ERG1a
gating (Schonherr & Heinemann, 1996; Morais Cabral et al.,
1998; Wang et al., 1998). An erg isoform that exhibits a much
shorter and unique N-terminal sequence (erg1b) was cloned
from mouse and human heart in 1997 (Lees-Miller et al.,
1997). Mice or rat ERG1b homotetramers are known to
display differential kinetics compared to ERG1a
52 J Membrane Biol (2007) 219:49–61
123

homotetramers or ERG1a/1b heterotetramers (Lees-Miller
et al., 1997; London et al., 1997; Kirchberger et al., 2006).
Coexpression of HERG1a and HERG1b isoforms has been
reported in other leukemic cells (Crociani et al., 2003). We
tested if K562 cells express HERG1b by using a previously
reported set of primers that recognize its unique N-terminal
sequence (Crociani et al., 2003). The expected & 361-bp
band was detected in K562 cells (Fig. 1a, right). We also
designed primers to amplify a unique N-terminal sequence of
the HERG1a isoform and used HERG1a transfected HEK
cells (HEK-HERG) to test them. They successfully recog-
nized the expected & 160-bp band in both HEK-HERG and
K562 cells (Fig. 1a, b, right).
HERG channels undergo N-linked glycosylation, which
influences surface membrane expression and functional
properties (Zhou et al., 1998; Petrecca et al., 1999; Jones
et al., 2004). Using HERG1a and HERG1b isoform-specific
antibodies (see ‘‘Materials and Methods’’), we detected
HERG1 channel in K562 cells (Fig. 1c). Western blot anal-
ysis showed two bands, of �155 and �135 kDa, for
HERG1a, which is consistent with the mature and immature
HERG1a glycoforms, respectively (Zhou et al., 1998; Pe-
trecca et al., 1999). HERG1b-specific antibody recognized
the three expected bands of �95, �85 and �80 kDa, also
representing different glycosylated forms (Jones et al., 2004).
HERG1 Currents in WT K562 Cells
Because of the particular kinetics, HERG1 currents are
most easily studied as a resurgent ‘‘tail’’ current during
steps to very negative potentials after stimulation with a
depolarized voltage in order to open the channels. The
electrical activity of K562 cells was first recorded with the
standard patch-clamp technique in the whole-cell configu-
ration with protocol 1 (see ‘‘Materials and Methods’’)
(Fig. 2a). Due to the small current densities of the K562
nonexcitable cells (Assef & Kotsias, 2002; Assef et al.,
2003, 2005), a high external potassium concentration was
used to increase the K+ driving force and, thus, the
amplitude of the inward HERG1 current at negative
potentials (Nernst potential & 0 mV) (Spector et al., 1996a;
Schonherr & Heinemann, 1996; Smith et al., 2002). Cells
were held at a holding potential of 0 mV, at which little or
no basal current was observed.
In 23 of 104 cells studied, we could not detect IKr-like
currents (Fig. 2b). The rest of the cells (78%) showed an
IKr-like current in high-K+ bath solution since repolariza-
tion to voltages more negative than �40 mV produced
transient peak inward tail current (Fig. 2c). Amplitude of
IKr-like currents varied greatly between cells, probably due
to channel density differences between them. However,
this variability was not reduced when normalizing current
values to cell capacitance (data not shown). To confirm the
identity of these IKr-like currents, K562 cells were exposed
to the HERG channel blocker E4031. Drug equilibration
across the cell membrane was allowed for at least 3 min
since E4031 is known to permeate and act from the intra-
cellular side (Zou et al., 1997). This time is more than
sufficient to achieve steady-state block at the 0 mV holding
potential used by us (Spector et al., 1996b). IKr-like cur-
rents were inhibited by E4031 in 27 out of 29 cells tested.
501 bp
404 bp
331 bp
501 bp
404 bp
331 bp
1 2 3 4
1 2 3
K562
HEK-HERG
501 bp
404 bp
331 bp
501 bp
404 bp
331 bp
1 2 3 4 5
1 2 3
K562
HEK-HERG
105
160
75
HERG1a HERG1b
Tubulin
75
105
105
160
75
HERG1a HERG1b
Tubulin
75
105
A B C
Fig. 1 Expression of HERG1 in K562 cells. a RT-PCR products of
K562 and HEK-HERG cells obtained with primers ‘‘herg1’’ (detailed
in Table 1) were loaded in a 3% agar gel. Left panel shows K562
amplification products: lane 1, negative control; lane 2, molecular
weight marker (MW); lane 3, ß-actin; lane 4, herg1. Right panelshows HEK-HERG amplification products: lane 1, molecular weight
marker; lane 2, herg1; lane 3, ß-actin. b RT-PCR products of K562
and HEK-HERG cells obtained with primers ‘‘herg1a’’ and ‘‘herg1b’’
(detailed in Table 1) were loaded in a 3% agar gel. Left panel shows
K562 amplification products: lane 1, molecular weight marker; lane2, negative control; lane 3, ß-actin; lane 4, herg1b; lane 5, herg1a.
Right panel shows HEK-HERG amplification products: lane 1,
molecular weight marker; lane 2, herg1a; lane 3, ß-actin. cRepresentative Western blot of total protein extracts from K562
cells. Left blot shows HERG1a glycoform bands at �155 and �135
kDa. Right blot shows HERG1b glycosylation states, showing �95,
�85 and �80 kDa bands. Tubulin was used as an internal control (57
kDa)
J Membrane Biol (2007) 219:49–61 53
123

Figure 2c shows the current traces at several voltages of a
cell before and after exposure to the HERG blocker E4031,
and the E4031-sensitive currents were calculated by sub-
tracting the E4031-resistant currents from the control ones.
Peak conductance showed inward rectification (Fig. 3a),
while steady-state conductance did not (data not shown).
At very negative potentials HERG1 channels revisit the
open state briefly before closing; thus, the transient peak
(P) tail current is conducted by open HERG1 channels plus
other conductances, while the steady-state (SS) current is
conducted only by other conductances (since HERG1
channels are closed). The ratio between P/SS currents
allows estimation of the proportion of HERG1 currents
with respect to the whole-cell currents for each cell. The P/
SS ratio was measured in all cells where IKr-like currents
were detected (n = 81, Fig. 3b). Nearly 75% of the P
current was blocked by 1 lM E4031 since & 25% of the
whole-cell current remained after E4031 application, sug-
gesting that three-fourths of the transient peak current was
conducted by HERG1 channels. (P/SS ratio changed from
& 4 to & 1 after drug exposure, n = 27, Fig. 3b.) The time
necessary to reach P current (Fig. 3c) significantly
decreased with hyperpolarization (p \ 0.01), but no sig-
nificant differences were found in the time necessary to
reach P between control IKr-like currents and E4031-sen-
sitive currents (Fig. 3c).
Cells with no detectable IKr-like currents showed no
inward P current upon repolarization (at the same time
interval), and their P/SS amplitude ratio was 1.05 � 0.05 at
�120 mV and 1.15 � 0.05 at �60 mV. As expected, E4031
1 lM had no effect upon their currents (n = 6, data not
shown).
Kinetics of the E4031-Sensitive Currents
Whole-cell currents were measured in the absence and
presence of 1 lM E4031, and the E4031-sensitive currents
were obtained by subtracting the E4031-resistant currents
from the control ones. The time constants of recovery from
inactivation and deactivation determined with protocol 1
are shown in Figure 3d, and the exact values are reported
in Table 2 (for kinetic analysis only traces with tail length
[1 s were used). The time constant of recovery from
inactivation was voltage-dependent, increasing with depo-
larizing potentials (p \ 0.01). Deactivation time constants
seemed to steeply increase with depolarization as well,
although significant differences were only found between
�120 mV and the rest of the applied pulses.
Sensitivity to E4031
Half-maximal inhibitory concentration (IC50) of the
blocker was calculated by studying the effect of increasing
concentrations of E4031 upon cells with IKr-like inward tail
Fig. 2 Functional detection of HERG1 in K562 cells. a Graphic
representation of protocol 1, which consisted of a 2-s depolarizing
step to +40 mV, followed by a family of test pulses from �120 to +40
mV in 20-mV steps. Holding potential was 0 mV. b Representative
current traces obtained with protocol 1 from a K562 cell that does not
present IKr-like currents. Prepulse to +40 mV is not shown. c
Representative current traces obtained with protocol 1 from a K562
cell with IKr-like currents before (top ‘‘control’’ traces) and after
(middle ‘‘E4031’’ traces) exposure to 1 lM E4031. Bottom ‘‘E4031-
sensitive’’ current traces of the cell were calculated by subtracting
E4031 traces from control ones. Prepulse to +40 mV is not shown
54 J Membrane Biol (2007) 219:49–61
123
current. The fraction of IKr-like P current blocked by
E4031 was calculated at �120 mV for each drug concen-
tration and fitted with the Hill equation (see ‘‘Materials and
Methods’’). The E4031 maximum fractional block (FBmax)
was 0.72 � 0.02. That is, &72% of the whole-cell P cur-
rent was blocked by E4031. The IC50 was 4.69 � 0.63 nM,
and the Hill coefficient was 1.00 � 0.13 (Fig. 4a). Maxi-
mum block is achieved with 100 nM since FB values were
not significantly different between drug concentra-
tions � 100 nM (ANOVA, p [ 0.05). Figure 4b shows
representative current traces of a cell exposed to no, 5 nM
and 1 lM E4031.
Voltage Dependence of Activation of E4031-Sensitive
Currents
To study the voltage dependence of activation of the
HERG1 currents, protocol 2 was used (Fig. 4c), where the
instant tail current was calculated and normalized to the
maximum value (I/Imax = po). Three representative current
traces obtained under this protocol are shown in Figure 4D.
The fraction of open channels (po) was plotted for each
preceding test pulse applied in Figure 4e. Voltage depen-
dence of activation was calculated for whole-cell control
currents and for E4031-sensitive currents by adjusting the
4
-120 -100 -80 -60
-120 -100 -80 -60 -40 -20 0 20 40
-200
-160
-120
-80
-40
0
40
-120 -100 -80 -600
20
40
60
80
4
0
1* * * *
2
3
4
5
6p/ss (msec)
mV
mV mV
mVpA
Time to peak (msec)
-120 -100 -80 -60
τ
1
10
100
1000
10000
A
C D
B
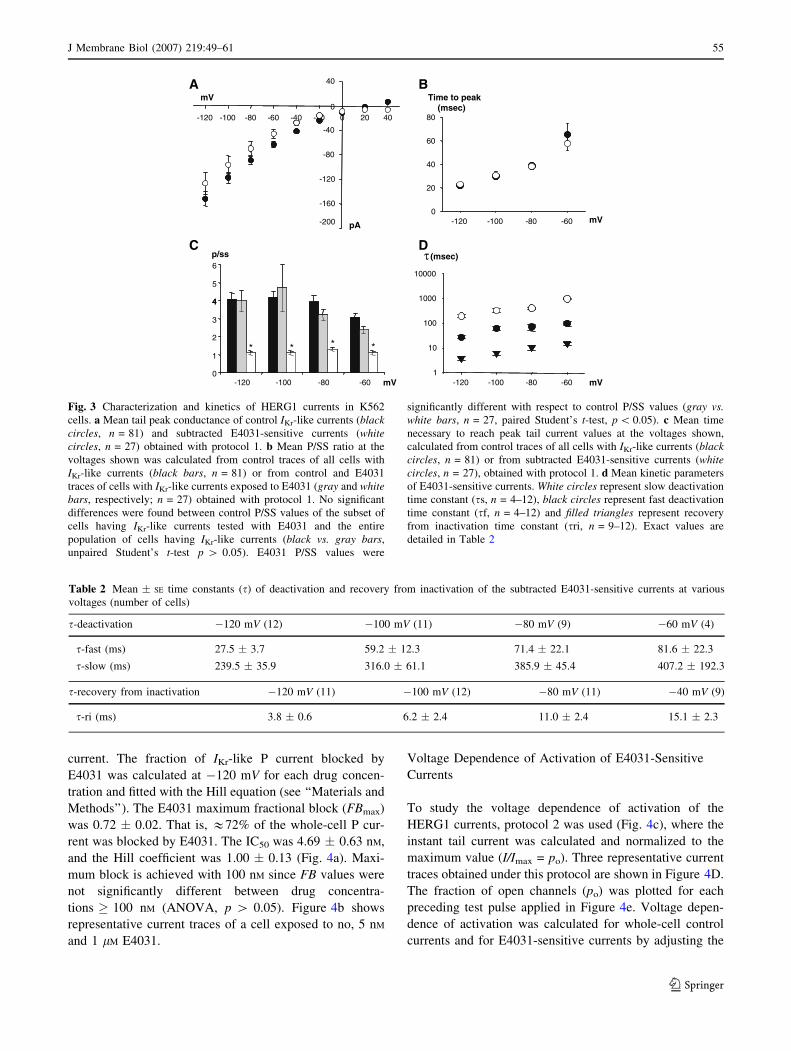
Fig. 3 Characterization and kinetics of HERG1 currents in K562
cells. a Mean tail peak conductance of control IKr-like currents (blackcircles, n = 81) and subtracted E4031-sensitive currents (whitecircles, n = 27) obtained with protocol 1. b Mean P/SS ratio at the
voltages shown was calculated from control traces of all cells with
IKr-like currents (black bars, n = 81) or from control and E4031
traces of cells with IKr-like currents exposed to E4031 (gray and whitebars, respectively; n = 27) obtained with protocol 1. No significant
differences were found between control P/SS values of the subset of
cells having IKr-like currents tested with E4031 and the entire
population of cells having IKr-like currents (black vs. gray bars,
unpaired Student’s t-test p [ 0.05). E4031 P/SS values were
significantly different with respect to control P/SS values (gray vs.white bars, n = 27, paired Student’s t-test, p \ 0.05). c Mean time
necessary to reach peak tail current values at the voltages shown,
calculated from control traces of all cells with IKr-like currents (blackcircles, n = 81) or from subtracted E4031-sensitive currents (whitecircles, n = 27), obtained with protocol 1. d Mean kinetic parameters
of E4031-sensitive currents. White circles represent slow deactivation
time constant (ss, n = 4–12), black circles represent fast deactivation
time constant (sf, n = 4–12) and filled triangles represent recovery
from inactivation time constant (sri, n = 9–12). Exact values are
detailed in Table 2
Table 2 Mean � SE time constants (s) of deactivation and recovery from inactivation of the subtracted E4031-sensitive currents at various
voltages (number of cells)
s-deactivation �120 mV (12) �100 mV (11) �80 mV (9) �60 mV (4)
s-fast (ms) 27.5 � 3.7 59.2 � 12.3 71.4 � 22.1 81.6 � 22.3
s-slow (ms) 239.5 � 35.9 316.0 � 61.1 385.9 � 45.4 407.2 � 192.3
s-recovery from inactivation �120 mV (11) �100 mV (12) �80 mV (11) �40 mV (9)
s-ri (ms) 3.8 � 0.6 6.2 � 2.4 11.0 � 2.4 15.1 � 2.3
J Membrane Biol (2007) 219:49–61 55
123
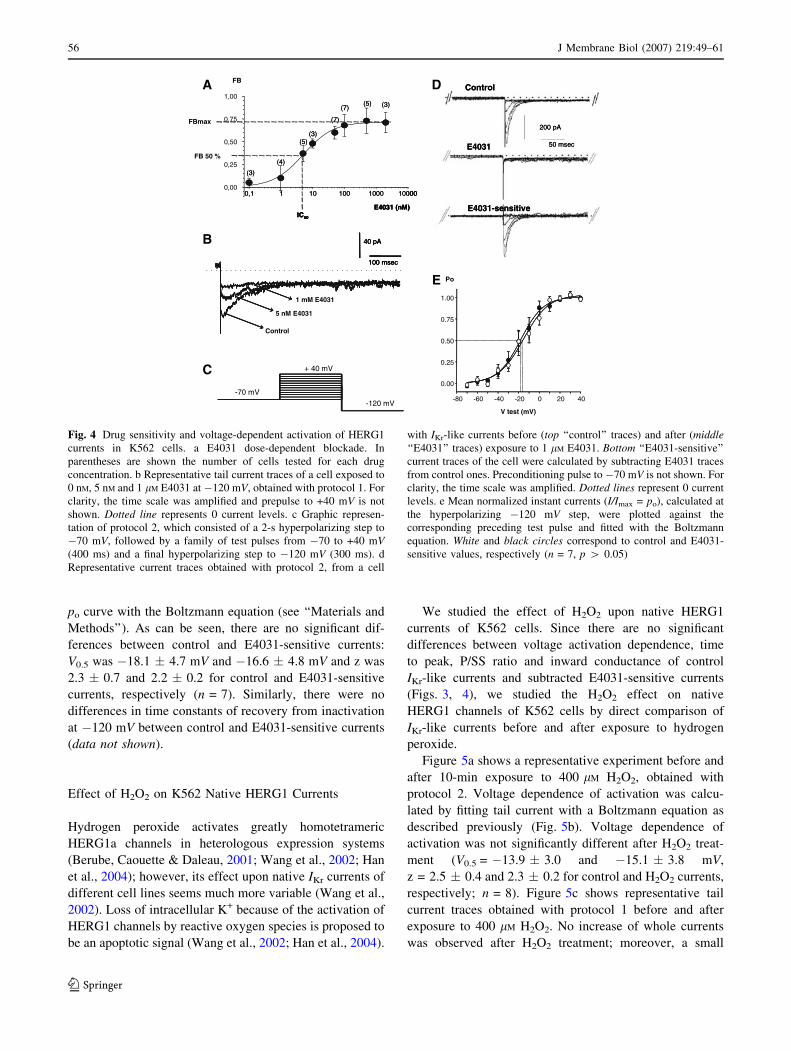
po curve with the Boltzmann equation (see ‘‘Materials and
Methods’’). As can be seen, there are no significant dif-
ferences between control and E4031-sensitive currents:
V0.5 was �18.1 � 4.7 mV and �16.6 � 4.8 mV and z was
2.3 � 0.7 and 2.2 � 0.2 for control and E4031-sensitive
currents, respectively (n = 7). Similarly, there were no
differences in time constants of recovery from inactivation
at �120 mV between control and E4031-sensitive currents
(data not shown).
Effect of H2O2 on K562 Native HERG1 Currents
Hydrogen peroxide activates greatly homotetrameric
HERG1a channels in heterologous expression systems
(Berube, Caouette & Daleau, 2001; Wang et al., 2002; Han
et al., 2004); however, its effect upon native IKr currents of
different cell lines seems much more variable (Wang et al.,
2002). Loss of intracellular K+ because of the activation of
HERG1 channels by reactive oxygen species is proposed to
be an apoptotic signal (Wang et al., 2002; Han et al., 2004).
We studied the effect of H2O2 upon native HERG1
currents of K562 cells. Since there are no significant
differences between voltage activation dependence, time
to peak, P/SS ratio and inward conductance of control
IKr-like currents and subtracted E4031-sensitive currents
(Figs. 3, 4), we studied the H2O2 effect on native
HERG1 channels of K562 cells by direct comparison of
IKr-like currents before and after exposure to hydrogen
peroxide.
Figure 5a shows a representative experiment before and
after 10-min exposure to 400 lM H2O2, obtained with
protocol 2. Voltage dependence of activation was calcu-
lated by fitting tail current with a Boltzmann equation as
described previously (Fig. 5b). Voltage dependence of
activation was not significantly different after H2O2 treat-
ment (V0.5 = �13.9 � 3.0 and �15.1 � 3.8 mV,
z = 2.5 � 0.4 and 2.3 � 0.2 for control and H2O2 currents,
respectively; n = 8). Figure 5c shows representative tail
current traces obtained with protocol 1 before and after
exposure to 400 lM H2O2. No increase of whole currents
was observed after H2O2 treatment; moreover, a small
50 msec
200 pA
Control
E4031
E4031-sensitive
(3)
(4)
(5)(3)
(7)
(7)(5) (3)
E4031 (nM)
0,1 1 10 100 1000 10000
IC50
100 msec
40 pA
-120 mV
-70 mV
+ 40 mV
50 msec
200 pA
Control
E4031
E4031-sensitive
(3)
(4)
(5)(3)
(7)
(7)(5) (3)
E4031 (nM)
0,1 1 10 100 1000 10000
IC50
(3)
(4)
(5)(3)
(7)
(7)(5) (3)
E4031 (nM)
0,1 1 10 100 1000 10000
FBmax
0,00
0,25
0,50
0,75
1,00
IC50
FB
FB 50 %
100 msec
40 pA
100 msec
40 pA
Control
5 nM E4031
1 mM E4031
V test (mV)
-80 -60 -40 -20 0 20 40
Po
0.00
0.25
0.50
0.75
1.00
A
B
E
C
D
Fig. 4 Drug sensitivity and voltage-dependent activation of HERG1
currents in K562 cells. a E4031 dose-dependent blockade. In
parentheses are shown the number of cells tested for each drug
concentration. b Representative tail current traces of a cell exposed to
0 nM, 5 nM and 1 lM E4031 at �120 mV, obtained with protocol 1. For
clarity, the time scale was amplified and prepulse to +40 mV is not
shown. Dotted line represents 0 current levels. c Graphic represen-
tation of protocol 2, which consisted of a 2-s hyperpolarizing step to
�70 mV, followed by a family of test pulses from �70 to +40 mV(400 ms) and a final hyperpolarizing step to �120 mV (300 ms). d
Representative current traces obtained with protocol 2, from a cell
with IKr-like currents before (top ‘‘control’’ traces) and after (middle‘‘E4031’’ traces) exposure to 1 lM E4031. Bottom ‘‘E4031-sensitive’’
current traces of the cell were calculated by subtracting E4031 traces
from control ones. Preconditioning pulse to �70 mV is not shown. For
clarity, the time scale was amplified. Dotted lines represent 0 current
levels. e Mean normalized instant currents (I/Imax = po), calculated at
the hyperpolarizing �120 mV step, were plotted against the
corresponding preceding test pulse and fitted with the Boltzmann
equation. White and black circles correspond to control and E4031-
sensitive values, respectively (n = 7, p [ 0.05)
56 J Membrane Biol (2007) 219:49–61
123

decrement in peak tail current (&5%) was detected at
voltages more negative than �80 mV (Fig. 5d), which
could be due to an acceleration of the slow deactivation
time constant (i.e., sd = 248.5 � 58.8 and 128.3 � 38.3
for control and H2O2, respectively, at �120 mV; n = 6,
p \ 0.05). Subsequent exposure to 1 lM E4031 inhibited
peak IKr-like currents (Fig. 5d). No differences were found
in steady-state currents, suggesting the lack of H2O2 effect
on other conductances (Fig. 5d). Nevertheless, in another
set of experiments, E4031 1 lM was applied prior to
hydrogen peroxide to discard a possible H2O2 effect upon
other non-HERG1 currents. The E4031-resistant currents
were not affected by 400 lM H2O2 (n = 6, p [ 0.05; data
not shown). Inactivation was studied with a protocol con-
sisting of an activating pulse to 40 mV (400 ms) followed
by a 15–20 ms step to �120 mV to allow recovery from
inactivation and a family of pulses from 10 to 40 mV (in
10-mV steps), at which the time constant of inactivation
(si) was calculated by fitting the current decay to a single
exponential function. Inactivation was accelerated after
H2O2 treatment at all voltages (si = 9.97 � 0.67 and
6.00 � 0.94 ms at 10 mV for control and H2O2, respec-
tively; n = 3, p \ 0.05). This change could also account for
the observed current decrease.
Immunoprecipitation of HERG Isoforms in K562 Cells
The results obtained with PCR, Western blots and patch-
clamp experiments suggest that K562 cells express
HERG1a and HERG1b proteins on their plasma mem-
brane. In order to explore the possibility that these two
isoforms coassemble, bidirectional immunoprecipitation
was carried out in K562 protein extracts; and the entire blot
membrane is shown in Figure 6. In these cells, the mature
glycosylated form of HERG1a protein (�155 kDa) was
immunoprecipitated with HERG1b-specific antibody
(Fig. 6a). On the other hand, Figure 6b shows the HERG1b
mature form (�95 kDa) immunoprecipitated with the
HERG1a antibody. These results suggest that both HERG
isoforms are physically associated in K562 cells.
Discussion
In the present work we show that K562 cells express two
isoforms of the herg1 gene (1a and 1b), which successfully
translate into proteins as demonstrated with RT-PCR and
Western blot experiments. Different states of glycosylation
were observed for the HERG1a and HERG1b proteins,
Fig. 5 Lack of H2O2 effect upon HERG1 currents in K562 cells. aRepresentative current traces obtained with protocol 2, from a cell
with IKr-like currents before and after exposure to 400 lM H2O2 (topand bottom traces, respectively). Preconditioning pulse to �70 mV is
not shown. For clarity, the time scale was amplified. Dotted linerepresents 0 current levels. b Mean normalized instant currents (I/Imax = po), calculated at the hyperpolarizing �120 mV step, were
plotted against the corresponding preceding test pulse and fitted with
the Boltzmann equation. White and black circles correspond to
control and H2O2 values, respectively (n = 8, p [ 0.05). c
Representative current traces obtained with protocol 1 from a K562
cell with IKr-like currents before and after exposure to 400 lM H2O2
(top and bottom traces, respectively). Prepulse to +40 mV is not
shown. d Mean peak and steady-state currents (black and whitesymbols, respectively) obtained with protocol 1 and plotted against
the test pulse. Circles, up triangles and down triangles represent
control (n = 8), 400 lM H2O2 (n = 8) and 400 lM H2O2 + 1 lM
E4031 (n = 4) values, respectively. Statistically significant differ-
ences (*) were found between peak control and peak 400 lM H2O2
currents at voltages more negative than �60 mV
J Membrane Biol (2007) 219:49–61 57
123

consistent in size with previously published results for this
channel (Zhou et al., 1998; Petrecca et al., 1999; Crociani
et al., 2003; Jones et al., 2004).
Channel function was studied with the patch-clamp
technique in the whole-cell configuration. To isolate and
identify the native HERG1 currents of K562 cells, we
applied two commonly used protocols in combination with
E4031, which selectively blocks HERG1 channels. K562
HERG1 currents were blocked by E4031 with an IC50 of
4.69 � 0.63 nM; the Hill coefficient was 1, indicating that a
single E4031 molecule interacts with one channel mole-
cule. The blocking potency of E4031 varies when
comparing native and heterologous expression systems and
even among different expression systems; this variability
seems to be influenced by the voltage pulse at which drug
equilibration is allowed, as well as by the ionic conditions
used or the association with auxiliary b-subunits (Abbott
et al., 1999; Spector et al., 1996b; Wang et al., 1997b). In
mouse, E4031 blocked ERG1b channels with higher
affinity than ERG1a channels, its IC50 value being &300
vs. &490 lM (London et al., 1997). The E4031 IC50 value
for HERG1a channels heterologously expressed in mam-
malian cells was reported to be 7.7–8.8 nM (Zhou et al.,
1998; Abbott et al., 1998), although much higher values
were reported for native IKr currents (Sanguinetti & Jur-
kiewicz, 1990). The HERG1a N terminus is known to
modulate channel kinetics by interacting either directly or
indirectly with other channel regions (Wang et al., 1998;
Sanguinetti & Xu, 1999; Zhang et al., 2005; Aydar &
Palmer, 2001) or with other proteins (Kagan et al., 2002)
and to be involved in channel assembly (Li, Xu & Li, 1997;
Paulussen et al., 2002). Homotetrameric WT ERG1a
channels as well as N-terminally deleted ERG1a channels
have been abundantly studied in different expression sys-
tems. Removal of the N terminus produces an acceleration
in time deactivation constants (Spector et al., 1996a;
Schonherr & Heinemann, 1996; Morais-Cabral et al., 1998;
Wang et al., 1998), which can be restored by addition of a
complete or partial N-terminal peptide (Morais-Cabral
et al., 1998; Wang, Myers & Robertson, 2000). N-terminal
deletion effects can be mimicked by mutations in the S4-S5
intracellular linker (Wang et al., 1998; Sanguinetti & Xu,
1999). However, native ERG1b subunits do not efficiently
produce surface membrane homotetramers (London et al.,
1997; Robertson, Jones & Wang, 2005), which is why this
type of channel is less characterized. Nevertheless, they are
known to display differential kinetics compared to ERG1a
homotetramers or ERG1a/1b heterotetramers (Lees-Miller
et al., 1997; London et al., 1997; Robertson et al., 2005;
Kirchberger et al., 2006). We characterized several kinetic
parameters of the HERG1 currents of K562 cells. When
compared with published data obtained under similar ionic
and temperature conditions, we observed that native
HERG1 currents had a V0.5 of activation similar to het-
erotetrameric IKr current of ventricular myocytes (Li et al.,
1997). Deactivation time constants were very similar to
native IKr of guinea pig myocytes (Sanguinetti & Jur-
kiewicz, 1990), being slightly slower than homotetrameric
N-truncated ERG1a or ERG1b channels (Spector et al.,
1996a; Lees-Miller et al., 1997; Wang et al., 1998) but
much faster than WT HERG1a homotetramers (Sanguinetti
et al., 1995; Spector et al., 1996a; Wang et al., 1998). Thus,
our patch-clamp data support that in K562 cells both su-
bunits coassemble into heteromultimeric HERG1a/b
channels, with some properties being dominated by one
subunit and other properties having intermediate values. To
confirm these results, we performed immunoprecipitation
experiments in which we observed a physical association
between the mature forms of HERG1a and HERG1b in this
cell line.
Fig. 6 Physical association between HERG1a and HERG1b isoforms
in K562 cells. Each line indicates total K562 protein extracts
immunoprecipitated with amino-terminal-specific antibodies and
immunoblotted (WB) using HERG1a or HERG1b antibodies. Lane
TL, total protein lysates; for a negative control, total rabbit serum was
used. The HERG1b antibody immunoprecipitated a �155-kDa 1a
band (a) and the HERG1a antibody immunoprecipitated a �95-kDa
1b band (b)
58 J Membrane Biol (2007) 219:49–61
123
Within the N terminus of ERG1a there is a highly
conserved PAS (Per, Arnt, Sim) domain, which is involved
in protein-protein interactions in other eukaryotic proteins
(Morais Cabral et al., 1998). Also, PAS domains of pro-
karyote proteins are known to have sensory properties,
such as sensing the cellular oxidative status of the cell
(Morais-Cabral et al., 1998). Reactive oxygen species are
reported to modulate HERG1 currents, although the per-
centage of change and the kinetic parameter affected varied
markedly between reports, perhaps depending on the
expression system, the oxidizing agent or the concentration
used (Taglialatela et al., 1997; Berube et al., 2001; Wang
et al., 2002; Pannaccione et al., 2002; Han et al., 2004).
Expressed HERG1a currents are increased by H2O2 (Ber-
ube et al., 2001; Wang et al., 2002; Han et al., 2004). There
is no report of an H2O2 effect on expressed ERG1b or
ERG1a/b channels, but variable current increase is reported
in cell lines known to express both isoforms of the gene
(Wang et al., 2002). We found that K562 IKr-like whole-
cell currents were not activated by H2O2. We do not know
for sure the reason for this discrepancy. It could be that
cells expressing both HERG1 isoforms respond differently
to H2O2 depending on the proportion of homo- and het-
erotetrameric channels they possess. Also, the existence of
genetic polymorphism between the channels of each cell
line (Anson et al., 2004) and interactions with other pro-
teins or auxiliary b-subunits differentially expressed in
each cell type (Abbott et al., 1999) may affect reactive
oxygen species sensitivity.
It has been proposed that HERG1 currents participate in
the regulation of tumor cell invasiveness, control of tumor
cell neoangiogenesis and apoptotic cascade signaling by
modulating the intracellular concentration of K+ (Wang
et al., 2002; Han et al., 2004; Arcangeli, 2005). HERG1
channels are implicated in cell proliferation based on the
effect of HERG blockers. E4031 impaired proliferation of
neuroblastoma and neoplastic hematopoietic cells (Smith
et al., 2002; Crociani et al., 2003), although the concen-
tration of E4031 used was much higher that the IC50
required to block HERG currents. Similar results were
obtained with WAY 123,398, another HERG current
blocker (Pillozzi et al., 2002). HERG1 channels are also
implicated in the regulation of cell proliferation, especially
in leukemias by clamping the membrane voltage (Vr) to a
depolarized potential characteristic of proliferating imma-
ture cells (for review, see Arcangeli, 2005). Since HERG1
homo- and heterotetramers display differential kinetics,
fine-tuned modulation of Vr, and thus of proliferation or
apoptosis signaling, might be dependent on the expressed
ratio of these isoforms. Perhaps K562 cells express a higher
proportion of HERG1b than HERG1a isoform, favoring the
formation of heterotetrameric channels insensitive to
reactive oxygen species, thus modulating proliferation
without increasing the apoptosis sensitivity of the cells to
reactive oxygen species.
Acknowledgment We thank Dr. C. January (Department of Medi-
cine, University of Wisconsin, Madison, WI) for the gift of herg1a
stably transfected HEK293 cells and Dr. Gail A. Robertson (Uni-
versity of Wisconsin, Madison, WI) for the gift of antibodies for the
HERG1a and HERG1b isoforms. We extend out thanks to Dr. Felisa
C. Molinas and Dr. Monica Costas (Instituto de Investigaciones
Medicas Alfredo Lanari) for lab facilities and Dr. R. Kass (Columbia
University, New York, NY) for the gift of drugs and reactives. M. S.
C., S. M. d.M. and Y. A. A. are fellows of the National Council of
Research of Argentina (CONICET). C. I. and B. A. K. are established
investigators of CONICET.
References
Abbott GW, Sesti F, Splawski I, Buck ME, Lehmann MH, Timothy
KW, Keating MT, Goldstein SAN (1999) MiRP1 forms IKr
potassium channels with HERG and is associated with cardiac
arrhythmia. Cell 97:175–187
Anson BD, Ackerman MJ, Tester DJ, Will ML, Delisle BP, Anderson
CL, January CT (2004) Molecular and functional characteriza-
tion of common polymorphisms in HERG (KCNH2) potassium
channels. Am J Physiol 286:H2434–H2441
Arcangeli A (2005) Expression and role of hERG channels in cancer
cells. Novartis Found Symp 266:225–234
Assef YA, Kotsias BA (2002) An outwardly rectifying anion channel
in human leukaemic K562 cells. Pfluegers Arch 444:816–820
Assef Y, Damiano A, Zotta E, Ibarra C, Kotsias BA (2003) CFTR in
K562 human leukemic cells. Am J Physiol 285:C480–C488
Assef YA, Cavarra MS, Damiano AE, Ibarra C, Kotsias BA (2005)
Ionic currents in multidrug resistant K562 human leukemic cells.
Leuk Res 29:1039–1047
Aydar E, Palmer C (2001) Functional characterization of the C-
terminus of the human ether-a-go-go-related gene K+ channel
(HERG). J Physiol 534:1–14
Bauer CK, Wulfsen I, Schafer R, Glassmeier G, Wimmers S, Flitsch
J, Ludecke DK, Schwarz JR (2003) HERG K+ currents in human
prolactin-secreting adenoma cells. Pfluegers Arch 445:589–600
Berube J, Caouette D, Daleau P (2001) Hydrogen peroxide modifies
the kinetics of HERG channel expressed in a mammalian cell
line. J Pharmacol Exp Ther 297:96–102
Crociani O, Cherubini A, Piccini E, Polvani S, Costa S, Fontana L,
Hofmann G, Rosati B, Wanke E, Olivotto M, Arcangeli A (2000)
Erg gene(s) expression during development of the nervous and
muscular system of quail embryos. Mech Dev 95:239–243
Crociani O, Guasti L, Balzi M, Becchetti A, Wanke E, Olivotto M,
Wymore RS, Arcangeli A (2003) Cell cycle-dependent expres-
sion of HERG1 and HERG1b isoforms in tumor cells. J Biol
Chem 278:2947–2955
Curran ME, Splawski I, Tomothy KW, Vincent GM, Green ED,
Keating MT (1995) A molecular basis for cardiac arrhyth-
mia: HERG mutations cause long QT syndrome. Cell
80:795–803
Hamada H, Tsuruo T (1988) Purification of the 170–180-kilodalton
membrane glycoprotein associated with multidrug resistance. J
Biol Chem 263:1454–1458
Han H, Wang J, Zhang Y, Long H, Wang H, Xu D, Wang Z (2004)
HERG K+ channel conductance promotes H2O2 induced apop-
tosis in HEK293 cells: cellular mechanisms. Cell Physiol
Biochem 14:121–134
Hoffman R, Murnane MJ, Benz EJ, Prohaska R, Floyd V, Dainiak N,
Forget BG, Furthmayr H (1979) Induction of erythropoietic
J Membrane Biol (2007) 219:49–61 59
123
colonies in a human chronic myelogenous leukemia cell line.
Blood 54:1182–1187
Itoh T, Tanaka T, Nagai R, Kamiya T, Sawayama T, Nakayama T,
Tomoike H, Sakurada H, Yazaki Y, Nakamura Y (1998)
Genomic organization and mutational analysis of HERG a gene
responsible for familial long QT syndrome. Hum Genet
102:435–439
Jones EMC, Roti Roti EC, Wang J, Delfosse SA, Robertson GA
(2004) Cardiac IKr channels minimally comprise hERG 1a and
1b. J Biol Chem 279:44690–44694
Kagan A, Melman YF, Krumerman A, McDonald TV (2002) 14-3-3
amplifies and prolongs adrenergic stimulation of HERG K+
channel activity. EMBO J 21:1889–1898
Kirchberger NM, Wulfsen I, Schwarz JR, Bauer CK (2006) Effects of
TRH on heteromeric rat erg1a/b K+ channels are dominated by
the rerg1b subunit. J Physiol 571:27–42
Klein E, Ben-Bassat H, Neumann H, Ralph P, Zeuthen J, Polliack A,
Vanky F (1976) Properties of the K562 cell line, derived from a
patient with chronic myeloid leukemia. Int J Cancer 18:421–431
Kupershmidt S, Snyders DJ, Raes A, Roden DM (1998) A K+ channel
splice variant common in human heart lacks a C-terminal
domain required for expression of rapidly activating delayed
rectifier current. J Biol Chem 273:27231–27235
Lees-Miller JP, Kondo C, Wang L, Duff HJ (1997) Electrophysio-
logical characterization of an alternatively processed ERG K+
channel in mouse and human hearts. Circ Res 81:719–726
Li GR, Feng J, Yue L, Carrier M, Nattel S (1996) Evidence for two
components of delayed rectifier K+ current in human ventricular
myocytes. Circ Res 78:689–696
Li X, Xu J, Li M (1997) The human D1261 mutation of the HERG
potassium channel results in a truncated protein that contains a
subunit interaction domain and decreases the channel expression.
J Biol Chem 272:705–708
London B, Trudeau MC, Newton KP, Beyer AK, Copeland NG,
Gilbert DJ, Jenkins NA, Satler CA, Robertson GA (1997) Two
isoforms of the mouse ether-a-go-go–related gene coassemble to
form channels with properties similar to the rapidly activating
component of the cardiac delayed rectifier K+ current. Circ Res
81:870–878
Lozzio CB, Lozzio BB (1975) Human chronic myelogenous cell line
with positive Philadelphia chromosome. Blood 45:321–334
Morais Cabral JH, Lee A, Cohen SL, Chait BT, Li M, Mackinnon R
(1998) Crystal structure and functional analysis of the HERG
potassium channel N terminus: a eukaryotic PAS domain. Cell
95:649–655
Pannaccione A, Castaldo P, Ficker E, Annunziato L, Tagliatela M
(2002) Histidines 578 and 587 in the S5-S6 linker of the human
ether-a-gogo related gene-1 K+ channels confer sensitivity to
reactive oxygen species. J Biol Chem 277:8912–8919
Paulussen A, Raes A, Matthijs G, Snyders DJ, Cohen N, Aerssens J
(2002) A novel mutation (T65P) in the PAS domain of the
human potassium channel HERG results in the long QT
syndrome by trafficking deficiency. J Biol Chem 277:48610–
48616
Petrecca K, Atanasiu R, Akhavan A, Shrier A (1999) N-Linked
glycosylation sites determine HERG channel surface membrane
expression. J Physiol 515:41–48
Pillozzi S, Brizzi MF, Balzi M, Crociani O, Cherubini A, Guasti L,
Bartolozzi B, Becchetti A, Wanke E, Bernabei PA, Olivotto M,
Pegoraro L, Arcangeli A (2002) HERG potassium channels are
constitutively expressed in primary human acute myeloid
leukemias and regulate cell proliferation of normal and leukemic
hemopoietic progenitors. Leukemia 16:1791–1798
Robertson GA, Jones EMC, Wang J (2005) Gating and assembly of
heteromeric hERG1a/1b channels underlying IKr in the heart.
Novartis Found Symp 266:4–18
Rutherford TR, Clegg JB, Weatherall DJ (1979) K562 human
leukaemic cells synthesise embryonic haemoglobin in response
to haemin. Nature 280:164–165
Sanguinetti MC, Jurkiewicz NK (1990) Two components of cardiac
delayed rectifier K+ current. Differential sensitivity to block by
class III antiarrhythmic agents. J Gen Physiol 96:195–215
Sanguinetti MC, Chang J, Curran ME, Keating MT (1995) A
mechanistic link between an inherited and an acquired cardiac
arrythmia: HERG encodes the IKr potassium channel. Cell
81:299–307
Sanguinetti MC, Xu QP (1999) Mutations of the S4-S5 linker alter
activation properties of HERG potassium channels expressed in
Xenopus oocytes. J Physiol 514:667–675
Schonherr R, Heinemann SH (1996) Molecular determinants for
activation and inactivation of HERG, a human inward rectifier
potassium channel. J Physiol 493:635–642
Schwarz JR, Bauer CK (2004) Functions of erg K+ channels in
excitable cells. J Cell Mol Med 8:22–30
Shoeb F, Malykhina AP, Akbarali HI (2003) Cloning and functional
characterization of the smooth muscle ether-a-go-go-related
gene K+ channel. Potential role of conserved amino acid
substitution in the S4 region. J Biol Chem 278:2503–2514
Smith GAM, Tsui HW, Newell EW, Jiang X, Zhu XP, Tsui FWL,
Schlichter LC (2002) Functional upregulation of HERG K+
channels in neoplastic hematopoietic cells. J Biol Chem
277:18528–18534
Spector PS, Curran ME, Zou A, Keating MT, Sanguinetti MC (1996a)
Fast inactivation causes rectification of the IKr channel. J Gen
Physiol 107:611–619
Spector PS, Curran EC, Keating MT, Sanguinetti MC (1996b) Class
III antiarrhythmic drugs block HERG, a human cardiac delayed
rectifier K+ channel. Open channel block by methanesulfonan-
ilides. Circ Res 78:499–503
Taglialatela M, Castaldo P, Iossa S, Pannaccione A, Fresi A, Ficker E,
Annunziato L (1997) Regulation of the human ether-a-gogo
related gene (HERG) K+ channels by reactive oxygen species.
Proc Natl Acad Sci USA 94:11698–11703
Tsiftsoglou AS, Wong W, Tsamadou AI, Robinson SH (1991)
Cooperative effects of hemin and anthracyclines in promoting
terminal erythroid maturation in K562 human erythroleukemia
cells. Exp Hematol 19:928–933
Wang L, Feng ZP, Kondo CS, Sheldon RS, Duff HJ (1996)
Developmental changes in the delayed rectifier K+ channels in
mouse heart. Circ Res 79:79–85
Wang S, Liu S, Morales MJ, Strauss H, Rasmusson RL (1997a) A
quantitative analysis of the activation and inactivation kinetics of
HERG expressed in Xenopus oocytes. J Physiol 502:45–60
Wang S, Morales MJ, Liu S, Strauss HC, Rasmusson RL (1997b)
Modulation of HERG affinity for E-4031 by [K+]o and C-type
inactivation. FEBS Lett 417:43–47
Wang J, Trudeau MC, Zappia AM, Robertson GA (1998) Regulation of
deactivation by an amino terminal domain in human ether-a-go-
go-related gene potassium channels. J Gen Physiol 112:637–647
Wang J, Myers CD, Robertson GA (2000) Dynamic control of
deactivation gating by a soluble amino-terminal domain in
HERG K+ channels. J Gen Physiol 115:749–758
Wang H, Zhang Y, Cao L, Han H, Wang J, Yang B, Nattel S, Wang Z
(2002) HERG K+ channel, a regulator of tumor cell apoptosis
and proliferation. Cancer Res 62:4843–4848
Wang Z (2004) Roles of K+ channels in regulating tumour cell
proliferation and apoptosis. Pfluegers Arch 448:274–286
Warmke JW, Ganetzky B (1994) A family of potassium channel
genes related to eag in Drosophila and mammals. Proc Natl
Acad Sci USA 91:3438–3442
Zhang M, Liu J, Jiang M, Wu DM, Sonawane K, Guy HR, Tseng GN
(2005) Interactions between charged residues in the
60 J Membrane Biol (2007) 219:49–61
123
transmembrane segments of the voltage-sensing domain in the
hERG channel. J Membr Biol 207:169–181
Zhou Z, Gong Q, Ye B, Fan Z, Makielski JC, Robertson GA, January
CT (1998) Properties of HERG channels expressed in HEK cells
studied at physiological temperature. Biophys J 74:230–241
Zou A, Curran ME, Keating MT, Sanguinetti MC (1997) Single
HERG delayed rectifier K+ channels expressed in Xenopusoocytes. Am J Physiol 272:Hl309–Hl314
J Membrane Biol (2007) 219:49–61 61
123