HELICOPTER ROTOR NOISE GENERATION ROTOR NOISE GENERATION AND PROPAGATION by ... Applications of the...
117
USAAVLABS TECHNICAL REPORT 66-4 1 HELICOPTER ROTOR NOISE GENERATION AND PROPAGATION By Robert Scklegel Robert King Harold Mull October 1966 U.S. ARMY AVIATION MATERIEL LABORATORIES FORT EUSTIS, VIRGINIA CONTRACT DA 44-177-AMC-141(T) SIKORSKY AIRCRAFT DIVISION OF UNITED AIRCRAFT CORPORATION STRATFORD, CONNECTICUT Distributiion of this document is unlimited V T !
Transcript of HELICOPTER ROTOR NOISE GENERATION ROTOR NOISE GENERATION AND PROPAGATION by ... Applications of the...

USAAVLABS TECHNICAL REPORT 66-4
1 HELICOPTER ROTOR NOISE GENERATION
AND PROPAGATION
By
Robert Scklegel
Robert King
Harold Mull
October 1966
U. S. ARMY AVIATION MATERIEL LABORATORIESFORT EUSTIS, VIRGINIA
CONTRACT DA 44-177-AMC-141(T)SIKORSKY AIRCRAFT
DIVISION OF UNITED AIRCRAFT CORPORATIONSTRATFORD, CONNECTICUT
Distributiion of thisdocument is unlimited VT !

Disclaimers
The findings in this report are not to be construed as an official Depart-meent of the Army position unless so .' -Ignated by othei ý,{horizeddocuments.
When Government drawings, specifications, or other data are used forany purpose other than in connection with a definitely related Governmentprocurement operation, the United States Government thereby incurs noresponsibility nor any obligation whatsoever; and the fact that the Govern-ment may have formulated, furnished, or in any way supplied the saiddrawings, specifications, or other data is not to be regarded by impli-cation or otherwise as in any manner licensing the holder or any otherperson or corporation, or conveying any rights or permission, to manu-facture, use, or sell any patented invention that may in any way berelated thereto.
Disposition Instructions
Destroy this report when no longer needed. Do not return it to theoriginator.
]/ -

DEPARTMENT OF THE ARMYU. 5- ARMY AVIATION MATERIEL LABORATORIES
FORT EUSTIS. VIRGINIA 23604
This report has been reviewed by the U. S. Army
Aviation Materiel Laboratories and is considered
to be technically sound. This report is disseminated
for the exchange of Information and the stiuulation
of ideas.

Task IP121401AI4801
Contract DA 44-177-AMC-141 (T)USAAVLABS Technical Report 66-4
October 1966
HELICOPTER ROTOR NOISE GENERATIONAND PROPAGATION
by
RONALD SCHLEGELROBERT KINGHAROLD MULl.
Prepared by
Sikorsky AircraftDivision of United Aircraft Corporation
Stratford, Connecticut
for
U. S. ARMY AVIATION MATERIEL LABOR. TORIESFORT EUSTIS, VIRGINIA
Distribution of thisdocument is unlimited
Ii'

SUMMARY
:'- An improved method is presented for calculating rotor system over-all vortex noise and frequency spectra for stalled and unstalled rotors.Correlation of measured and predicted vortex noise was evaluated usingtwo rotor systems operating over a wide range of speeds and thrusts.Correlation was found to be excellent. Blade tip planform studiesrevealed significant vortex noise reductions with tapered tips.
A new procedure is also derived for calculating near and far fieldrotor rotational noise with nonuniform inflow. The method extends thestandard steady load method by including the effects of harmonic airloads.Correlation studies were conducted using an H-34 helicopter. Agreementbetween low frequency measured and predicted noise was good. However,correlation with high harmonic rotational noise was poor. This is prob-
ably due to inadequate definition of high harmonic airloads.
Presented results establish the importance of high harmonic rota-tional noise for detectability and loudness, and further work is recom-mended to more accurately define high harmonic blade loading. Sincean airload measurement program is being conducted on the NH-3A,it isrecommended that a correlation program be conducted to more fullyevaluate the accuracy of the presented noise analysis program using theNH-3A airload results.
This study was performed for single rotor systems only, and in itspresent form is not directly applicable to systems with multiple rotors injuxtaposition.
iii

FOREWORD
The program was conducted by Sikorsky Aircraft Division of UnitedAircraft Corporation under Contract DA 44-177-AMC-141 (T). USAAVLABSProject Engineer was Mr. J. McGarvey. The task was begun on 28 Msy1964 and completed on 31 August 1965.
Acknowledgement is hereby made of the flight test data supplied byNASA Langley Research Center which supplement that published in NASATM X-952. Personnel associated with the program were: Messrs. KennethC. Mard, Ronald G. Schlegel, Robert J. King, David C. Carmichael,Edward R. Wood, A. Charles Buffalano and Victor Berecz of SikorskyAircraft and Mr. H. R. Mull of H. R. Mull and Associates.
V

CONTENTS
PAGE
SUIMMARY ....... .......... ............................... . iii
FOREWORD ............................................... v
LIST OF ILLUSTRATIONS ......................................... ix
LIST OF TABLES ........................................... xiii
LIST OF SYMBOLS ......................................... xiv
PHASE I - MAIN ROTOR VORTEX NOISE DURINGUNIFORM INFLOW ......................................... 1
Introduction .................................................. 1Vortex Noise Generation ............. ........................... ICalculation of Vortex Noise ............................. 2Experimental Test Program ............................. 5
PHASE II - HELICOPTER ROTATIONAL NOISE UNDERCONDITIONS OF NONUNIFORM INFLOW ..................... 7
Introduction ........................................... 7Derivation of Variable Inflow Rotational NoiseSolution ............................................... "8Experimental Test Program ............................. 17
Correlation of Measured and Calculated RotationalNoise ................................................. 19
Applications of the Rotational Noise Solution .............. 21
PHASE III - ROTOR DESIGN TECHNIQUES FORALLEVIATION OF NOISE ................... 22
Vortex Noise Reduction ...................................... 22Rotational Noise Reduction .............................. 25Blade Slap ............................................. 28
CONCLUSIONS ............................................. 65
RECOMMENDATIONS ...................................... 66
vii

cONTENS (Con't)
PAGE
BIBLIOGRAPHY .............................................. 67
DISTRIBLUrION ............................................... 71
APPENDIXES .............................................. 73
1. Sample Calculation of Vortex Sound Levels .......... 73H1. Vortex Noise Test Instrumentation .................. 76II. Calculation of Partial Derivatives .................. 77IV. Approximation of Chordwise Pressure Distribution
as a Step Function Plus Scale Shift .................. 79V. Definition of Blade Pitch Angle ...................... 81VI. Description of Program for Calculating Rotational
Noise ........................................... 82VII. Sample Calculation - Assumed Relationship
Between Blade Loading, Thrust and Torque .......... 97VIII. Rotational Noise Test Instrumentation. .............. 98IX. Rotor System Parameters and Loads for Phase mI
Study ............................................ 99
viii

ILLUSTRATIONSFIGURE PAGE
I Vortex Noise Test Arrangement and Rotor Test Stand 6
2 Rotor System Geometry .............................. 10
3 Field Point Location ................................. 10
4 Blade Normal Differential Pressure Location .......... 12
5 Pressure Time History of Blade Passing over anElemental Disk Area ................................ 12
6 Step Function ....................................... 13
7 Aerodynamic Forces Generated by a Blade ............. 14
8 Comparison of Sikorsky Program and GurinEquation Results at 320-Foot Radius. .................. 16
9 Comparison of Results From Developed Solution andGarrick and Watkins' Results ......................... 16
10 S-58 Helicopter.....e............................. 17
11 Rotational Noise Test Layout ......................... 18
12 Chordwise Normal Force Distribution ................. 21
13 Chordwise Normal Force Distribution with Reverse Flow 21
14 Single Rotor HelicopterTypical Angle of AttackDistribution ........................................ 29
15 Occurrence of Stall in the Rotor Disk ................. 30
16 Single versus Tandem Rotor Noise in Approach ........ 31
17 S-58 Blade Differential Pressure Time History Duringan 80-Knot, 1/2g Turn at 85 percent Span .............. 32
18 Rotational Noise Harmonic Content .................... 33
19 Spectrum Below Stall ................................. 42
ix
I
a i I i I pI

I
ILLUSTRATIONS (Con't)FIGURE PAGE
20 Spectrum Above Stall ............................... 42
21 Drag-Divergence Curve for the CH-3C ............... 43
22 Onset of Drag-Divergence ........................... 44
23 Calculated and Measured Levels -Hover .............. 44
24 Calculated and Measured Levels - 40-Knots ........... 45
25 Calculated and Measured Levels - 80-Knots ........... 47
26 Calculated and Measured Levels - 110-Knots .......... 49
27 Calculated and Measured Levels - 70-Knot Cyclic Pullout 51
28 Calculated Noise Levels at 300 feet, 20, 000 PoundsThrust, 5 Blades .................................... 53
29 Sound Pressure Levels versus Thrust for 3 TipSpeeds, CH-3C ..................................... ... 53
30 Sound Pressure Levels versus Thrust for 3 TipSpeeds, CH-53A ................................... 54
31 T1 apezoidal and Square Tip Planforms.............. 54
32 Sound Pressure Level versus Thrust - Trapezoidal Tips. 55
33 Octave Band Levels for Low and High Pitch (CH-3C) .... 55
34 Comparison of Level at Strouhal Frequency of Squareand Trapezoidal Tips @ 203 RFM ..................... 56
35 Detection Level Criteria for Aircraft-Spectrum Level .. 56
36 An S -58 Helicopter Noise Spectrum at Hover ........... 57
37 Effect of Blade Loading Distribution on Noise HaTrnonicLevel .................................. . . ... 0.. 57
38 Effect of 4-per-rev Blade Loading on Harm,.. AiseLevels ................. ............... 58
x

ILLUSTRATIONS (Can't)
FIGURE PAGE
39 Effect of 1-per-rev Blade Loading on Rotational NoiseHarmonics ........................................ 58
40 Effect of 2-per-rev Blade Loading on Rotational NoiseHarmonics ........................................ 59
41 Effect of 3-per-rev Blade Loading on Rotational NoiseHarmonics ........................................ 59
42 Effect of 4-per-rev Blade Loading on Rotational NoiseHarmonics ........................................ 60
43 Effect of 5-per-rev Blade Loading on Rotational NoiseHarmonics ........................................ 60
44 Effect of'6-per-rev Blade Loading on Rotational NoiseHarmonics ........................................ 61
45 Effect of 7-per-rev Blade Loading on Rotational NoiseHarmonics ........................................ 61
46 Influence of the Ist to the 5th Blade Loading Harmonicson Rotational Noise Harmonics ..................... 62
47 Influence of the 6th to the 10th Blade Loading Harmonicson Rotational Noise Harmonics ..................... 62
48 Additional Noise at the First to the Fifth Noise HarmonicFiequencies Due to the Introduction of I-per-rev to 10-per-rev Harmonic Blade Loadings of One Quarter the Ampli-tude of the Steady Component ........................ 63
49 Sound Level Caused by a Rotor with Steady Loading Plusa Harmonic Blade Loading of One Quarter the- Amplitudeof the Steady ...... ................................ . 64
50 Vortex Noise Test Instrumentation ................... 76
51 Time History of Blade Passage Over r Jr J* After TimeShift .............................................. 80
xi
I:
! i

ILLUSTRATIONS (Con't)
FIGURE PAGE
52 Step Function Approximation ...................... 80
53 Computer Flow Diagram ......................... 83
54 Input Format ......................... ..... 86
55 Sample Input Sheet .............. .o. ............... 87
56 Sample Output Sheet ........ o ...... o ............. 92
57 Rotational Noise Test Instrumentation . . ......... 98
58 Blade Aerodynamic Loading ..................... 99
xii
TABLES
TABLES PAGE
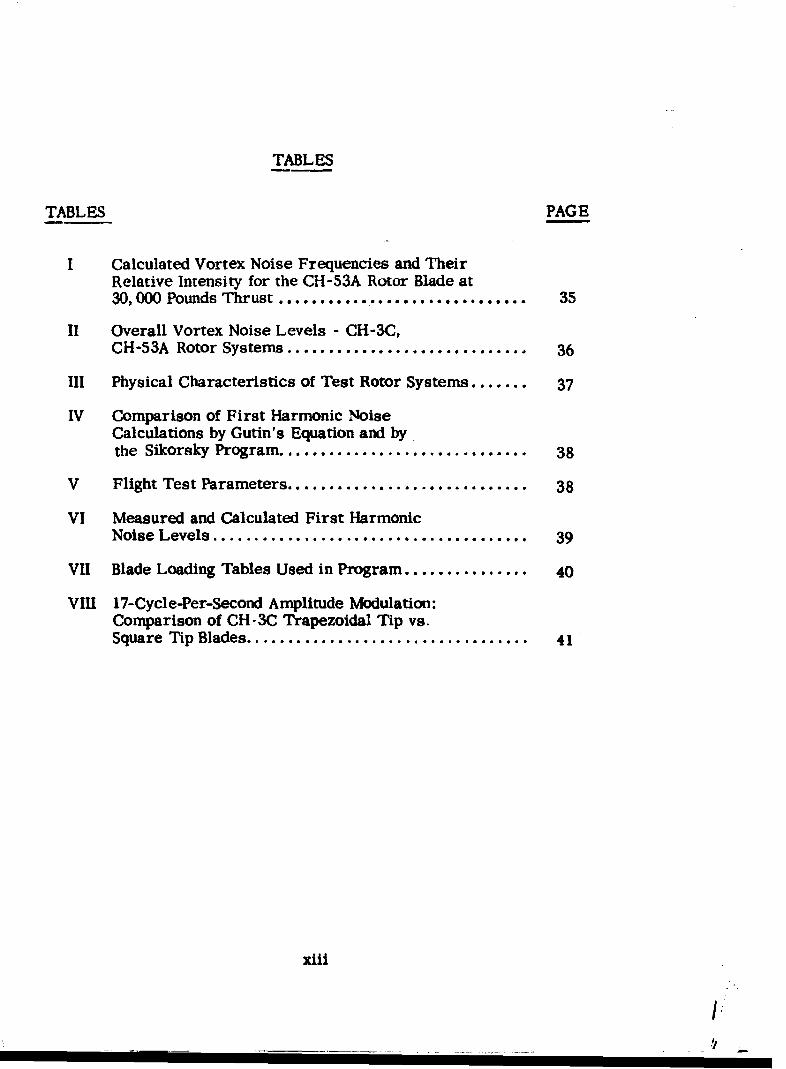
I Calculated Vortex Noise Frequencies and TheirRelative Intensity for the CH-53A Rotor Blade at30, 000 Pounds Thrust .............................. 35
II Overall Vortex Noise Levels - CH-3C,CH-53A Rotor Systems ............................. 36
III Physical Characteristics of Test Rotor Systems ....... 37
IV Comparison of First Harmonic NoiseCalculations by Gutin's Equation and by.the Sikorsky Program .............................. 38
V Flight Test Parameters ............................. 38
VI Measured and Calculated First HarmonicNoise Levels ...................................... 39
VII Blade Loading Tables Used in Program ............... 40
VIII 17-Cycle-Per-Second Amplitude Modulation:Comparison of CH-3 C Trapezoidal Tip vs.Square Tip Blades .................................. 41
xiii
! ! | | |.

LIST OF SYMBOLS
A B blade area, square feet
a blade chord, feet
6 blade thickness, feet
form drag coefficient
CL coefficient of fift
C speed of sound, feet oer second
J diameter, feet
db decibel
F force vector, pounds
f arbitrary force per unit volume
f frequency, cycles per second
Fourier coefficient
Ii altitude, positive above rotor, feet
projected blade thickness, feet
L blade section loading, pounds per inch
M Mach number
MT tip Mach number
m order of harmonic
n number of blades
P pressure, pounds per square inch
P sound pressure, pounds per square inch
p sound pressure for Tuth harmonic, pounds per square inch
xiv
LIST OF SYMBOLS (Con't)
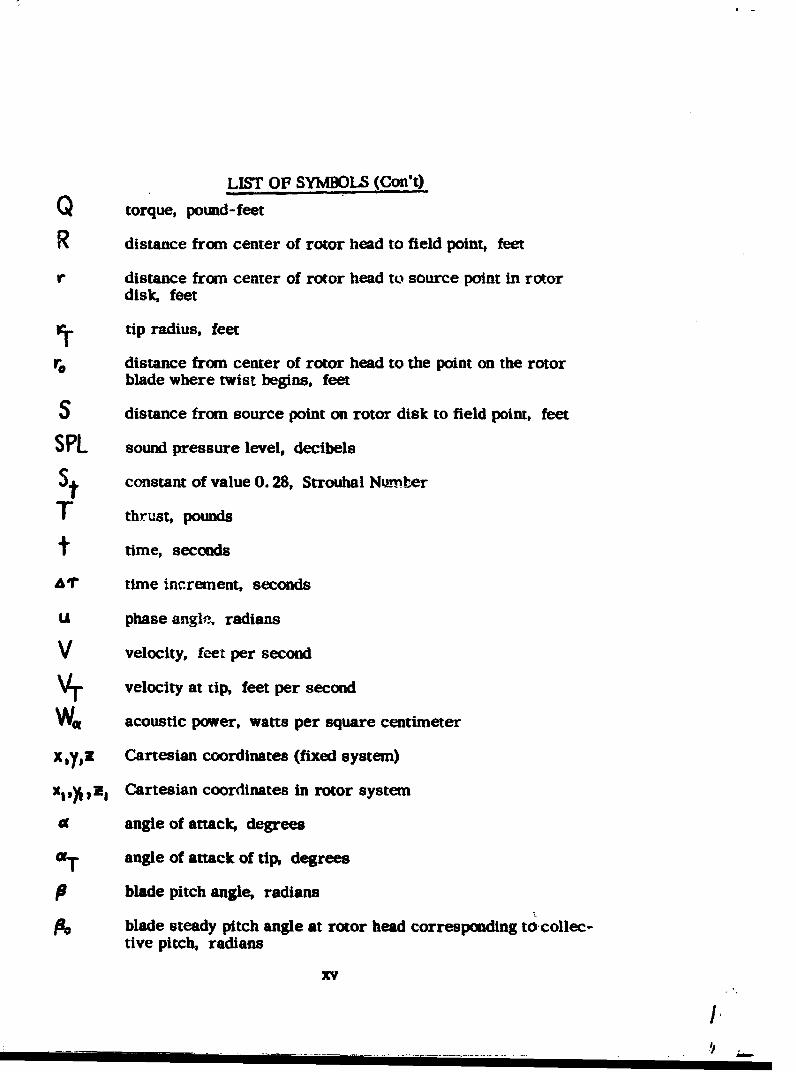
Q torque, pound-feet
R distance from center of rotor head to field point, feet
r distance from center of rotor head to source point in rotordisk, feet
r- tip radius, feet
distance from center of rotor head to the point on the rotorblade where twist begins, feet
S distance from source point on rotor disk to field point, feet
SPL sound pressure level, decibels
St constant of value 0. 28, Strouhal Numr-er
T thrust, pounds
t time, seconds
AT time increment, seconds
U phase angle, radians
V velocity, feet per second
VT velocity at tip, feet per second
Wag acoustic power, watts per square centimeter
x 1yz Cartesian coordinates (fixed system)
x•1 IN 7 Cartesian coordinates in rotor system
0( angle of attack, degrees
FT angle of attack of tip, degrees
p blade pitch angle, radians
blade steady pitch angle at rotor head corresponding to collec-tive pitch, radians
xv
• .

LIST OF SYMBOLS (Con't)
P.•l cosine component of cyclic pitch (ref: " = 0), radians
p, sine component of cyclic pitch (ref: . 0), radians
blade twist rate, radians per inch
60 field point azimuth angle, degrees
blade chord location, feet
angle between rotor plane and field point - positive upward,degrees
azimuth angle in rotor plane, degrees
ni rotor rotational speed, radians per second
xvi

PHASE I
MAIN ROTOR VORTEX NOISE DURING UNIFORM INFLOW
INTRODUCTION
The task of Phase I was to develop an improved procedure for pre-dicting single rotor helicopter main rotor vortex noise under conditionsof uniform inflow. This task was accomplished by a review of vortexnoise theory, development of a formula and a program of rotor standmeasurements. Although the proposed work covered only the testing ofone main rotor system under three conditions each of disk loading androtor tip speed, the availability of another rotor system provided anopportunity to check analytical accuracy.
Previous studies of vortex noise generation by helicoptei rotor sys-tems have been limited to prediction of the overall levels for systemsoperating out of stall. Very little has been reported on prediction of thefrequency spectrum for conditions either in or below stall. However,the importance of the spectral distribution of the noise in assessing theeffects of rotor design on such psycho-acoustic factors as detectabilityand hearing damage requires the estimation of the spectrum shape.Consequently, the individual spectra were studied in detail.
This report presents the results of this study including an improvedmethod of calculation of the noise levels and normalized spectra foroperation in and out of stall. Sample spectra are given for both condi-tions. The improved method consists of corrections to Harvey Hubbard'sformula (Reference 16) to account for changes in lift coefficient. Thelift coefficient is now a variable, and the actual blade area is used ratherthan a calculated effective blade area. The coefficients to be used inthis formula have been established empirically from CH-3C and CH-53Arotor test stand data.
VORTEX NOISE GENERATION
The subject of sound generation by fluid flow has been studied inten-sively by a number of investigators. Recent advances in the understand-ing of how sound is generated and propagated by unsteady aerodynamicphenomena such as vortices have permitted rigorous mathematical treat-ment. Reference 26 contains a complete physical and mathematical des-cription of the phenomena of vortex sound.
1
L

Briefly, vortex sound is generated by the fluid force on an objectarising from the formation and shedding of vortices in the flow past it.This results in a dipole form of radiation in which the strength of thesource is proportional to the sixth power of the free-stream velocity.
For a rod or bluff body operating at low Reynolds numbers, the vor-tices are shed alternately from each side of the rod in regular vortexshedding. The shedding of vortices causes fluctuating lift and drag. Thesound associated with the fluctuating drag is much weaker and is doublethe frequency of that associated with lift.
In the usual range of Reynolds numbers (approximately 5 x 10⁶)associated with a rotating wing, the sound frequency is given by
f- =St (1)where V is the free-stream velocity and d is the thickness of the rod orbluff body. The Strouhal number, , has been experimentally deter-mined to have a value of 0.28 (Reference 28). Since there is a differentvelocity associated with each station over the span, there is a broadband of frequencies. However the intensity of sound is proportional tothe sixth power of the velocity V, so that the frequencies of interest areassociated with the area near the tip where the velocity is highest.Table I shows the calculated frequencies and their relative intensity forthe CH-53A rotor blade. From Table I, it can be seen that the mostintense sound appears in the octave from 300 to 600 cps. For the pur-poses of this report, all of the sound from 150 to 9600 cps was con-sidered to be vorrex sound.
Although vortex sound is the principal source of medium and highfrequency noise, boundary layer turbulence and noise from blade irregu-larities can contribute to the overall noise. Turbulence on the blade isanother source of frequency broadening. The turbulence causes anirregular rate of shedding. If the blade is operating in a region beyondthe onset of tip stall, there is a sharp rise in the 1200-to 2400-cps octaveband associated with the flow separation in the region near the tip. Thisflow separation can be associated with blade slap as shown in Phase III.
CALCULATION OF VORTEX NOISE
Overall Level
A theory of vortex sound was first presented by E. Y. Yudin (Refer-ence 33). Yudin's theory for the radiation of vortex sound from rotatingrods was based on a dimensional analysis of the fP ow parameters around
2

the rods. In developing his theory, Yudin assumed that a rigid body in amoving fluid has forces impressed upon it due to the shedding of vor-tices. The sound radiation is the same in this case as that from equalbut opposite forces acting directly on an otherwise still fluid.
Curle (Reference 4), in his analysis of the influence of solid bounda-ries on aerodynamic sound, showed that Yudin's result could be obtainedformally from Lighthill's theory (Reference 19) in which the total fluidstress is associated with the local dipole strength. Curie has thusshown that Yudin's relationship was correct. Yudin's result can bewritten as follows:
W~on t~C ~ Sf r V (2)
In using equation 2 to calculate vortex noise from rotating wings,some of the terms can be considered to be constant because their rangeof permissible values is too small to affect the results appreciably.These arer, ¢C, C. and St. Although C., the form drag coefficient,appears in the equation tolthe fourth power, the range in lift between anunloaded aircraft and a fully loaded aircraft is small enough to acceptan average value for C, for approximate calculations. Lumping theconstant terms then gives the follwing-
We r const , r W (3)
The two helicopter rotor systems tested had untapered 0012 airfoils.Therefore, a constant proportion exists between the chord and the thick-ness h. Thus, the sound power is proportional to the chord length timesthe blade length r, or blade area. Furthermore, since the noise fromeach blade is additive, the total sound power will be proportional to theblade area of the rotor system. This simplifies the equation to thefollwing: w.=onst. A9 r (4)
Equation 4 can now be compared directly to Hubbard's formula(Reference 16) which was used to calculate the sound pressure level ofthe vortex noise from propellers, which is as follows:
SPL= f ' _I (5)
Hubbard's measurements were made at a distanc of 300 feet and anangle of 1056 from the axis of rotation. The constM ti in equation 5 wasdetermined empirically for the measurement position. The terms
3
________-

10 log and 10-16 give the sound pressure level in decibels.
Hubbard's formula is based on CL 0. 4. He adjusts the formulafor other values of CL by using an efifctive blade area, A Intensiveanalysis of experimental rotor test data indicated that greter accuracycould be attained by using the actual blade area and coefficient of lift.The test data yielded a value of 6.1 x 10⁻²⁷ for the constant K of equation5 for use in a modified equation. Variations in lift for the modifiedequation are accounted for by addition of the term 20 log CL/0.4 wherethe 0.4 is the coefficient of lift used by Hubbard in equation 5. Theresulting equation is as follows: 6
&.IlX;l27A(o7 C()SPL= iolos Asi +20logj6a
This equation may be rewritten in a more convenient form for sea level70"F conditions as follows:
SPL I4z 09V6.7 +2 aiT- los As-3.s57 (6b)
Overall vortex noise levels were calculated for the CH-3C andCH-53A rotor systems by means of equations 5 and 6. The results ofthese calculations are shown in Table 11. All numbers have beenrounded off to the nearest db. As can be seen in Table II, the calculatedlevels agree with the measured levels within 2 db. Also, it can be seenthat equation 5 is sufficiently accurate for all but the most stringentrequirements.
Since equations 5 and 6 are for a distance of 300 feet from the centerof rotation, the calculated values in Table II have been increased by 2.6db to correct for the distance of 225 feet to the point of measurement.The usual distance corrections (20 log 300/R) can be made for distancesother than 300 feet. *
Spectrum Shape
The spectrum shape of a blade operating out of stall is shown inFigure 19. This condition is present at low angles of attack at the tip.The peak frequency is determined by the Strouhal number which isdefined as follows:
In the usual range of Reynolds numbers for a helicopter rotor, theStrouhal number is 0. 28. In keeping with Yudin's "round rod" approach,
SA sample calculation is shown in Appendix I.
4
4.

the projected blade thickness h. is defined by the following equation:
,': 6 cosct + a sina (8)where b is the blade thickness, A the chord length and o the angle ofattack.
Tip Stall
When unsteady aerodynamic forces appear near the tip of a bladedue to the occurrence of either stall or drag divergence, there is adefinite change in the shape of the vortex noise level frequency spectrum.A portion of the rotor test data acquired was taken while portions of theblades were experiencing drag divergence (and probably stall as well),and the general spectrum obtained is shown in Figure 20. Compare thisspectrum with that of Figure 19 where no separated flow is present andit is evident that the separated flow has caused a rise in the levels of theoctaves above the peak octave. Using these curves (Figures 19 and 20),one may determine whether stall or drag divergence is present in ameasured vortex noise spectrum. For prediction purposes, the properspectrum may be selected on the basis of aerodynamic stall and drag-divergence criteria.
The exact point where tip stall begins is difficult to determine accu-rately. At that point, however, there is a deterioration of the lift/dragratio. Figure 21 is a drag-divergence curve for the CH-3C blade. Theexperimental data points plotted indicated that some of the Mach number-angle of attack combinations are in the region of drag divergence.
In Figure 22 the difference between the 300 to 600 octave levels andthe 1200 to 2400 octave tevels is plotted against the blade tip pitch for thesame data points of Figure 21. The rise of the 1200-to 2400-cps octaverelative to the 300 to 600 octave corresponds with the data points thatlie above the drag-divergence curves. The rise appears less abrupt forthe high Mach numbers.
EXPERIMENTAL TEST PROGRAM
General
The object of the test program was to measure the vortex noiseradiated by the rotor system over a range of speeds and loads. Tworotor systems were measured at three different speeds each and atseveral different thrusts at each speed. Test instrumentation isdescribed in Appendix 11.
5

Description of Rotor Systems
Both of the two systems tested used untapered 0012 airfoils and hadsquare tips. The CH-3C system had five rotor blades and a diameter of62 feet. The CH-53A system had six blades and a diameter of 72 feet.Aithough the program originally called for tests of only one rotor system,the opportunity to check the results with another quite different arrange-ment was valuable. The physical characteristics of each system areshown in Table I11.
Acoustical Measurements
The rotors were tested on a whirl stand approximately 70 feet abovethe ground. Figure I shows the test arrangement. The ground planearound the test stand was covered with heavily matted dry grass exceptfor a roadway. The microphone was mounted on a wire fence 225 feetto the east of the stand and about six feet above the ground.
WMlE PIIIre
RmOTO V A
STATION
/ J-
Figure 1. Vortex Noise Test Arrangement and Rotor Test Stand
There was a grassy ridge beyond the fence and a wooded hill to the westof the stand. All measurements were made at the same microphoneposition. It is assumed that the measurements were the direct fieldfrom the test rotor because (1) the portion of the spectrum of interestwas above 150 cps, (2) the test rotor was 70 feet above the ground, and(3) the ground waG covered with an absorbent grass cover.
Since the sound fields are strongly affected by winds, measurementswere made when the ambient wind was below 5 knots. Thus the measureddata should closely approximate free field conditions unaffected by non-uniform inflow.
6

PHASE II
HELICOPTER ROTATIONAL NOISE UNDER CONDITIONS OF
NONUNIFORM INFLOW
INTRODUCTION
Rotational noise, which is comprised of discrete frequencies atmultiples of che blade passage frequency, as opposed to vortex noise,which is broad-band random noise centered about the Strouhal frequency,was first defined by Gutin (Reference 11) in 1948. Since the establish-ment by Gutin's theory, there have been a number of outstanding studies(References 1, 7, 14, 17, 30, 34) involving propeller rotational noisegeneration and propagation. These studies have extended the rotationalnoise theory developed by Gutin to account for noise in the near field,thickness noise, and noise field distortion due to source translationalmotion. It is desirable to make use of the techniques developed throughthese studies to obtain increased accuracy where Gutin's model is foundto be inadequate.
The study undertaken here has followed along the lines of thosementioned above in that it seeks to extend Gutin's basic theory for noisegenerated by a particular type of propeller, in this case the helicopterrotor. Gutin's theory is still commonly used for propeller noise predic-tion but is subject to the following limitations:
L Uniform axial inflow is maintained throughout the propellerdisk.
2. Field points, at least 5 diameters from the hub, are calculated(far field).
3. Only first harmonic noise is calculated.4. Propeller speed normal to the axis is held below approximately
Mach 0. 3.
In the case of the helicopters, the inadequacy of Gutin's theory isobvious; diameters are large and inflow is nonuniform because of pre-dominantly nonaxial translational motion. Most rotor noise field pointsof interest fall within the "near field", and generally the first rotationalnoise harmonic falls below the audible frequency range, making it lessimportant than its harmonics.
In general, the intensity of these harmonics cannot be predictedaccurately. This report represents a newly developed mathematicaltheory which removed the limitations of Gutin's theory as applied to therotational noise of single rotor helicopters.
7
V

'The prediction method utilizes blade section loading, both steady andvarying at integral multiples of the main rotor rotational speed, as afunction of radius and azimuth. The solution describes as many har-monics of rotational noise as the input data allows in both the near andfar field. The periodically varying blade loading comprises the variableinflow condition. This solution has been programmed by Sikorsky Air-craft as an IBM-7094 procedure.
DERIVATION OF VARIABLE INFLOW ROTATIONAL NOISE SOLUTION
The rotor system noise source will be represented by a surface ofstationary dipole radiators which simulate the normal pressure distribu-tion in the rotor disk. Shear forces as well as thickness effects areignored. It can be shown (References 7 and 18) that for sound sourcesin rectilinear motion, the acoustic pressure in the sound field can beexactly represented by the sum of pressure from stationary soundsources placed in the path of the moving source which radiate only whenthe moving source passes by. In this case the stationary sound sourcesare the dipoles in the rotor disk which radiate only when a blade(corresponding to the moving source) passes by.
Solution of Wave Equation
For the range of rotational Mach numbers and sound frequenciesconsidered here, the pressure field due to a rotating force is the sum ofpressure fields from stationary dipoles, and the radiation from thestationary dipoles satisfies the nonhomogeneous wave equation
2 P- fat V-f (9)
wheref is an arbitrary force per unit volume.
Since this wave equation is for radiation from a stationary forceinto a stationary medium, it is exact for only hover conditions. How-ever, as long as the vehicle translational Mach number is below 0. 3,the accuracy of the wave equation is considered adequate, as shown inReference 23.
Figures 2 and 3 show the geometry of the rotor system used in theWnlysis and the sound field coordinate system. The force vectorsrk, t) are restricted to the region covered by the rotor disk, and the
field point is outside of a sphere having the diameter of the rotor diskand centered at the rotor hub.
8

The solution to equation 9 for concentrated forces is given by
P (X,Y, J, t) V . , [rL.! ti] (1.0)where
2 2
S = (,-XI + (Y-Y,) + C-7is the distance from the elemental source point to the field point.
Since the forces of interest here are harmonic at integral multiplesof the rotor blade passage, the force vector may be represented by aFourier series:
i• (r~,,t) • (Y,*) IV) C t
where the steady component is neglected because it is not an acousticsignal. The component of the vector Pin the X direction is
-x (r,, (, ')
where 3jX (r, P) is the componentof r. (fr,)P) in the X direction.Similar components exist in the y ands directions.
Using these expressions in equation 10 yields
miniV'6ei~mn4 mnat) I (12)
9
I,
e C

DIR ECTION
*NEGATIVE SIG•, WICATE•'•I THAT AILSDROWN AIE IN ThlE NEGTW tF [RB•I
Figure 2. Rotor System Geometry Figure 3. Field Point Location
which reduces to
imnStf __•
S
9"(•iJS (• ) (13)
This expression describes the sound pressure p(xy., iti) at the fieldpoint x, y, z at time t due to the force componxents 3na19yacting al the point r•y in the rotor disk. Now the cumpon~nts-O-l equa-tion 13 are defined.
As previously defined
S =I(x-•?÷ (y-y,)f÷(1 -5 ,)zmwhich in spherical coordinates (Figure 3) is
iR
S- cosr cose+rcos•) +(Rcosrsin.e-rsin.•)+ (Rsin,)l
10

which reduces to1't 2_
S-PR ++r -zrRcoswcos(e-$ (14)
This is an exact representation and holds for both near and far field.From Appendix III
)§" =- cos € caseaxI.y -. cose sin 9
la -- Siar (15)
Equation 15 is valid outside of one rotor diameter from the hub.
The differential
S
becomes
1-c+ 5 (16)
Placing equations 15 and 16 into equation 13 yields for the harmonic -m
%9 ,yCOusin1 +3mSinr} {.fa+i} (7
Now the forces acting on the rotor blade remain to be
determined. vuvuPE
Blade Aerodynamic Loads
Blade pressures for this study were obtained from flight test mea-surements taken on a Sikorsky S-58 (Army CH-34) at NASA, LangleyField, Virginia (Reference 29). This data consists of differential pres-sure measurements made, on one main rotor blade during various flight
11

conditions. Data was recorded at several chordal stations and Integratedover the chord at 15-degree azimuth intervals, yielding section loadingsat these points. This was done at several blade spanwise stations. Ateach station, a harmonic analysis was performed on the section loading-azimuth position curve resulting in a steady plus 10 harmonics of theloading. This harmonic blade loading data is utilized for the presentstudy.
Transformation of Rotating Concentrated Forces to Stationary Forces
Consider a rota ngblade with a normal differential pressure dis-tribution given by &P(r, "t) and located as shown in Figure 4.
C
HUB CENTER LINE dr
r
Figure 4. Blade Normal Differential Pressure Location
The force acnng on a small blade area is APACIrand is considered to beconcentrated force when d1cdr is very small. This same force will beconsidered to be acting on a differential area at the rotor disk r&rJ"when the blade area is covering the rotor disk area (Figure 2. Thetime history of pressure as two blades pass over the area rdrJ* isshown in Figure 5.
+ TirnetFigure S. Pressure Time History of Blade Passing Over an Elemental
Disk Area
12

Note that the only time a pressure exists is when a blade covers the area.The amount of time an elemental area Is covered is finite and equal tothe time it takes for the blade to pass a given point. That is Ar4/12r.The time between blades is equal to the time requi:ed for a blade totraverse 2WVnfl radians or W'r'=Wfl/A. The magnitude of the force actingon the rotor disk is "Pr&;, and its direction is normal to the chord.After shifting scale and approximating the chordwlse pressure distribu-tion as a step function (see Appendix IV), the function of Figure 6 isobtained.
Ar-0 7d-Timet
Figure 6. Step Function
The cosine series expansion of this function is
AP(rIt) = (18)
where WISI
a -'- -1• sin(WI)A AP(lr,#) (19)
and P is the average chordal pressure on the blade.
Since average pressure data is available (Reference 29) as bladeloading data L (rfl and
L-(r,') =aPAequation 19 becomes
a.: •- siu( l) L(r•,) ((2)
13
I;

Substituting 20 into 18 yields:
A '• P(rfv, •___. 2 s mL (r, ') os(mn -mm,- ) (21)
Putting this into complex form and multiplying by rirdv" to change toforce yields
F(r,rt = ti- fp) L(r,Y-) 6 (r"t -d-•9P) r Jy- (22a)
and from Equation 11
3,a, Sin (Apr L(r, im "+*) r Jr J P (22b)
Equation 22 corresponds to theforce exerted on the rotor disk by apassing blade in the direction nor-
/ 5•. B* P mal to the blade chord. FromFigure 7, note that the out-of-plane
S, p component of is
q gmE Cw c$1# (23a)
and from Figures 2 and 7 the in-plane components are
I _ J31..S m•S9M'IM Si"* (23b)
•- ROTATION -gin= •msi~ cosY," (23c)
Figure 7. Aerodynamic Forces where
Generated by a BladePo='d-r (r-ro)+p, 4os r+T, sinf
as derived in Appendix V.
Substituting equation 22 into equation 23 and substituting the resultin equation 17 gives r A R L(rimnr)i +V+
L2Va IN s 0 )(24)
{Jm + fisin ,, sin Gcos 8cosr-sin# cosYfcoarsi.9+cos, st r 4rJ,
14

This expression after integrating, transforming to the uniform disk load-ing case, and introducing the small angle assumptions made in Refer-ences 11 and 7, reduces to the sum of equations 21 and 22 of Reference 7for Mach zero. It represents the sound pressure at a point x, y, z, attime t of the m 'th harmonic of rotational noise due to the blade sectionloading L(rV on the radius r of the blade when the blade is at azimuthlocationy'. The equation may be integrated over the rotor disk to accountfor all sources and the root mean square (rms) value of the pressurewith respect to time may be taken to correlate with sound pressuremeasurements. These operations result in the following solution:
Ip,,, f[2- +P (25)
where
s inp cos V sin(a.0-) + Coto si nJ r -r * (26b)
for which +cosB sinej rJr (26c)
U amnf4 + Jr-+*~I
This integral solution (equation 26) represents the rms sound pressureat a point x,y,i for rotational noise at the l'th harmonic of bladepassage. This solution may be used for calculating the rms soundpressure at any point in the near or far field one diameter or more fromthe rotor hub. The number of harmonics which may be calculated accu-rately is limited only by the detail of the available blade loading data.The solution's accuracy decreases with increasing rotor system trans-lational speed up to Mach 0. 3, which is the practical limit for accuracy.
The solution has been programed as an IBM-7094 procedure tofacilitate calculation. The program is described in Appendix VI.
15
I.

A trial case was run with steady loads only placed about the 0. 8radius point of the rotor as assuned in Gut-n's derivation (Reference 11).
Using relationships between blade pitch, loading, radius, etc., thetorque and thrust for this case were calculated for thso S-58 rotor system.The derivation is explained and parameters for the example are given inAppendix VII. Calculations of first harmonic noise were made at a 320-foot radius by both the Sikorsky program and by Gutin's equation forvarious elevation angles. The results of these calculations are tabulatedin Table IV and shown in Figure 8.
Agreement between the two solutionsis excellent except for the pointwhere a is -30 degrees. At thisspatial point, Gutin's solution in-volves a small difference betweentwo large numbers, and the numberof significant digits used in the handcalculation was not sufficient todefine the true magnitude.
To further check the solution'svalidity, a similar calculation was
"NunA. .- made comparing the program outputwith the near field case (Figure 4 ofGarrick and Watkins, Reference 7).The comparison is shown in Figure
Figure 8. Comparison of Sikorsky 9 for zero Mach number.Program and Gutin EquationResults at 320-Foot Radius
140
"138 SIKORSKY
M GARRICK
WATINS
132 + L v ThUST
4128
.3 -. 4 -. 3 -. 2 -. 1 0 .1
W IN FIEWD mINT PLANE
Figure 9. Comparison of Results From Developed Solution and Garrickand Watkins' Results
16

The agreement between the calculated values and those of Garrick andWatkins is excellent, the maximunm deviation being 1 db up to 1/2 diameterdownstream of the propeller.
EXPERIMENTAL TEST PROGRAM
General
Measurements of rotational noise from an S-58 (CH-34) helicopterwere made at Bridgeport Airport in Stratford, Connecticut, on April 5,1965. Physical and test parameters of the aircraft are listed in Table V.Instrumentation is described in Appendix VIII. The purpose of the testwas to provide data for comparison with the calculated data of Phase II.It was found during testing that although rotor noise harmonics up to thetenth were sometimes distinguishable above background noise, harmonicsabove the fourth (approximately 60 cps) were generally masked by engineand tail rotor noise.
Description of Test Helicoter
The S-58 (Figure 10) is a single main rotor reciprocating enginehelicopter in the 13, 000-pound weight class. The main rotor is 4bladed, with 0012 airfoil shape and untapered square tip blades.
Figure 10. S-58 Helicopter
17
I'

A.oustical Measurements
The test layout is shown in Figure 1.
SOIL
Figure 11. Rotational Noise Test Layout
The ambient wind was northeasterly at approximately 4 miles per hour,gusting occasionally to 10 miles per hour. The flight path for cruisemeasurements was from east to west directly over the south edge of therunway. The ship's altitude was 200 feet for all cruise and transientmeasurements.
For a time and location reference, a flag was dropped as the shippassed the flag station, signalling the measurement station to put a short-duration 400-cycle-per-second signal tone on the recording tape. Usingthe aircraft's indicated airspeed, its position was calculated from thissignal. One-third-octave band analysis was used and the frequenciesunde~r study went only up to 60 cps, thereby eliminating the possibility ofthe 40(0-cps tone interfering with the records.
Because the noise was a series of pu~re tones, actual bandwidth wasnot important in determining levels. One-third-octave filters were usedso as to define the individual harmonics and to accommodate the dopplershift for the flyby conditions.
18

Because of safety regulations, hover measurements were made at analtitude of 500 feet. The hover location was above the south edge of therunway.
Data was recorded with the microphone held approximately threefeet above the ground. The runway between the aircraft and microphonewas hard-surfaced. In the frequency range of interest, 15 to 60 cps, thewavelength of 75 to 18 feet precluded interference or reinforcement be-tween the incident and reflected waves.
Noise data was recorded for hover; 40-knot, 80-knot, and 110-knotcruise; and 70-knot cyclic pullout. These conditions correspond to theblade loading data of Reference 28 (Tables 4, 8, 13, 19, and 111, res-pectively).
CORRELATION OF MEASURED AND CALCULATED ROTATIONAL NOISE
Correlation of measured and calculated rotational noise levels issummarized for the first harmonic in Table VI. The calculated levelsshown are the maximum attained for flybys using NASA (Reference 29)blade loading data. The measured levels are the corresponding maxi-mums for the test flybys. The blade loading tables from Reference 29which were used are listed in Table VII. The spread of data for themeasured hover condition is due to time variation. Levels calculated byGutin's equation, using thrusts and torques as shown for the S-58, areincluded for reference. Note that the calculated and measured levelsagree within 3 db, while Gutin's equation gives levels as much as 19 dblow. Gutin's method is most nearly accurate (3 db low) during hoverwhere the inflow is almost uniform. Obviously, nonuniform inflow has asignificant effect on rotor first harmonic noise levels. The effect of non-uniform inflow is even more pronounced for the higher noise harmonics.The conclusion is that Gutin's equation is not an adequate method ofpredicting rotor noise levels during nonuniform inflow.
Figure 23 shows calculated and measured levels for a 500-foothover. The program calculated the measured data much more closelythan Gutin's equation, which predicts a rapid dropoff in level withincreasing harmonic.
It is felt that the agreement between the calculated and measuredlevels for the higher harmonics would have been closer than that shownif the flight test conditions under which the noise measurements weremade were identical with those for which the blade loading data wastaken. According to Reference 29, the blade loading test aircraft was"hovering in light wind", which implies slight, relatively steady wind
19

conditions, while during the noise measurement test, winds ranged from 4to 10 knots. The lack of agreement between the measured and calculatedlevels for the higher harmonics can be attributed partly to the uncer-tainty in blade loading harmonics caused by the variable wind velocity.
Levels for the cruise and transient flybys are shown in Figures 24through 27. As shown, the data is 1-1/2 db low at the plus 250-foot andminus 250-foot points. This error results from the frequency changedue to doppler effects reaching the band limits of the one-third-octavefilter used in the analysis. Correlation of measured and calculated datais good for the first two harmonics. It appears for some of the casesthat the distance scale is shifted. This may be attributed partially tolag in the time reference system used in the test and partially to uncer-tainty as to the test aircraft's ground speed.
Agreement between the third and fourth harmonics, and presumablyfor all higher harmonics, is poor. This can be attributed to differencesin flight conditions between blade loading test and noise test, as men-tioned earlier, and to the lack of sufficient higher harmonic content inthe NASA blade loading data (Reference 29). Blade loading containing agreater proportion of higher harmonics would yield more nearly accuratehigher harmonics of noise as explained in Phase III.
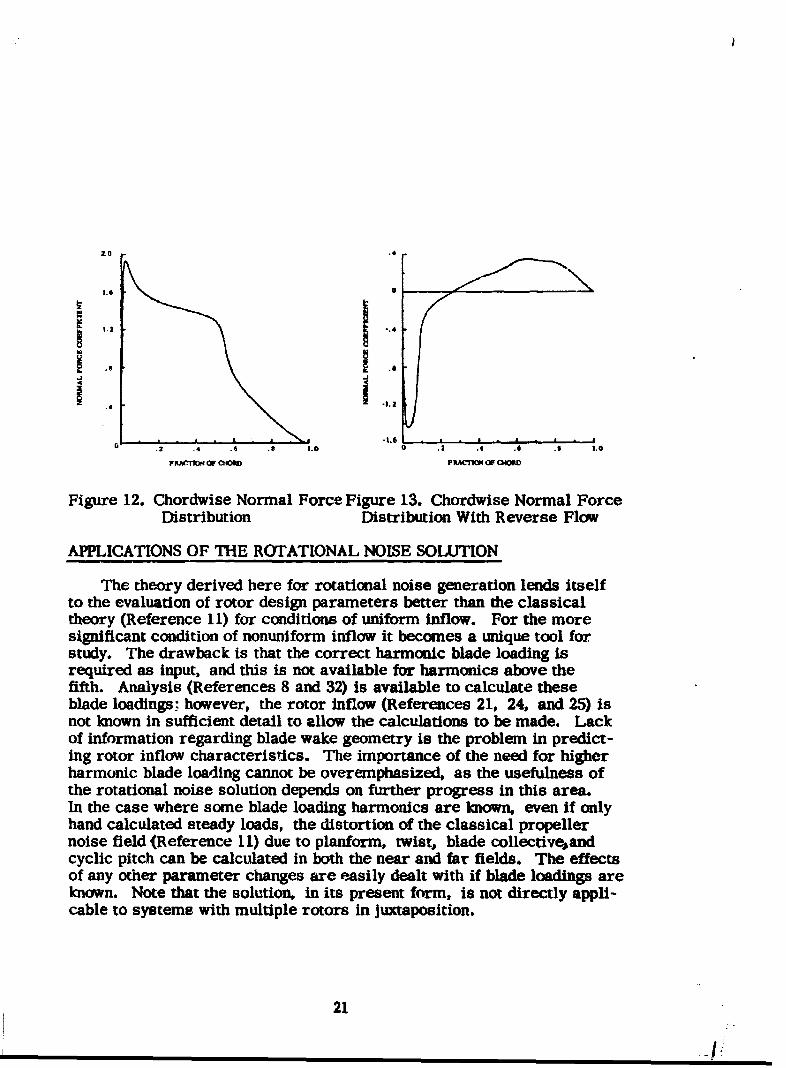
The observed chordal loading distribution for the data used in thisreport conforms to the general shape of Figure 12, which yields a har-monic level distribution similar to that of the rectangular distributionused. It should be noted that if the blade chordal pressure distributionhad exhibited the form of the one shown in Figure 13, the rectangularchordal pressure distribution used in the program would yield muchlower noise harmonic levels than actually exist. For all common casesof propeller or rotor loading where forces on the disk act in one direc-tion, the assumption of uniform loading over the chord should yield real-istic values for calculated noise. The effects of variation in chordalloading are treated in detail in Reference 31.
20
tlo U
-66
.4.
.2' .4 -4 .8• 3.0 3 . 6 . .
FRAtI"• C, COU P.AC'W OF ClOU
Figure 12. Chordwise Normal Force Figure 13. Chordwise Normal Force
Distribution Distribution With Reverse Flow
APPLICATIONS OF THE ROTATIONAL NOISE SOLUTION
The theory derived here for rotational noise generation lends itselfto the evaluation of rotor design parameters better than the classicaltheory (Reference 11) for conditions of uniform inflow. For the moresignificant condition of nonuniform inflow it becomes a unique tool forstudy. The drawback is that the correct harmonic blade loading isrequired as input, and this is not available for harmonics above thefifth. Analysis (References 8 and 32) is available to calculate theseblade loadings; however, the rotor inflow (References 21, 24, and 25) isnot known in sufficient detail to allow the calculations to be made. Lackof information regarding blade wake geometry is the problem in predict-ing rotor inflow characteristics. The importance of the need for higherharmonic blade loading cannot be overemphasized, as the usefulness ofthe rotational noise solution depends on further progress in this area.In the case where some blade loading harmonics are known, even if onlyhand calculated steady loads, the distortion of the classical propellernoise field (Reference 11) due to planform, twist, blade collectiveandcyclic pitch can be calculated in both the near and far fields. The effectsof any other parameter changes are easily dealt with if blade loadings areknown. Note that the solution, in its present form, is not directly appli-cable to systems with multiple rotors in jwctaposition.
21

PHASE III
ROTOR DESIGN TECHNIQUES FOR ALLEVIATION OF NOISE
VORTEX NOISE REDUCTION
The research in Phase I has shown how rotor vortex noise is gener-ated and propagated. The theory developed permits accurate predictionof the noise amplitude and frequency spectrum directly from operationaland physical parameters of the rotor system. In this section, the theoryand test data of Phase I are used to evaluate the amount of noise reduc-tion that can be achieved through the proper choice of rotor systemdesign parameters. The formulas are valid for the conventional square-tipped blade with uniform inflow.
The work in Phase I has pointed out the importance of tip speed andaerodynamic conditions at the tip in noise generation. The intensity ofthe tip vortex and unstable flow near the tip also affect rotor aerodynamicefficiency. A company-sponsored research program to improve rotorefficiency by modification of the tip planform achieved increases inefficiency and reductions in noise. Reduction of tip vortex inducedvelocity, by approximating an elliptical load distribution,was effective inreducing noise.
Effect of Blade Area, Tip Speed and Lift Coefficient
The theoretical and experimental results of Phase I have shown thatthe most important parameters governing noise generation are bladearea, tip speed and lift coefficient (or angle of attack). The relationshipcan be formalized as follows:
1 =P K (VT) AB (CL)2 (27)
The parameters VT, CL. andA also govern the thrust of the rotorsystem, as can be seen from the following basic relationship:
T=f V2 CL AB (28)
Although the above equation assumes a two-dimensional section withvelocity V for the purpose of noise estima$on, we can let the velocity Vbe that at the 0.7 radius and assume that ,L is the lift coefficient at amean angle of attack.
Since the same three basic parameters appear in the equations fornoise generation and lift, trade-offs between these parameters for noisecontrol will directly affect lift. However, the appearance of blade
22

velocity, V, to the sixth power in the noise equation allows for limitedreduction of tip speed without sacrificing lift.
In Figure 28, calculated overall vortex noise levels are shown for arange of tip speeds with corresponding blade areas ýo maintain lift. Thecurves shown are for coefficients of lift of 0.4 and 0.2. These curvesare for thrust of 20, 000 pounds. The effect on vehicle weight of thechanges in blade areas necessary for practical rotor system designswas not considered.
The curves show that sharp decreases in overall vortex noise can beachieved by reduction of the tip Mach number. However, as mentionedabove, the larger and heavier blade systems have to produce morethrust to maintain the same payload. The noise associated with theincreased thrust partially offsets the reduction shown in Figure 28.
The effect of thrust on the overall vortex noise is shown in Figures29 and 30. The slope of the curves is approximately 20 times the log ofthe thrust ratio. Because of the wider variation in tip speeds, theCH-53A system curves show more clearly that tip speed is more impor-tant than angle of attack in reducing the vortex noise. For equal thrustsand blade area, reducing the tip speed necessitates increasing the angleof attack. However, the reduction in noise level due to lowering tipspeed from 800 to 630 feet per second is about 5 db, even with thiscompensating increase in angle of attack.
Similar curves can be constructed for any desired thrust by usingthe vortex noise equation developed in Phase I (equation 6). Selection ofrotor design parameters can be made with respect to noise and reconciledwith other mission requirements.
Elliptical Tip Loading
Although a limited amount of vortex noise reduction can be achievedby trade-offs between tip speed, blade area and thrust coefficient, amore fruitful area of noise reduction was discovered during tests ofblades having elliptical blade loading at the tip. Figure 31 shows theplanform for a trapezoidal tip and the standard square-tipped bladesstudied in the remainder of this report. The trapezoidal shape wasadopted as an approximation of the elliptical blade loading. It wasexpected that elliptical loading would reduce the induced velocity of thetip vortex and thereby increase lifting efficiency.
At the onset of the program it was anticipated that some noise reduc-tion would result. The noise reduction proved to be substantial andappeared to be directly related to increased efficiency.
23

In Figure 32, the overall vortex level is plotted against load for threetip speeds. The tip speeds are the same as those in Figure 29. Exceptfor the tip change, the rotor system is identical to that plotted in Figure29. The reference line from Figure 29 is repeated to allow direct com-parison of the levels. It is interesting to note that the greatest differencebetween the square and elliptical tip noise levels is at low thrust. Thesound pressure levels of the elliptical tips increase more rapidly withincreased thrust. At high thrust the difference between the two designsis much smaller. At the normal disk loading of about 19, 000 pounds forthis size rotor, the reduction in overall noise is about 7 db.
Figure 33 shows the spectra for both square and trapezoidal tipblades at the extremes of the usual range of angles of attack. Thespectra for the trapezoidal tips show much less noise in the octave con-taining the Strouhal frequencies. Each of the elliptical spectra showed arise in the last octave which is unexplained. The square-tipped bladein Figure 33 is evidently experiencing stall, as discussed in Phase I,because of the secondary peak in the 1200 to 2400 octave. For the samepitch angle the trapezoidal tip stiltappears to be below the onset ofstall.
Figure 34 shows the relative levels of the 300 to 600 octave whichcontains the Strouhal frequencies over a range of loads. The reductionin the vortex noise at the Strouhal frequencies is obvious. Also it canbe seen that above 19, 000 pounds the noise in this key octave increasesmore rapidly with load for the trapezoidal tip.
The reduction in tip vortex strength deduced from the reduction ofStrouhal frequency noise is also demonstrated by less modulation of thenoise amplitude as shown in Table VIII. Modulation, which results frommovement of the source relative to the point of observation, depends onthe strength of the moving source. If the moving source is muchstronger than the average over the field, the modulation is greater.
Recommendations
Main rotor vortex noise can be reduced by reducing rotor tip speedand by improving load distribution at the tip. It is recommended thatminimum tip speed consistent with good aerodynamic design be used.In addition, reduction of the induced velocity of the tip vortex (corethickening) will result in substantial vortex noise reduction without lossin efficiency. Vortex noise reductious of from 7 to 10 db have beenachieved with this approach. Since vortex noise falls in a frequencyrange for which hearing acuity is high, it can be important in determin-ing detectability, as can be seen in Figure 35. The tactical potential ofgood blade tip design is therefore apparent.
24

ROTATIONAL NOISE REDUCTION
Reduction of Noise Due to Steady Blade Loadings
Far field rotational noise due to steady biade loading and its relation-ship to the physical parameters of propeller systems are describedmathematically by Gutin (Reference 11). This relationship has been putinto graphic and tabular form (References 3, 15,and 16) which, incombination with aerodynamic and weight considerations, makes thematter of parameter selection for low noise straightforward. Additionalinvestigations (References 12, 13%and 27) have defined the trade-offsnecessary to obtain lower noise levels. These studies, in many cases,have concentrated on the propeller noise as it affects aircraft detect-ability. Aircraft detectability relates noise generated by an aircraft tothe ability of a human to detect its presence audibly. Detectability isextremely important in military applications, as an aircraft's acousticdetectability is a factor in determining combat effectiveness and proba-bility of survival. The concept of detectability will be used as a basisfor evaluation of rotor noise alleviation techniques.
Figure 35 from Reference 20 shows the minimum detectable levelof aircraft noise in a low noise background. The level up to approxi-mately 250 cps is the threshold of hearing (Reference 6). Compare thiswith an S-58 helicopter noise spectrum shown in Figure 36. It isobvious tnat the fundamental (normrally between 15 and 20 cps) of themain rotor blade passage noise would have to be at a much higher levelthan the higher harmonics in order to determine detectability. Ingeneral, the fundamental component of rotor rotational noise is belowaudible level and is not heard. Instead, blade passage harmonics andmodulated vortex frequency noise are heard and incorrectly identified asblade passage frequency noise. It Js recognized then that the fundamentalof rotational noise of helicopter rotor systems is not important in deter-mining detectability. While Gutin theory does not accurately predict thelevel of the harmonics, it is adequate for estimating the relative effectof design parameters.
Reduction of Noise from Nonuniform Rotor Loading
This study is based on the assumption that first harmonic rotationalnoise is not significant in judging loudness, and that harmonic levelsresulting from steady inflow to the rotor will vary directly as the funda-mental for which noise control methods are already known. To mini-mize the acoustic signature of a helicopter, techniques must be developedto reduce the harmonic content cf rotational noise.
25

UAccording to Gutin, the noise level of the individual harmonics
" •decreases rapidly with harmonic number, as shown in curve A of Figure37. Gutin's equation assunes that all blade loading is concentrated at asingle point on the blade. This loading is simulated in curve A. When
Ma: the concentrated loading is spread out over a larger segment of theblade, the upper harmonics increase in level. This implies that concen-tration of blade loading over a smaller disk area, which might be accom-plished by reducing the diameter, for example, results in lower harmonicnoise levels. This relationship cannot be utilized, however, because theharmonic dropoff gained by concentrating the load would be more thanoffset by the increase in overall noise level from the higher blade loading.
The fact that redistribution of steady blade loadings cannot be uti-lized to reduce harmonic noise levels leaves nonuniform loading as thecontrolling factor in determining harmonic level.
The influence of steady plus 4-per-rev blade loading on harmonicnoise levels Is shown in Figure 38. Three different levels of 4-per-revplus steady loading were used to calculate the harmonic noise levels forthe S-58 rotor system. The levels were calculated by the methods ofPhase 11. The rotor system parameters and loads for this hypotheticalsystem are presented in Appendix IX. The harmonic dropoff is substan-tially affected by the addition of the variable blade loading. For example,the second noise harmonic is now higher than the fundamental and all thelevels of the harmonics are increased over those generated by the steadyloading.
The 4-per-rev loading contributes more to the level of the higherharmonics than the fundamental does. Calculations were made to deter-mine whether a pattern exists which describes relationship betweenblade loading and rotational noise levels. The results are shown inFigures 39 to 45, which represent the same information as Figure 38except that the noise due to steady loading has been removed to showonly the result of harmonic loading. The increase in sound pressurelevel caused by doubling the harmonic loading (from 1/4 to 1/2 of thesteady loading amplitude) is not always the 6 db which would result frominteraction between the harmonic and the steady loadings. The shapesof the curves change considerably between one blade loading harmonicand the next. The higher blade loading harmonics have a greater effecton the higher noise harmonics and less effect on the lower noise har-monics. Notice that as the blade loading harmonic increases, the noiseproduced by a given level of loading greatly increases. In other words,the efficiency of conversion from blade loading to noise Increases withblade loading harmonic. This effect is shown for blade loadings up to10-per-rev in Figures 46 and 47, where noise level is plotted against
26

rotational noise harmonic for several harmonic blade loading conditions.This is done for a harmonic loading level of one-quarter the amplitudeof the steady component plus the steady loading, but with the noise attri-buted to the steady load omitted.
To get a better idea of how the noise producing efficiency of bladeloading varies with noise and loading, the data of Figures 46 and 47 iscross plotted in Figure 48. The fact that certain blade loading harmonicsgenerate noise most efficiently at certain noise harmonic frequencies Isclearly shown here. Again the harmonic blade loading level used here is1/4 that of the steady loading and the noise attributed to the steady load-ing itself has been removed. Even when the noise levels due to thesteady loading are added to those of Figure 48, as shown in Figure 49,it is quite easy to produce a spectrum where many harmonic levels arehigher than the fundamental. The acoustical efficiency of the manyblade loading harmonics is the cause of the high levels of rotor andpropeller noise harmonics.
If a helicopter is being designed for low detectability, it is essentialto control the harmonics of blade loading. The more uniform the inflow,the lower are the blade loading harmonics. Although rotor system dyna-mics and aeroelastic characteristics play a role in determining the in-flow pattern, the most important acoustic consideration is the presenceor absence of wake interaction from other blades or rotor systems.
Quantitative analysis of the pressure field generated by a rotor andits blade loading is difficult. Improved correlation between measuredand predicted blade loading has been obtained by replacing steady aero-dynamic inflow theory with variable induced inflow theory (References 8and 31). Further work is required, however, to generate harmonics ofhigher order analytically with any degree of accuracy. Figures 39 to45 show the importance of the higher order blade loading harmonics indetermining harmonics of rotational noise. As an example, Figure 46shows that if a 2-per-rev blade loading, of 1/4 the amplitude of thesteady, were present in addition to the steady, the fourth harmonic ofrotational noise would be increased by 7 db. If there were a 5-per-revblade loading of 1/4 the magnitude of the steady in addition to the 2-per-rev and steady loadings, the level of the fourth harmonic of rotationalnoise would be further increased by 41 db. For a rotor with n number ofblades, it appears as though the 11th harmonic of rotor noise is mostsensitive to the M(n-1) loading harmonic. To determine higher ordernoise harmonics accurately, it appears as though there is a need forloading data of much higher harmonic content than presently is availablefrom measurements or analysis.
27

Design Recommendation
It is concluded from the Phase III study that it is necessary to con-trol rotor harmonic loading in order to control rotational noise. Meansare not presently available, however, to predict the nonuniform portionof rotor loading to the accuracy required for use in the rotor noiseprogram. Gutin's theory of Reference 11 is adequate to predict trendsonly for first harmonic rotational noise under steady inflow conditions.The charts of References 3, 15, and 16 then become useful in determi-ning the acoustic effect of blade parameter changes, but not the absolutelevel. For predicting rotational noise, for even relatively uniform in-flow conditions, the analysis presented in Phase II should be used. Therequired input data for such predictions must include up to at least them times n harmonic of blade loading. Here nl is the number of bladesand M is the desired harmonic of rotational noise. Since the state of theart does not allow prediction of higher than the fourth or fifth harmonicof blade loading, little can be concluded as to the parametric effects ofdesign changes on harmonics of rotational noise.
In addition to the general requirements of low tip speed and bladeloading, it is recommended that the blade tip be designed so that loadingis distributed as evenly as possible and local turbulence is held to aminimum. This is the same requirement as that specified for vortexnoise control and can be accomplished with tips such as the trapezoidalvariety.
BLADE SLAP
Discussion
Blade slap is the sharp popping sound produced by a helicopter rotorduring certain flight conditions. This characteristic was extensivelyinvestigated in this study to define the mechanism of blade slap andmeans of controlling it.
Results of this study and that described in Reference 2 indicatedthat blade slap consists of high-amplitude rotational noise plus highlymodulated vortex frequency noise. The slapping or popping noise occurswhen the blade has rotated approximately 270 degrees from the tailduring forward flight. Reference 5 indicates that blade slap is due toamplitude modulation of broad-band noise during stall. It can be seenin Figure 33 and in Figure 2 of Reference 33 that vortex noise levels area minimum of 7 db higher for the stalled (separated flow) condition thanfor the unstalled condition.
28

The contention that blade slapis associated with blade stall can bedemonstrated as follows. Figure 14
* shows the angles of attack aroundthe disk of a single rotor helicopterduring 100-knot forward flight. Themaximum angle of attack occurs at
n an azimuth angle between 270 degreesand 360 degrees. As speed is in-creased, the angle of attack in thisarea is increased. Ultimately, stallwill occur at the tip and will spreadtoward the rotor hub. The occur-
4' rences of stall and angle of attackF L4 change are explained quite clearly in
Reference 9. These variations inangle of attack are typical for a
Figure 14. Single Rotor Helicopter single rotor helicopter. Experi-Typical Angle of Attack Distribu- mental data from Reference 10 on ation rotor system experiencing stall
(Figure 15) shows that calculatedresults (dotted line) are reasonably accurate and that the region around270 degrees is indeed the area which is most susceptible to stall duringhigh speed flight. Since both blade slap and stall occur near the 270degrees azimuth position, it can be concluded that slap is related toblade stall for this flight condition'.
Pilot reports state that the blade slap occurs with high blade loadingsuch as that encountered in high speed forward flight or in a heavilyladen condition. They also report slap when making powered descentand in transition to autorotation. Where stall is imminent, a perturba-tion in the aerodynamic inflow, such as the downwash of another rotoror an encounter with a shed vortex from a preceding blade, may besufficient to induce the stall.
29

FORWARD
STALL ARFEA
36 CALCULATEM 36
STALL AREA
Figure 15. Occurrence of Stall in the Rotor Disk
With tandem rotor helicopters, the lower rotor encounters thedownward induced flow along with shed vortices in a portion of its diskarea. The intersection of these vortices and the resulting suddenchange in angle of attack and flow separation cause nearly continuousslapping. A comparison of the levels of a single rotor (S-61) helicopterand a zandem rotor (V-107) helicopter during approach to landing isshown in Figure 16. The ships are of approximately 18, 000-pounddesign gross weight and are performing the same maneuver. During themaneuver, both aircraft are producing impulse type noise.
30

120
6
00
90
7 0 __ __INEROý
i00 4000 8.
OCTAVE BAND CENTER FREQUENCIESIN CYCLES PER SECOND
DISTANCE 70 FEET FROM BOTH SHIPS
Figure 16. Single versus Tandem Rotor Noise in Approach(Reference 34)
The frequency content of the noise for the two helicopters is similar.The considerably higher noise in the 20-to 75-cps octaire indicates thatthe tandem helicopter experiences corresponding changes in lift in theoverlap region. As was shown in Phase I1, the periodic change in lift orblade pressure causes high level noise at the blade passage frequencyand its harmonics. Although momentary tip stall may occur on thesingle rotor ship, the fluctuation in lift is less intense. Consequently,it generates little more noise than in the unstalled condition.
Tests of blades with square and trapezoidal tips were made bySikorsky Aircraft. The trapezoidal tips are designed to reduce theinduced velocity of the tip vortex from that of the square-tipped blade.This lessens the depth of vortex noise modulation and also leaves lessof a disturbance in the flow field to interact with the other blades. Thedifferences between noise spectra of the two blade types are shown forvarious power and speed conditions in Figures 33 and 34. Details ofthe test are explained in Phase L.
31

The phenomenon of compressible drag divergence, which occurs withstall, is also related to blade slap. When drag divergence occurs, dragincreases and power is consumed. The increase in drag is due to therustable formation of local shock waves which transform energy into
heat and pressure pulses. If sufficiently strong, these shock wavescontribute to the blade slap noise.
The Phase I calculation procedure is completely general, and assuch will predict the harmonic content of any condition, including bladeslap. Blade slap was not detected during the measurement program.In order to determine whether blade slap could be predicted by the PhaseU analysis, it was, therefore, necessary to simulate a blade loadingcondition which would indiuce blade slap. Since blade slap occurs duringblade stall, blade pressure data recorded during the occurrence ofblade stall was used as a basis for the harmonic loading input. Bladepressure time histories at 85 percent span for the 80-knot 1/2g turn areshown in Figure 17. From analysis of the pressure time history at thetrailing edge, it was evident that stall was present. This trace was
analyzed for harmonic content overone blade revolution. The resultingharmonics were used as blade load-ing for the entire chord at the 85
1.7 percent span of the rotor system and0 -,-- .a the noise harmonics were calculated.10 9.0 - Noise levels were also calculated
33.0 •using only the steady component of*. •the blade loading. The resulting4 harmonic distributions are shown in
Figure 18 along with the harmonicS .__ distribution resulting from steady
80-knot flight on the same S-58. Thesteady loading spectrum exhibits theusual rapid dropoff in harmonic
lot, noise level associated with steadyS- loads alone. The 80-knot cruise
A•W AM& •- ma spectrum levels drop off also,although not so rapidly. Finally, the
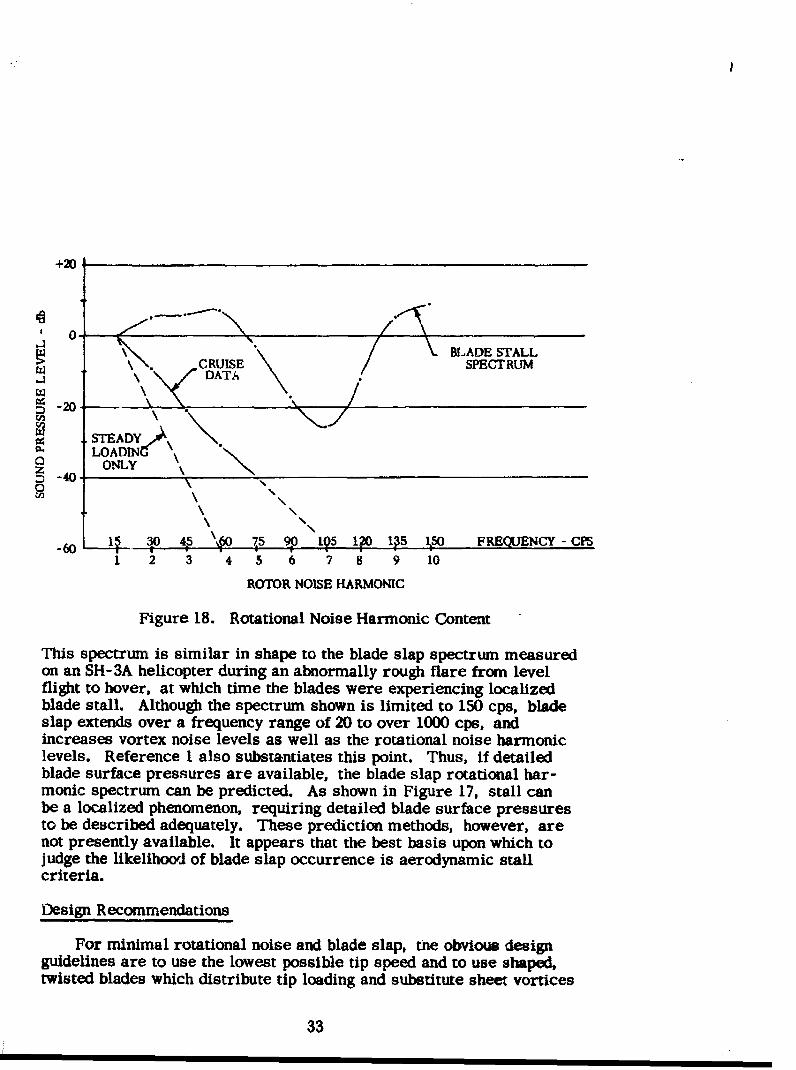
Figure 17. S-58 Blade Differential spectrum generated using the impul-Pressure Time History During An sive airloads experienced during80-Knot, 1/2 g Turn at 85 Percent blade stall shows extremely highSpan - A Condition harmonics.of Partial Blade Stall
32
+20
* 0 "; • '•BLADE STALLS\. RUISE SPECTRUJM
S\ ..• DATA
S-20
•o STEADY
LOADING?•Q ~ONLY~-40
-6 .~3 ~~ 590 195 120 1ý5 Iý5O R(JEC-1 2 3 4 5 6 7 8 9 10
ROTOR NOISE HARMONIC
Figure 18. Rotational Noise Harmonic Content
This spectrum is similar in shape to the blade slap spectrum measuredon an SH-3A helicopter during an abnormally rough flare from levelflight to hover, at which time the blades were experiencing localizedblade stall. Although the spectrum shown is limited to 150 cps, bladeslap extends over a frequency range of 20 to over 1000 cps, andincreases vortex noise levels as well as the rotational noise harmoniclevels. Reference 1 also substantiates this point. Thus, if detailedblade surface pressures are available, the blade slap rotational har-monic spectrum can be predicted. As shown in Figure 17, stall canbe a localized phenomenon, requiring detailed blade surface pressuresto be described adequately. These prediction methods, however, arenot presently available. It appears that the best basis upon which tojudge the likelihood of blade slap occurrence is aerodynamic stallcriteria.
Design Recommendations
For minimal rotational noise and blade slap, tne obvious designguidelines are to use the lowest possible tip speed and to use shaped,twisted blades which distribute tip loading and substitute sheet vortices
33

for the stronger tip vortices. Although blade stall appears to be the
major cause of blade slap, compressible drag divergence, i. e., Macheffects, cannot be ignored. When blade elements are in stall, com-pressible drag divergence is also present. To make blade designrecommendations for reduced blade slap strictly on the basis of reducedstall would be premature at this time, since blade design for reducedtendency to stall may well increase the extent of drag divergence.Further study is therefore needed to define the relationships betweenblade slap and the degree of stall, drag divergence, and tip vortexinduced velocity if positive blade design recommendations are to bemade.
34

TABLE I
CALCULATED VORTEX NOISE FREQUENCIES AND THEIR RELATIVEINTENSITY FOR THE CH-53A ROTOR BLADE AT 30, 000 POUNDS THRUST
r/R A M V W f * Down From(degrees) (ft. sec) (ft) (cps) Tip Level
(db-db at Tip)
0.300 3.31 0.187 209 0.367 154 -31.3
0.450 3.54 0.280 313 0. 375 225 -20.9
0.600 3.44 0.374 418 0.371 300 -13.3
0.700 3.30 0.436 487 0.366 360 - 9.3
0.750 3.20 0.467 522 0.362 390 - 7.5
0.800 3.10 .0.499 556 0.359 420 - 5.9
0.850 3.00 0.530 591 0.355 450 - 4.3
0.900 2.84 0.561 626 0.349 480 - 2.8
0.950 2.64 0.592 661 0.341 520 - 1.3
0.975 2.45 0.608 679 0.334 550 - 0:7
1.000 0.00 0.624 696 0.000 - 0.0
Sf= StV
where St: o.-2
35

TABLE II
OVERALL VORTEX NOISE LEVELS
Rotor Thrust SPL Calculated SPL SPL CalculatedSSpeed by Equation 6 Measured by Equation 5(rpm) (pouds) (db*) (db*) (db*)
CH-3C ROTOR SYSTEM
183.0 13,400 78 76 7916,200 80 7918,700 81 8120,500 82 82
203.0 16,300 82 81 8218,100 83 8119,900 83 8221,400 83 83
213.0 14,500 81 81 8318,200 83 8320,000 83 83
CH-53A ROTOR SYSTEM
166.0 24,000 82 80 8328,400 83 8132,000 84 8336,200 85 8339,000 86 85
185.5 25,000 83 83 8530,100 85 8336,200 86 8541,600 87 87
215.0 23,700 84 85 8929,600 86 8637,9oo 88 8943,520 89 90
Ref =0. 0002 dyne/sq. cm.
36

TABLE I1PHYSICAL CHARACTERISTICS OF TEST ROTOR SYSTEMS
CH-3C CH-53A
Number of blades 5 6
Diameter (feet) 62 72
Blade area (ft2 ) 217 368
Solidity 0.078 0. 115
Disk area (ft2) 3020 4070
Airfoil 0012 0012 Modified
Chord (feet) 1.50 2. 16
Rotor speed (RPM) 183 166.0
203 185.5
213 215.0
Tip speed (ft/sec) 595 625
661 696
692 810
Tip Mach number 0.532 0.591
0.586 0.625
0.613 0.726
37

•- TABLE IV
COMARISON OF FIRST HARMONIC NOISECALCULATIONS BY GUTIN'S. EQUATION AND BY THE
• SIKORSKY PROGRAM
•iSikorsky Gutin
* Soud Pressure PL Sound Pressure SPL(degrees) (psi) (db**) (psi) (db**)
-45 1.6 x 10- 5 74.8 1.58 x 10- 5 74.7-30 2.92 x 10⁻⁵ 80.0 2.82 x 10⁻⁵ 79.8
it -15 3. 41 x 10- 5 81.4 3.29 x 10- 5 81.00 2.69 x 10 5 79.3 2.58 x 10 5 79.0
15 1.32 x 10 5 73.2 1. 24 x I0-6 72.6
30 3. 39 x 10- 6 61.4 1. 87 x 10- 6 56.2
• Elevation angle = 0° in rotor plane, positive above, negative below
• Ref =0. 0002 dyne/sq. cm.
TABLE VFLIGHT TEST PARAMETERS
Test weight-pounds approximately 12,000Number of blades 4Blade radius-feet 28Blade twist-degrees -8Blade chord-feet 1.367Test rotor speed-rpm 212Test engine speed-rpm 2400Test rotor-angular velocity-radians/second 22.2
38

0D 00 0 N
~G* 0 0 00 0% f0
00 r.- C4
z -0o
- -4
co: wv GO t
E-4< .4,c;
hJ O. 0' 0 0'39

TABLE V11
BLADE LOADM TABLES USED INPROGRAM
Blade Loading Data Table * Noise Measurement Condition
4 Hover out of ground effect
8 40-Knot cruise
13 80-Knot cruise
19 110-Knot cruise
111 70-Knot cyclic pullout
Reference 28
40

TABLE VIII
17-CYCLE-PER-SECOND AMPLITUDE MODULATION: COMPARISON OFCH-3C TRAPEZOIDAL TIP VERSUS SQUARE TIP BLADES
Average Depth of Modulation - db*
Octave Square Tip Trapezoidal Tip Difference
150-300 8 5 3
300-600 10 6 4
600-1200 8 8 0
1200-2400 5 4 1
2400-4800 7 4 3
4800-9600 6 4 2
6 13
AVERAGE DIFIFE RENCEt-
• DEPTH OFIMODULATION a ,4-20 log a
b 17 cps
41

00
-1 f I f f 2f 4f 8f 16f
OCTAVE BANDS
Figure 19. Spectrum Below Stall
-• 0 -
S0
i if I f f 2f 4f 8f 16f~L1
OCTAVE BANDS
Figure 20. Spectrum Above Stall
42

0012 AIRFOILDRAG DIVERGENCE
10 - - NOT PRESENT . PRESENT
9
V 87.
00
S45
7.L A
o 0183RPM -o. 532"3 203 RPM M. = ~0. 590 AO
6 -00
0 a0 213 RPM M - 0. 619
S0 I I s : I30 0.1 0.2 0.3 0.4 0.5 06 0.7 0.8 0.9 1.0
MACH NUMBER AT 0. 94 -r" (M)'II
Figure 21. Drag-Divergence Curve for the CH-3C
43

a 183 RPM MTr 0.532
X 2 03 RPMMT = O. 590o 0 213RPM 0. 619
6
4
0 1
0 -:
2 3 4 S 6 7 8 9
ANGLE OF A'TTACK ATr 0. W "1"
Figure 22. Onset of Drag-Divergence
70
S-7°MEASUIRED DATA
cm 50 CAOJA ED
er• GUTIN30
- 20
10o
0 2 3 4
ROT^ATIONAL NOISE HARMONIC
Figure 23. Calculated and Measured Levels - Hover
44
•;*

90-
RUN- -. 2---......
70
~60 _ _ _ _ _ _ _ _ _ _
CALCULATED-------
RUJN# 2 X--
APPROACHING DEPARTM
-250 -200 -150 -100 -50 0 50 I00 150 200 250
HELJCOPTER FOSn1G Wrfl RESPECT TO OBSERVER - ft.
Figure 24 a. Calculated and Measured Levels - 40-Knots - FirstHarmonic
-Jj
so _________ _
A CALUAi1
RUN*l 1RUN I* 2 _-.. .
,50
APPROACMqNG DEPARTING
Yi5o -10 - 150 1D .30 50 1,00 ;150 - 2 ,050
HELJCOPTER POSrflW WrM RESPECT TO WSERVER - ft..
Figure 24 b. Calculated and Measured Levels - 40-Knots - SecondHarmonic
45

RUNS 1
•" • ' PP&,WACHOC DEPA RT7NG
.250 -200 -150 -100 -5 0 so- 10 15 M0
i•MUMMA POSITON WMT RESE• TO OBSERVER - ft.
Figure 24 c. Calculated and Measured Levels - 10-Knots - ThirdHarmonic
rI
90t
"RUIRUN# I
RUN # 2 x . .
so
APPROACHING DEPARTING
-250 -200 -150 -100 -50 0 50 100 150 200 250
HELICOeR POSITION WITH RESPECT TO OBSERVER - ft.
Figure 24 d. Calculated and Measured Levels - 40-Knots - FourthHarmonic
46
----------------------------------------------------
- ALUAE

~70.
S60. CALCULATEDRUN I -
RUN 4 2
APROACHING DEPARTING
-250 -200 -150 -iOD -50 0 50 I00 150 200 250
HEKEUCVTR POSITION WM~ RESPT TO BSERVER - ft.,
Figure 25 a. Calculated and Measured Levels - 80-Knots - FirstHarmonic
90
CALCULATED
NJN .--
RIJN 42
50 _ _ _ _ _ _ _ _ _ _ _ _ _
1 APROACHING I]AR11NG
-250 -200 -150 -100 -50 0 SO ioo 15O 200 250
HEI•CCPITR P0110 wITH RIR!mCT TO wERVER - tr..
Figure 25 b. Calculated and Measured Levels - 80-Knots - SecondHarmonic
47

S970e m,
1 -
RUNJ 0 2 X- ....
so
.250 .3O -150 -100 -50 0 50 1O0 1L0 32 0
3ll. Mt R roar"I1G WVl. RRS'ECT TO SBIRV "R - .
Figure 25 c. Calculated and Measured Levels - 80-Knots - ThirdHarmonic
i ____ _ _ __ _ _ _ __ _ _________...-• .+ .-. --.... . . ...__ ....___-_-_- ___
too_
C;
CALOJLATEI) -------
RUNS IRUNE 2
APPROACHING DEPARtING
-0o 400 -,io -100 -40 0 100 1 , 5o 250
HEI.COrER PKErnc WIN Rcr TO 1•0 " ERVIR - ft.
Figure 25 d. Calculated and Measured Levels - 80-Knots - FourthHarmonic
48

so.
-0-
60 - C AE - - .
SRUN 9570
RUIN#2 • ..-
APPROAC41M DEPARTING
-250 -0 -150 -0 -50 0 50 1oo iso 20D 250
HELICOMTER IION WTH RESPCTO (70ISERVER - ft.
Figure 26 a. Calculated and Measured Levels - 110-Knots - FirstHarmonic
cc
-C-------7-A ----
SRUNS I
RUN # 2--
APPROACHING DEPARTING
-250 -200 -150 -100 -W0 0 50 Ito 150 200 n0
HEMUCOTER POSMTIw WMt RECT 10 aISERVER - ft.
Figure 26 b. Calculated and Measured Levels - 110-Knots - SecondHarmonic
49

930
-- . .--- 4,,
S70 -
CALCULATED ----RUN*IRUN 1t 2 ... .--
APPROACHING DEPARTING
-2i -AI0 ISO -100 -50 0 so 100 150 200 250
HELICOPTER NOTION WITH R&91= To GN ERVER - ft.
Figure 26 c. Calculated and Measured Levels - 110-Knots - ThirdHarmonic
70. - .-
60
A • CALOJCLATED."'•- , RIWN •I
50
APPROACHING DEPARTING- 4-0 A-5 -0 .50 0 so 10 150 20 250
HEUCOPTER P06MN WrrH RESPECTTO 1UERVER - ft.
Figure 26 d. Calculated and Measured Levels - 110-Knots - Fourth
Harmonic
50

so
70
60
CALU.LATED
RUN a IRUN 0 2 -. ..-
50
APPROACHING DEPARTING
-250 -23W -150 -10D -50 0 so 100 150 I ; 0
HELICOPTER PCI•SrFl' UI RESPrCT "0 iCRVER - ft.
Figure 27a. Calculated and Measured Levels - 70-Knot Cyclic Pullout -First Harmonic
70
•0
C, CALCULAT'.D ......IinUN 0 I"RU &2 --.....-
50
APPROACHING DEPARTING
-. 50 200 -1-0 -100 -50 0 o0 100 150 0
HELXPER Pfl1rN WrrH RESPECT TO aBSRVER - ft.
Figure 27b. Calculated and Measured Levels - 70-Knot Cyclic Pullout -Second Harmonic
51
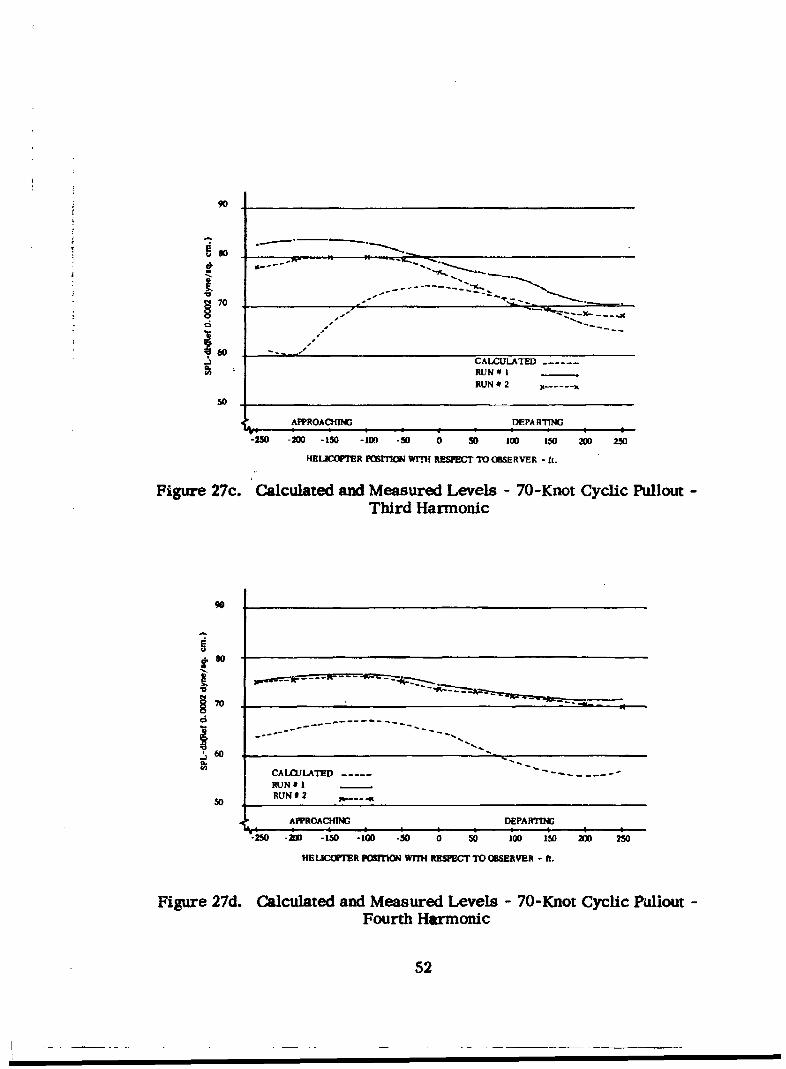
90
70 -- ---• .- ' • o-x--- -
60
- CALCULATED .-.---tA RUN IV -
RUN 0 2 .
50
APPROACHING DEPARTING
-250 -200 -150 -100 -50 0 50 100 150 200 250
HERLICMTER POSBOJ WT•f RESPECT TO OBERVER - ft.
Figure 27c. Calculated and Measured Levels - 70-Knot Cyclic Pullout -Third Harmonic
.80
670
Ut CALCULATED -
RUN* I
RUN 2 2
APPROACHING DEPARMING
-250 -200 -150 -100 -0o 0 s0 100 150 20 230
HECOPTER POITON WITH RESPECT TO OBSERVER - ft.
Figure 27d. Calculated and Measured Levels - 70-Knot Cyclic Puliout -Fourth Harmonic
52

100 200I ! ..
TOTAL BLADE AREA .(f02 )INDEPENDENT OF THE NUMBER OF BLADES
~90
S§70 00 3070 90 53 40 CL- o-o.
50o CL -0. 450I ~ , ~, ,
900 ;w 7,00 SOo C0 - 0.2
TIP SIZE (FT. PER SEC.)
Figure 28. Calculated Noise Levels at 300 Feet, 20, 000 Pounds Thrust,5 Blades
90
S85,, 0 183 RPM/591 FPS
X203 RM/612 FPS
00AA
.0
00
10 14 18 22 26 30
THRUST IN THOUSANDS OF POUNDS
Figure 29. Sound Pressure Levels versus Thrust for 3 Tip Speeds,CH-3C
53
/,

I95
ti~o X.
0 0166 RPM/630FPS-J 0 185 RPM,'700 FPS
X215 RPM/815 FPS
0
80 I I I I
20 24 28 32 36 40 44 48
THRUST IN T1MSANS OF FU(S
Figure 30. Sound Pressure Levels versus Thrust for 3 Tip Speeds,CH-53A
"'TRAPEZOID"
mR m
LAST POCKET "
Figure 31. Trapezoidal and Square Tip Planforms
54

90
{---S(�JARE TIPPED BLADES.FROM FIG. 29
V o A 193 RPM/591 FPS
08 20 K / P
-J
75
70
10 14 18 22 26 m
THRUST IN THOSAMS Ot POUNIDS
Figure 32. Sound Pressure Level versus Thrust - TrapezoidalTips
so
A STAQARDj
65 • 65
/TRAPEZOIDAL 1 0
55 55150 300 60D 1200 24o0 4800 150 300 600 120o 2400 480o300 600 1200 2400 4800 9600 300 oo IWO 2400 4800 9%W0
OCTAVE PASS EANDS IN CYCLES PER SECOMN
LOW (9* ) PITH OCTAVE PASS BANDS IN CYCLES PER SECONIDHIGH (15) PITCH
Figure 33. Octave Band Levels for Lw and High Pitch (CH-3C)
55

ii
SQUARE TIP
70 TRAPEZOIDALSa TIP
A600 10 15 20 25 30
THRUST IN THOUSANDS OF POUNDS
Figure 34. Comparison of Level at Strouhal Frequency of Square andTrapezoidal Tips @ 203 RPM
70
6D-10 too 1000 ion*_
flBQJuicT - cram MR =Dow
Figure 35. Detection Level Criteria for Aircraft - Spectrum Level
56

go SECCOV PGIRWlRMHARC IOA IC TAIL ROTORHARMONIC ID -- FIRIST HARMONIC
JSRENEIR -FIRC
VOR'TEX mc~a
70
40gV
V
sove
8I"TT PERCENT
RAOORDDAMT FILTER
40
ROTATf2NjlY - CYCLES AMR SECON
Figure 36. An S-58 Helicopter Noise Spectrum atHover
- A - LOADING CONCENTRATED IN ANB-INC LENGTH OF BLADE
B - LWADING SPREAD CUT OVERB FEET OF BLADE
0. \C RTOR DIAMETR tS 48FEET
B
2D A
1 3 4 5
ROTATIONAL NOISE HARMONIC
Figure 37. Effect of Blade Loading Distribution on Noise HarmonicLevel
57

MAWh LCACIM RASimpm4v tDWA OF PmL
WV-B STEAD! LQAAO XAA
4-PmRRmV LGA O 112STahm ANOSTpj
SMAIN LWWOM VU$12. 4.Ein-Mn LOAO O
1,4 irmuEAb! ~.I1
42 S 4 S
Figure 38. Effect of 4-per-rev Blade Loading on Harmonic Noise Levels
AMPLITUDE OF
I/REVBLADE LOAD12 SAME LEVELASSI'EADY10--- -
8 7ISTEADY
%.!.Si..
V- - - - -- 4 ISTEADY
20
ROTATIONAL NOISE HARMONIC
Figure 39. Effect of 1-per-rev Blade Loading on Rotational NoiseHarmonics
58

AMPUXtUDE OF2IREV BLADE LOAD
S22 SAME LEVEL AS STEADY
iss
16 1 STEADY14 .7
10..8 I STEADY
6 T
2
1 2 3 4 5
ROTATIONAL NOE HARMONIC
Figure 40. Effect of 2-per-rev Blade Loading on Rotational NoiseHarmonics
AMFPLIDE OF3/REV BLADE LOAD
34 SAME LEVEL AS STEADY32
I•30 /.28 1 STEADY
12624 ,' -"22 2 ~ 1 STEADY
.6d ~/S14 / /S12 /
10 /
64
2
0 2 3 4 5
ROTA71ONAL OW HARMONIC
Figure 41. Effect of 3-per-rev Blade Loading on Rotational NoiseHarmonics
59

44 - SAM IEYZL ASIr MACY- .... I m24I"34,n AIFLflUNR C
lKAM140
gIl
44
Figure 42. Effýct of 4-per-rev Blade Loading on Rotational NoiseHarmonics
I OF STEADY LEVEL
I - Ic OSrTEADY LXVEL
S / .. * ,.,/m EVE
I/ I I (IF STEADY LML
Si'
""Ab44XfUM3D OF
i /I 5~~/RLV S1DELAM J
1I0,
M)ATNA IP HAO
///
II F
Figure 43. Effect of 5-per-rev Blade Loading on Rotational NoiseHarmonics
60

I O S1TDVY LemE
i .-- ;
10
I Or STUM LSVEL.
dI a
.1 /!i _ _
30 *LU3
Figure 44. Effect of 6-per-rev Blade Loading on Rotational NoiseHarmonics
II OF S-
',!
I ,
4/1
:1/
6,11
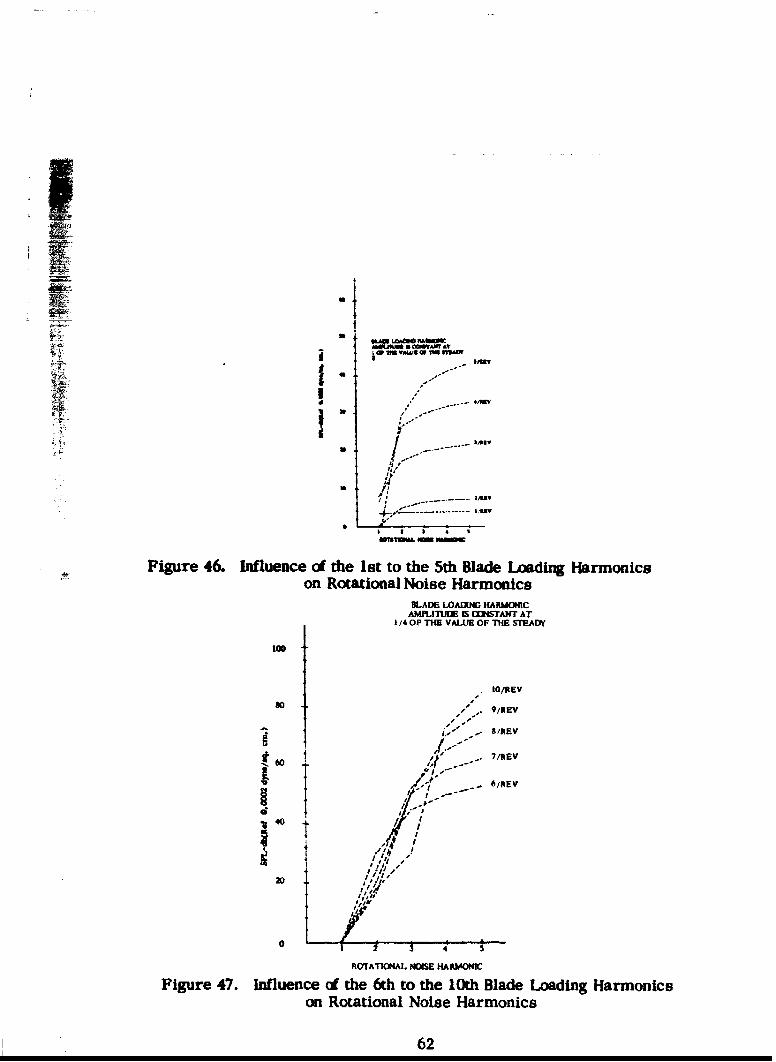
S- CW 7M W4LiM W IM MU M
at 30
41/4 OFTHE VLEOTESED
1 ,
t- 5 1
P5EV
•. Figure 46. Influence of the 1st to the 5th Blade Loading Harmonicson Romtationl Noise Harmonics
AMi.'LHfJIE IS W6TN"TT AT1/40OP THE VALUE• OF THE STEAEWY
0O/REV
t9/REV
t 6 0 7/REV-- 6/REV
Figure 47. Influence of the 6th to the 10th Blade Loading Harmonicson Rotational Noise Harmonics
62

0 C/
~- ~ .- ~' -- I-
OA U)
99 cc
(Uhl W.
eu
-4
CID E(w~ obv~p ~O0 .0~i~q-'id Ed
ii co
63 J 0

100 NOISEHARMONIC
80
20
3 ,
S40
STEADY 1 2 3 4 5 6 7 8 9 10ONLY BLADE LO•kDING HARMYI ' I"DDED TO STEADY
Figure 49. Sound Level Caused by a Rotor w,,, ..eady Loading Plusa Harmonic Blade Loading of One Quarter the Amplitude of the Steady
64

CONCLUSIONS
It As been shown that single rotor overall vortex noise level forsquare tipped blades with uniform inflow can be calculated with excellentaccuracy by the use of a simple formula developed in this study, Thestandard vortex noise spectrum is used for the unstalled condition, andanother spectrum has been developed for use where stall is present.This stall spectrum contains higher levels in the upper frequencies. Areduction in rotor tip speed or thrust, or an increase in blade area (atconstant thrust and tip speed) will reduce the overall vortex noise level.Vortex noise level is highly dependent on tip shape, and substantialreductions may be attained by proper design.
The solution derived for rotational noise may be used to calculateany number of harmonics in either the near or the far field under uniformor nonuniform conditions. Only single rotor systems, however, may beconsidered using the present solution. The only limitation to the numberof harmonics that may be calculated appears to be the availability ofaccurate harmonic blade loading data. Harmonic blade loadings contri-bute significantly to the fundamental rotational harmonic and for allpractical purposes completely determine detectability levels. Low-frequency rotational noise may be reduced by lowering blade loading androtor speed. High harmonic rotational noise may be reduced by reducingthe local stall and drag divergence tendencies of blades and by alteringaeroelastic characteristics to minimize harmonic airloads.
Blade slap is a phenomenon which affects both rotational and vortexnoise spectra and is generated by rapid changes of flow separation whichoccur during stall or drag-divergence conditions. Blade tip design isextremely important in attenuating blade slap. The trapezoidal shapedblade tip used in the present study produced significant reductions inblade slap noise level.
65

RECOMMENDATIONS FOR FURTHER STUDY
1. Conduct an analysis - test correlation program to evalu-ate the accuracy of the rotor noise analysis using theharmonic airload results of the NH-3A (S-61F) airloadmeasurement program.
2. Undertake further development of existing aeroelastic-aerodynamic programs to extend their capabilities forpredicting harmoric blade airloads to higher harmonics.
3. Perform a noise/performance/aeroelastic trade-off on anexisting helicopter to define an optimum low -noise con-figuration. Modify a ship to this configuration for verifi-cation of results and for demonstration purposes.
4. Define the relationships between blade slap and the degree ofstall, the extent of compressible drag-divergence, and tipvortex characteristics.
66

BIBLIOGRAPHY
1. Arnoldi, R. A., Propeller Noise Caused by Blade Thickness, UnitedAircraft Corporat'io Research Department, Report R-0896-1,East Hartford, Connecticut, January 10, 1956.
2. Bell Heliconter Company, A Study of the Origin and Means ofRteucing Helicopter Noise, TCREC Technical Report 62-73,U. S. Army Transportation Research Command*, FortEustis, Virginia, November 1962.
3. Carmichael, D., and Mull, H., Recommended Design Trends forsquiet Tail Rotors, Sikorsky Aircraft Report SER-503U7,trattord, Connecticut, September 1962.
4. Curle, N., The Influence of Solid Boundaries Upon AerodynamicSound, Proceedings of the Royal Society, A, 231, London,P ngTand, 1955.
5. Davidson, I. M., and Hargest, T. J., "Helicopter Noise", Journalof the Royal Aeronautical Society, Volume 69, MayT95T
6. Fletcher, Harvey, and Munson, W. A., Loudness, Its Definition,Measurement, and Calculation, ournal of the AcoustiSociety of America, Volume V, October 1933.
7. Garrick, I. E., and Watkins, Charles E., A Theoretical Study ofthe Effect of Forward Speed on the Free Space Sound-Pressure Field Around Propellers, NACA Report 1198,Langley Field, Virginia, 1954..
8. Gerstenberger, Walter, and Wood, Edward R., Analysis of Heli-copter Aeroelastic Characteristics in Hi~g Speed Fi ht,AIA 15ournal, volume 1, Number 10, October 1903.
9. Gessow, Alfred, and Myers, Gerry C., Jr., Aerodynamics of theHelicopter, First Printing, The Macmila company,New York, 1952.
10. Gustafson, F. B., and Myers, G. C., Jr., Stalling of HelicoterBlades, NACA TM 1083, Washington, oD. C., 940.
Now U. S. Xrmy Aviation Materiel Laboratories.
67

11. Gutin, L., On the Sound Field ef a Rotating Propeller, NACATM 1195, Washington, D. C., October 1948.
12. Hicks, Chester W., and Hubbard, Harvey H., Comparison of SoundEmission From Two-Blade, Four-Blade,. and seven-BladePropellers, NACA Technical Note 1354, Washington, D. C.,July n-47.
13. Hubbard, Harvey H., and Maglieri, Domenic J., An Investiationof Some iAhenomena Relating to Aural Detection of Airpianes,NAX TArecfnicaI Note 4S.S7, Wasnington, D. C., September1958.
14. Hubbard, Harvey H., and Regier, Arthur A., Free Space OscillatingPressures Near the Tips of Rotating Propellers, NACAReport 99K, Washington, 1. C., 1950.
15. Hubbard, Harvey H., and Regier, Arthur A., Propeller LoudnessLigt Aiplanes, NACA Technical Note 1358
Washington, D. C., July1947.
16. Hubbard, Harvey H., Propeller-Noise Charts for Transport Air-planes, NACA Technical Note 2968, Washington, D. C.,June 1953.
17. Ingard, Uno, Sound Radiation from a Propeller in a NonuniformMedium- P.ratt & Whitney Aircraft, East Hartford, Connecti-cut, January 1964.
18. Lamb, H., Hydrodynamics, Sixth Edition, Cambridge UniversityPress, London, England, 1932.
19. Lighthill, M. J., Sound Generated Aerodynamically, Proceedingsof the Royal Society, A 211l, London, England, 1952.
20. Loewy, R. G., Aural Detection of Helicopters in Tactical Situa-tions, Part II, Institute [or Defense Analysis ResearchPae P-25, AD 409535, Alexandria, Virginia, May 1963.
21. Miller, R. H., Rotor Blade Harmonic Air Loading LAS Paper No.62-82, January 1962.
22. Mull, H. R., External Noise Characteristics of Two CommercialTranspfft Helicopters, United Acoustic Consultants ReportA-042 and Addendu-n' Wilton, Connecticut, January 23, 1964.
68

23. Oestreicher, Hans L., "Field of a Spatially Extended Moving SoundSource", Journal of the Acoustical Society of America, Vol-ume 29, NurmnB&. 11, New York, N. Y., November 1957.
24. Piziali, R., and DuWaldt, F., A Method for Computing Rotr WingAirload Distribut'ion in Forward light, TIXF. Technical
Report 62-44, U. S. Army Transportation ResearchCommand, Fort Eustis, Virginia, July 1962.
25. Piziali, R., and DuWaldt, F., Computation of Rotr Wing Har-monic Airloads and Comparison with Eperiimental Results,American Helicopter Society, New York, New York,May 1962.
26. Powell, Alan, "Theory of Vortex Sound", The Journal of the Acousti-cal Society of America, Volume 36, Number 1, January 194..
27. Roberts, John P., and Beranek, Leo L., Experiments in ExternalNoise Reduction of a.Small Pusher-Iy Amp anbianAirplane, Washington, D. C. NAUA TM 2727, July 1952.
28. Roshko, Anatol, Experiments on the Flow Past a Circular Calinderat Very High eynoMd Number, journal of Flui Mectinics,T'olum'e 10, Part 3, Ma-y 191."
29. Scheiman, James, A Tabulation of Helicoper Rotor-Blade Differen-tial Pressures, Stresses, and Motions as Measured inFihNASA TUlX-932, Langley Sta~jon, H~amptont,Vr a, March 1964.
30. van de Vooren, A. I., and Zandbergen, P. J., Noise Field of aRotating Propeller in Forward Flight, AMAA Journal,Voli-ne I No. 7, July 1.9W.
31. Watkins, Charles E., and Durling, Barbara J., A Method for Calcu-lation of Free-Space Sound Pressures Near a PflaFlipht Includin Considerationts of a Chordwise Bl[ade Load-In NACA TM Mwas ngton D. C., 1956.
32. Wood, E. R., and Hilzinger, K. D., A Method for Determining theFully Cop led Aeroelastic Resp e of HeLicoer RotorBlades, lresent• at the American Helicopter SocietyNineteenth Annual National Forum, Washington, D. C.,May I - 4, 1963.
69

33. Yudin, E. Y., On the Vortex Sound From Rotati Rods, NACATM No. 1136, Washington. D. C., March 1947.
* 34. Zandbergen, P. J., and van der Walle, F., On the Calculation ofthe Propeller Noise Field Around Aircraft, Natina Aer'oX
* and Astronautical Research InstiEute, A msterdam, Nether-* lands, NLR TM G-23, 1962.
Items 3 and 17 are not to be considered as subject data required tobe furnished under this contract but are merely references that can bemade available to the government on a limited rights basis.
70t

DISTRIBUTION
US Army Materiel Command 5US Army Aviation Materiel Command 6US Army Aviation Materiel Laboratories 23US Army Limited War Laboratory 1US Army Human Engineering Laboratories IUS Army Research Office-Durham 1US Army Test and Evaluation Command IPlastics Technical Evaluation Center IUS Army Medical R&D Command 1US Army Combat Developments Command, Fort Belvoir 2US Army Combat Developments Command Transportation
Agency 1US Army Combat Developments Command Experimentation
Command 3US Army War College 1US Army Command and General Staff College 1US Army Aviation School IUS Army Tank- Automotive Center 2US Army Electronics Command 2US Army Aviation Test Activity, Edwards AFB 2Air Force Flight Test Center, Edwards AFB 2US Army Field Office, AFSC, Andrews AFB 1Systems Engineering Group (RTD), Wright-Patterson AFB 1Air Force Flight Dynamics Laboratory, Wright-Patterson
AFB INaval Air Systems Command 5Chief of Naval Research 3US Naval Research Laboratory IMarine Corps Liaison Officer, US Army Transportation
School ITesting and Development Division, US Coast Guard 1Manned Spacecraft Center, NASA INASA Scientific and Technical Information Facility 2NAFEC Library (FAA) 2US Army Aviation Human Research Unit 2US Army Board for Aviation Accident Research 1
71

_44
Bureau of Safety, Civil Aeronautics Board 2US Naval Aviation Safety Center, Norfolk I
Federal Aviation Agency, Washington, D. C. 2CAME Library, FAA 1Defense Docunmentation Center 20
72

APPENDIX I
SAMPLE CALCULATION OF VORTEX SOUND LEVELS
The vortex noise levels are easily calculated by use of equation 6and the vortex sound spectra in Figure 1.
Using the CH-3C blade system operating at 203 rpm and producing athrust of 19, 000 pounds for our calculations, the system parameterslisted in Table 1I are used.
Equation 6 is used to obtain the SPL at 300 feet., -27 ( 0 .,SPL= to los Co- ÷0 AB N,1
From Table III
AB=2a7
Since for this configuration the drag is small compared to the lift(C)=0. 077), it is assumed that the lift is approximately equal to thethrust.
Then L 2T (Reference 16)
Substituting the given valuesC" = (nO.•0 )"L (o.oo0,78)(217)(46;?
CL- 0.35Substituting these values in equation 6,
SPL= oIo 63 . 271( 4 + W. 0 A
SPL= io l0o UxIO8 + 20 1o 0.87S
SPL- 81.2 -0.4
SPL= so.8 0 xwfeet

To correct to distances of other than 300 feet from the rotor, utilize theexpression
a S PL -=,o losr
In this case we wish to obtain the level at 225 feet to compare withmeasured data.
AS PL=0zo l0 rAS PL= z.6ra b
Applying this correction to the level at 300 feet, we obtain
SPL= 8o.8+Z.f or 83.4 @ 225 fet
Since the operating range is below stall on the drag-divergence curveof Figure 21, the spectrum of Figure 19 should be used. With a calcu-lated overall vortex level of 83 db at 225 feet, the spectrum is then pre-dicted to be as follows:
Octave Band SPL(CPS) (db Ref. 0. 0002 dyne/sq. cm.)
150-300 75.0300-600 79.0600-1200 75.0
1200-2400 74.52400-4800 70.54800-9600 66.0
The measured values for this condition were:
150-300 75.0300-600 78.0600-1200 74.0
1200-2400 74.52400-4800 70.54800-9600 66.0

The overall level for the measured noise can be obtained by com-bining the octave band levels logarithmically. To obtain the overall SPLfrom octave band levels, first determine the intensity ratios of theindividual octaves.
SPLI= Iol3s TI 10
SPL 2~i~~ = 10 14a)1
Sum the intensity ratios to obtain the overall intensity ratio.
ITI IzZ-1 + +
Convert to overall SPL.
S PL = 10 Ilag '0
The results are summarized below:
Octave Band SPL(CPS) (db)
Measured CalculatedOverall 82.0 83.0
150-300 75.0 75.0300-600 78.0 79.0600-1200 74.0 75.0
1200-2400 74. 5 74. 52400-4800 70.5 70.54800-9600 66.0 66.0

APPENDIX II
VORTEX NOISE TEST INSTRUMENTATION
A block diagram of the instrumentation used in the test program ispresented in Figure 50. The acoustic signal was picked up with a low
impedance moving-coilmicrophone. The micro-
MEASUREMENT phone was coupled to aELEC-"O - VOICE GENERAl, RADIO General Radio 1551-C
5TYPE SOU-ND NALRE Sound Level Meter whichMROMONE METER TAPE RECORDER served as a calibrated pre-
, amplifier and decade attenu-REFERENHE SICNAL . ' ator. The output of the
GENERAL RADIOTYPE 307-A sound level meter was
TRANSISTOROSCILLATOR recorded on a Nagra III B
tape recorder. The over-all system was calibratedelectrically prior to eachseries of measurements.
The recorded data wasplayed back through an
ANALYSIS octave band analyzer. Theoctave band levels were
NA ,,B TYPE 1550ATYPE 1521 -A recorded with a graphicOCTAVrE BAND GRAPHIC LEVEL
TAPE RECORDER ANALYZER RECORDER level recorder. Becauseof the rapidly changingposition of the rotatingsource and the proximity
Figure 50. Vortex Noise Test of the microphone withInstrumentation respect to the source, each
of the octave bands showedshort time variations or modulation. In addition, there were longer timevariations that were attributed to changing wind conditions. These timevariations were averaged out by graphically recording the levels of theindividual octaves and noting the midpoint of the spread. The modulationwas found to be higher at the lower end of the spectrum than at the high-frequency end of the spectrum.
The time-averaged data was then corrected for system response andthe octave band levels were tabulated. The overall vortex noise levelwas computed by summing the corrected levels in the individual octavesfrom the 150-300 cps band to the 4800-9600 cps band.
76

APPENDIX III
CALCULATION OF PARTIAL DERIVATIVES
Calculate - knowing
2$ R?+ r z 2rRcosr(cos9cos *+sin 9sin)'-) (29)
From Figure 3
R2 "xyt ?c.~~j I,
Thereforewrite
S2_- x z 4 2÷+ 1 2 x J1',E
S / + e -zrcos~r 2 + Car .B Cosrfr" + ysin*-)(30)
which reduces to
S 2x -2r(-xcos* +ysin*) (31)
Taking the partial with respect to X
5 =x+rcos)P (32)
but noting that c -RcosorcOs9 this reduces to
S-"coso cose i* cosY-" (33a)
Similarly) for the y and X directions
K= Rcosor$ine- r sin* (33b)
S il T (33c)
77
1,

It is desirable to eliminate the second term of Equations (33a) and(33b) in order to simplify the solution. From the ratio of magnitudes ofthe two terms it appears that this elimination may be valid if the fieldpoint distance R is one diameter or more.
Equation (33) then becomes
•S -R oocsa A o "c~
cosr sine/
78

APPENDIX IV
APPROXIMATION OF CHORDWISE PRESSURE DISTRIBUTION AS ASTEP FUNCTION PLUS SCALE SHIFT
The Fourier series expansion of the initial blade passage timehistory in the rotor disk (Figure 5) is
AP(r,"t) = L Am cos mnnt+ + BBm sinwhere Mul*/fa+20.
Am v f P(r,*;,) Cos Mwalt at (34a)
Bm - A P(r,*,t). sin mwat ct (34b)
W-aLy shifting the time scale by *In the pressure pulse appears as in
Figure 51. The corresponding mathematical representation is
AP(r,jY, t)= Ta cosb(rnnt-mn )+ b,, sin (mt•at-mi•*)with W1
a P (r, *,T+ Via) Cos M MT A'T (35a)0
2finn
i f ja p(r,.,Tn * /) sin ,,,.T T (35b)0
where
T= t-Wa•
As an approximation to the function of Figure 51, a step functionwill be used as shown in Figure 52. The amplitude of this step function is
P' &P(r.*t) /dt (36)
79
I,___________:___!_

An additional scale shift of Aftarpermits expansion of the functionof Figure 52 as a cosine series and gives
AP(r,)"', t) a m os(mnnt-mYn nW) (37)
where Mal
which corresponds to the function of Figure 6.
a P(r.* 3tV
Figure 51. Tine History of Blade Passage Over r•'fAfrer Time Shift
AAlAr
Figure 52. Step Function Approximation
80

APPENDIX V
DEFINITION OF BLADE PITCH ANGLE
Blade angle 0 is controlled by collective pitch, cyclic pitch, andtwist. With the coordinate system of Figure 2, the following is true:
longitudinal cyclic pitch angle =8A COS*
lateral cyclic pitch angle = k sin*
where 18 and ; are the longitudinal and lateral cyclic pitch magni-tudes, respectively. The effect of negative blade twist is accountedfor as follows:
pitch angle change due to twist -• (r- Q)
where
Sis the twist rate
ro is the blade radial station at which twist begins.
The expression for pitch angle resulting from twist is based on theassumption that the collective pitch angle is measured at the blade root.Combining the effects of cyclic pitch, twist effect, and the collec-tive pitch angle, the true blade pitch angle is obtained.
/3 = Po r (,-r.) + r-05 •+T sinV,
81
I,
_ _ _ _ _ _ _ _ _ _ _ _ _ _ _ _ _ _ _ _ _

S~APPENDIX VI
S~DESCRIPTION OF PROGRAM FOR CALCULATING ROTATIONAL NOISE
f A program has been developed to facilitate the calculation of rotorrotational noise from equation 26 of this report. This is a Fortran IVprogram intended for use on the IBM 7094/44 D3. C. S. As explained
previously, the solution represents sound pressure at a point forrotational noise at the ffith harmonic of blade passage. The solution may
be used for calculating the rms sound pressure at any point in the near orfar field outside one diameter from the rotor. The solution's accuracydecreases with increasing rotor system translational speed up to Mach0. 3 which is the practical limit for accuracy.
Method and Subprograrms
The method used repeatedly evaluates the basic sound pressure
equation given in the analysis. This includes a double integration. Oneintegration is around the rotor disk with the sample points (azimuthangles) chosen at constant intervals. Subroutine SIMCOR, which usedSimpsons (1/3) Rule with correction term was chosen to perform thisintegration. The other integration is along the radius where sampleradial stations are unevenly spaced, hence, requiring the use of sub-routine AVQUAD. This is a method whereby several intervals areapproximated by "averaged quadratics" and integrated analytically.The flow diagram is shown in Figure 53.
Running time can be approximated at 20 sec. plus 5 sec. per fieldpoint. 5, 000 units of output is sufficient unless several causes are runwith all output options on. The deck setup is as follows:
$ DCID with facility accounting information
$ EXECUTE IBJOB
$ IBJOB MAP
Binary Deck Rotational Noise
Binary Deck SIMCOR
Binary Deck AVQUAD
7/8 END OF JOB
DATA
82

Dataradi al taton"
Stin
SMabverUetVQA
co nstants GDn~ wt o
to CorrectUnits
PteS r in' t Prn|o n
FDa t aS 3 Cootr F w D a r m p l t
ca83oinL

7/8 END OF JOB
$ IBSYS
$ PAUSE
$ PAUSE
Program Parameters
The parameters which must b-- known to use the program and theirunits are listed below:
nl Number of rotor blades
ft1 Angular velocity of rotor, revolutions per minute
a Blade chord, inches
C Velocity of sound, feet per second
RO Radius at start of blade twist, inches
0o Collective (steady) pitch angle, degrees
A! Cosine component of cyclic pitch (longitudinal), degrees
T Sine component of cyclic pitch (lateral), degrees
r Blade twist rate, degrees per inch
Lo Steady blade section loading for one radial station, pounds perinch
M Cosine component of the with harmonic of blade section loadingfor one radial station, pounds per inch
MM Sine component of the YAt~h harmonic of blade sectionlodnfrone radial station, pounds per inch
R Distance from center of rotor to point at which noise level isto be calculated, feet
84

9 Angle in rotor plane between longitudinal axis of helicopter (0degrees at tail) and point at which level is to be calculated,positive in direction of rotor rotation, degrees
r Angle in plane of rotor axis between rotor plane and point atwhich level is to be calculated, positive in direction of rotorthrust, degrees
Figures 2 and 3 show system parameters.
Input Format
The input format, which is to be used for every case is describedbelow. The input format is shown on the coding form in Figure 54. Asample case is shown in Figure 55.
Card 1: Title Card
Col. I - 1, Col. 2 - any desired title
Card 2: Basic Constants
Col. 2 - end code = 0 last case; = 1 case(s) follow
Col. 3 & 4 - (right adjusted) number of field points
Col. 5-12* - n
Col. 13-20" - a
Col. 21-28"- a
Col. 29-36* - c
Col. 37-44* - RO
Col. 45-52" -00
Col. 53-60" - A
Col. 61-68* -
Col. 69-76* -
*Must have decimal point.
85
____________ I:

!-I ---
'
-
! '
II
I U
* '2
I Isi1a
i1

-~ ....-- - - - - - - - - - -- -i-in I
1: [ . .. . I-
I 0) ,0, 4~ t I
*,42 a ty4
* .. ..o r.
3 'd9 'B,€
a 01 a a
_:S91 e. ,, •aa ,
" I I I It I Ij I
2 it
4)I- ----a to.--
* ~alt to t
00
t It I
3 W1
40 0
871.

[ - - -, --
: .1 , -- ..- -
It E
II I
3 -- -. ---' .. ... ... -.....-
I *
I v)
-1 41
DO Q
I to
- I I 0,..I1 . 88
2 2
2I _N • ..
Sl Q• ,a
i "-" •-• -, ... ..
= ,,•
S 00
* -i
- .. .. . . .. i -" i -- l ., I
88

Card 3: Control Constants
Col. 1 & 2 - number of harmonics of rotational noisedesired (I1N• IS ) (right adjusted)
Col. 4 - number of radial stations (4 4 N t 8 )
Col. 5-12 - angular increment of integration, degree (withdecimal point)
(NOTE: (360/ASW) = even integer, 6)"4• degree
Card 4: Output Controls
= 00 intermediate output not desired
= 99 intermediate output desired
Col. I & 2 - controls printout of input and radial integration
Col. 3 & 4 - controls printout of azimuthal integrations
Col. 5 & 6 - controls printout of S, •, t (from equation26 of the report)
Card 5: Radial blade stations in fields of 9, inches*
For each radial station:
Lo in Col. 1-8* on first card
LI - L,, in fields of 8* on second card
MI -Mto in fields of 8* on third card
For each field point:
One card with three parameters in fields of twelve, R, 9,',in that order (decimal points required).
*All fields specified must contain points.
I8
'I

INotes Regarding the Input Format
A case (Card 2, Col. 2) is a complete set of input data with a numberof harmonics, fields points, etc. A new case would require a new title,a new set of basic constants, etc.
The number of field points here (Card 2, Col. 3 & 4) must agreewith the numTber of cards describing the individual field points which arethe last set of input cards.
The number of rotational noise harmonics desired (Card 3, Col. 1& 2) partially determines :he program running time.
The number of radial stations (Card 3, Col. 4) is arbitrary and isdependent on the number of stations at which blade loading is available.Evenly spaced stations over the length of the blade are desirable becausethe program interpolates between points. When the program is run atSikorsky Aircraft, the last station is at the blade tip and the loading iszero at this position.
The angular increment of integration (Card 3, Col. 5-12) must besmall to obtain a valid solution. If only one harmonic of rotationalnoise is to be calculated, an increment as large as 15 degrees may beused. When 10 harmonics of rotational noise are to be calculatedamaximum increment of 2 degrees is tolerable. Slightly increasedaccuracy may be gained by further reducing the increment, however,computer running time is increased accordingly.
The intermediate data printout which is determined by the outputcontrol card (Card 4) was used primarily for debugging the program.The normal printout includes the station number and radius, azimuthnumber and angle, section loading for each radial and azimuth position,field point coordinates, sound pressure and sound pressure level. Theintermediate output adds a great deal of volume to the output and is notordinarily required.
The number of radial blade stations (Card 5) must correspond to
that specified in Card 3, Col. 4.
Description of Sample Case
The data for the sample 80-knot flyby case was taken from NASATM X-952, "A Tabulation of Helicopter Rotor Blade Differential Pres-sures, Stresses, and Motions as Measured in Flight". The ship usedwas an H-34 (Sikorsky S-58) helicopter. Rotational noise was calculatedfor 5 harmonics of rotational noit, z from the main rotor at 11 field points.
90

The blade root pitch (A6 O l, j ) was taken from the pitch motion por-tion of Table 13(c) of the referenced NASA report. The harmonic loadingfor 7 blade stations was taken from Table 13(d) of the same report andthe tip was considered the eighth station with zero loading assumed. Thesample input and output for this case is shown in Figures 55 and 56,respectively.
91

.%
000000 3OO COOOO0 OO OOOOOOO?0 000 0000
0 N. IN%;: -f 4 4ll
*ft P-400w.elNNNNNNNNNDNDNNNN NNNNNNNNNN
A% 00 0000 00 0 0 @0000000C 00O0 co00oCC
4NN ONN 40N0NNN NN 0P Now.N94 4-1F .M400%. •P
4 -ft O NffoN
* * 0000000000000OOOO0@0000OOO 0@0@QOO0O0OO sOOOO0C
s NNN4 NNN44 N 5 NP.N5.4NN N5.N N#"NN#NANN 'AP
0NS*. .4..... 0.e4........................ ...... ...
* fNPNUNS'ImNf tNii i •Op4NfNtN N•~m
0 a oo00
mi a
* 000000000000000000000000000 0 :0000..
o U2
4!0% 00000 000000000000000000O0000000000C. 000000000
---40 40944 0.
t; 0440 ............ 644 0O..4.4......t 8.. ... ..
N 0 UN40.4600% 0.00000000.4-#-O M0 .0 0 4-0% a4646
0a "I IL40 ft. N4 . 546 %N9.%55pSOP40
0~f ft 0 10%4NN NN
if
924@ 0644 P.ft. 44 0% -N
41~~*A0 Q 0 % .OM ~0 64% 9.4f 06 0 ~92460

0 ago 000096 000000IS~~ aa
.4fl.4rae.4,a......n..........nf
01 a r jn *; * ~
iii ~~. tiffIs .4 if- . .tN faoasg..III 2 v5 f
- a *-N9SCs a 0* a a *oon NOM4;
a a* a a aaae*Ln.eat aaacPN a 00a 0npep
I Wr900 0 I U: : ' "~ u: "~'~ N N~N NN NN N NNN NM 4N NN
Nab~~ X ZFt9 :s s ;w w WIa4 a a P-C a t iN P~ 4NfN W fQ N L
cv~~ ~~ n01 a *0 a a a m 00 P .. aa0* 0 000 P
zoo aw 0S0m jiWa rno
o-t .90me see~f a a ama;." g "a8 sa0
r...* m. -
Va -~u ::8w~v 1u~ Zi- poocr co2a~ ama a0 a ae . * 9%as aa w*hn H u:sq Ivn:an . U~~~~ 40a 4 ,fs~:R
a~p .4 -Mnj~z~o jz~ NNNjjcn NNN..N L L IS90,00022 *O'gg g0; 9 0000050Gvs ;989
0gN. ofn NHI MRasN
!Q000!c v:un: go 0* OOOLWWaee.aeja.* us:: P 0 0 0 0M flf fln... -....... fl @a 1.pn . -" ~ %wg:.aa na a.tn aaa9.Oc
;S~~~~pfl~~~~fl;;n~~~~ -------------------a.. i - -44444I

4 u00000?00?0¶00 00000 000000 ??????0f O 000??¶????00000
IN N NN NINNINNINNI *,.NN.. NoC.N N N ~SNNNN
Vi,~ .e...........4
*0UI0UJ00000000Q.0 00OL0000U040 aa0 4000 0 0200000Qcp000000000000 0
nw.,a 01 0- 0-aSs w ~a a i b &
.,.. cee ~ g.....*ouc.......n~ . .P.'~ .4 o t...... o~.. en s ee~
U)NNN NN NNN NN NNN NN NNN NN NN NNN NNSON NN NNcooNN
a t o SN at- .. N.. ... .. .. . .......coaaf..r~bneet... e. .... S 4N
ou aoOuOQooQoQ o ooo0 ooac000.a000000W004000a 02G000000000000
054 504 45 45 0a 5 l WJ W W M MU abWbd *M M W W f S W*S% ~ ~ ~ ~ ~ ~ ~ ~ ~ ~ ~ ~ ~ ~ ~ ~ A 9 Nfl f0 AD..S 04 5 Cn s t~ a b aPtt.Nd~ Na.~tfnO S
-. se.cC ta.P..4~aP a.4 0-.O~a P.I'4PN405NSbN # 0 N PSC 09N.4gob,
- - -9 - N- - -b*b~b%4 - -A. -. Nb~O~ -t -b4 N 5 0 - -S -1. :titb
te .. S s..te s s ase .awSt~aasa .'aana .. t 45494P
----- - ---- . ... a

I
N N N Pd Pd Pd Pd Pd Pd N Pd N N Pd N000000000000 .o 0094.0W WaS in a 41w in., win
OC N4�..i Pd � $....... S S P. P.
Pd Pd N Pd Pd Pd Pd Pd N Pd Pd 4 Pd N Pd
000000 000 000000
NPdNN NPdNNPd NNPdNPdN000000000000000.iin di win in win win a di in in 4409 NC 9 NP. 0044% CNO*didi...04*4%S4%p. P.N4P.
.....Pd Pd Pd Pd N N Pd N Pd Pd N Pd N Pd Pd0000 00 @00 0000 Co4-5
NNN NNNNNPdNNNNN
Mm di audi in indi in in india di CoC N N 4% 4 P. 40 44 N�M 40* P. diP. .. i4 45-. P. - S in**Pd4u'lPd 0 P.440%0Pl4%Ndi NO P.4w .'* di 4% 4 NO i-*444% %44 P. - P. P. P. P. P.44 C.Pd Pd Pd N N N N N N Pd N N N Pd Pd 44
.....QOOOGooooooaoao
0N N N Pd Pd Pd Pd Pd Pd Pd N N N N N000000000 000000iiiW Ii diainininindiinindiindi -44% 4%�di4U�e�PdN�044N4%Pde0*49 - N 4 We iia:*: .Mr4PP4�.d.
�PdN N NNNPd NN N N Co.............000000 000 0 a a 0 0 0
iPdPd '6in MW di di in di in Win di di .445W* -4= P. 4 P. .0P. di 40JP.P.Ndi $ di99NP.eONalP.e
di%*.4%UP.4 0P.O N 49 NW S - Vi di �22.0 P. P. - p �9.C9�
.....
CO 30 00 .4 00 0000 JO I-----0000000.4000003.4
W�4i4MWW.M.UMl Win aNO di P.4% 4 Pd NW4% N N* 09 * 0� P. ON - 4% 404 P.Pd-i S 4% P.4% P.4% P.4% * - N 4 -
44C�.N4W4%di44�%N�i44444% 4% 4%*4%4% 4% 4% 4% di
.....00 00 00 90 3 03 0 3 0 0
-iOO-i...... 0000000000000�1u 00 U 03000I liiiII�4I 4.44445W di a a .15W
4%-. 40 ON C 444.4S C N 44-i N P. OU N dl C P. U*4 N - N N �04000 P.O .1- '.14% N 4* iP - -- 5*4 N -
90 U 90 C NC P.4% N C 4% d
.....00.4�1 U 300030 U 090111110
OUUU..iOUwiJ �I.4 030 U.....
Pd*4 SON 4 � ON 4440P.NP..i%444444%di*.4 %N N N �i N N N .1514% N N 44% N
P.0*0-iNN 4414 P.O C 0'44 OP. P. P. P. P. P. 'p41 P. P.O -- - Pd - - - - Pd Pd
95
I

II
* 000
S8• ° ° ° ° -,
4.4o -.OhW W. -W4 ..
a II G
* **96

APPENDIX VII
SAMPLE CALCULATION-ASSUMED RELATIONSHIP BETWEEN BLADE.LADINC, T"RUST AND TRQU-"
Referring to Figure 7, which showJn end view of a rotor blade,and replacing 9mwith the steady force r , note that
where ar is a spanwise element of blade. The in-plane force is then
Fi =LAr sinand the out-of-plane force is
F.=LarcospThrust and torque are defined by
TýF n nL ar cosfi
Q = rh rnL = r sin-From the relationships we find
is ta '-w
The values selected for the example are
= 7.79 x 10⁵ pound-inches= 11, 300 pounds
r = 269 inchesnl = 4 blades
Ar = 7 inches
which give
= 14. 35 degrees= 417 pounds per inch
97
_ _ _ _ _ _ _ _ _ _ _ _ _ _ _ _ _ _ _I,

S~ APPENDIX VIHI
S~ROTATIONAL NOISE TEST INSTRUMENTATION
A block diagram of the instrumentation used in the Phase 11 test ispresented in Figure 53. Measurements were made with a one-half-inch
condenser microphone and the signal fed into the line input of a NagraSRHM tape recorder. The 400-
cps beeper signal used for aAL time reference was fed into
ilp-.-mm flLthe recorder through iasCAUSNAIWO URAWKSNand microphone input and wasgenerated by a General Radio
H Overall levels were adjusted'-------- -I to avoid overloading the5 L7. RAMo recorder. Data was recordedM WI1-AL
stM e at hover, 40eknot, 80tknot,and na0-knot cruise, and 70-
bandit poRs ofM noise1-A GEvER vers fr knot cyclic pullout. A record-t frequenc of•themainrotor ing was made with rotor system
Fo te rstopped and engine running todetermine the extent of enginenoise interference in the rotor
Figure 57. Rotational Noise Test noise frequency range ofInstrumentation interest.
All noise records were analyzed twice. First, one-third-octavebandwidth plots of noise level versus frequency were made to determinethe frequency of the main rotor blade passage and to evaluate maskingnoise. Second, plots were made of noise level versus timhe atindivi-dual rotor harmonic frequencies as determined by the spectrum plots.
Frequency analysis of the records with the engine running andstopped rotor system showed that engine spikes appeared from 79 cpsupward. The tail rotor fundamental blade passage frequency of the S-58helicopter appears at 85 cps for the rotor speed used in the test. Thefifth harmonic of the main rotor is at 75 cps and is masked by enginenoise. For this reason, only the first four harmonics of the rotationalnoise were analyzed. This data is presented in the section entitled"Correlation of Measured and Calculated Rotational Noise".
98

APPENDIX IX
ROTOR SYSTEM PARAMETERS AND LOADS FOR PHASE III STUDY
The S-58 rotor system in the hover condftion is used as the basisfor the Phase III study of the effects of harmonic blade loading. Thepertinent rotor system parameters are:
Number of blades 4Blade radius, feet 28Blade twist, degrees -8Blade chord, feet 1.367
Selected operating parameters are:
Rotor speed, rpm 210Blade pitch angle at root, degrees 19.6Thrust, pounds 11,300Loaded radial increment, inches 7.0
Eight-tenths of the tip radius (r = 269 inches) is selected as the effectiveblade radius. The pitch angle 1, corrected from the root angle forblade twist is 14.35 degrees.
L~r Smi From Figure 58,4 1 ~r Cos pL = blade section loading, pounds
per inchLer L,, C r = loaded blade incremental radius,
inchesS= blade pitch angle, degreesf1 = number of blades
Total thrustTz nL a" cospFigure 58. Blade Aerodynamic
Loading or, solving for L,
Lo 1.300 : 417 pounds per in.
This 417 pounds-per-inch blade loading is used as the steady componentof all Phase III calculations. Harmonic loading levels are fractions ofthis figure.
99
I'

UnclassifiedSecurity Classiflcstlon
DOCUMENT CONTROL DATA - R&D(Zemilery elsfstfctim, of ftse, h•s of aheama a" Ondindsft suMaltads set Ie eislted wh ie ONtVeail powpan If ckiffifsied)
V ORIGINATING ACTIVITY (CaePOcsute d 2a)3*. REPoRT SECURITY C L.ASSIrICATION
Sikorsky Aircraft UnclassifiedDivision of United Aircraft Corporation 3a. eRouP
Stratford, ConnecticutS. REPOR., TITLE
Helicopter Rotor Noise Generation and Propagation
4. DESCuIPtiVE NOTES (Type oe fpoft ad incluehen dams)
Final ReportS. AUTHORM) (L&af mee. fimt name., ,nital)
Schlegel, Ronald G., King, Robert J. . Mull, Harold R.
5.REPORIT OATP. 7f TOTAL NO. OFPAGESihNO.TPREaWP'October 1966 115 3
Ia. CONTRACT OR GRANT No. 0 ORIGI1NATORIS REPORT NUJMNRSEl
DA 44-177-AMC-141(T)t6 PROJECT No. USAAVLABS Technical Report 66-4
Task 1P121401A14801C. 9b. OTHER RE1PORT NC(S) (AnyoeS.,nahess# Met may be aseined
I,. AVAIL AILITY /LIMITATION NOT!C.S
Distribution of this document is unlimited.
IC. SUPPL EMENTAPY NOTES 12. SPONSORING MILITARY ACTIVITY
US Army Aviation Materiel Laboratories
Fort Eustis, Virginia
13. ADS RACT
An improved method is presented for calculating rotor system overall vortex noiseand frequency spectra for stall6d and unstal.ed rotors. Correlation of measuredand predicted vortex noise was evaluated using two rotor systems operating over awide range of speeds and thrusts. Correlation was found to be excellent. Bladetip planform studies revealed significant vortex noise reductions with tapered tips.
A new procedure is also derived for calculating near and far field rotor rotationalnoise with nonuniform inflow. The method extends the standard steady load methodby including the effects of harmonic airloads. Correlation studies were conducteduping an H-34 helicopter. Agreement between low frequency measured and pre-dicted noise was good. However, correlation with high harmonic rotational noisewas poor. This is probably due to inadequate definition of high harmonic airloads.
Presented results establish the importance of high harmonic rotational noise fordetectability and loudness, and further work is recommended to more accuratelydefine high harmonic blade loading. Since an airload measurement program isbeing conducted on the NH-3A, it is recommended that a correlation program beconducted to more fully evaluate the accuracy of the presented noise analysisprogram using the NH-3A airload results.
This study was performed for single rotor systems oniy, and in its present formis not directly applicable to systems with multiple rotors in juxtaposition.
DD A.. 17 Unclas siaiedSacuutt Clns~iceto

UnclassifiedSecurity Classification
14.KEY WORDS LINK A LINK U LINK C
MOR.O WT MOL.9 WY M"L0 WY
NoiseHelicopterRotor Noise
INSTRUCTIONS
I. ORIGINATING ACTIVITY: Enter the name and address 0 AVAILABILITY/LIMITATION-NOTICE-: Enter any lim-o! the contractor, subcontractor, grantee, Department of De- I itations on further dissemination of the report, other than thosetense activity or other organization (corporate author) issuing imposed by security classification, using standard statementsthe report, such as:2a. REPORT SECURTY CLASSIFICATION: Enter the over- (I) "Qualified requesters may obtain copies of thisall security classification of the report. Indicate whether"Restricted Data" is included. Marking is to be in accord- report from DDC."ance with appropriate security regulations. -(2) "Foreign announcement and dissemination of this2b. GROUP: Automatic downgrrading Is specified In DoD Di-reotbDCisotahoie.'
rective 5200. 10 and Armed Forces Industrial Manual. Enter (3) "U. S. Government agencies may obtain copies ofthe group number. Also, when applicable, show that optional this report directly from DDC. Other qualified DDCmarkings have been used for Group 3 and Group 4 as suthor-, users shall request throughized.3. REPORT TITLE: Enter the complete report title in all (4) "U. S. military agencies may obtain copies of thiscapital letters. Titles in all cases should be unclassified. report directly from DDC. Other qualified usersIf a meaningful title cannot be selected without clssaifica-tion, show title classification in all capitals in parenthesis shall request throughimmediately following the title. ____
4. DESCRIPTIVE NOTES: If appropriate, enter the type of (5) "All distribution of this report is controlled. Qual.report, e.g., Interim, progress, summary, annual, or final. ified DDC users shall request throughGive the inclusive dates when a specific reporting period iscovered.c e If the report has been furnished to the Office of TechnicalS. AUTHOR(S): Enter the nome(s) of author(s) as shown on Services, Department of Commerce. for sale to the public, indi-or in the report. Enter last nime, first name, middle initial. cate this fact and enter the price. if known.If military, show rank and branch of service. The name ofthe principal author is an absolute minimum requirement. I L SUPPL;EMENTARY NOTES: Use for additional explana-
tory notes.6. REPORT DATE. Enter the date of the report as day,month, year; or month, year. If more than one date appears 12. SPONSORING MILITARY ACTIVITY: Enter the name ofon the report, use date of publicsticn. the departmental project office or laboratory sponsoring (pay-7.. TOTAL NUMBER OF PAGES: The total page count Ing for) the research and development. Include address.should follow normal pagination procedures, Le., enter thp 13. ABSTRACT: Enter an abstract giving a brief and factualnumber of pages containing[ information. summary of the document indicative of the report, even thoughit may also appear elsewhere in the body of the technical re-7b. NUMBER OF REFERENCESR Enter the total number of port. If additional space is required, a continuation sheetreferences cited in the report. shall be att'sched.
So. CONTRACT OR GRANT NUMBER. If appropriate, enter It is highly desirable that the abstract of classified re-the applicable number of the contract or grant under which ports be unclassified. Each paragraph of the abstract shallthe report was written. end with an indication of the military security classification8b, Sc, & 8d. PROJECT NUMBER: Enter the appropriate of the information in the paragraph, represented as (7S), (S),military department identification, such as project number, (C), or (U).subproject number, system numbers, task number, etc. There is no limitation on the length of the abstract. How-9e. ORIGINATOR'S REPORT NUMBER(S): Enter the offi- ever. the sug;.,oe!ed length is from 150 to 225 words.cial report number by which the document will be identified 14. KEY WORDS: Key words are technically meaningful termsand controlled by the originolting activity. This number must or short phrases that characterize a report and may be used asbe unique to this repnot, index entries for cataloging the report. Key words must beqb. OTHTER REPORT NUMBER(S): If the report has been selected so that no security classification is required. Iden-assigned any other report numfbers (either by the orltinator fiers, such as equipment model designation, trade name, mill.or by the @poneor). also enter this numbler(s). tary prnject code name, geographic location. may be used as
trey words but will be followed by an indication of technicalcontext, The assignment of links, rules, and woigbns is
I optional.
Unclassified5ý€.ty M•.,M'•€wo