Heat tariff reform and Social impact mitigation - … · Heat tariff reform and Social impact...
44
HEAT TARIFF REFORM AND SOCIAL IMPACT MITIGATION Recommendations for a Sustainable District Heating Sector in Belarus JUNE 2014 Public Disclosure Authorized Public Disclosure Authorized Public Disclosure Authorized Public Disclosure Authorized Public Disclosure Authorized Public Disclosure Authorized Public Disclosure Authorized Public Disclosure Authorized
Transcript of Heat tariff reform and Social impact mitigation - … · Heat tariff reform and Social impact...

Heat tariff reform and Social impact mitigation
Recommendations for a Sustainable District Heating Sector in Belarus
JUne 2014
Pub
lic D
iscl
osur
e A
utho
rized
Pub
lic D
iscl
osur
e A
utho
rized
Pub
lic D
iscl
osur
e A
utho
rized
Pub
lic D
iscl
osur
e A
utho
rized
Pub
lic D
iscl
osur
e A
utho
rized
Pub
lic D
iscl
osur
e A
utho
rized
Pub
lic D
iscl
osur
e A
utho
rized
Pub
lic D
iscl
osur
e A
utho
rized
WB469252
Typewritten Text
89695


iii
Acknowledgments v
Introduction 1
1 What Are the Government’s Plans for the Sector? 3
2 Why Is Tariff Reform Necessary? 5
3 What Is the Likely Impact of Tariff Reform? 13
4 How Can Tariff Reform Best Be Implemented? 21
Appendices Appendix A: Overview of the District Heating Sector in Belarus Appendix B: The Impact of Tariff Reform on Households and Industries Appendix C: Distribution Impacts of energy cross-subsidization in Belarus Appendix D: Methodologies of Focus Group Discussion and In-depth Interviews Appendix E: Cost Allocation between Heat and Electricity in CHP Plants Appendix F: Reform of District Heating Tariff Setting Principals and Lessons
Learned in the Baltic Countries and Poland Appendix G: Communicating Heating Tariff Reform to Households Lessons and
Experience from Eastern European Countries and Russia Appendix H: Overview of Social Assistance Programs in Belarus Appendix I: Protecting the Poor from Tariff Increases – Experiences and Lessons
from Eastern Europe and Central Asian Countries Appendix J: Energy Efficiency
Tables
contentS
Table I.1: Policy Matrix for Tariff and Subsidy Reform in District Heating 2 Table 1.1: National Cost-Recovery-Level Targets for Residential Heat and Electricity Services of BelEnergo 4 Table 3.1: Tariff Reform Options, 2015–2020 13 Table 4.1: Poverty Impact of GASP and H&U Benefits 24 Table 4.2: Benefit Coverage, Targeting Accuracy and Fiscal Cost of GASP and H&U Benefits 25 Table 4.3: Advantages and Disadvantages of GASP and H&U Benefits 26 Table 4.4: Economic Analysis of Supply-Side EE Measures in Case Study Towns 30

Heat tariff reform and Social impact mitigationiv
Table 4.5: Economic Analysis of Network Renovation in Case Study Towns 31 Table 4.6: Economic Analysis of Demand-Side EE Measures under Current Tariff 32 Table 4.7: Economic Analysis of Demand-Side EE Measures under Different Tariff Increase Scenarios 33 Table 4.8: Average Annual Household Savings after implementation of EE Measures 34 Table 4.9: Reform Packages with Positive Fiscal Savings 35
Figures Figure 2.1: Declining Cost-Recovery Levels of Residential Heat Service 5 Figure 2.2: Import prices of Russian Natural Gas has sharply increased 6 Figure 2.3: Comparison of Tariffs and Production Costs or ZhKHs and Belenergo 7 Figure 2.4: Belenergo Industrial Electricity Tariffs as a Percentage of Cost of Service 8 Figure 2.5: Use of Cross-Subsidies from Belenergo’s Non-Residential Electricity Sales to Finance Residential Heat 8 Figure 2.6: Comparative Energy Costs—Where Belarus Stands 9 Figure 2.7: Increase in Output Prices Due to Implicit Electricity Tax Levied on Industrial Consumers 9 Figure 2.8: Expenditure Shares by Consumption Category and Income Decile 10 Figure 2.9: Extra Expenditures from Imposing Implicit Tax on Industrial Consumers 10 Figure 2.10: Distribution of Heat Subsidies 11 Figure 3.1: Affordability at Different Cost-Recovery Levels by Income Group and Price Scenario 14 Figure 3.2: Vulnerability of Different Populations Under a Uniform Pricing Regime 15 Figure 3.3: Vulnerability of Different Populations Under a Differentiated Pricing Regime 15 Figure 3.4: Impacts of Tariff Increases: Highest in Q4 and Q1 17 Figure 3.5: Coping Strategies in Response to Tariff Increases 17 Figure 3.6: Fiscal Savings Generated from Uniform and Differentiated Price Scenarios 18 Figure 3.7: Shares of Exports of Different Sectors 19 Figure 4.1: Substantial Variation in the Costs of Heat Supply Among Oblasts 27 Figure 4.2: Distribution of Housing Stocks by Heat Consumption (2012) 28 Figure 4.3: Heat and Hot Water Consumption by Building Type 28 Figure 4.4: Recommended Road Map for Implementing Reforms 36

v
This work was carried out under the direction of Ranjit Lamech, Sector Manager for the Energy Unit of the Europe and Central Asia Region, and Qimiao Fan, Country Director for Belarus, Moldova, and Ukraine. The team would like to thank them for their generous guidance, insights, and encouragement.
This report was prepared by Fan Zhang and Denzel Hankinson, based on substantial con-tributions from a large number of World Bank staff and consultants from Social Protection, PREM, Energy, Social Development and External Affairs Units. Julia Smolyar and Vlad Grigoras contributed to the social protection analysis. Sebastian Eckardt contributed to the fiscal analysis. Murat Alehodzhin and Irina Voitekhovitch prepared a detailed background study on energy efficiency. Ecaterina Canter, Izabela Leao and Klavdiya Maksymenko con-ducted extensive work on the qualitative social impact analysis and stakeholder analysis. Corbett Grainger and Bonsuk Koo contributed to the quantitative social impact analysis. Irina Oleinik led the communication study and training. Bonsuk Koo, Yating Chuang, and Andrew Schreiber provided valuable research assistance. Maryna Sidarenka and Irina Voitekhovitch worked tirelessly to obtain household survey and administrative data. Karuna Phillips helped draft an appendix on social protection programs in neighboring countries. Valdas Lukosevicius provided background studies on tariff setting methodolo-gies and tariff reform experiences in the Baltic countries and Poland. Dianne Snyder edited the report, and Carol Siegel designed the format. Rozena Serrano provided timely admin-istrative assistance.
The study received substantial support from the ECA management team. The team would particularly like to thank Elisabeth Huybens in the Social Development Unit, Carolina Sanchez-Paramo in the Poverty Reduction and Economic Management Unit, and Andrew Mason in the Social Protection Unit. The team is also grateful to representatives of the joint working group from the Ministries of Finance, Economy, Energy, Housing and Utilities, Labor and Social Protection; as well as from Belenergo, Eltopgas, the Energy Efficiency Department, and the oblast executive committees, for their productive discussions and feed-back throughout the project. The team is also grateful to the National Statistical Committee for providing essential data.
The report benefited greatly from Elena Klochan who worked tirelessly to coordinate with the government, provided important guidance on country issues, and supported the establishment of the joint working group. Pekka Salminen has nurtured and led the Bank’s engagement in the district heating sector in Belarus. The team is greatly indebted to Pekka
acknowledgmentS

Heat tariff reform and Social impact mitigationvi
for generously providing his guidance and insights on technical and policy issues of the sector. The peer reviewers for this report are Sameer Shukla, Jonathan Sinton, Emil Tesliuc, Maria Vagliasindi and Yadviga Viktorivna. Ani Balabanyan and Caterina Laderchi care-fully reviewed the report at multiple stages and provided comments on both the substance and presentation of the report. The team would like to thank all reviewers for their valu-able inputs and suggestions at various stages of the study. Special thanks also go to Nicolas Perrin and Michelle Rebosio, who supported and coordinated the qualitative field survey and the stakeholder analysis.
In addition to the contributors of the background papers and peer reviewers, many people at the World Bank provided helpful comments, suggestions, and other inputs along the way. The team would particularly like to thank Tamara Sulukhia, Alejandro Cedno, Young Chul Kim, Uwe Deichmann, Kari Nyman. Sunil Khosla, Jas Singh, Claudia Vasquez Suarez, Sophia Georgieva, Heather Worley, Stephane Dahan, and Nithin Umapathi. We wish to apologize to anyone inadvertently overlooked in these acknowledgements.
Finally, the team would like to thank ESMAP ABG and Subsidies Trust Fund and ECA PSIA Trust Fund for their generous financial support.
1
introdUctionThe Government of the Republic of Belarus (GoB) plans to increase district heating (DH) tariffs to cost-recovery levels and gradually phase out subsidies, replacing them with social assistance programs. Residential DH tariffs in Belarus are currently at roughly 10–21 per-cent of cost-recovery levels. DH subsidies are highly regressive, add costs to business, and create significant fiscal risks and macroeconomic vulnerabilities.
The purpose of this report is to analyze the social, sectoral, and fiscal impacts of the pro-posed tariff reform, and to identify and recommend measures to mitigate adverse impacts of DH tariff increases on the households. The analysis shows that:
• TheburdenofhigherDHtariffswillfallmostheavilyonlow-incomegroups.• Thecurrentsystemofsubsidiesisunfair,benefittingwealthycustomersmorethanthe
poor.• Cross-subsidiesunderminethecompetitivenessofindustriesinBelarus• Underpricedresidentialheatplacesan increasingfiscalburdenontheGoBandrisks
macroeconomic instability.
The analysis shows that a negative social impact is manageable if a tariff increase is accom-panied by countervailing measures to compensate for the loss of purchasing power, in par-ticular of the poor, through targeted social assistance and energy efficiency programs. The reform is more likely to be successful if communication campaigns to address consumer concerns are carried out before significant price increases, and consumer engagement and monitoring systems are established. When tariff reform and mitigation measures are prop-erly sequenced and coordinated, the reform will become more socially acceptable, consum-ers will benefit from better quality of services, the government will achieve positive fiscal savings, and the DH sector will become sustainable in the long term. A sustainable DH sector means:
• Financially viable DH service providers—Belenergo and ZhKH—that can afford tomaintain and invest as much as required to provide the services customers want
• TheindependenceofDHserviceprovidersfromexcessivedirectfiscalsubsidies,and• Well-targetedsocialassistanceforcustomersstrugglingtoaffordthecostofheating.
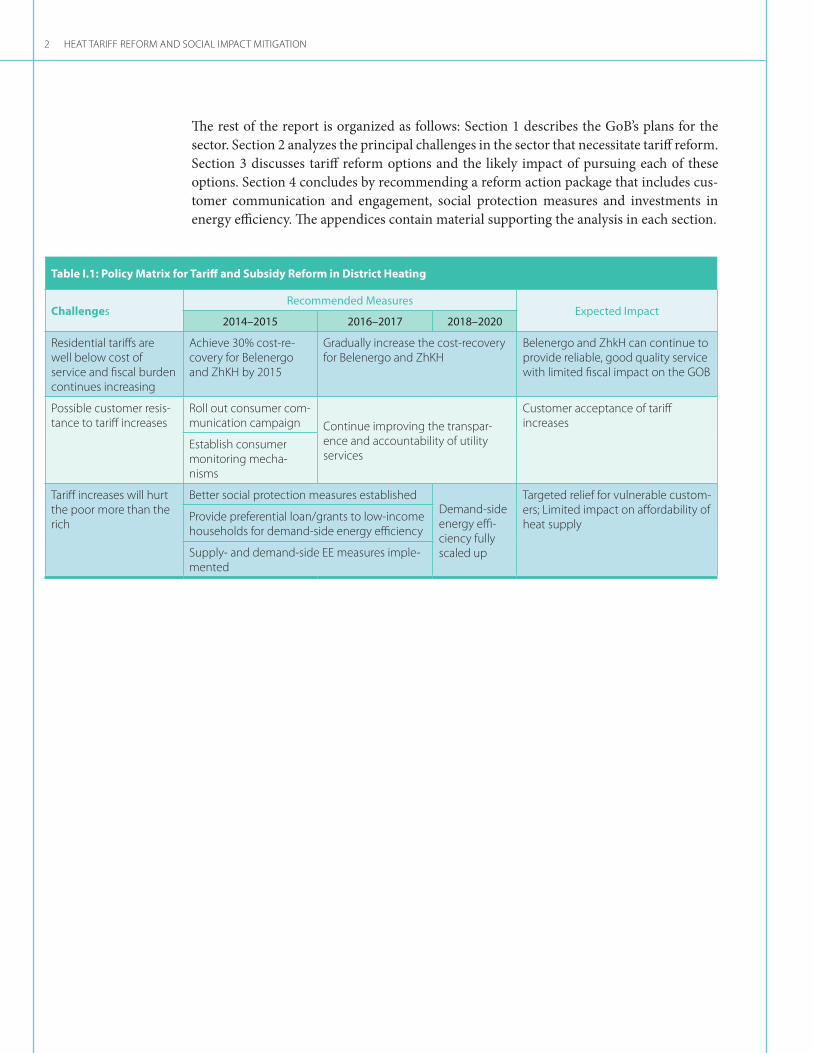
Table I.1 summarizes the challenges facing the DH sector and the recommended policy options.
Heat tariff reform and Social impact mitigation2
Table I.1: Policy Matrix for Tariff and Subsidy Reform in District Heating
Challengesrecommended measures
expected impact2014–2015 2016–2017 2018–2020
Residential tariffs are well below cost of service and fiscal burden continues increasing
Achieve 30% cost-re-covery for Belenergo and ZhKH by 2015
Gradually increase the cost-recovery for Belenergo and ZhKH
Belenergo and ZhkH can continue to provide reliable, good quality service with limited fiscal impact on the GOB
Possible customer resis-tance to tariff increases
Roll out consumer com-munication campaign Continue improving the transpar-
ence and accountability of utility services
Customer acceptance of tariff increases
Establish consumer monitoring mecha-nisms
Tariff increases will hurt the poor more than the rich
Better social protection measures established Demand-side energy effi-ciency fully scaled up
Targeted relief for vulnerable custom-ers; Limited impact on affordability of heat supply
Provide preferential loan/grants to low-income households for demand-side energy efficiency
Supply- and demand-side EE measures imple-mented
The rest of the report is organized as follows: Section 1 describes the GoB’s plans for the sector. Section 2 analyzes the principal challenges in the sector that necessitate tariff reform. Section 3 discusses tariff reform options and the likely impact of pursuing each of these options. Section 4 concludes by recommending a reform action package that includes cus-tomer communication and engagement, social protection measures and investments in energy efficiency. The appendices contain material supporting the analysis in each section.

3
National and energy sector programs outline specific invest-ments and targets for the DH sector,
…such as increasing the use of biomass in heat generation,
…increasing cost- recovery levels in the DH sector,
The GoB’s Strategy for Energy Potential Development sets national targets for the energy sector up until 2020. The overall objective of the strategy is to ensure Belarus’s energy inde-pendence and promote the efficient use of energy resources. The GoB targets relevant to the DH sector include:
§Increasing the share of domestic fuel in the energy mix to 28–30 percent by 2015 and 32–34 percent by 2020 from 17 percent in 2010, thus reducing dependence on imported natural gas,
§Reducing the share of natural gas in the energy balance to 64 percent in 2015 and to 55 percent by 2020,
§Reducing the energy intensity of GDP by 50 percent by 2015 and 60 percent by 2020 (from 2005 levels),
§Phasing out subsidies and cross-subsidies, and§Restructuring heat tariffs.
In line with this strategy, the GoB has enacted a number of DH sector-specific policies and laws described below.
One of Belarus’s richest natural resources is its forests, which cover 40 percent of the coun-try. The GoB intends to increase the share of electricity and thermal energy generated from biomass to 14–15 percent so that, by 2020, at least 32 percent of the fuel used in boilers comes from locally sourced fuels.1
The GoB has also set national cost-recovery targets for the residential DH operations of Belenergo, a major heat provider in Belarus. Belenergo is expected to achieve 30 percent cost-recovery levels in its residential heating operations by 2015. In 2012, Belenergo’s cost-recovery level for residential heat services was only 17.2 percent. Table 1.1 summarizes national cost-recovery targets for the DH sector.
1. National Program of Local and Renewable Energy Sources Development for 2011–2015.
wHat are tHe government’S planS for tHe Sector?
1
The GoB has set national targets, planned investments, and continued to enact tariff reform in the DH sector.

Heat tariff reform and Social impact mitigation4
Table 1.1: National Cost-Recovery-Level Targets for Residential Heat and Electricity Services of BelEnergo
2011 (actual)
2012 (actual)
2013 2014 2015
Cost recovery rate for heat (distributed by Belenergo suppliers, %)
21.4 17.2 18.7 21 30
Prime cost of 1 Gcal of heat, BYR/Gcal 202,185.50 329,273.90 359.649.60 406,217.80 453.138.40
Source: State Program on the Energy Sector Development by 2016.
At the municipal level, the GoB has enacted the Program for Housing and Utilities of the Republic of Belarus 2015, which aims to reduce heat losses by 6.7 percent in the heat net-work by 2016 by replacing old and inefficient heat network, introducing more energy-effi-cient generation facilities, reducing subsidies and cross-subsidies, and increasing the use of local fuels.
From an organizational standpoint, the GoB also plans to centralize the DH sector, trans-ferring municipal ownership to national ownership under Belenergo to extract efficiency gains.2
More recently, to simplify the system of cross-subsidies between the electricity and DH sec-tors and between residential and industrial customers, the GoB has phased out preferential heat tariffs for legal entities and individual entrepreneurs and is gradually increasing resi-dential tariffs each financial quarter. These increases are indexed by the growth of house-hold income, which does not exceed the growth of nominal wages. However, tariff increases for all energy utilities cannot increase by more than 5 USD per year without approval from the president (Decree 550). As a mitigation measure, households in urban areas whose income on utilities exceeds 20 percent and those in rural areas whose income exceeds 15 percent will receive social assistance.
Appendix A provides an overview of the DH sector in Belarus.
2. Heat Supply Development Concept for the Period until 2020.
…improving supply side energy efficiency,
… and restructuring the DH sector.
Specific legislation phases out subsidies and cross-subsidies

5
Residential tariffs are well below the cost of service
Residential tariffs are currently at roughly 10 to 21 percent of cost-recovery levels. The range depends on factors that include the size of the DH system, fuel used, efficiency of pro-duction, condition of the networks, and technical characteristics of the customer connec-tion. Figure 2.1 shows how the cost-recovery levels of residential heat service have changed over time in Belarus.
wHy iS tariff reform neceSSary?
2
Residential tariffs for DH are well below the cost of service in Belarus. Since 2003, production costs have risen sharply while the cost-recovery levels of residential heat service have dropped by 50 percent. Incremental increases in residential tariffs have been eroded by inflation and depreciation of the Belarusian ruble to the US dollar. Even if tariffs were increased by 5 USD per year, the limit before presidential approval is necessary, they would not meet the 30 percent cost-recovery target set by the GoB. A system of subsidies and cross-subsidies between customer classes and between the electricity and the DH sectors have resulted in an increasing fiscal burden, which worsens as the cost of service continues to increase.
Figure 2.1: Declining Cost-Recovery Levels of Residential Heat Service
0
10
20
30
40
50
60
70
80
2005 2006 2007 2008 2009 2010 2011 2012
Res
iden
tial
hea
t co
st r
eco
very
rat
e (%
)
Belenergo ZhKH
Source: Ministry of Energy, Ministry of Housing and Utilities.Note: Belenergo and ZhKH are the two major DH providers in Belarus. See Appendix 1 for a background of the Belarusian DH sector.

Heat tariff reform and Social impact mitigation6
Costs faced by suppliers of heating have risen substantially in recent years and are higher than the “economically efficient” level assessed by the Council of Ministers.3 The cost of fuel for use in combined heat and power plants and boilers is the most significant cost faced by suppliers, not least because it is paid in US dollars. The price of importing natural gas from Russia has increased sharply in the past decade, from USD47/tcm in 2005 to USD263/tcm in 2011. Over the same period, the value of the ruble has fallen considerably. This is offset only slightly by the reduction in technical losses in the transmission and distribution sys-tems—currently 16.3 percent for ZhKH and 10 percent for Belenergo. Figure 2.2 shows the rapid increase in the price of natural gas imports since 2005. The import price of natural gas accounts for roughly 60 percent of total heat production costs.
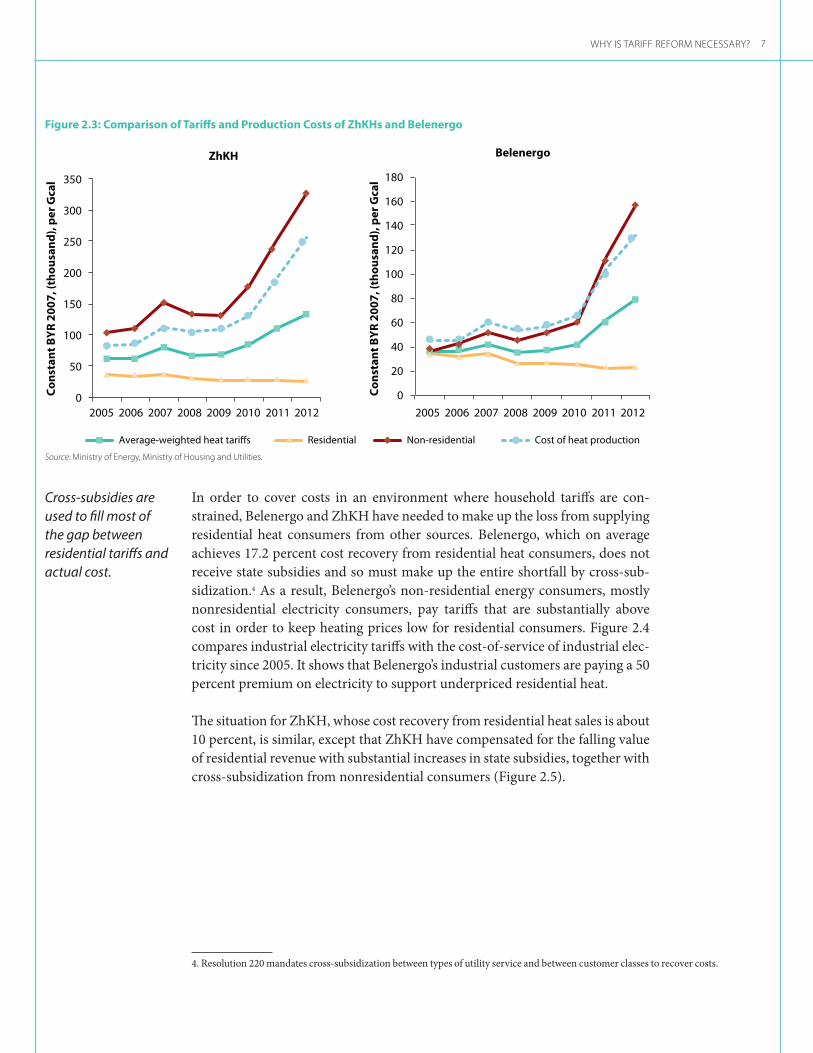
The cost of heat production and distribution by ZhKH is thought to be about double that of Belenergo. Contributing factors are (i) economies of scale (Belenergo serves customers in Minsk city and the oblast capitals while ZhKH serves customers in smaller towns and rural areas), (ii) Belenergo’s use of efficient combined heat and power plants (in contrast to the use of heat-only boilers by ZhKH), and (iii) the higher transmission and distribution losses in the ZhKH systems as a result of aging ZhKH assets. Figure 2.3 shows the increase in production costs for ZhKH and Belenergo, as compared to the increase in tariffs.
3. The Council of Ministers makes a resolution on a quarterly basis establishing the subsidized residential heating and hot wa-ter tariff. The most recent, N 1166, set the tariff at 80,570 BYR per Gcal against an ”economically justifiable” tariff of 300,000 BYR per Gcal. No information is publicly available on the methodology applied for determining the economically justifiable tariff, but it is thought to be a tariff that reflects the actual costs of heat production and delivery.
Figure 2.2: Import Prices of Russian Natural Gas Has Sharply Increased
0
200
400
600
800
1,000
1,200
1,400
0
50
100
150
200
250
300
350
400
450
500
2005 2006 2007 2008 2009 2010 2011 2012
000
BR
Y/T
CM
, co
nst
ant 2
007
pri
ces
USD
/TC
M, c
on
stan
t 200
7 p
rice
s
NG border prices, left axis, USD/TCM NG import prices, right axis, 000 BYR/TCM
Source: Ministry of Energy, OECD.
why is tariff reform necessary? 7
Figure 2.3: Comparison of Tariffs and Production Costs of ZhKHs and Belenergo
0
50
100
150
200
250
300
350
Co
nst
ant B
YR
200
7, (t
ho
usa
nd
), p
er G
cal
Co
nst
ant B
YR
200
7, (t
ho
usa
nd
), p
er G
cal
ZhKH
Average-weighted heat tariffs Residential Non-residential Cost of heat production
0
20
40
60
80
100
120
140
160
180
2005 2006 2007 2008 2009 2010 2011 2012 2005 2006 2007 2008 2009 2010 2011 2012
Belenergo
Source: Ministry of Energy, Ministry of Housing and Utilities.
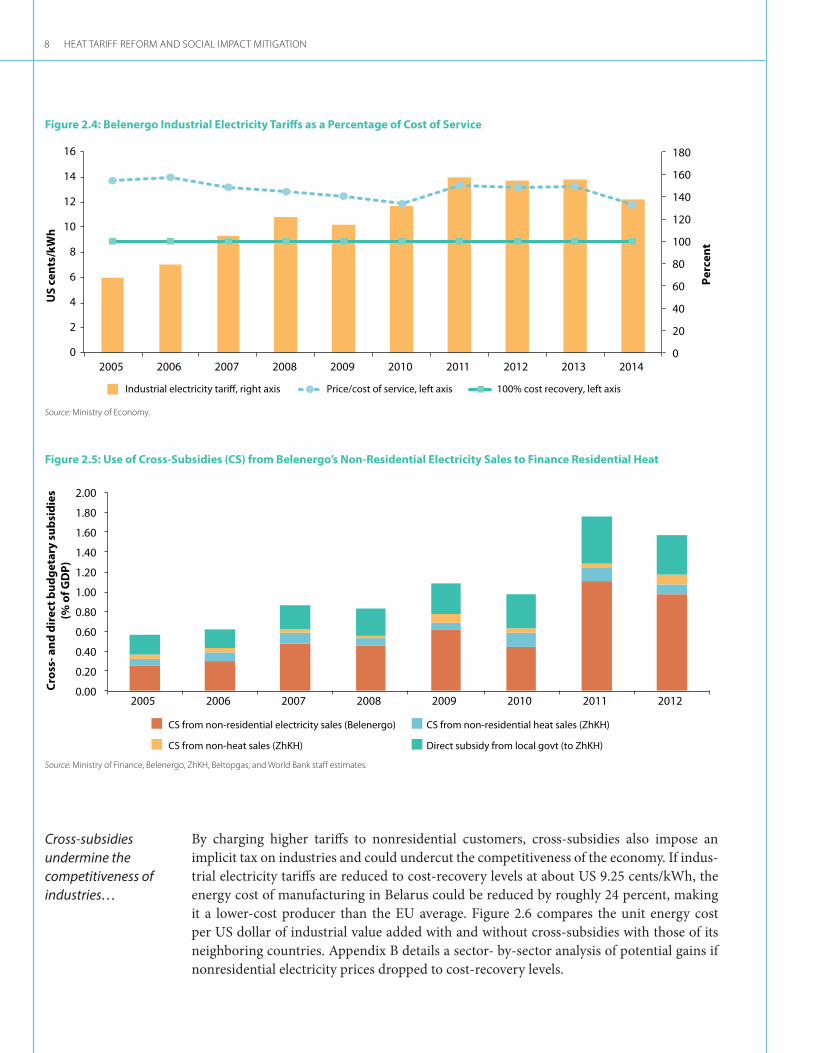
In order to cover costs in an environment where household tariffs are con-strained, Belenergo and ZhKH have needed to make up the loss from supplying residential heat consumers from other sources. Belenergo, which on average achieves 17.2 percent cost recovery from residential heat consumers, does not receive state subsidies and so must make up the entire shortfall by cross-sub-sidization.4 As a result, Belenergo’s non-residential energy consumers, mostly nonresidential electricity consumers, pay tariffs that are substantially above cost in order to keep heating prices low for residential consumers. Figure 2.4 compares industrial electricity tariffs with the cost-of-service of industrial elec-tricity since 2005. It shows that Belenergo’s industrial customers are paying a 50 percent premium on electricity to support underpriced residential heat.
The situation for ZhKH, whose cost recovery from residential heat sales is about 10 percent, is similar, except that ZhKH have compensated for the falling value of residential revenue with substantial increases in state subsidies, together with cross-subsidization from nonresidential consumers (Figure 2.5).
4. Resolution 220 mandates cross-subsidization between types of utility service and between customer classes to recover costs.
Cross-subsidies are used to fill most of the gap between residential tariffs and actual cost.
Heat tariff reform and Social impact mitigation8
Figure 2.4: Belenergo Industrial Electricity Tariffs as a Percentage of Cost of Service
Source: Ministry of Economy.
Figure 2.5: Use of Cross-Subsidies (CS) from Belenergo’s Non-Residential Electricity Sales to Finance Residential Heat
Source: Ministry of Finance, Belenergo, ZhKH, Beltopgas, and World Bank staff estimates.
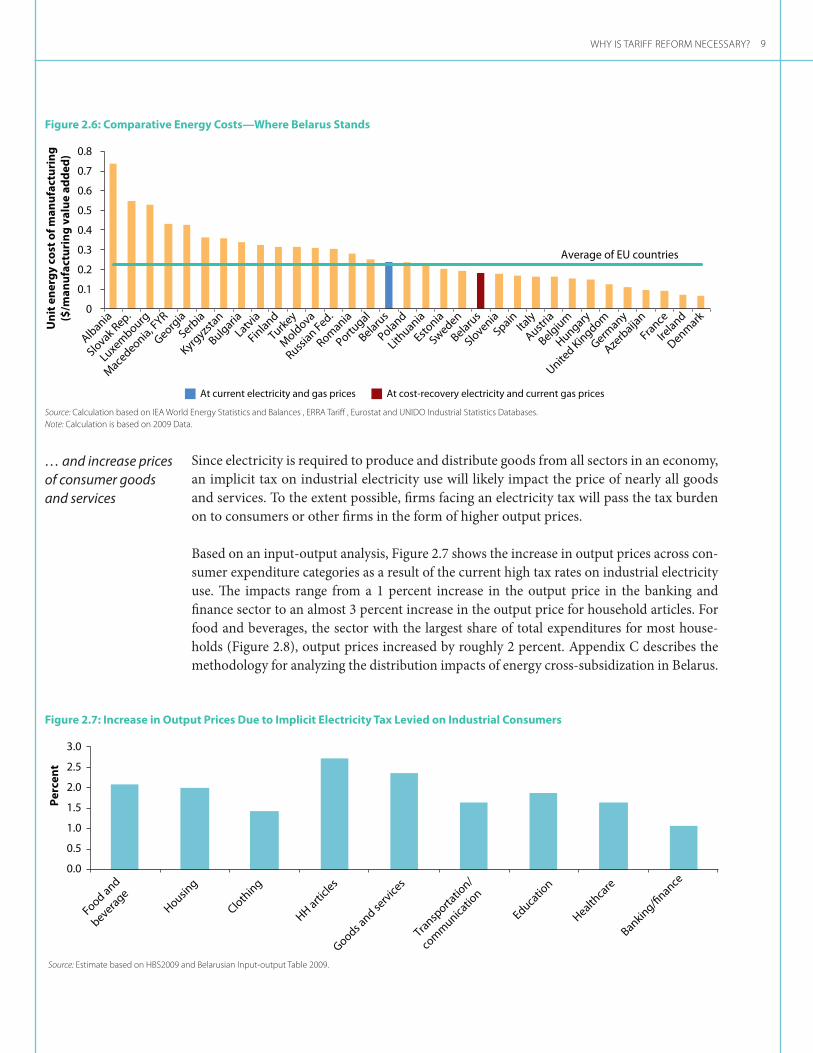
By charging higher tariffs to nonresidential customers, cross-subsidies also impose an implicit tax on industries and could undercut the competitiveness of the economy. If indus-trial electricity tariffs are reduced to cost-recovery levels at about US 9.25 cents/kWh, the energy cost of manufacturing in Belarus could be reduced by roughly 24 percent, making it a lower-cost producer than the EU average. Figure 2.6 compares the unit energy cost per US dollar of industrial value added with and without cross-subsidies with those of its neighboring countries. Appendix B details a sector- by-sector analysis of potential gains if nonresidential electricity prices dropped to cost-recovery levels.
Cross-subsidies undermine the competitiveness of industries…
0
20
40
60
80
100
120
140
160
180
0
2
4
6
8
10
12
14
16
2005 2006 2007 2008 2009 2010 2011 2012 2013 2014
US
cen
ts/k
Wh
Per
cen
t
Industrial electricity tariff, right axis Price/cost of service, left axis 100% cost recovery, left axis
0.00
0.20
0.40
0.60
0.80
1.00
1.20
1.40
1.60
1.80
2.00
2005 2006 2007 2008 2009 2010 2011 2012
Cro
ss- a
nd
dir
ect b
ud
get
ary
sub
sid
ies
(% o
f GD
P)
CS from non-residential electricity sales (Belenergo) CS from non-residential heat sales (ZhKH)
CS from non-heat sales (ZhKH) Direct subsidy from local govt (to ZhKH)
why is tariff reform necessary? 9
Figure 2.6: Comparative Energy Costs—Where Belarus Stands
Source: Calculation based on IEA World Energy Statistics and Balances , ERRA Tariff , Eurostat and UNIDO Industrial Statistics Databases. Note: Calculation is based on 2009 Data.
Albania
Slovak Rep.
Luxembourg
Mace
deonia, FYR
Georgia
Serbia
Kyrgyzs
tan
Bulgaria
Latvia
Finland
Turkey
Mold
ova
Russian Fed.
Romania
Portugal
Belarus
Poland
Lithuania
Estonia
Sweden
Belarus
SloveniaSpain
Italy
Austria
Belgium
Hungary
United Kingdom
Germany
Azerb
aijan
France
Ireland
Denmark
At current electricity and gas prices At cost-recovery electricity and current gas prices
0
0.1
0.2
0.3
0.4
0.5
0.6
0.7
0.8
Un
it e
ner
gy
cost
of m
anu
fact
uri
ng
($/m
anu
fact
uri
ng
val
ue
add
ed)
Average of EU countries
Since electricity is required to produce and distribute goods from all sectors in an economy, an implicit tax on industrial electricity use will likely impact the price of nearly all goods and services. To the extent possible, firms facing an electricity tax will pass the tax burden on to consumers or other firms in the form of higher output prices.
Based on an input-output analysis, Figure 2.7 shows the increase in output prices across con-sumer expenditure categories as a result of the current high tax rates on industrial electricity use. The impacts range from a 1 percent increase in the output price in the banking and finance sector to an almost 3 percent increase in the output price for household articles. For food and beverages, the sector with the largest share of total expenditures for most house-holds (Figure 2.8), output prices increased by roughly 2 percent. Appendix C describes the methodology for analyzing the distribution impacts of energy cross-subsidization in Belarus.
… and increase prices of consumer goods and services
Per
cen
t
0.0
0.5
1.0
1.5
2.0
2.5
3.0
Food and
beverage
Housing
Clothing
HH article
s
Goods and se
rvice
s
Transp
ortatio
n/
com
munica
tion
Educatio
n
Healthca
re
Banking/finance
Figure 2.7: Increase in Output Prices Due to Implicit Electricity Tax Levied on Industrial Consumers
Source: Estimate based on HBS2009 and Belarusian Input-output Table 2009.

Heat tariff reform and Social impact mitigation10
Based on the household consumption patterns shown in Figure 2.8, Figure 2.9 shows how the tax burden is distributed across different income groups. Every income group would see a cost increase on key consumption goods, such as food, clothing, and household articles. The extra expenditure in absolute terms is the highest for households in the top income decile, but the impact appears to be modestly regressive, as the percent of expenditures increased is slightly higher for lower-income households.
Figure 2.8: Expenditure Shares by Consumption Category and Income Decile
0
0.05
0.1
0.15
0.2
0.25
0.3
0.35
0.4
0.45
0.5
Food
Alcohol a
nd tobacc
o
Agricultu
re
Housing
Electrici
ty
Heat and heatin
g fuels
Clothing
HH article
s
Goods and se
rvice
s
Transp
ortatio
n/
com
munica
tion
Educatio
n
Healthca
re
Banking/finance
Decile 1
Decile 2
Decile 3
Decile 4
Decile 5
Decile 6
Decile 7
Decile 8
Decile 9
Decile 10
Source: Estimate based on HBS2009 and Belarusian Input-output Table 2009.
Figure 2.9: Extra Expenditures from Imposing Implicit Tax on Industrial Consumers
Decile 1
Decile 2
Decile 3
Decile 4
Decile 5
Decile 6
Decile 7
Decile 8
Decile 9
Decile 10
1.87
1.88
1.89
1.90
1.91
1.92
1.93
1.94
0
10,000
Perc
ent
20,000
30,000
40,000
50,000
60,000
70,000
80,000
90,000
100,000
Extra expenditures Percent of extra expenditures
Source: Estimate based on HBS2009 and Belarusian Input-output Table 2009.
why is tariff reform necessary? 11
The direct and cross-subsidies have imposed rapidly increasing fiscal and quasi-fiscal costs. As a result of declining cost recovery rates, both ZhKH and Belenergo incurred growing operational losses in the residential DH business. The total fiscal and quasi-fiscal costs, measured by the cumulative operating losses on residential DH services provided by both Belenergo and ZhKH, have risen from about 0.7 percent of GDP in 2005 to about 1.6 per-cent in 2012. Of this, ZhKH accounts for about 40 percent and Belenergo for the remainder. Figure 2.5 shows the cost of heat subsidies as a percentage of GDP.
Underpriced residential utility tariffs also create significant fiscal risks and macroecnomic vulnerabilities. Because Belarus continues to benefit from subsidized import prices for gas (less than half of the economic price imputed from the European gas price), current finan-cial imbalances in the utility sector -while fiscally costly and harmful in terms of energy effi-ciency- have had a limited macroeconomic impact. However, the lack of tariff adjustments and low cost recovery of utility tariffs create significant risks. In case of price hikes for gas imports the existing imbalances would amplify and likely induce fiscal and macroeconomic instability. At current tariff and consumption levels, financial losses in the district heating sector could more than double if Belarus were to import gas at market prices, imposing a significant fiscal and macroeconomic risk.
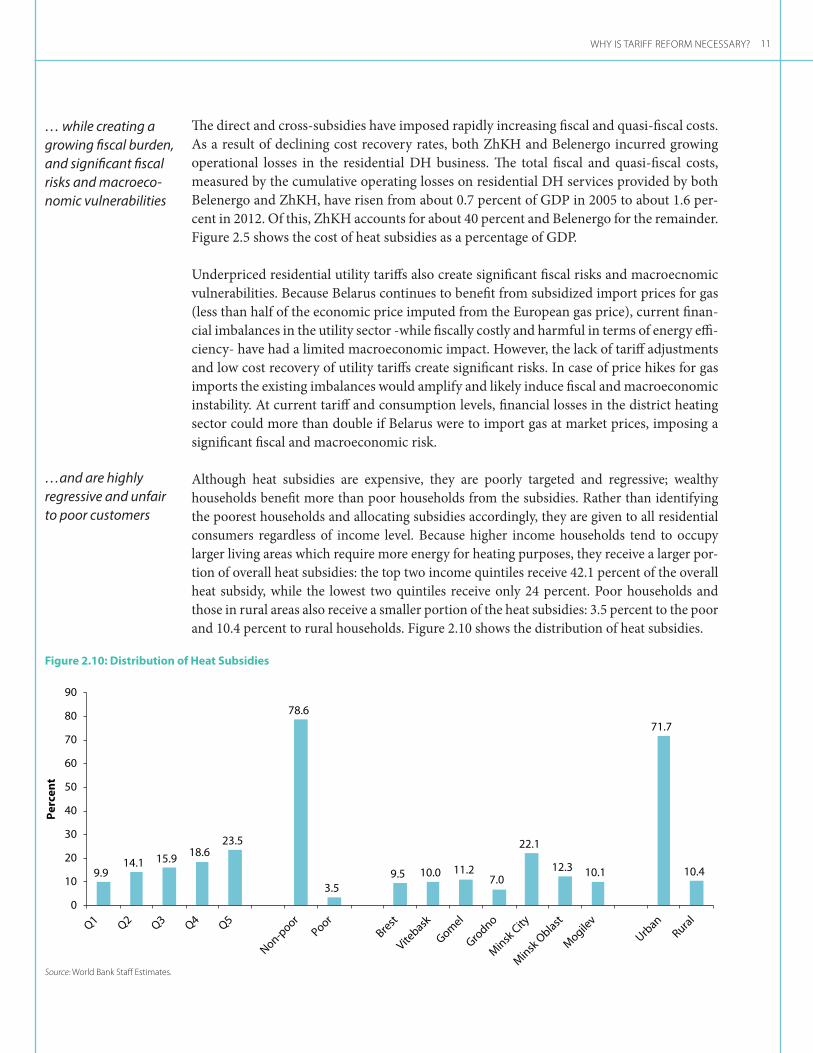
Although heat subsidies are expensive, they are poorly targeted and regressive; wealthy households benefit more than poor households from the subsidies. Rather than identifying the poorest households and allocating subsidies accordingly, they are given to all residential consumers regardless of income level. Because higher income households tend to occupy larger living areas which require more energy for heating purposes, they receive a larger por-tion of overall heat subsidies: the top two income quintiles receive 42.1 percent of the overall heat subsidy, while the lowest two quintiles receive only 24 percent. Poor households and those in rural areas also receive a smaller portion of the heat subsidies: 3.5 percent to the poor and 10.4 percent to rural households. Figure 2.10 shows the distribution of heat subsidies.
… while creating a growing fiscal burden, and significant fiscal risks and macroeco-nomic vulnerabilities
…and are highly regressive and unfair to poor customers
Figure 2.10: Distribution of Heat Subsidies
Per
cen
t
9.9 14.1 15.9 18.6
23.5
78.6
3.5 9.5 10.0 11.2
7.0
22.1
12.3 10.1
71.7
10.4
0
10
20
30
40
50
60
70
80
90
Q1 Q2
Q3 Q4
Q5
Non-poor
Poor
Brest
Vitebask
Gomel
Grodno
Minsk
City
Minsk
Oblast
Mogile
v
Urban
Rural
Source: World Bank Staff Estimates.

13
The impact of tariff reform depends on how it is implemented
The financial burden on households will increase,
…and the poor will suffer the most
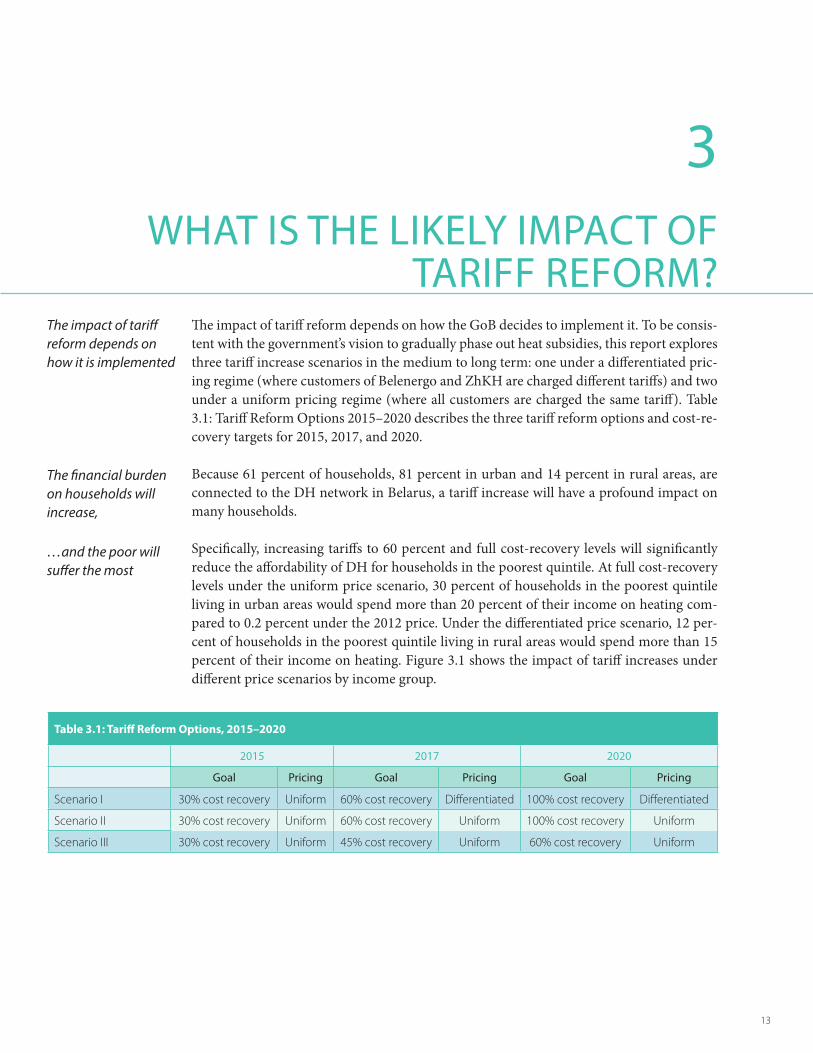
The impact of tariff reform depends on how the GoB decides to implement it. To be consis-tent with the government’s vision to gradually phase out heat subsidies, this report explores three tariff increase scenarios in the medium to long term: one under a differentiated pric-ing regime (where customers of Belenergo and ZhKH are charged different tariffs) and two under a uniform pricing regime (where all customers are charged the same tariff). Table 3.1: Tariff Reform Options 2015–2020 describes the three tariff reform options and cost-re-covery targets for 2015, 2017, and 2020.
Because 61 percent of households, 81 percent in urban and 14 percent in rural areas, are connected to the DH network in Belarus, a tariff increase will have a profound impact on many households.
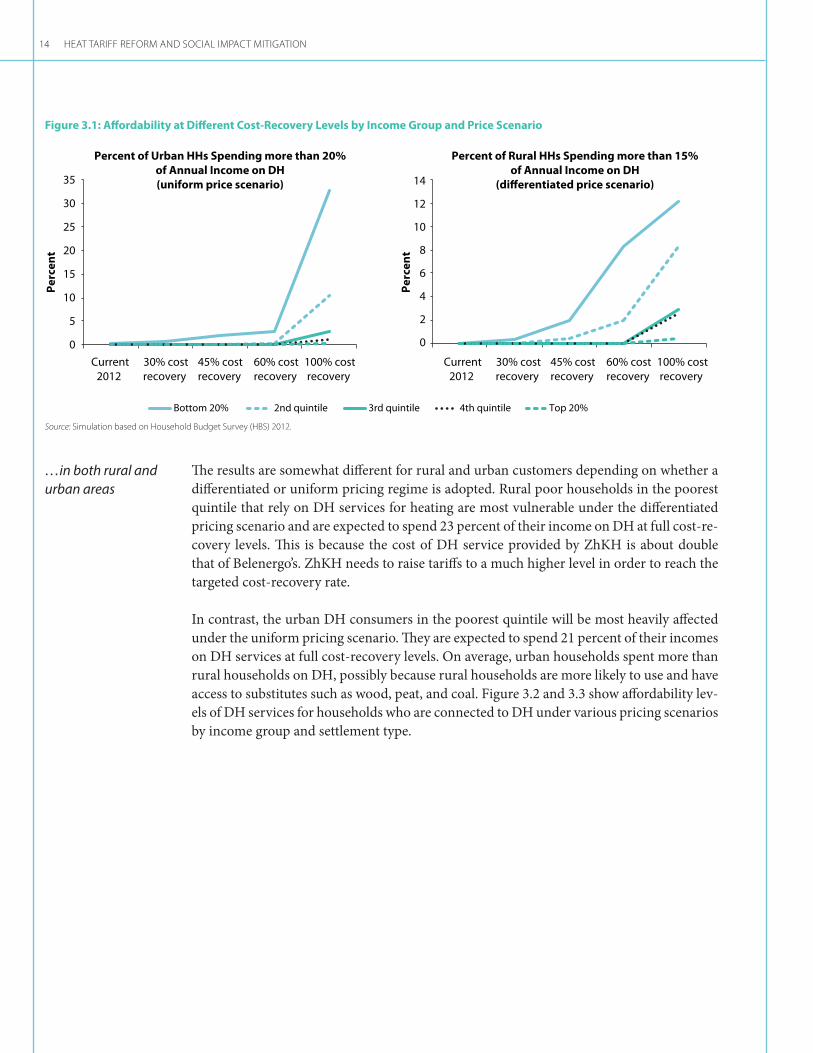
Specifically, increasing tariffs to 60 percent and full cost-recovery levels will significantly reduce the affordability of DH for households in the poorest quintile. At full cost-recovery levels under the uniform price scenario, 30 percent of households in the poorest quintile living in urban areas would spend more than 20 percent of their income on heating com-pared to 0.2 percent under the 2012 price. Under the differentiated price scenario, 12 per-cent of households in the poorest quintile living in rural areas would spend more than 15 percent of their income on heating. Figure 3.1 shows the impact of tariff increases under different price scenarios by income group.
wHat iS tHe likely impact of tariff reform?
3
Table 3.1: Tariff Reform Options, 2015–2020
2015 2017 2020
goal pricing goal pricing goal pricing
Scenario I 30% cost recovery Uniform 60% cost recovery Differentiated 100% cost recovery Differentiated
Scenario II 30% cost recovery Uniform 60% cost recovery Uniform 100% cost recovery Uniform
Scenario III 30% cost recovery Uniform 45% cost recovery Uniform 60% cost recovery Uniform
Heat tariff reform and Social impact mitigation14
Figure 3.1: Affordability at Different Cost-Recovery Levels by Income Group and Price Scenario
Per
cen
t
Per
cen
t
0
5
10
15
20
25
30
35
Current2012
30% costrecovery
45% costrecovery
60% costrecovery
100% costrecovery
Current2012
30% costrecovery
45% costrecovery
60% costrecovery
100% costrecovery
Percent of Urban HHs Spending more than 20%of Annual Income on DH(uniform price scenario)
Percent of Rural HHs Spending more than 15%of Annual Income on DH
(differentiated price scenario)
Bottom 20% 2nd quintile 3rd quintile 4th quintile Top 20%
0
2
4
6
8
10
12
14
Source: Simulation based on Household Budget Survey (HBS) 2012.
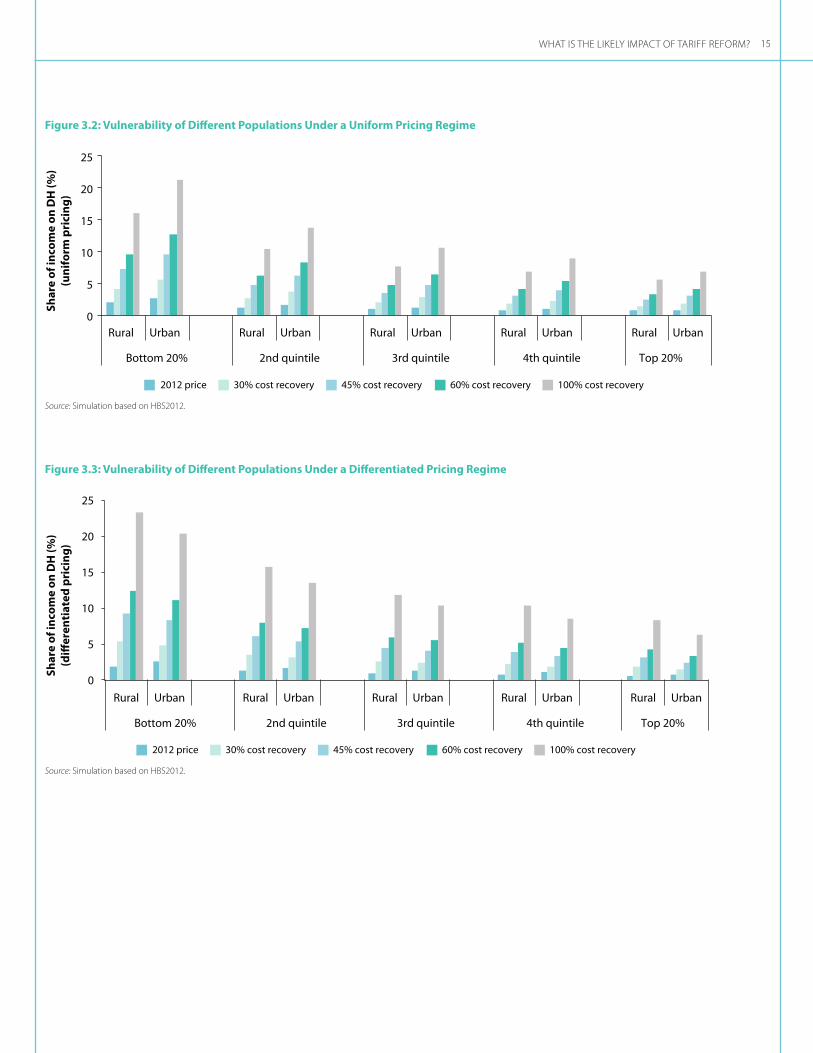
The results are somewhat different for rural and urban customers depending on whether a differentiated or uniform pricing regime is adopted. Rural poor households in the poorest quintile that rely on DH services for heating are most vulnerable under the differentiated pricing scenario and are expected to spend 23 percent of their income on DH at full cost-re-covery levels. This is because the cost of DH service provided by ZhKH is about double that of Belenergo’s. ZhKH needs to raise tariffs to a much higher level in order to reach the targeted cost-recovery rate.
In contrast, the urban DH consumers in the poorest quintile will be most heavily affected under the uniform pricing scenario. They are expected to spend 21 percent of their incomes on DH services at full cost-recovery levels. On average, urban households spent more than rural households on DH, possibly because rural households are more likely to use and have access to substitutes such as wood, peat, and coal. Figure 3.2 and 3.3 show affordability lev-els of DH services for households who are connected to DH under various pricing scenarios by income group and settlement type.
…in both rural and urban areas
What Is the LIkeLy Impact of tarIff reform? 15
Figure 3.2: Vulnerability of Different Populations Under a Uniform Pricing Regime
0
5
10
15
20
25
Rural Urban Rural Urban Rural Urban Rural Urban Rural Urban
Bottom 20% 2nd quintile 3rd quintile 4th quintile Top 20%
Shar
e o
f in
com
e o
n D
H (%
)(u
nif
orm
pri
cin
g)
2012 price 30% cost recovery 45% cost recovery 60% cost recovery 100% cost recovery
Source: Simulation based on HBS2012.
Source: Simulation based on HBS2012.
Figure 3.3: Vulnerability of Different Populations Under a Differentiated Pricing Regime
2012 price 30% cost recovery 45% cost recovery 60% cost recovery 100% cost recovery
0
5
10
15
20
25
Rural Urban Rural Urban Rural Urban Rural Urban Rural Urban
Bottom 20% 2nd quintile 3rd quintile 4th quintile Top 20%
Shar
e o
f in
com
e o
n D
H (%
)(d
iffer
enti
ated
pri
cin
g)

Heat tariff reform and Social impact mitigation16
The impact of higher heating tariffs will be most acutely felt in winter. The heating season in Belarus normally begins in October and ends in April. Accordingly, household expenditure on heat tariffs spikes in the first and last quarter of the year. In 2012, households that were connected to DH spent, on average, 1.5 percent of their monthly income on DH services in the fourth quarter and 4.5 percent in the first quarter. At full cost recovery levels, urban households in the bottom 40 percent income group, under the uniform price scenario, will spend approximately 23 percent of income on DH services in the first quarter; rural house-holds in the bottom 40 percent, under the differentiated price scenario, will spend 21 per-cent. Figure 3.4 shows the impact of tariff reform by price scenario, location, and time of year on households in the lowest two quintiles.
In addition to added heating expenses in winter months, fruits and vegetables are more expensive; and electricity bills also go up due to shorter daylight time. Finally, penalties for delay in paying utility bills are more likely to occur in winter months. All of these have made the financial situation of low-income households most stressful during the winter season.
To cope with a heat tariff increase, poor households are more likely to cut back on con-sumption of food and clothes than on heat. In focus group discussions, 90 percent of the participants from poor households without social benefits, 67 percent of those from poor households with social benefits, and 53 percent of those from middle income households said they would reduce food expenditures to cope with a tariff increase. Figure 3.5 describes various coping strategies indicated by focus group participants in case of an increase. Appendix D details the methodology and scope of focus group discussion. The majority of buildings (92 percent) in Belarus are not equipped with apartment-level meters and heat regulators. Participants in the focus group also complained about their inability to control heating costs. In case of overheating, householders prefer to open windows rather than report to service providers, in order to avoid conflict with neighbors
…during the coldest times of the year,
…and they are forced to cut expenditure on other essential goods.

What Is the LIkeLy Impact of tarIff reform? 17
Figure 3.4: Impacts of Tariff Increases: Highest in Q1 and Q4
Source: Simulation based on HBS2012.Note: The number 1 below each graph refers to the HHs in the bottom 20% income quintile; the number 2 refers to the HHs in the 2nd income quintile; Q1-Q4 refers to quarters 1 – 4.
Source: Focus group discussions February – March, 2014.
2012 price 30% cost recovery 45% cost recovery 60% cost recovery 100% cost recovery
0
10
20
30
40
50
60
1 2 1 2 1 2 1 2
Q1 Q2 Q3 Q4
Ave
rag
e q
uar
terl
y in
com
eo
n D
H (%
)
Uniform Price, Urban Households
0
10
20
30
40
50
60
1 2 1 2 1 2 1 2
Q1 Q2 Q3 Q4 A
vera
ge
qu
arte
rly
inco
me
on
DH
(%)
Differentiated Price, Rural Households
Figure 3.5: Coping Strategies in Response to Tariff Increases
Percent
0
14
16
5
11
23
52
6
16
8
25
18
61
67
23
30
10
37
67
83
90
0 10 20 30 40 50 60 70 80 90 100
Delays and non-payments
Farmland, dacha
Additional job
Borrowing money from friends and relatives
Receiving help (as gift) from relatives and friends
Cutting down expenditures on clothes
Cutting down expenditures on food
Poor with social benefits (n=30) Poor without social benefits (n=51)
Middle-income households (n=44)

Heat tariff reform and Social impact mitigation18
Tariff increases are expected to have a more pronounced impact on women than men as they are typically paid less and have fewer job employment opportunities. Moreover, single parent families are more often headed by women, including single female pensioners, and women with young children often have difficulty finding part-time work. In the first quar-ter of 2012, 62 percent of women were employed compared to 69 percent of men. In 2011, women in Belarus earned 26.3 percent less than men.
In addition, focus group discussion reveals that there are noticeable gender differences in coping strategies. While men report they would work more or change jobs in response to higher utility payments, women are more likely to reduce their expenditures on food or to seek help from relatives and friends. Women are generally more sensitive about potential tariff increases and report strong insecurity about their future well-being in case of tariff increases.
On the positive side, the proposed tariff increase would generate large fiscal savings and utility revenues. It is expected that, with the increase in tariffs to the full cost-recovery level, the total fiscal savings will amount to 1.6 percent of GDP by 2020. Tariff reform under the differentiated pricing scenario will also make Belenergo heat sales profitable, allowing for more investments in new infrastructure and energy efficiency measures. Figure 3.6 shows the fiscal savings from each pricing scenario.
Lowering cross-subsidies would also open fiscal space to allow for reductions in electricity tariffs for nonresidential consumers. If nonresidential electricity prices are decreased to the level of cost of service, the average unit energy cost of manufacturing could decrease by about 24 percent. The wood, textile, food, and paper industries, which have some of the lowest export share in output (Figure 3.7), would benefit the most because they use more energy to
Women are expected to be more vulnerable to tariff increases.
On the other hand, tariff increases will generate fiscal savings and utility revenues
…while lower cross-subsidies will improve industry competitiveness.
Figure 3.6: Fiscal Savings Generated from Uniform and Differentiated Price Scenarios
0.25
0.51
0.98
0.03
0.14
0.24
0.04
0.21
0.37
0.00
0.20
0.40
0.60
0.80
1.00
1.20
1.40
1.60
1.80
2015 2017 2020
Per
cen
t of G
DP
Per
cen
t of G
DP
Scenario 1: 100% Cost Recoveryin 2020,Differentiated Pricing
Fiscal savings LG budget subsidy Fiscal savings CS ZhKH Fiscal savings CS Belenergo
0.25
0.68
1.25
0.03
0.08
0.15
0.04
0.12
0.22
0.00
0.20
0.40
0.60
0.80
1.00
1.20
1.40
1.60
1.80
2015 2017 2020
Per
cen
t of G
DP
Scenario 2: 100% Cost Recoveryin 2020, Uniform Pricing
0.25
0.47
0.68
0.03
0.05
0.08
0.04
0.08
0.12
0.00
0.10
0.20
0.30
0.40
0.50
0.60
0.70
0.80
0.90
1.00
2015 2017 2020
Scenario 3: 60% Cost Recoveryin 2020, Uniform Pricing
Source: World Bank Staff Estimate.

What Is the LIkeLy Impact of tarIff reform? 19
produce one dollar of manufacturing value added and use more electricity (rather than gas) for production than other sectors. The energy cost of manufacturing for the four industries would be reduced by between 25 and 28 percent after the removal of cross-subsidies.
Appendices E and F describe common methodologies used for allocating costs between Heat and Electricity in Combined Heat and Power Plants, and an overview of DH tariff setting methodologies in western European countries, respectively.
Figure 3.7: Shares of Exports of Different Sectors
16 23
29
39 39 46 47
73 75
0
10
20
30
40
50
60
70
80
Paper and pulp
Food and tobacc
o
Iron and st
eel
Wood and w
ood
Textile and le
ather
Transp
ort equip
ment
Mach
inery
Chemica
l and petro
chem
ical
non-meta
llic m
inerals
Shar
e o
f exp
ort
into
tal o
utp
ut (
%)
Source: Belarus Foreign Trade Database, 2009 data.


21
How can the reform best be implemented?
1. Improve communi-cation and consumer engagement by
How can tariff reform BeSt Be implemented?
4
How can the proposed tariff reform be implemented so that it is socially acceptable and fis-cally beneficial and does not impose undue hardship on poor and vulnerable households? We recommend the following three approaches:
1. Enhancing customer communications and engagement 2. Improving social protection mechanisms, and3. Encouraging investments in supply and demand-side energy efficiency
The paragraphs below describe each of the approaches in more detail. The sequence of the reforms is important to its success. Promoting customer understanding and winning trust is a critical first step which can then run in parallel with the medium to long-term efforts to improve social protection mechanisms and encourage investment in energy efficiency.5
Focus group discussion and stakeholder analysis reveal that there is limited support for tar-iff reform among residential consumers because of their lack of knowledge and awareness of tariff setting and reform processes. The lack of information has been identified as one of the most aggravating factors for residential consumers as they often learn about tariff increases only after receiving the bill.
Infrequent and insufficient interaction between DH providers and the customer base has also contributed to consumers’ lack of trust in service providers, which further undermines support for reform. The key to increasing public acceptance of DH tariff increases is devel-oping a comprehensive communication and consumer engagement strategy that fosters a culture of inclusion, along with a public awareness campaign explaining the need for reform.
Focus group discussions reveal that the public is more likely to support a tariff increase if there are corresponding increases in wages and other benefits (such as pensions and social assistance), an upgrade in DH service (utilization of new technologies and modernization of equipment), greater transparency from service providers reflected in clearer bills, and introduction of individual metering and heat controls.
5. Appendix F provides examples of how DH reform has been implemented in neighboring countries.

Heat tariff reform and Social impact mitigation22
Communication strategies should address the public’s concerns by explaining the ratio-nale for a tariff increase, the government’s plans for protecting the poor, and the means by which it will improve the transparency and accountability of the DH sector. Similar efforts in the neighboring former Soviet Union countries present useful examples of a reform strategy in which communication was the key to reform implementation (Appendix G). Communication efforts should also focus on motivating people to save energy and gaining public support for the development and upgrading of the energy system.
Communication activities should involve all key government institutions (at both national and local level) and utilities in a systematic manner and target consumers at the regional, city, district and village level. This would require a national agency to coordinate various ministries and agencies to develop guidelines on the best methods of interacting with dif-ferent consumer groups. Messages from various organizations should be consistent and complementary, rather than contradictory. The national agency could offer such ready-made messages to communicate with the public.
Public information products, such as social advertisements, posters, leaflets, and brochures should be developed at the national level. This is more cost effective than doing it locally and ensures that the public hears a “single voice”. The consumers’ most preferred channels of communication for information on utility services are utility bills, national and local mass-media, tenants meetings, hotlines, information boards, and internet. Appendix H offers recommendations for specific measures to improve public outreach about heat tariff reform.
Residential consumers’ engagement in policy debates and decision-making could also con-tribute to a culture of shared responsibility in the governance process while providing use-ful feedback on the reform. Such measures would make people feel they are owners of the reform and share responsibility for its outcome. Since public sentiment reflects a sense of exclusion from the policy debate, various strategies could be applied to address this issue. For example, people could be invited to comment on the reform process through feed-back mechanisms, such as public surveys and online consultations. Institutional arrange-ments could be made to ensure citizen’s feedback is processed, analyzed, and factored into decision-making.
Communication campaigns and consumer engagement efforts should particularly target women as focus group discussions reveal that women are more involved than men in man-aging utility bills and interacting with service providers regarding the quality of services.
Providing more and better information and feedback mechanisms would also help improve the transparence and accountability of utilities and address consumers’ key concerns. In addition, consumer monitoring mechanisms could be established by introducing perfor-mance benchmarks and key performance indicators, such as fuel efficiency and the cost of production.
The existing social protection mechanisms in Belarus are not well suited to protecting poor and vulnerable groups if tariff reforms are implemented. This is because most of the social
…improving con-sumer engagement and the governance of utility services.
2. Improve social pro-tection mechanisms by
…developing a com-prehensive communi-cation strategy and
How Can tariff reform Best Be implemented? 23
protection benefits are categorical, poorly targeted, and inadequate. Appendix I provides a review of existing social protection programs in Belarus. The only income-tested program is the Public Targeted Social Assistance Program (GASP), which provides short-term (6 months of the year) income support to financially distressed families. It remains tiny: in 2012, its maximum coverage was 2.8 percent of population; its budget was 0.08 percent of GDP. The government has considered reintroducing the Housing and Utility (H&U) Subsidies Program that existed until 2009. The program provides social assistance to house-holds whose housing and utility expenses exceed 15 of their income (in rural areas) and 20 percent (in urban areas). However, the scheme does not account for income disparities and therefore is not sufficient to protect the poor.
There are two ways in which the targeting and coverage of social protection mechanisms could be improved to mitigate the adverse impact of tariff increases on the poorest 20 per-cent of the population:
a. Expanding or topping-up GASP, and/or
b. Refining the H&U program
In addition, introducing levelized payment plans presents another cost-effective strategy to help households manage the seasonality of utility expenses.
The first option to mitigate the impact of tariff reform is to expand or restructure (top-up) the existing poverty-targeted cash transfers program, GASP. To reach the target coverage of the poorest 20 percent, GASP would need to be expanded 10 times, and the income threshold greatly raised to allow more households to qualify for the benefit. As a result, the program budget would considerably increase to reach as much as 1 percent of GDP in 2015 and stay high in the following years. On the other hand, the program would yield a high reduction in poverty: the poverty rate among the poorest 10 percent would drop twofold after the transfer (Table 4.1).
To reduce the program’s cost, GASP may be augmented by a supplemental flat benefit. The supplement would be paid on top of the regular GASP benefit received by those who pass the income threshold. Such a flat benefit could also be offered to other households affected by the tariff increase with incomes above the regular GASP threshold but below a separate threshold established specifically for the top-up.
Given the low coverage of GASP, however, such a supplemental benefit would significantly exceed the “base” benefit program and would look more like a separate program. In addi-tion, the current restrictive eligibility criteria in GASP may impede households in the 2nd decile from getting the top-up benefit, even with a higher income threshold. Therefore, it would be important to combine the supplemental benefit with some expansion of GASP, including reconsidering GASP’s ability to be more inclusive without compromising on the targeting accuracy of the benefits.
…linking mitiga-tion measures to the existing transfer program…

Heat tariff reform and Social impact mitigation24
At lower cost, the GASP top-up option would have a poverty impact comparable to its expansion scenario and would be more efficient. Table 4.2 summarizes the simulation results under a scenario when the regular GASP benefit is expanded to cover the first decile while the supplemental flat energy benefit is provided to the population in the second decile. This way, the entire program ensures the target coverage of the bottom 20 percent population but incurs half the cost (0.5 percent of GDP) of the GASP expansion scenario. It achieves a similar poverty reduction impact with better targeting accuracy.
Several other considerations should be taken into account for GASP adjustment. First, the eligibility rules would need to be revisited to allow quick response and inclusion of more households. Second, according to stakeholder analysis and focus group discussions, the GASP program is associated with the stigma of poverty. The program would need to be rebranded to improve its image. Third, the current 6-month payment period of GASP lim-its the program’s efficiency. The payment period for benefits and/or top-ups should be 12 months for the time of the tariff reform or be specifically linked to the heating season. Fourth, administration of the benefits is fully handled at the local level with local authorities determining the eligibility and paying the benefits from their budget. This means that the budget pressure on poorer regions would be higher as the demand for benefits would be higher there. Furthermore, in their combined roles of checker and payer, the local author-ities could restrict access to the benefits to offset increased spending. To mitigate this risk, the central budget may guarantee additional transfer for the regions in case the demand exceeds available budget resources. Finally, the oversight and control functions should be strengthened to mitigate the risk of system abuse by both providers and beneficiaries.
Table 4.1: Poverty Impact of GASP and H&U Benefits
total population 1st decile 2nd decile
2015 2017 2015 2017 2015 2017
National poverty line
Before transfers 1.8 4.3 18.2 42.4 0 0
Expand GASP 0.9 2.1 8.6 20.6 0 0
Top up GASP 0.8 1.6 8.02 15.91 0 0
Old H&U benefit 1.8 4.1 18.1 41.4 0 0
Refined H&U benefit 1.8 3.9 17.5 38.9 0 0
total population 1st decile 2nd decile
2015 2017 2015 2017 2015 2017
Incidence of households with H&U costs above 15% of total incomes per year
Before transfers 1.1 5.9 5.3 18.9 1.4 7.7
Expand GASP 0.8 4.1 3.1 8.3 0.9 3.8
Top up GASP 0.5 3.5 0.8 2.5 0.6 1.9
Old H&U benefit 1 4.9 4.9 16 1.4 6.1
Refined H&U benefit 0.5 3.5 0.7 1.3 0.5 3.9
Source: Simulation based on HBS 2012.Note: National poverty line in November 2012: BYR 880030 per capita per month. Welfare indicator: total income per capita.

How Can tariff reform Best Be implemented? 25
Table 4.2: Benefit Coverage, Targeting Accuracy and Fiscal Cost of GASP and H&U Benefits
Benefit coverage targeting accuracy Budget per year,
% gdp
2015 2017 2015 2017 2015 2017
Expand GASP (20% of population) 1st decile 52 51 42 41 0.43 0.36
2nd decile 48 52 21 24 0.22 0.22
3rd-10th deciles 12 12 37 35 0.38 0.31
Total 20 20 100 100 1.03 0.89
Expand GASP (10% of population)+ Top up GASP (10% of population) 1st decile 100 100 59 59 0.26 0.25
2nd decile 81 83 20 23 0.09 0.1
3rd-10th deciles 2 2 21 18 0.09 0.08
Total 20 20 100 100 0.44 0.43
Old H&U benefit 1st decile 5 21 48 25 0.002 0.01
2nd decile 1 10 15 12 0.001 0.01
3rd-10th deciles 1 5 37 63 0.002 0.03
Total 1 7 100 100 0.005 0.05
Refined H&U benefit 1st decile 27 61 84 60 0.012 0.04
2nd decile 3 18 12 16 0.002 0.01
3rd-10th deciles 0 3 5 25 0.001 0.02
Total 3 10 100 100 0.014 0.07
Source: Simulation based on HBS 2012.
The H&U subsidy program was phased out in 2009. Some advantages to re-introducing the H&U subsidy include public familiarity with the program and its specificity to energy tar-iffs. Furthermore, if reintroduced, the GoB will be able to learn from past lessons to create a more efficient and streamlined program. However, the design of the program does not differentiate consumption patterns and income levels of households. Therefore an import-ant drawback of this program is that it does not provide any support to a large share of gen-uinely poor households who use alternative fuels for heating or who are too poor to afford to spend 15 or 20 percent of their income on heating. Empirical evidence suggests that this type of programs is also quite regressive, with the majority of the benefits going to middle and upper income households.
To improve the coverage of the poor with H&U benefits, households may be compensated for a share of the heating bill based on their per capita income. Such a refined formula would use an income-test to determine eligibility and to differentiate benefit payments based on income levels. For example:
• Householdsfromthe1stand2nddecileswouldbecompensatedfortheexpenseabove10 and 15 percent of their income, respectively
…re-introducing the H&U subsidy benefit, or

Heat tariff reform and Social impact mitigation26
Table 4.3: Advantages and Disadvantages of GASP and H&U Benefits
advantages disadvantages
Expand GASP • Highpovertyimpact:targetedtothepoorbydesign (means-test)
• Dramaticincreaseinprogramcosts
• Implementationinfrastructureisinplace • Systemadministratorsmaylimitentryandhencebudgetexpenses
• Socialstigmatoacceptassistancefromtheprogram
Top up GASP • LesscostlythanGASPexpansion • GiventheverylowcoverageofGASP,top-upwouldneedto be combined with some expansion of GASP
“Old” H&U benefit
• Relevanttoenergyconsumptionbydesign • Lesstransparent
• Providinglargercoverage • Weaktargetingaccuracyandpossibleleakageto better-off households
• Lowerpovertyimpact
• Cumbersomeadministrationoutsideofsocialprotectionsystem
• Distortingincentivesforenergyefficiency
Redefined H&U benefit
• Strongerpovertyimpacts • Lesstransparent
• Moreaccuratetargeting • Cumbersomeadministrationoutsideofsocialprotectionsystem
• Distortingincentivesforenergyefficiency
• Households from the 2nd and 3rd quintiles would be compensated for the expenseabove 20 percent of their income.
The simulation results presented in Table 4.2 suggest that the refined H&U benefit would cover more households in the lowest deciles as compared to the “old” benefit (84 and 60 percent vs 48 and 25 percent in 2015 and 2017, respectively) and fewer funds would be leaked to better-off households (5 and 25 percent vs 37 and 63 percent of benefits going beyond the bottom quintile in 2015 and 2017, respectively). Spending for the refined ben-efit would be higher in 2015 but still remain at a sustainable level of 0.014 percent of GDP; in 2017 the two programs would require a similar budget.
The refined H&U benefit would significantly reduce the incidence of households with high H&U related costs (H&U expenses above 15 percent of annual income) among those belonging to the bottom decile (from 18.9 to 1.3 percent in 2017). In comparison, the “old” H&U benefit would only reduce the percentage of households in the bottom decile who spent more than 15 percent of annual income on H&U from 18.9 to 16 percent in 2017 (Table 4.1). Table 4.2 compares the old H&U subsidy program to the refined program in terms of benefit coverage, targeting accuracy and fiscal cost for 2015 and 2017.
Although it is more convenient for households to receive the in-kind benefit (no need to collect cash transfers every month), H&U benefits are less transparent than GASP and distort incentives for energy efficiency once household expenditures are above the 15/20 percent threshold. Table 4.3 compares the advantages and disadvantages of the GASP and H&U programs. Appendix J lists social assistance programs implemented in other Eastern Europe and Central Asian countries to buffer the impact of heating tariff reform.
How Can tariff reform Best Be implemented? 27
…adopting levelized payment plans.
The H&U benefits could be further streamlined if administered under the Ministry of Labor and Social Protection rather than the Ministry of H&U. It is not the role of H&U service to determine vulnerability and thus eligibility for social assistance. The Ministry of H&U could help social protection units to calculate/verify H&U costs and to check eligibil-ity and determine the benefit. In fact, relatively simple software may offer a technological solution to checking eligibility and determining the benefit size. That would also reduce the workload for the social workers. Applying for income support in a single unit makes even more sense given the similarity of information/data collected for GASP and H&U benefits. It would also provide a more client-centered approach, allowing clients to apply for any benefit in a single place.
Administration of both GASP and H&U benefits is currently fully handled at the local level with local authorities determining the eligibility and paying the benefits from their budget. This means that the budget of poorer regions would be put under higher pressure because of higher demand for benefits. The literature suggests that centrally financed social protection programs generally work better while locally financed ones typically suffer from low coverage, payment arrears, and poor protection offered in poor localities. For the above discussed mitigation measures to work it is recommended that the financing arrangements be switched from local to central financing, with complementary investments in a stronger oversight and control system.
Customers’ energy bills are the highest in winter months and lowest in summer months. This can be hard for households to manage from a cash-flow perspective. Under a lev-elized payment plan, customers make identical, fixed payments every month, regardless of their actual consumption in any given month. Levelized payment plans help ease the cost of heating during the coldest months and recoup utility revenues during the sum-mer months. A levelized payment plan would average annual energy consumption over a 12-month period, basing monthly charges on past energy usage and estimated future rates. Bills may be adjusted every six months to minimize the difference between actual costs and plan amounts.
Investments in energy efficiency can further reduce consumer bills, and they offer long-term recurrent assistance to energy affordability. Despite recent achievements in energy efficiency improvement in Belarus, there are, nevertheless, more improvements that can be made on both the supply- and demand-sides in the DH sector. It is important to note that many of the measures described below have a cost. A tariff increase will therefore be needed to fund many of the measures. Appendix K provides a more detailed analysis on the barriers and opportunities of energy efficiency investment in Belarus.
The heat losses of both Belenergo and ZhKH have consistently declined; however, the cost of heat supply still varies widely among the oblasts, indicating opportunities for further improvement. For example, in 2012, Gomel oblast had the lowest cost at 55.2 USD/Gcal, which is less than half of that in the Grodono Oblast at 117.3 USD/Gcal. The difference between the lowest and highest cost of heat supply within one oblast is also substantial and ranges from 24 to 51 percent (Figure 4.1).
3. Foster investments in energy efficiency
… to realize large energy savings poten-tial in the DH sector

Heat tariff reform and Social impact mitigation28
On the demand-side, 84 percent of the residential buildings in Belarus were built before 1993 based on Soviet norms (Figure 4.2). The average heat energy consumption of these buildings (for both heating and hot water) is around 230 kWh per m2 per year, almost twice as much as new building stocks developed under new thermal insulation standards and energy-efficient engineering systems (Figure 4.3). Retrofitting and upgrading old building stocks therefore presents potentially large energy savings.
Recommendations to improve the EE incentives on the supply side are as follows:
• ImprovetheincentivesoftheDHcompaniestoincreasetheirproductionefficiency. A pilot project launched by Brest Oblast in January 2014 provides an example of how to improve such incentives. The pilot foresees that all savings (measured by actual results
0
50
100
150
200
250
300
1995
2000
2001
2002
2003
2004
2005
2006
2007
2008
2009
2010 2011
2012
Tota
l ho
usi
ng
sto
cks,
mln
m2
130 kWh/m2
160 kWh/m2
230 kWh/m2
Figure 4.2: Distribution of Housing Stocks by Heat Consumption (2012)
…by improving incen-tives for supply-side EE uptake,
Figure 4.1: Substantial Variation in the Costs of Heat Supply Among Oblasts
0
20
40
60
80
100
120
140
Brest Oblast
Vitebsk Oblast
Gomel Oblast
Grodno Oblast
Minsk Oblast
Mogilev Oblast
Co
st o
f hea
t su
pp
ly, U
SD/G
cal
Average cost Minimum cost Maximum cost
Source: Ministry of Housing and Utilities.

How Can tariff reform Best Be implemented? 29
0
50
100
150
200
250
Before 1993 1993–2009 After 2009 EE buildings
KW
h/m
2-ye
ar
Hot water Heating
Figure 4.3: Heat and Hot Water Consumption by Building Type
Source: Ministry of Housing and Utilities.
as compared with an initial plan) achieved by the company at the end of the year can be kept by the DH companies rather than returned to local government. The savings may be used for additional investments or for financial reward of the personnel who contrib-uted to the improvement in energy efficiency.
• Gradually reduce the subsidies and cross-subsidies related to heat production. Reducing subsidies will, to some extent, motivate the DH companies to reduce costs. Whereas many improvements in energy efficiency require capital expenditure, some can be achieved through low-cost (or no-cost) changes in management.
• Make additional financing available to the DH companies. Such financing could include financing by multilateral development banks, like the World Bank, or by government.
• Publicize and disseminate results achieved by other DH companies in improv-ingenergyefficiency. Disseminating the results of other efforts helps DH companies improve their own performance. Publicizing the results also helps owners and custom-ers understand how their DH service provider compares in performance to others.
Based on the case studies of three representative towns and analysis of technology gaps in western DH systems (Appendix K), the following supply-side EE measures are recom-mended to improve production efficiency. The investments also contribute to improving the efficiency, quality, and sustainability of urban utility network and infrastructure upgrading.
• Replacingold,lowefficiencyboilerswithnewer,moreefficientones. Many DH plants and boilers in Belarus are in need of rehabilitation. Some boilers have been running for more than 30 years and are past their technical life span. As a result, these boilers are running at 50 – 60 percent efficiency levels.
• Converting fromnaturalgasboilers toboilersusing renewable fuels. Heat gener-ated in state-of-the-art wood-fueled boilers is estimated to be about 10 percent more cost effective than traditional natural gas fired boilers at today’s prices. Since natural gas import prices are expected to increase more than the price of wood, the cost efficiency of wood-fueled boilers is likely to improve over time.
… investing in DH infrastructure

Heat tariff reform and Social impact mitigation30
• Morerationalboilersizing. Some boilers in Belarus run at only 30 – 40 percent of their design capacity, especially during the summer months when typically only hot water service is needed. This results in higher fuel use because boilers running at lower capacity factors typically are also less efficient. Such inefficiency could be avoided if more smaller-capacity boilers are installed. Some of these units could therefore be shut down completely during the summer months, leaving a smaller number of units to run at relatively high capacity factors. The units shut-down in summer could be restarted in winter to meet heating demand.
• Replacingsteamwithhotwaterboilers. In some areas, steam boilers are still used, a legacy of times when there was a larger industrial load. These steam boilers are now used primarily to serve residential customers (for example, in Starye Dorogi). Steam boilers are less efficient in serving the needs of residential customers than hot water boilers.
• Replacingnetworks. Replacement of worn-out network parts, where the heat losses and water losses are high, with pre-insulated pipes is one of the most important investment priorities. Payback periods for networks are usually longer than paybacks for other DH investments, but investment in the network is essential to keeping the DH system oper-ating in a sustainable way.
• Reductionofthenetworkdimensionandoptimizationofthenetworkroutes. Due to the reduction in heat loads over (last decades), the routing and dimensions of some network parts need to be changed. As in other transition countries, consumption has dropped as some consumers have left the DH system and energy efficiency measures have been introduced. In such cases the dimension of the DH pipes should be reduced and a more direct route from the heat generation plant to the consumers considered in order reducing heat losses in networks. For instance, in Volkovysk one consumer with a capacity of 0.4 Gcal is connected with the DH through a 1.5 km network (one pipe counting), without any other consumers connected to this network branch.
• Replacingpumps. Replacement of old, low efficiency network pumps, which are often oversized, has a big potential to reduce electricity costs.
The economic rates of return of the above investments depend on site- specific details, such as the efficiency of old boilers and the number of operating hours per year. Table 4.4 describes the economic performance of some of the recommended investment components based on the data of the case study towns.
Table 4.4: Economic Analysis of Supply-Side EE Measures in Case Study Towns
Boiler investmentinvestment
cost
efficiency of old Boilers
efficiency of new boilers
total capacity
annual Heat
production
reduction of
gas Use err npv
investment 000 USd % % mwh gcal 000 m3 % US$ million
Replacement of base load NG boiler
522 85% 94% 9 54 990 569 49% 1
Replacement of peak load NG boiler
522 85% 94% 9 11 526 119 4% 20.17
Replacement of NG boil-ers to woodchip boilers
8 520 n/a 84% 19.5 38 088 5 303 13% 1.49
Source: World Bank Staff estimates.

How Can tariff reform Best Be implemented? 31
Table 4.5: Economic Analysis of Network Renovation in Case Study Towns
networkinvestment
cost length
losses before project
losses after project gas Saving err npv
investment US$ million km % % 000 m3 % US$ million
Replacement of old pipes with PI pipes 0.82 1.77 19 16.3 333 12.60% 0.12
Replacement of old pipes with PI pipes 3 8.5 8.5 5.6 490 0.30% 1.46
Source: World Bank Staff estimates.
Network renovation projects are usually high cost investments with long payback periods. The investment cost per km and achieved savings depends very much on the diameters of the installed network parts. However, replacement of the network is often a technical must in order to keep the whole DH system operational. Table 4.5 shows results of the economic analysis of network renovation programs in the towns studied.
Demand-side EE measures reduce household energy consumption and expenditures, which in turn allow service providers to reduce production and, in the long run, capital invest-ment. Demand-side measures can also save customers money, limiting the impact of tariff increases on monthly bills. Demand-side measures that the GoB can put in place include:
• ChangingfromCTPstoITPs. Replacing CTPs with ITPs can lead to substantial sav-ings. With CTPs, temperature is controlled at the CTP, which provides heat to a group of buildings. The supply of heat to each single building depends on the average demand of the buildings connected to the CTP. With building-level ITPs, temperature is controlled independently in each building, and the heat supplied to the building depends on the actual consumption of each.
• Buildingthermalrenovation. Most buildings in Belarus were constructed according to Soviet norms, and heat losses though the building construction elements are high. The highest potential for energy savings lies in insulating external walls, replacing windows, and insulating roofs.
• Apartment-levelheatmeteringandregulation. Heat is currently metered at the build-ing level, and residents do not have the ability to measure and control heat consumption in their flats. Internal piping in most buildings is vertical, making flat-level heat meter-ing complicated since all customers take heat from the same pipes. It is assumed that, in parallel with increases in heating tariffs, the incentives to have flat-level heat regulation, metering, and billing will increase.
At the current level of the residential heat tariff, however, none of the suggested EE mea-sures would be feasible. As shown in Table 4.6, payback periods of all investment compo-nents are very long, with the payback of the whole investment more than 75 years.
… and putting in place demand-side measures

Heat tariff reform and Social impact mitigation32
Table 4.6: Economic Analysis of Demand-Side EE Measures under Current Tariff
ee measures Unit
Unit cost
(USd)
total investment in a typical Building
(USd)
Simple payback period irr npv
energy Savings potential (gcal)
Windows replacement 185.6
Double pane windows m2 100 62480 70.5 20.106 249253
Triple pane windows m2 150 93720 73.2 20.108 274298
External wall m2 65 157625 106.7 20.133 2130717 214.1
Roof insulation m2 30 31170 105.5 20.132 225821 42.8
Radiator thermostatic valves piece 40 7176 29.1 20.037 24427 35.7
House level heat substation (ITP) piece 15 000 15000 20.3 20.002 27347 30
Total investment 367171 75.4 20.11 2242610 508.2
Source: World Bank staff estimate based on data of an average building in the case study towns.
As shown in Table 4.7, by increasing tariffs to reflect cost, installation of thermostatic valves and ITPs would become most profitable. The NPVs of these investment components are positive, starting from 2017, under all price increase scenarios. Under a full cost recov-ery tariff, the simple payback of these investments is only two to five years. The whole investment package also becomes economically feasible under 100 percent cost-recovery scenarios.

How Can tariff reform Best Be implemented? 33
Table 4.7: Economic Analysis of Demand-Side EE Measures under Different Tariff Increase Scenarios
Scenario 1, Belenergo 2015 2017 2020
ee measures
Simple payback period irr npv
Simple payback period irr npv
Simple payback period irr npv
Windows replacement
Double pane windows 29 23% 238175 20 0% 230742 12 0.06 212921
Triple pane windows 30 24% 258297 21 0% 247171 13 0.06 221819
External wall 43 27% 2112253 31 24% 299416 18 0.01 270163
Roof insulation 43 27% 222128 30 24% 19561 18 0.01 213710
Radiator thermostatic valves 12 6% 21350 8 12% 790 5 0.25 5665
House level heat substation (ITP) 8 12% 1885 6 20% 8303 3 0.4 22930
Total investment 31 24% 2192143 22 21% 2157055 12 0.05 277098
Scenario 1, ZhkH 2015 2017 2020
ee measures
Simple payback period irr npv
Simple payback period irr npv
Simple payback period irr npv
Windows replacement
Double pane windows 29 23% 238175 11 7% 28626 7 17% 23490
Triple pane windows 30 24% 258297 11 7% 215616 7 16% 30774
External wall 43 27% 2112253 17 2% 263006 10 9% 29479
Roof insulation 43 27% 222128 17 2% 212278 10 9% 21573
Radiator thermostatic valves 12 6% 21350 5 28% 6858 3 57% 15779
House level heat substation (ITP) 8 12% 1885 3 46% 26508 2 110% 53272
Total investment 31 24% 2192143 12 6% 257535 7 15% 88772
Scenario 2 2015 2017 2020
ee measures
Simple payback period irr npv
Simple payback period irr npv
Simple payback period irr npv
Windows replacement
Double pane windows 29 23% 238175 14 4% 219549 9 12% 5284
Triple pane windows 30 24% 258297 15 3% 231394 9 11% 4477
External wall 43 27% 2112253 22 21% 281211 13 5% 239821
Roof insulation 43 27% 222128 21 21% 215919 13 5% 27642
(continued on the following page)
Radiator thermostatic valves 12 6% 21350 6 20% 3824 4 39% 10722
House level heat substation (ITP) 8 12% 1885 4 32% 17406 2 68% 38101
Total investment 31 24% 2192143 15 3% 2107295 9 10% 5837

Heat tariff reform and Social impact mitigation34
Scenario 3 2015 2017 2020
ee measures
Simple payback period irr npv
Simple payback period irr npv
Simple payback period irr npv
Windows replacement
Double pane windows 29 23% 238175 19 1% 228862 14 4% 219549
Triple pane windows 30 24% 258297 20 0% 244845 15 3% 231394
External wall 43 27% 2112253 29 24% 296732 22 21% 281211
Roof insulation 43 27% 222128 28 23% 219024 21 21% 215919
Radiator thermostatic valves 12 6% 21350 8 13% 1237 6 20% 3824
House level heat substation (ITP) 8 12% 1885 5 22% 9645 4 32% 17406
Total investment 31 24% 2192143 20 0% 2149719 15 3% 2107295
Source: World Bank staff estimate based on data of an average building in the case study towns.
Table 4.7: Economic Analysis of Demand-Side EE Measures under Different Tariff Increase Scenarios (continued)
If supply- and demand-side EE measures are implemented, households would spend, on aver-age, 41-46 percent less than they currently do for heat energy. Supply-side measures account for about 9 percent while demand-side measures contribute an additional 35 percent of energy savings. Table 4.8 outlines the average annual household expenditures on heat energy and pro-jected savings from the implementation of EE measures under different tariff increase scenarios.
EE investment can reduce household energy costs.
Table 4.8: Average Annual Household Savings after implementation of EE Measures
Before ee measuresafter Supply Side ee
measures
after Supply Side and demand Side
ee measures
2015 2017 2020 2015 2017 2020 2015 2017 2020
Heat consumption of average household Gcal/y 9.2 9.2 9.2 9.2 9.2 9.2 5.9 5.9 5.9
Heating cost of average household
USDScenario 1 (Belen-ergo) 156 220 367 142 200 334 92 130 217
Scenario 1 (ZhkH) 156 403 672 130 336 559 84 218 364
Scenario 2 156 312 519 136 272 453 88 177 294
Scenario 3 156 234 312 136 204 272 88 132 177
Reduction
%Scenario 1 (Belen-ergo) 9% 9% 9% 41% 41% 41%
Scenario 1 (ZhkH) 17% 17% 17% 46% 46% 46%
Scenario 2 13% 13% 13% 43% 43% 43%
Scenario 3 13% 13% 13% 43% 43% 43%
Source: WB staff estimate.Note: assumptions used in the above estimates are: Heat production cost (present):65.4 USD/Gcal (weighted average of Baranovichi, Volkovysk and Starye Dorogi, average size of household: 65 square meters.

How Can tariff reform Best Be implemented? 35
Energy efficiency assistance in the form of preferential loans and grants to low-income households can be an effective policy response to improve energy affordability. One such example is the US Weatherization Assistance Program. The program, which provides low income households with weatherization services, initially targeted heating (insulation and heating systems) but has been broadened over time to include cooling, appliances, and light-ing. Eligibility for the program is mainly based on income levels, using thresholds defined according to the national poverty guidelines. The weatherization services are managed by local agencies and include a visit by an energy auditor, installation of the chosen ener-gy-saving measures, and finally verification of the work by an inspector. A recent cost-ben-efit analysis suggests that for every $1 invested under the program, $1.80 is returned in reduced energy bills and $0.71 is returned to ratepayers, households, and communities through increased local employment, reduced uncollectible utility bills, improved housing quality, and better health and safety.
The expected yearly fiscal savings from tariff increases are approximately US$ 0.41 billion. These fiscal savings can be allocated to fund social protection programs and energy-effi-ciency investments to mitigate the impact of tariff increases on the poorest households. Fiscal savings can also be used to reduce commercial electricity tariffs to improve busi-ness competitiveness. The results in Table 4.9 show that when an effective social assistance package, together with the removal of heat subsidies, is properly designed and sequenced, it is possible for government to achieve positive fiscal gains while protecting the poorest households.
Targeting EE mea-sures to low-income households can buffer the impact of tariff increases in the long term.
Use fiscal surplus to fund social assistance programs and EE investments…
Table 4.9: Reform Packages with Positive Fiscal Savings
year
fiscal Savings (US$ bln) Budget of Social protection (US$ bln)
ee grant (US$ bln)
industry rebate
(US$ bln)
net fiscal Savings
(US$ bln)totallocal
Budgetindustry
cS
2015 0.15 0.02 0.13 refined H&U 0.01 0.12 0.02
2016 0.15 0.02 0.13 refined H&U 0.01 0.12 0.02
2017 0.29 ~0.41 0.04 ~ 0.1 0.25~0.31refined H&U + Expand GASP 0.30 0~0.11
refined H&U + Expand +top up GASP 0.19 0.09 ~0.21
2020 0.42~0.76 0.06~0.18 0.37~0.59 0.37~0.59 0.06~0.18
Source: World Bank staff estimate.Note: Fiscal savings in 2017 and 2020 reflect the range under three tariff increase scenarios.
Heat tariff reform and Social impact mitigation36
The above analysis shows that the burden of higher DH tariffs falls most heavily on low-income groups. However, the negative social impact is manageable if the government improves existing social protection systems and scales up energy efficiency programs. It should be recognized that, while a number of easy-to-achieve opportunities might be avail-able, addressing energy efficiency comprehensively also requires longer term investments and it takes time for the benefits to reach the households. An effective social assistance package should therefore consist of both welfare transfers that offer immediate relief and an energy efficiency program that provides a sustainable long-term solution.
As noted above, the sequence of the reform is critical. The reform program will be most effective if the GoB:
1. Leads with a consumer communication campaign while
2. Putting in place better social protection mechanisms, including grants to demand-side energy efficiency targeting at low-income households, and
3. Taking measures to encourage investments in supply and demand-side energy efficiency.
When mitigation measures are properly coordinated, the heat tariff reform will become more socially acceptable, consumers will benefit from better quality of services, and the government will achieve positive fiscal savings. Figure 4.4 illustrates a proposed timeline for implementing the package of reforms described in this note.
A recommended road-map for heat tariff reform.
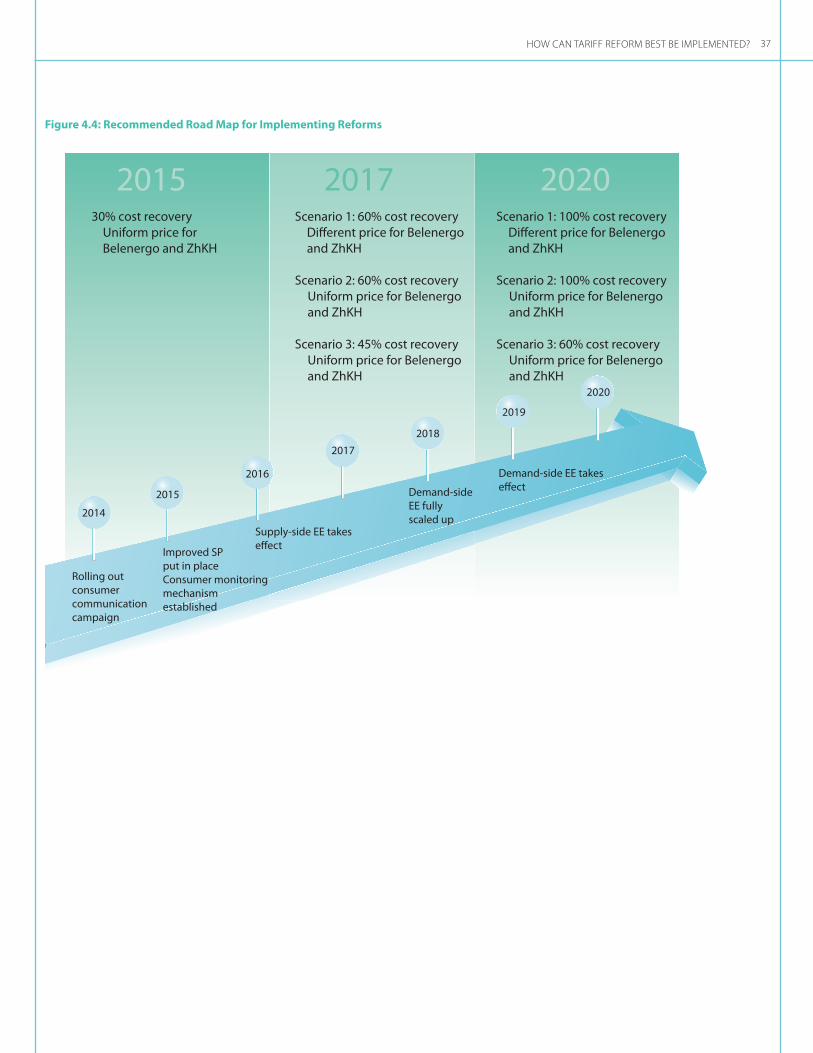
How Can tariff reform Best Be implemented? 37
Figure 4.4: Recommended Road Map for Implementing Reforms
2015 20202017
2014
2015
2016
2017
2018
2019
Supply-side EE takeseffect
Demand-sideEE fullyscaled up
Demand-side EE takeseffect
Improved SPput in placeConsumer monitoringmechanismestablished
30% cost recovery Uniform price for Belenergo and ZhKH
Scenario 1: 60% cost recovery Different price for Belenergo and ZhKH
Scenario 2: 60% cost recovery Uniform price for Belenergo and ZhKH
Scenario 3: 45% cost recovery Uniform price for Belenergo and ZhKH
Scenario 1: 100% cost recovery Different price for Belenergo and ZhKH
Scenario 2: 100% cost recovery Uniform price for Belenergo and ZhKH
Scenario 3: 60% cost recovery Uniform price for Belenergo and ZhKH
2020
Rolling outconsumercommunicationcampaign