3.8: Environmental Impact Mitigation
22
Long-Range Transportation Plan 147 3.8: Environmental Impact Mitigation Transportation moves people and goods from one place to another, but transportation systems also affect community character, the natural and human environment, and economic development patterns. A transportation system can improve the economy, shape development patterns, and influence quality of life and the natural environment. Land use and transportation are symbiotic. Development density, land-use characteristics, and location all influence regional travel patterns, as well as the ability of the public to access opportunities through a range of transportation alternatives, including nonmotorized travel. In turn, the degree of access provided by the transportation system to various land uses will influence current and evolving land-use and development trends. On a more local level, community and site design can facilitate travel by multiple travel modes, including transit and nonmotorized travel. For example, a connected system of streets with higher residential densities and a mix of land uses can allow and encourage travel by foot, bicycle, and public transportation, as well as by automobile. 74 When updating transportation plans, responsible agencies must review long-range transportation plans for validity and consistency with current and forecasted demographic, transportation, and land- use conditions and trends. The plan updates need to be based on the latest available projections and assumptions for a variety of data, including population, land use and development, travel, employment, congestion, and economic activity. It is essential that agencies promote the highest level of consistency between land use, transportation, and other planning activities, using a robust public involvement process that includes public workshops and open houses, draft documents that are readily available for review and comment, specific outreach strategies for key stakeholders and communities, and social media. Activities intended to stimulate economic development can affect the transportation network, and the transportation network can affect economic development opportunities. Transportation decision makers can support economic vitality by appropriately planning for and accommodating the many different demands on the transportation system. 75 Environmental quality is affected by how communities are planned and how populations travel within them. Providing more travel options in more compact, connected communities leads to fewer car trips. In turn, this reduces automobile emissions, lessens the demand for energy resources, and improves air and water quality. Developing land more efficiently and reusing existing properties can preserve rural lands and protect natural resources. The National Environmental Policy Act (NEPA) of 1970 established a national policy to promote the environmental protection in the actions and programs of federal agencies. The Federal Highway Administration (FHWA) and Federal Transit Administration (FTA) act as lead federal agencies and are responsible for implementing the NEPA process and working with state and local project sponsors during transportation project development. FHWA and FTA apply the NEPA process to transportation decision making by assisting transportation officials in making project decisions that balance engineering and transportation needs with social, economic, and environmental factors. This process relies heavily on input from the public, interest groups, resource agencies, and local governments. FHWA and FTA apply the NEPA process as an umbrella for compliance, with more than 40 environmental laws, regulations, and executive orders that provide an integrated approach to addressing impacts that transportation projects produce on the human and natural environment. A coordinated approach between planning and project development can lead to transportation investments that reflect community needs, were developed from an active public involvement process, and are sensitive to the environment. The first stages of the NEPA process—development of project purpose and need—should build upon the transportation needs identified during planning. These needs will inform the final selection of an alternative for design and construction. Another direct link between NEPA and transportation planning is the requirement that a project must be included in the region’s air quality conforming long-range transportation plan and the region’s Transportation Improvement Plan (TIP) before it can advance, because major changes late in the planning process can trigger conformity and other planning reassessments that can lead to delays. 74 Federal Highway Administration (FHWA), The Transportation Planning Process Briefing Book, http://www.fhwa.dot.gov/ planning/publications/briefing_book/part02.cfm#Toc420927587. 75 Ibid. http://www.fhwa.dot.gov/planning/publications/briefing_book/part02.cfm#Toc420927587 Introduction to Environmental, Land Use, and Transportation Intersection
Transcript of 3.8: Environmental Impact Mitigation
Long-Range Transportation Plan
147
3.8: Environmental Impact Mitigation
Transportation moves people and goods from one place to another, but transportation systems also affect community character, the natural and human environment, and economic development patterns. A transportation system can improve the economy, shape development patterns, and influence quality of life and the natural environment.Land use and transportation are symbiotic. Development density, land-use characteristics, and location all influence regional travel patterns, as well as the ability of the public to access opportunities through a range of transportation alternatives, including nonmotorized travel. In turn, the degree of access provided by the transportation system to various land uses will influence current and evolving land-use and development trends. On a more local level, community and site design can facilitate travel by multiple travel modes, including transit and nonmotorized travel. For example, a connected system of streets with higher residential densities and a mix of land uses can allow and encourage travel by foot, bicycle, and public transportation, as well as by automobile.74 When updating transportation plans, responsible agencies must review long-range transportation plans for validity and consistency with current and
forecasted demographic, transportation, and land-use conditions and trends. The plan updates need to be based on the latest available projections and assumptions for a variety of data, including population, land use and development, travel, employment, congestion, and economic activity. It is essential that agencies promote the highest level of consistency between land use, transportation, and other planning activities, using a robust public involvement process that includes public workshops and open houses, draft documents that are readily available for review and comment, specific outreach strategies for key stakeholders and communities, and social media.
Activities intended to stimulate economic development can affect the transportation network, and the transportation network can affect economic development opportunities. Transportation decision makers can support economic vitality by appropriately planning for and accommodating the many different demands on the transportation system.75 Environmental quality is affected by how communities are planned and how populations travel within them. Providing more travel options in more compact, connected communities leads to fewer car trips. In turn, this reduces automobile emissions, lessens the demand for energy resources, and improves air and water quality. Developing land more efficiently and reusing existing properties can preserve rural lands and protect natural resources.The National Environmental Policy Act (NEPA) of 1970 established a national policy to promote the environmental protection in the actions and programs of federal agencies. The Federal Highway Administration (FHWA) and Federal Transit Administration (FTA) act as lead federal agencies and are responsible for implementing the NEPA process and working with state and local project sponsors during transportation project development.
FHWA and FTA apply the NEPA process to transportation decision making by assisting transportation officials in making project decisions that balance engineering and transportation needs with social, economic, and environmental factors. This process relies heavily on input from the public, interest groups, resource agencies, and local governments. FHWA and FTA apply the NEPA process as an umbrella for compliance, with more than 40 environmental laws, regulations, and executive orders that provide an integrated approach to addressing impacts that transportation projects produce on the human and natural environment.A coordinated approach between planning and project development can lead to transportation investments that reflect community needs, were developed from an active public involvement process, and are sensitive to the environment. The first stages of the NEPA process—development of project purpose and need—should build upon the transportation needs identified during planning. These needs will inform the final selection of an alternative for design and construction.Another direct link between NEPA and transportation planning is the requirement that a project must be included in the region’s air quality conforming long-range transportation plan and the region’s Transportation Improvement Plan (TIP) before it can advance, because major changes late in the planning process can trigger conformity and other planning reassessments that can lead to delays.
74 Federal Highway Administration (FHWA), The Transportation Planning Process Briefing Book, http://www.fhwa.dot.gov/planning/publications/briefing_book/part02.cfm#Toc420927587.75 Ibid. http://www.fhwa.dot.gov/planning/publications/briefing_book/part02.cfm#Toc420927587
Introduction to Environmental, Land Use, and Transportation Intersection
Achieving Increased Mobility for Northeast Ohio
148
Climate Change Trends and Impacts
Climate change is a phenomenon that refers to any significant change in the global climate that occurs over an extended period of time. Global warming—the observed increase in average global surface temperatures over the past several decades—is one facet of climate change.76 Over the past century, humans have released large amounts of carbon dioxide (CO2) and other greenhouse gases (GHGs) into the atmosphere. Most of these emissions have come from the combustion of fossil fuels. According to the Intergovernmental Panel on Climate Change (IPCC), humans are the dominant cause behind the changes to the global climate since at least the mid-20th century.77 GHGs act like a form of atmospheric insulation, trapping energy and increasing global temperatures. Though GHGs make up a small fraction of the composition of the atmosphere, they can significantly affect the global climate. As a result, global average surface temperatures have increased by approximately 0.85ºC since 1880.78
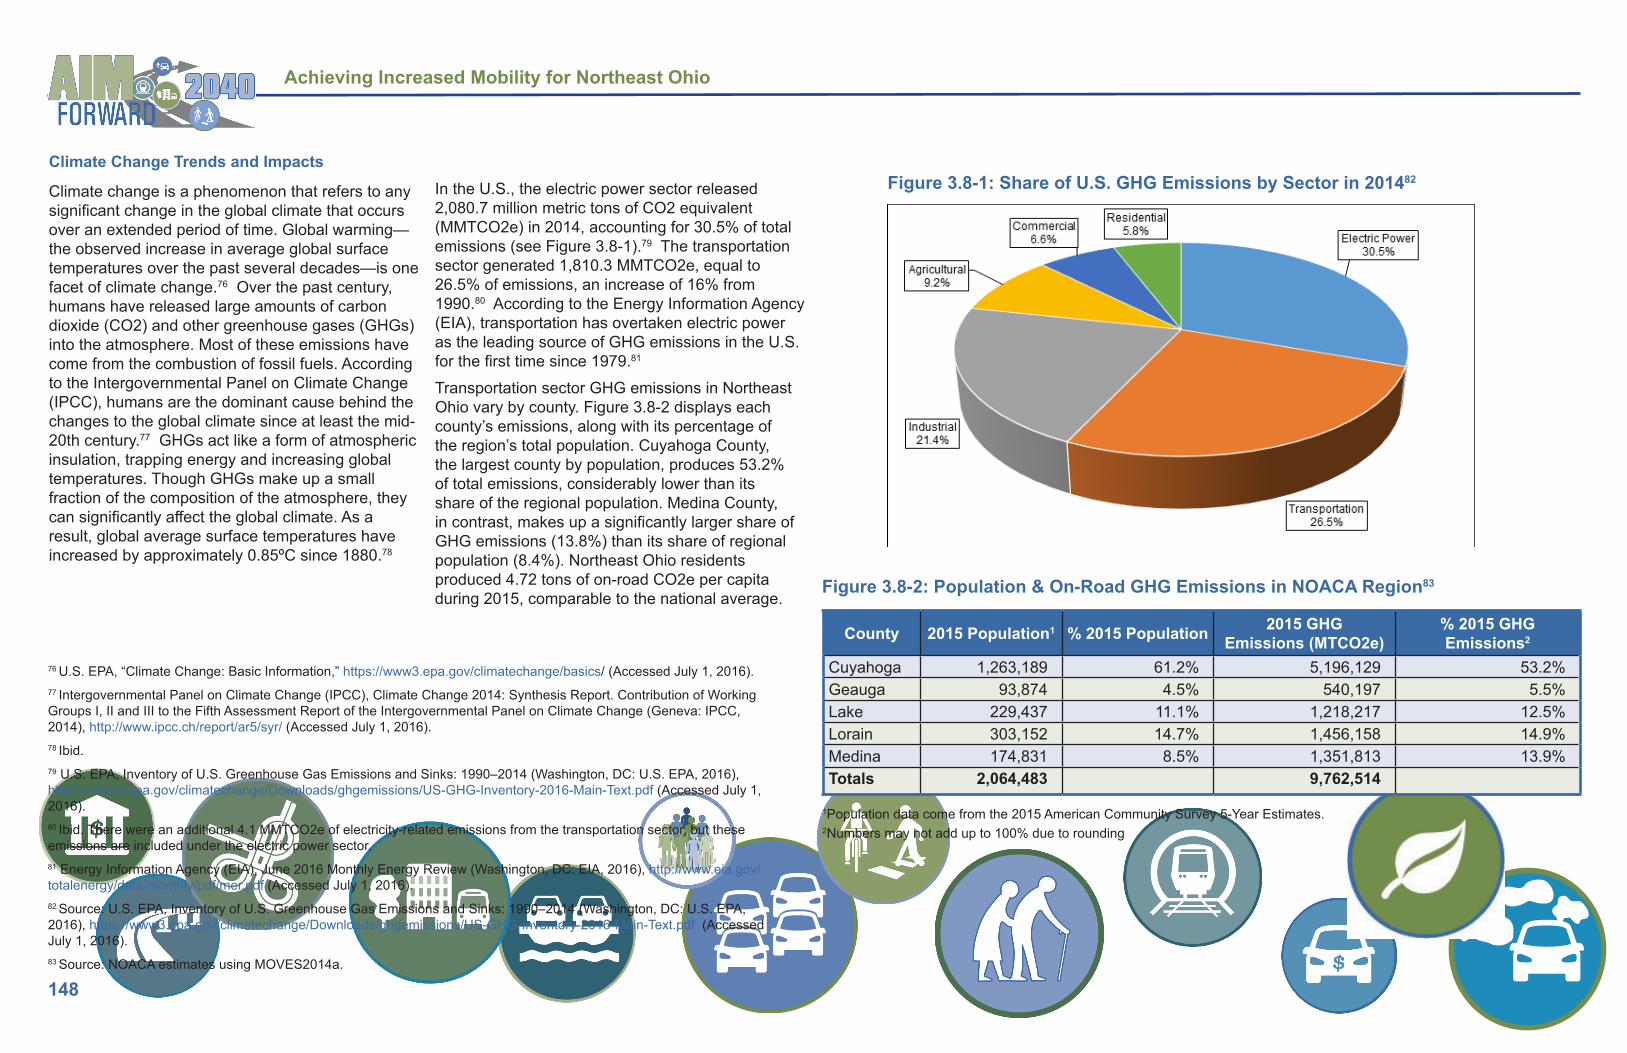
In the U.S., the electric power sector released 2,080.7 million metric tons of CO2 equivalent (MMTCO2e) in 2014, accounting for 30.5% of total emissions (see Figure 3.8-1).79 The transportation sector generated 1,810.3 MMTCO2e, equal to 26.5% of emissions, an increase of 16% from 1990.80 According to the Energy Information Agency (EIA), transportation has overtaken electric power as the leading source of GHG emissions in the U.S. for the first time since 1979.81 Transportation sector GHG emissions in Northeast Ohio vary by county. Figure 3.8-2 displays each county’s emissions, along with its percentage of the region’s total population. Cuyahoga County, the largest county by population, produces 53.2% of total emissions, considerably lower than its share of the regional population. Medina County, in contrast, makes up a significantly larger share of GHG emissions (13.8%) than its share of regional population (8.4%). Northeast Ohio residents produced 4.72 tons of on-road CO2e per capita during 2015, comparable to the national average.
County 2015 Population1 % 2015 Population 2015 GHG Emissions (MTCO2e)
% 2015 GHG Emissions2
Cuyahoga 1,263,189 61.2% 5,196,129 53.2%Geauga 93,874 4.5% 540,197 5.5%Lake 229,437 11.1% 1,218,217 12.5%Lorain 303,152 14.7% 1,456,158 14.9%Medina 174,831 8.5% 1,351,813 13.9%Totals 2,064,483 9,762,514
Figure 3.8-1: Share of U.S. GHG Emissions by Sector in 201482
Figure 3.8-2: Population & On-Road GHG Emissions in NOACA Region83
76 U.S. EPA, “Climate Change: Basic Information,” https://www3.epa.gov/climatechange/basics/ (Accessed July 1, 2016).77 Intergovernmental Panel on Climate Change (IPCC), Climate Change 2014: Synthesis Report. Contribution of Working Groups I, II and III to the Fifth Assessment Report of the Intergovernmental Panel on Climate Change (Geneva: IPCC, 2014), http://www.ipcc.ch/report/ar5/syr/ (Accessed July 1, 2016).78 Ibid.79 U.S. EPA, Inventory of U.S. Greenhouse Gas Emissions and Sinks: 1990–2014 (Washington, DC: U.S. EPA, 2016), https://www3.epa.gov/climatechange/Downloads/ghgemissions/US-GHG-Inventory-2016-Main-Text.pdf (Accessed July 1, 2016).80 Ibid. There were an additional 4.1 MMTCO2e of electricity-related emissions from the transportation sector, but these emissions are included under the electric power sector.81 Energy Information Agency (EIA), June 2016 Monthly Energy Review (Washington, DC: EIA, 2016), http://www.eia.gov/totalenergy/data/monthly/pdf/mer.pdf (Accessed July 1, 2016).82 Source: U.S. EPA, Inventory of U.S. Greenhouse Gas Emissions and Sinks: 1990–2014 (Washington, DC: U.S. EPA, 2016), https://www3.epa.gov/climatechange/Downloads/ghgemissions/US-GHG-Inventory-2016-Main-Text.pdf (Accessed July 1, 2016).83 Source: NOACA estimates using MOVES2014a.
1Population data come from the 2015 American Community Survey 5-Year Estimates.2Numbers may not add up to 100% due to rounding

Long-Range Transportation Plan
149
Improved fuel economy has helped to offset the impact of increased vehicle miles traveled (VMT) upon mobile emissions of GHGs. Model Year (MY) 2015 passenger vehicles emitted 360 grams per mile (g/mi) of CO2, down from 447 g/mi a decade earlier. During this period, average fuel economy also climbed to 24.7 MPG from 19.9 MPG. This trend should continue as vehicles continue to become more efficient overall. The 2011 fuel economy standards for light-duty vehicles (77 FR 62624) are projected to increase average fuel economy to 54.5 MPG and reduce CO2 emissions per mile to 250 grams by 2025, reducing GHG emissions by more than two million metric tons.
the 2015 baseline, before increasing slightly by 2040. This outcome likely stems from the fact that continued increases in VMT offset the marginal effects of fuel economy improvements after 2035.GHG emissions are altering the global climate in a variety of ways, including upsetting established weather patterns. In Northeast Ohio, climate change has contributed to increases in both extreme temperatures and precipitation, trends that are likely to worsen in the coming decades. From 1980 to 2010, Northeast Ohio experienced roughly nine days per year when ambient air temperatures exceeded 90°F.85 This number will increase significantly over the next several decades, as the region’s maximum annual daily temperature is projected to rise 2.8-4.4°F by 2050 and 5.8-9.7°F by 2099.86 Such temperature increases may exacerbate the burden of both heat-related mortality
and air pollution. Northeast Ohio has also witnessed a spike in extreme precipitation over the past few decades. Average annual precipitation in Northeast Ohio is expected to increase two to four inches per year by mid-century, but rainfall is also expected to fall in heavier amounts. The shift toward this trend is already observable, as very heavy precipitation increased 37% in the Midwest from 1958-2012.87 Multiple studies demonstrate that higher temperatures will increase the number of heat-related deaths in Northeast Ohio. According to the Natural Resources Defense Council (NRDC), for instance, number of heat-related deaths may increase from 40 per year to 133 and 486 by 2050 and 2100, respectively.88 Higher temperatures can also make it more likely for ground-level O3 to form. U.S. EPA estimates that climate change may increase daily 8-hour maximum ozone levels by 1-5 ppb in 2030.89
Due largely to these improvements in fuel economy, both for light-duty and heavy-duty vehicles, GHG emissions from on-road transportation in the NOACA region are expected to decline significantly by 2040. While VMT in the five-county area is set to increase 54.6% from 2015 through 2040, GHG emissions are set to fall by 27.5%, as illustrated in Figure 3.8-3. These projected decreases vary by county and over time. While both Geauga and Medina counties are expected to fall rapidly through 2020, Cuyahoga and Lorain counties will both see their emissions increase slightly over this period. Moreover, emissions will reach their lowest point in 2035, when they are expected fall to 29.9% below
Figure 3.8-3: On-Road Greenhouse Gas Emissions in NOACA Region, 2015-204084
Achieving Increased Mobility for Northeast Ohio
150
In addition to its direct impacts on humans, climate change will also affect the transportation system in Northeast Ohio. As the planet warms, stream and lake temperatures will follow suit. Lake temperatures have already increased in each of the Great Lakes since mid-century, due to a combination of higher ambient air temperatures and declining ice cover. From 1973-2010, Great Lakes ice cover fell by 71%, and this trend is expected to continue. In turn, lake surface temperatures are projected to climb 7°F and 12.1°F by 2050 and 2100, respectively. Such changes in the ecology of Lake Erie and other inland lakes will have significant consequences for Northeast Ohio. Lake-effect snowstorms may increase in frequency and severity, at least in the near term, which may affect the flow of commerce and increase the number of traffic collisions.90 Lake levels may also decline as surface evaporation rates pick up, which would force companies that ship cargo on the lake to reduce their tonnage. Each one-inch decline in lake levels reduces the cargo capacity of a 1,000-foot bulk carrier by 270 tons.91
Moreover, climate change may heighten traditional winter- and springtime freeze-thaw cycles, placing additional strain on pavement. The costs of maintaining, repairing, and replacing pavement in the Midwest is projected to increase by $1.5 billion through 2050 and more than $3 billion by 2100 without efforts to curb GHG emissions globally.92 Higher global temperatures may also affect the total number of traffic fatalities. According to a 2015 study, current warming trends would lead to an additional 603 traffic fatalities per year in the United States.93 Air Quality Existing Conditions and TrendsIn 1970, the United States Congress passed its first round of amendments to the existing federal Clean Air Act (CAA), laying out a framework to control air pollution at the federal, state, and local levels. Because transportation accounts for a significant portion of air pollution, the 1977 Clean Air Act Amendments (CAAA) introduced the concept of transportation conformity. Under this provision, a region’s transportation plans, programs, and projects cannot interfere with the region’s air quality goals.94 MPOs like NOACA must demonstrate that their long-range transportation plans (LRTPs) and TIPs conform to these goals through a process known as a conformity determination.95
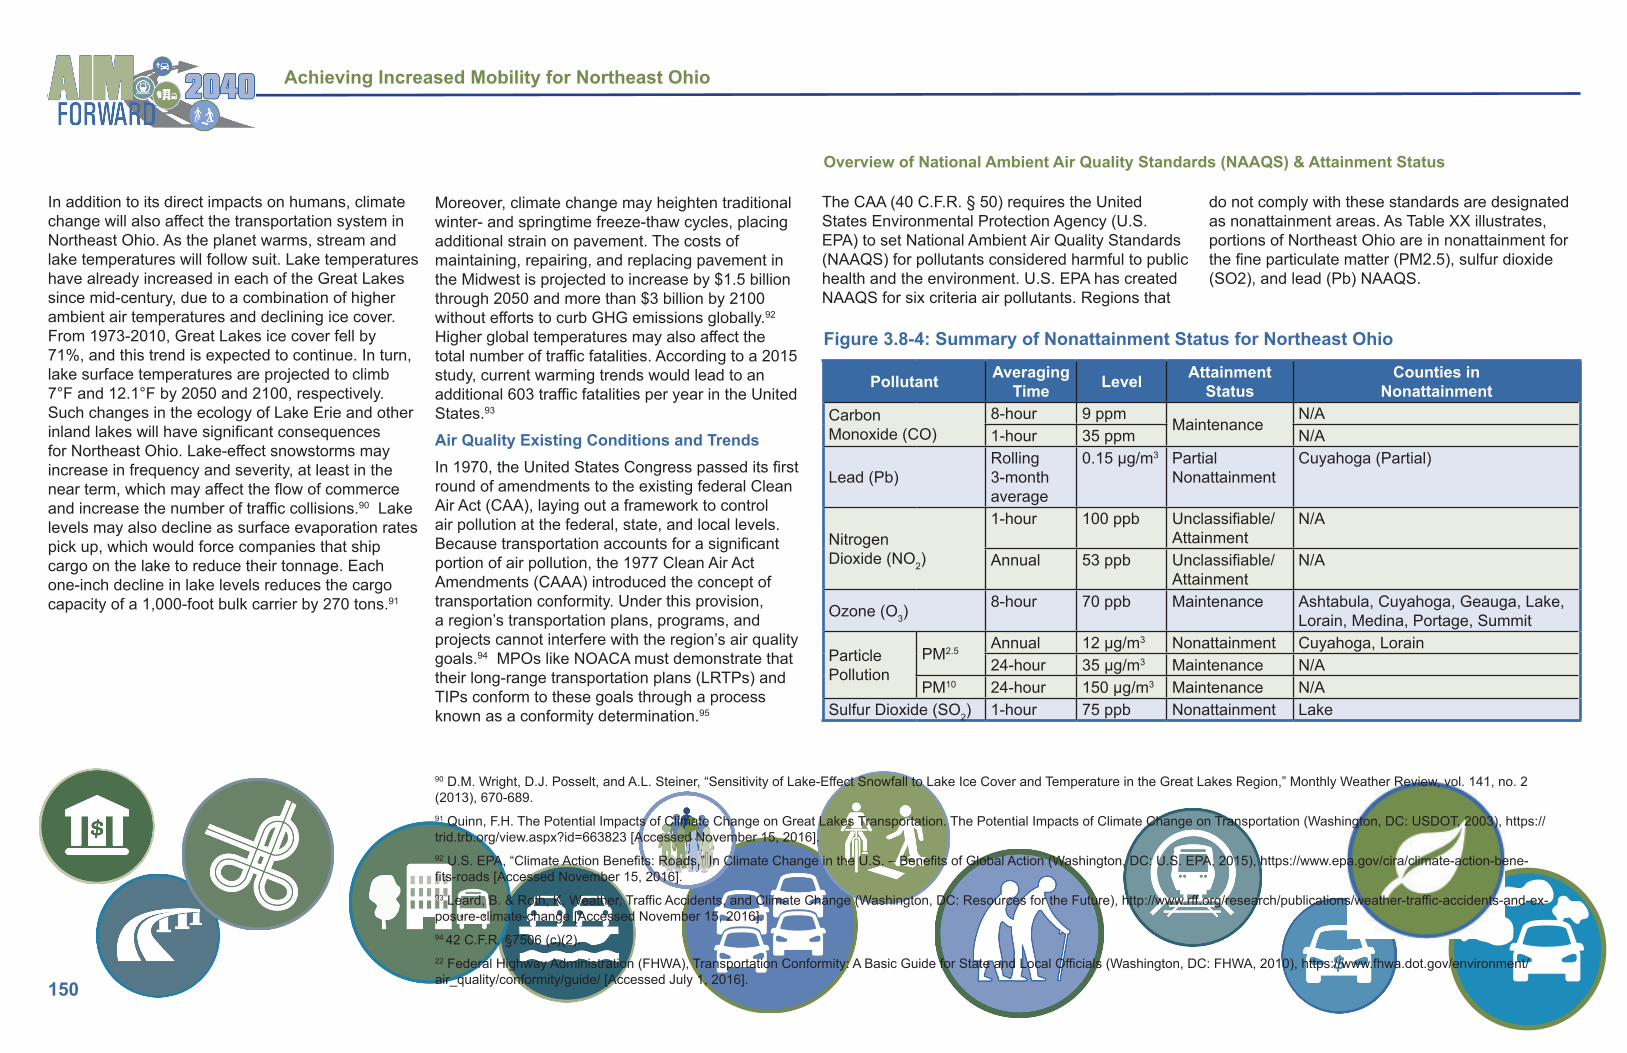
The CAA (40 C.F.R. § 50) requires the United States Environmental Protection Agency (U.S. EPA) to set National Ambient Air Quality Standards (NAAQS) for pollutants considered harmful to public health and the environment. U.S. EPA has created NAAQS for six criteria air pollutants. Regions that
do not comply with these standards are designated as nonattainment areas. As Table XX illustrates, portions of Northeast Ohio are in nonattainment for the fine particulate matter (PM2.5), sulfur dioxide (SO2), and lead (Pb) NAAQS.
Pollutant Averaging Time Level Attainment
StatusCounties in
NonattainmentCarbon Monoxide (CO)
8-hour 9 ppmMaintenance
N/A1-hour 35 ppm N/A
Lead (Pb)Rolling 3-month average
0.15 μg/m3 Partial Nonattainment
Cuyahoga (Partial)
Nitrogen Dioxide (NO2)
1-hour 100 ppb Unclassifiable/ Attainment
N/A
Annual 53 ppb Unclassifiable/ Attainment
N/A
Ozone (O3)8-hour 70 ppb Maintenance Ashtabula, Cuyahoga, Geauga, Lake,
Lorain, Medina, Portage, Summit
Particle Pollution
PM2.5 Annual 12 μg/m3 Nonattainment Cuyahoga, Lorain24-hour 35 μg/m3 Maintenance N/A
PM10 24-hour 150 μg/m3 Maintenance N/ASulfur Dioxide (SO2) 1-hour 75 ppb Nonattainment Lake
Overview of National Ambient Air Quality Standards (NAAQS) & Attainment Status
90 D.M. Wright, D.J. Posselt, and A.L. Steiner, “Sensitivity of Lake-Effect Snowfall to Lake Ice Cover and Temperature in the Great Lakes Region,” Monthly Weather Review, vol. 141, no. 2 (2013), 670-689.91 Quinn, F.H. The Potential Impacts of Climate Change on Great Lakes Transportation. The Potential Impacts of Climate Change on Transportation (Washington, DC: USDOT, 2003), https://trid.trb.org/view.aspx?id=663823 [Accessed November 15, 2016].92 U.S. EPA, “Climate Action Benefits: Roads,” In Climate Change in the U.S. – Benefits of Global Action (Washington, DC: U.S. EPA, 2015), https://www.epa.gov/cira/climate-action-bene-fits-roads [Accessed November 15, 2016].93 Leard, B. & Roth, K. Weather, Traffic Accidents, and Climate Change (Washington, DC: Resources for the Future), http://www.rff.org/research/publications/weather-traffic-accidents-and-ex-posure-climate-change [Accessed November 15, 2016].94 42 C.F.R. §7506 (c)(2).22 Federal Highway Administration (FHWA), Transportation Conformity: A Basic Guide for State and Local Officials (Washington, DC: FHWA, 2010), https://www.fhwa.dot.gov/environment/air_quality/conformity/guide/ [Accessed July 1, 2016].
Figure 3.8-4: Summary of Nonattainment Status for Northeast Ohio
Long-Range Transportation Plan
151
On April 30, 2012, U.S. EPA issued the final area designations under the 2008 O3 NAAQS of 75 ppb (73 FR 16436), and the agency classified Northeast Ohio as a marginal nonattainment area. Because O3 is readily transported throughout a region, U.S. EPA classifies the entire regional airshed as the O3 nonattainment area. U.S. EPA subsequently redesignated the region to maintenance status on January 6, 2017 (82 FR 1603). On October 26, 2015, U.S. EPA strengthened the existing O3 NAAQS from 75 ppb to 70 ppb (80 FR 65291). The agency has indicated that it will likely issue area designations for the 2015 8-hour O3 NAAQS no later than October 1, 2017. This revised standard will likely place Northeast Ohio into nonattainment. On January 15, 2013, U.S. EPA strengthened the annual NAAQS for PM2.5 to 12 μg/m3, and it subsequently designated Cuyahoga and Lorain counties a nonattainment area (80 FR 2206). The counties have until April 15, 2021, to attain the NAAQS. Both O3 and PM2.5 are closely linked to transportation. Accordingly, the NOACA Board of Directors has recommended a number of emissions control measures to the Ohio EPA for attaining the O3 and PM2.5 NAAQS.96 Some of the control measures included in Northeast Ohio’s State
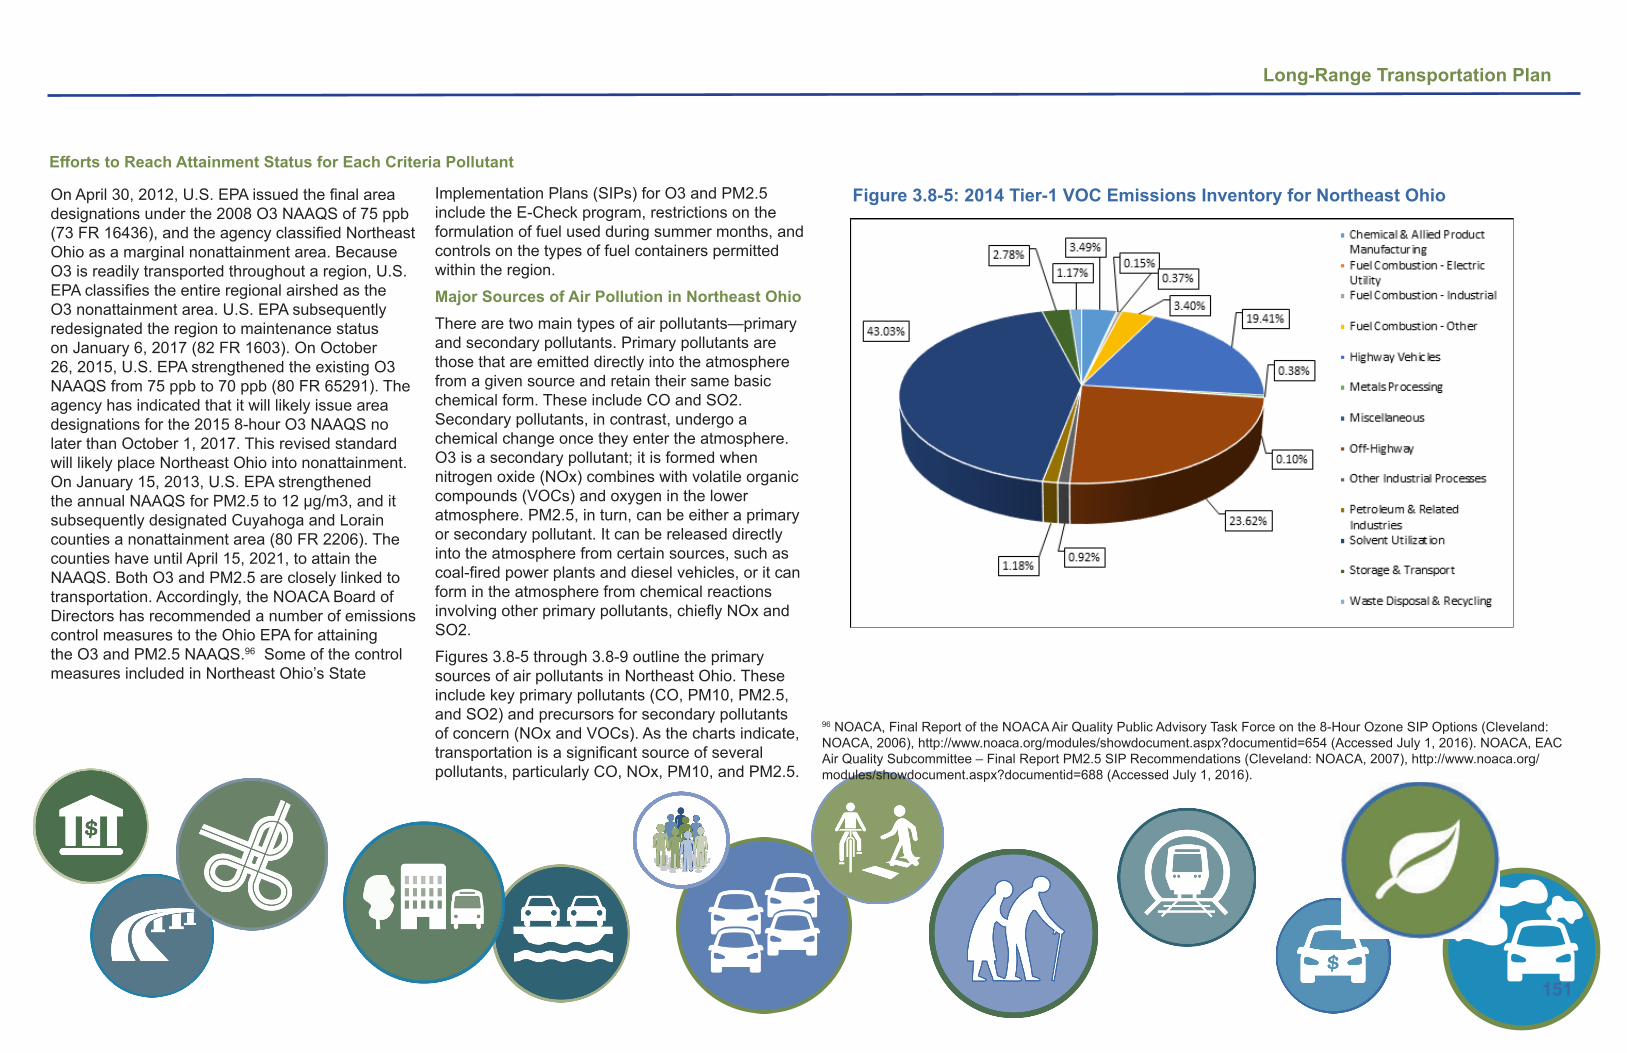
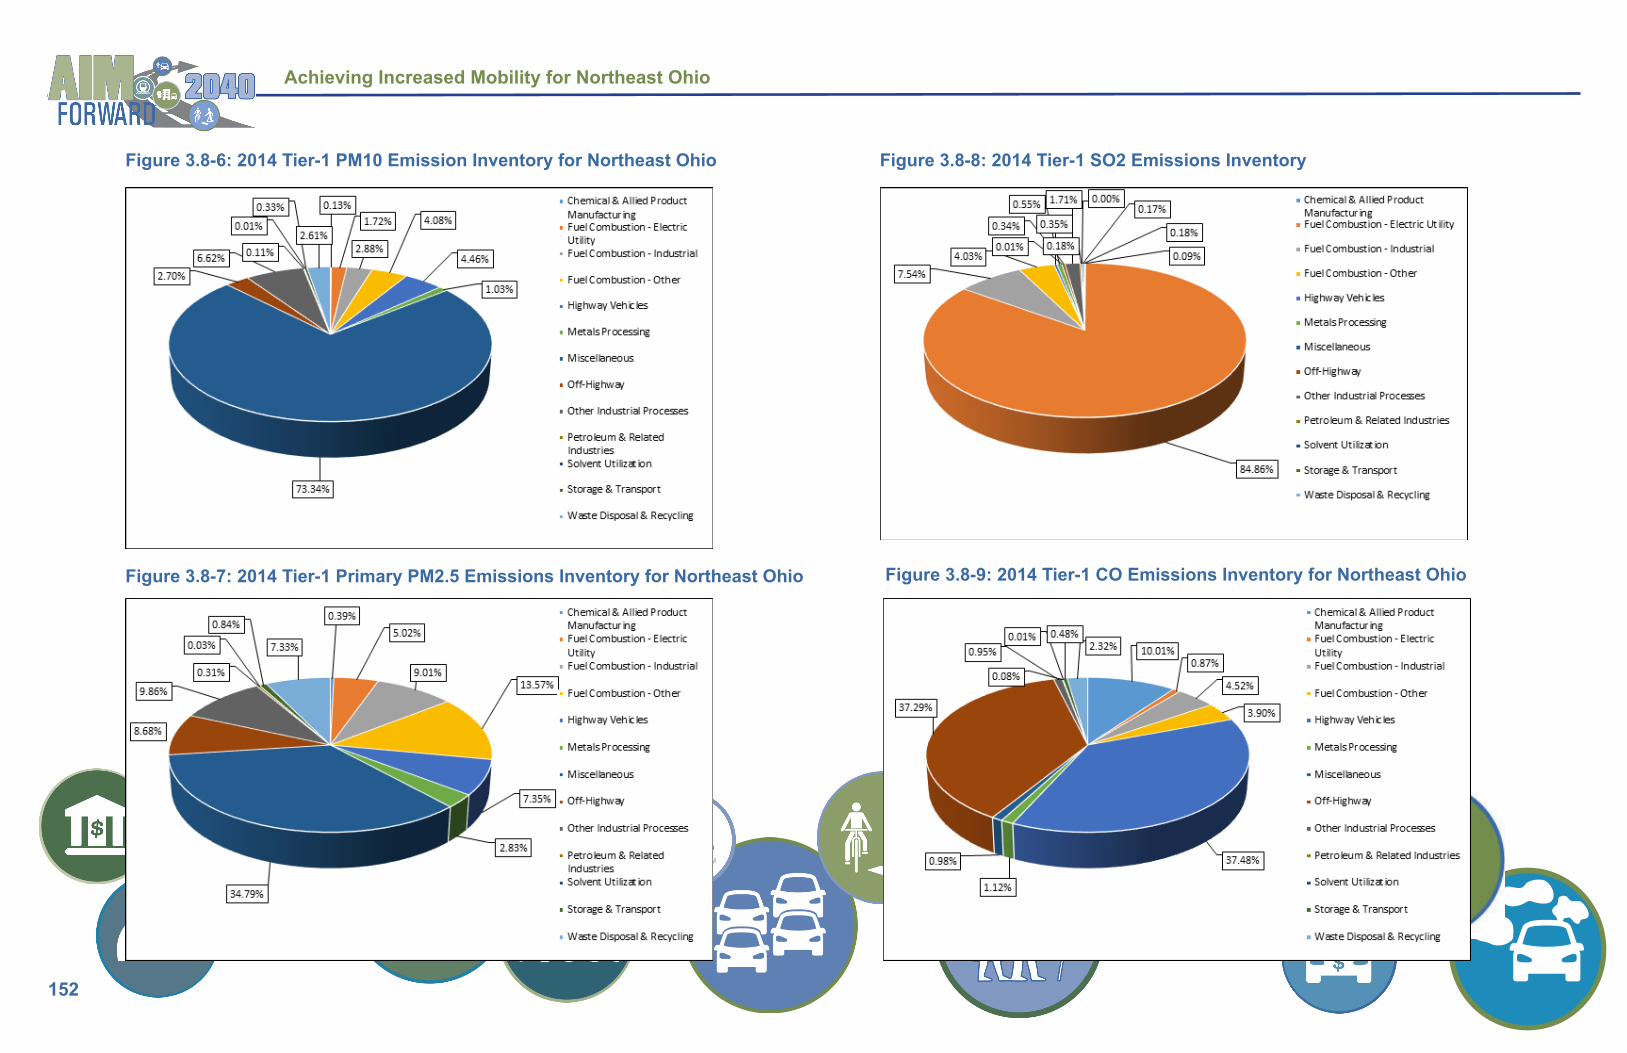
Implementation Plans (SIPs) for O3 and PM2.5 include the E-Check program, restrictions on the formulation of fuel used during summer months, and controls on the types of fuel containers permitted within the region.Major Sources of Air Pollution in Northeast OhioThere are two main types of air pollutants—primary and secondary pollutants. Primary pollutants are those that are emitted directly into the atmosphere from a given source and retain their same basic chemical form. These include CO and SO2. Secondary pollutants, in contrast, undergo a chemical change once they enter the atmosphere. O3 is a secondary pollutant; it is formed when nitrogen oxide (NOx) combines with volatile organic compounds (VOCs) and oxygen in the lower atmosphere. PM2.5, in turn, can be either a primary or secondary pollutant. It can be released directly into the atmosphere from certain sources, such as coal-fired power plants and diesel vehicles, or it can form in the atmosphere from chemical reactions involving other primary pollutants, chiefly NOx and SO2.Figures 3.8-5 through 3.8-9 outline the primary sources of air pollutants in Northeast Ohio. These include key primary pollutants (CO, PM10, PM2.5, and SO2) and precursors for secondary pollutants of concern (NOx and VOCs). As the charts indicate, transportation is a significant source of several pollutants, particularly CO, NOx, PM10, and PM2.5.
Efforts to Reach Attainment Status for Each Criteria Pollutant
Figure 3.8-5: 2014 Tier-1 VOC Emissions Inventory for Northeast Ohio
96 NOACA, Final Report of the NOACA Air Quality Public Advisory Task Force on the 8-Hour Ozone SIP Options (Cleveland: NOACA, 2006), http://www.noaca.org/modules/showdocument.aspx?documentid=654 (Accessed July 1, 2016). NOACA, EAC Air Quality Subcommittee – Final Report PM2.5 SIP Recommendations (Cleveland: NOACA, 2007), http://www.noaca.org/modules/showdocument.aspx?documentid=688 (Accessed July 1, 2016).
Achieving Increased Mobility for Northeast Ohio
152
Figure 3.8-6: 2014 Tier-1 PM10 Emission Inventory for Northeast Ohio Figure 3.8-8: 2014 Tier-1 SO2 Emissions Inventory
Figure 3.8-7: 2014 Tier-1 Primary PM2.5 Emissions Inventory for Northeast Ohio Figure 3.8-9: 2014 Tier-1 CO Emissions Inventory for Northeast Ohio

Long-Range Transportation Plan
153
Air pollution is connected to a host of health issues, including respiratory illnesses, stroke, heart disease, cancer, and premature death.97 According to the World Health Organization (WHO), ambient air pollution is responsible for 3.8 million deaths worldwide each year.98. The U.S. continues to bear a substantial health burden from air pollution. In 2005, air pollution accounted for approximately 200,000 premature deaths per year in the U.S.99 During this same year, O3 and PM2.5 caused an estimated 1,363 premature deaths In the Cleveland metropolitan area.100 Since its passage in 1970, the CAA has significantly enhanced air quality in the U.S. Through 2014, ambient concentrations of the six criteria air pollutants declined by 70% nationwide, even as VMT nearly doubled.101 This decline in pollutant concentrations has also reduced the associated health burden. U.S. EPA estimates that the 1990 CAAA prevented 160,000 premature deaths from 1990-2010.102 Figure 3.8-10 shows the change in concentrations of the criteria air pollutants from 1990-2010 in Northeast Ohio. Air quality has improved dramatically in the region over the past few decades, directly improving public health. One recent analysis found that, since 1970, air quality improvements associated with the CAA have extended the average life expectancy of people in the Cleveland metropolitan area by 2.3 years.103
97 For further information on the public health effects of air pollution, consult the U.S. EPA’s Integrated Science Assessments on the criteria air pollutants: https://www.epa.gov/isa [Accessed July 1, 2016].98 WHO, Preventing disease through healthy environments: a global assessment of the burden of disease from environmental risks (Geneva: WHO, 2016), http://apps.who.int/iris/bitstream/10665/204585/1/9789241565196_eng.pdf?ua=1 [Accessed July 1, 2016].99 Caiazzo, F., Ashok, A., Waitz, I.A., Yim, S.H., & Barrett, S.R. (2013). Air pollution and early deaths in the United States. Part I: the impact of major sectors in 2005. Atmospheric Environment, 79, 198-208. Fann, N., Lamson, A.D., Anenberg, S.C., Wesson, K., Risley, D., & Hubbell, B.J. (2012). Estimating the National Public Health Burden Associated with Exposure to Ambient PM2.5 and Ozone. Risk Analysis, 32 (1), 81-95.100 Caiazzo, et al., 204.101 U.S. EPA, Our Nation’s Air: Status and Trends Through 2015 (Washington, DC: U.S. EPA, 2016), https://gispub.epa.gov/air/trendsreport/2016/ [Accessed July 1, 2016].102 U.S. EPA, Benefits and Costs of the Clean Air Act 1990-2020, the Second Prospective Study (Washington, DC: U.S. EPA, 2011), https://www.epa.gov/clean-air-act-overview/benefits-and-costs-clean-air-act-1990-2020-second-prospective-study [Accessed July 1, 2016].103 Greenstone, M., “The Connection Between Cleaner Air and Longer Lives,” The New York Times, http://www.nytimes.com/2015/09/25/upshot/the-connection-between-cleaner-air-and-longer-lives.html?_r=1 [Accessed July 1, 2016].
Air Quality Trends in Northeast Ohio
Pollutant Type Percent Change 1990-2010 Percent Change 2000-2010Carbon Monoxide (CO) -62% -49%
Ozone (O3) (8-hour) -13% -5%
Nitrogen Dioxide (NO2) (1-hour)2 -33% -5%
PM10 (24-hour) -30% -24%
PM2.5 (annual) n/a3 -29%Sulfur Dioxide (SO2) (1-hour)2 -72% -53%
Figure 3.8-10: Change in Concentrations of Criteria Air Pollutants in Northeast Ohio, 1990-2010
Source: U.S. EPA, “Air Trends,” www.epa.gov/airtrends [Accessed July 1, 2016].

Achieving Increased Mobility for Northeast Ohio
154
U.S. EPA reports daily air quality through its Air Quality Index (AQI), which. The AQI details how clean or polluted the air is, expressing it in a score from 0 to 500. AQI values ranging from 0 to 50 are considered “Good”; values from 51 to 100 are considered “Moderate”; and values above 101 are considered “Unhealthy,” at least for sensitive population groups. Figure 3.8-11 illustrates the
long-term decline in the number of days on which air quality is considered unhealthy and a noticeable increase in the number of good air quality days. Additional emissions control measures, such as the Tier 3 Motor Vehicle Emissions and Fuel Standards (79 FR 23414), will further improve air quality and public health in Northeast Ohio over the next two decades.
Figure 3.8-11: Number of Ozone Exceedance Days in Northeast Ohio, 1995-2015
According to U.S. EPA, mobile sources account for 65% and 59% of CO and NOx, respectively, nationwide.104 Emissions from vehicles, also known as traffic-related air pollution (TRAP), are extremely harmful to humans. Accordingly, transportation choice directly affects mobile emissions and public health. This connection is particularly salient in the NOACA region, where 82.5% of commuters drive alone to work, far higher than the national average (76.4%).105
Connection between Transportation Choice, Mobile Emissions and Public Health
104 U.S. EPA, Our Nation’s Air.105 U.S. Census Bureau, 2010-2014 American Community Survey 5-Year Estimates.106 Grabow, M. L., Spak, S. N., HJolloway, T., Stone, Jr., B. Mednick, A. C., and Patz, J. A. (2012). Air Quality and Exercise-Related Health Benefits from Reduced Car Travel in the Midwestern United States. Environmental Health Perspectives 120 (1), 68-76.
Promoting alternatives to single-occupancy vehicles (SOVs) can improve air quality and benefit public health. A 2012 study, for instance, found that promoting bicycling for trips under 2.5 miles in Northeast Ohio would reduce PM2.5 levels, prevent 42 premature deaths each year, and generate more than $300 million in total benefits.106 By making investments to enhance transportation choice for Northeast Ohio residents, NOACA continues to improve air quality and enhance overall quality of life, consistent with federal requirements.
Long-Range Transportation Plan
155
In 1972, the United States Congress amended the Federal Water Pollution Control Act of 1948, which was the first major federal law to address water pollution. As amended in 1972, the law became commonly known as the Clean Water Act (CWA).107 The 1972 amendments established the basic structure for regulating pollutant discharges into the water of the United States. The amendments also gave the EPA the authority to implement pollution control programs such as setting wastewater standards for industries. The CWA amendments also required EPA to set and maintain water quality standards for all contaminants in surface waters. The CWA amendments made it unlawful for any person to discharge any pollutant from a point source into navigable waters, unless a permit was obtained under its provisions. The CWA, as amended, provided funding for the construction of sewage treatment plants under its construction grants program. Finally, the amendments recognized the need for planning to address critical water quality problems associated with nonpoint source pollution.
The CWA was subsequently amended and modified some of the earlier CWA provisions. Revisions in 1981 streamlined the municipal construction grants process, improving the capabilities of treatment plants built under the program. Changes in 1987 phased out the construction grants program, replacing it with the State Water Pollution Control Revolving Fund, more commonly known as the Clean Water State Revolving Fund; a new funding strategy addressed water quality needs by building on EPA-state partnerships. Over the years, many other laws have changed parts of the Clean Water Act. Title I of the Great Lakes Critical Programs Act of 1990, for example, put into place parts of the Great Lakes Water Quality Agreement of 1978, signed by the U.S. and Canada, where the two nations agreed to reduce certain toxic pollutants in the Great Lakes. That law required EPA to establish water quality criteria for the Great Lakes addressing 29 toxic pollutants with maximum levels that are safe for humans, wildlife, and aquatic life and to help the states implement the criteria on specific schedules.108
Overview of Water Quality Standards & Requirements The federal Water Quality Standards Regulations establish the requirements for states and tribes to review, revise, and adopt water quality standards.109 They also establish the procedures for EPA to review, approve, disapprove, and promulgate water quality standards pursuant to section 303 (c) of the Clean Water Act.
State Authority110 States are responsible for reviewing, establishing, and revising water quality standards. As recognized by section 510 of the Clean Water Act, states may develop water quality standards more stringent than required by this regulation. Consistent with section 101(g) and 518(a) of the Clean Water Act, water quality standards shall not be construed to supersede or abrogate rights to quantities of water. Ohio Water Quality StandardsWater quality in Ohio is constantly threatened by many different sources and types of pollution. Under the Clean Water Act, every state must adopt water quality standards to protect, maintain, and improve the quality of the nation's surface waters. These standards represent a level of water quality that will support the goal of "swimmable/fishable" waters. Water quality standards are ambient standards
as opposed to discharge-type standards. These ambient standards, through a process of back calculation procedures known as total maximum daily loads or wasteload allocations, form the basis of water quality based permit limitations that regulate the discharge of pollutants into surface waters under the National Pollutant Discharge Elimination System (NPDES) permit program. Ohio's water quality standards, set forth in Chapter 3745-1 of the Ohio Administrative Code (OAC), include four major components: 1) beneficial use designations, 2) narrative "free froms" (which identify conditions all surface waters are to be free from), 3) numeric criteria, and 4) antidegradation provisions. Beneficial use designations describe existing or potential uses of water bodies.111 They take into consideration the use and value of water for public water supplies; protection and propagation of aquatic life; recreation in and on the water; and agricultural, industrial, and other purposes. Ohio EPA assigns beneficial use designations to water bodies in the state. There may be more than one use designation assigned to a water body. Examples of beneficial use designations include public water supply, primary contact recreation, and aquatic life uses (warmwater habitat, exceptional warmwater habitat, etc.).
Water Quality Existing Conditions and Trends
107 33 U.S.C. §1251 et seq. (1972)108https://www.epa.gov/laws-regulations/history-clean-water-act 109 40 CFR 131110 40 CFR 131§131.4111 Ohio Administrative Code Rules 3745-1-08 to 3745-1-32

Achieving Increased Mobility for Northeast Ohio
156
Narrative "free froms" are general water quality criteria that apply to all surface waters.112 These criteria state that all waters shall be free from sludge; floating debris; oil and scum; color- and odor-producing materials; substances that are harmful to human, animal, or aquatic life; and nutrients in concentrations that may cause algal blooms.Numeric criteria are estimations of concentrations of chemicals and degree of aquatic life toxicity allowable in a water body without adversely impacting its beneficial uses. Although numeric criteria are applied to water bodies, they primarily are used to regulate dischargers through NPDES permits. Numeric criteria consist of chemical criteria, whole effluent toxicity levels, and biological criteria.113 Ohio EPA’s antidegradation provisions describe the conditions under which water quality may be lowered in surface waters. Existing beneficial uses must be maintained and protected. Further, water quality better than that needed to protect existing beneficial uses must be maintained unless lower quality is deemed necessary to allow important economic or social development (existing beneficial uses must still be protected).114 Additionally, Ohio EPA’s The Total Maximum Daily Load (TMDL) program, established under Section 303(d) of the Clean Water Act, focuses on identifying and restoring polluted rivers, streams, lakes, and other surface bodies of water. TMDLs are prepared for waters identified as impaired on the 303(d) list in the biennial Integrated Water Quality Monitoring and Assessment Report (also called the Integrated Report).115
A TMDL is a written, quantitative assessment of water quality problems in a body of water and contributing sources of pollution. It specifies the amount a pollutant needs to be reduced to meet water quality standards (WQS), allocates pollutant load reductions, and provides the basis for taking actions needed to restore a body of water. Information about TMDLs and water quality monitoring are organized by large watersheds. The TMDL status of Ohio watersheds is shown in Figure 3.8-12. http://wwwapp.epa.ohio.gov/dsw/gis/tmdl/TMDL_status_June2011.pdfOhio EPA’s 2016 Integrated Report SummaryThe Integrated Report indicates the general condition of Ohio's waters and identifies waters that do not meet water quality goals. The report satisfies the Clean Water Act requirements for both Section 305(b) for biennial reports on the condition of the state's waters and Section 303(d) for a prioritized list of impaired waters.
Human Health Use (Fish Tissue)Fish tissue data have been assessed in nearly every major (eight-digit) hydrologic unit in Ohio. About one-third of monitored watershed assessment units and more than half of monitored lakes were unimpaired for human health use. PCB contamination, primarily a result of historic industrial
sources and old landfill discharges, is the cause of most of the human health use impairments. Mercury is the second leading cause of human health use impairments after PCBs.Recreational UseFor Lake Erie public beaches, the frequency of swimming advisories varies widely, ranging from 0% at Kelley’s Island State Park beach to more than 40% at Edson, Euclid, Lakeshore, Lakeview, and Villa Angela beaches. Generally, beaches located near population centers tend to have the most problems.
For inland streams, bacteria levels were low in about one in 10 watersheds. About three in 10 watersheds had high levels of bacteria. The remaining six in 10 did not have enough data for evaluation. Ohio’s 23 large rivers fare somewhat better, with about 20% having relatively low bacteria levels and 20% showing higher levels of bacteria. About 60% did not have enough data collected in the past five years to evaluate. High bacteria levels are often observed during periods of higher stream flows associated with heavy rains.
Aquatic Life UseThe upward trend in full attainment of the aquatic life use in both watersheds and larger streams continues. In general, large rivers in Ohio meet aquatic life use goals at a much higher percentage than smaller streams.Tables 3.7-4 to 3.7-8: Northeast Ohio List of Impaired Waters
112 Ohio Administrative Code Rule 3745-1-04113 Ohio Administrative Code Rule 3745-1114 Ohio Administrative Code Rule 3745-1-07 Paragraph (C), Rule 3745-2-09 and Rule 3745-33-07 Paragraph (B) 115 Ohio Administrative Code Rule 3745-1-07 Paragraph (A)(6)

Long-Range Transportation Plan
157
Figure 3.8-12: Ohio Total Maximum Daily Load Program ProgressOhio EPA assesses all subwatersheds in the state for aquatic life use attainment. Tables 3.8-13 through 3.8-17 summarize, by county, each subwatershed’s (HUC12) aquatic life use designation and current attainment status. Ohio EPA assigns the following designations or combinations of designations based upon natural stream conditions.
WWH Warm Water HabitatCWH Cold Water HabitatEWH Exceptional Warmwater HabitatMWH Modified Warmwater HabitatSSH Seasonal Salmonoid HabitatLRW Limited Resource Water

Achieving Increased Mobility for Northeast Ohio
158
Map # Subwatershed Name HUC12 TMDL
Year ALU Designation Attainment Status Watershed ScoreFull Partial Non
3 Heider Ditch Frontal Lake Erie 41100010603 2008 WWH x x 07 French Creek 41100010601 2008 WWH x x x 33.315 Willow Creek 41100010403 2008 WWH x 016 Plum Creek 41100010107 WWH x 017 Cossett Creek West Branch Rocky River 41100010106 WWH x x 8025 Headwater Aurora Branch 41100030302 2007 CWH, WWH x x 51.533 Headwaters East Branch Rocky River 41100010201 WWH x 10046 Boston Run Cuyahoga River 41100020405 2003 CWH, WWH x x 77.847 Furnace Run 41100020403 2003 WWH x x 87.548 Willow Lake Cuyahoga River 41100020505 2003 CWH, WWH x 5049 Headwaters Chippewa Creek 41100020503 2003 WWH 33.350 Baldwin Creek East Branch Rocky River 41100010202 WWH x x x 86.151 Baker Creek West Branch Rocky River 41100010108 WWH x x x 66.752 Cahoon Creek Frontal Lake Erie 41100010204 WWH x x 053 City of Cleveland Cuyahoga River 41100020605 2003 Unknown Null54 Rocky River 41100010203 WWH, MWH-C x x x 76.555 Big Creek 41100020603 2003 WWH, LRW x x 056 Cuyahoga Heights Cuyahoga River 41100020604 2003 WWH x x x 12.557 Village of Independence Cuyahoga River 41100020602 2003 WWH 33.358 Mill Creek 41100020601 2003 WWH x x 2059 Doan Brook Frontal Lake Erie 41100030504 WWH x 060 Euclid Creek 41100030503 WWH x x x 061 Griswold Creek Chagrin River 41100030402 CWH, WWH x x x 48.962 Town of Twinsburg Tinkers Creek 41100020504 WWH, LRW x x x 13.663 Brandywine Creek 41100020404 2003 WWH 62.564 Pond Brook 41100020501 WWH, MWH-C x x x 5065 McFarland Creek Aurora Branch 41100030303 2007 CWH, EWH, WWH, WWH/SSH x x 70.976 Beaver Creek Chagrin River 41100030304 2007 CWH, WWH x x x 89.691 Boston Run Cuyahoga River 041100030502 Unknown Null
Figure 3.8-13: Cuyahoga County of List of Impaired Waters

Long-Range Transportation Plan
159
Map # Subwatershed Name HUC12 TMDL
Year ALU Designation Attainment Status Watershed Score
Full Partial Non61 Griswold Creek Chagrin River 041100030402 2007 CWH, WWH x x x 48.964 Pond Brook 041100020501 WWH, MWH-C x x x 5065 McFarland Creek Aurora Branch 041100030303 2007 CWH, EWH, WWH, WWH/SSH x x 70.966 Headwaters Aurora Branch 041100030302 2007 CWH, WWH x x 51.567 Lake Rockwell Cuyahoga River 041100020203 2000 WWH x 87.568 Black Brook 041100020105 2004 WWH 10069 Headwaters Eagle Creek 050301030401 2011 CWH, WWH x x 66.770 Camp Creek Eagle Creek 050301030403 2011 CWH, WWH x x 87.571 Tinkers Creek 050301030404 2011 WWH x x 072 Headwaters Grand River 041100040102 2013 CWH, EWH, WWH x x 66.773 Sawyer Brook Cuyahoga River 041100020106 2004 WWH 2574 Ladue Reservoir Bridge Creek 041100020104 2004 WWH 16.775 Silver Creek 041100030301 2007 CWH, WWH x 10076 Beaver Creek Chagrin River 041100030304 2007 CWH, WWH x x x 89.677 West Branch Cuyahoga 041100020102 2004 WWH 62.5
78 East Branch Reservoir East Branch Cuyahoga River 041100020101 2004 WWH 66.7
79 Tare Creek Cuyahoga River 041100020103 2004 WWH 080 Swine Creek 041100040106 2013 CWH, WWH x 10081 Mill Creek Grand River 041100040303 2013 CWH, WWH x x 83.382 Phelps Creek 041100040301 2013 CWH, WWH x x 83.383 Hoskins Creek 041100040302 2013 CWH, WWH x x 66.784 Mud Creek 041100040304 2013 CWH, WWH x x 66.785 Bronson Creek Grand River 041100040502 2013 CWH, EWH, WWH x x 58.386 Mill Creek 041100040602 2012 CWH, WWH 10087 Talcott Creek Grand River 041100040605 2012 CWH Null88 Paine Creek 041100040604 2012 EWH, CWH, WWH 58.489 Big Creek 041100040606 2012 CWH, WWH 61.490 East Branch Chagrin River 041100030401 2007 EWH/CWH, CWH x x 60.7
Figure 3.8-14: Geauga County of List of Impaired Waters
Achieving Increased Mobility for Northeast Ohio
160
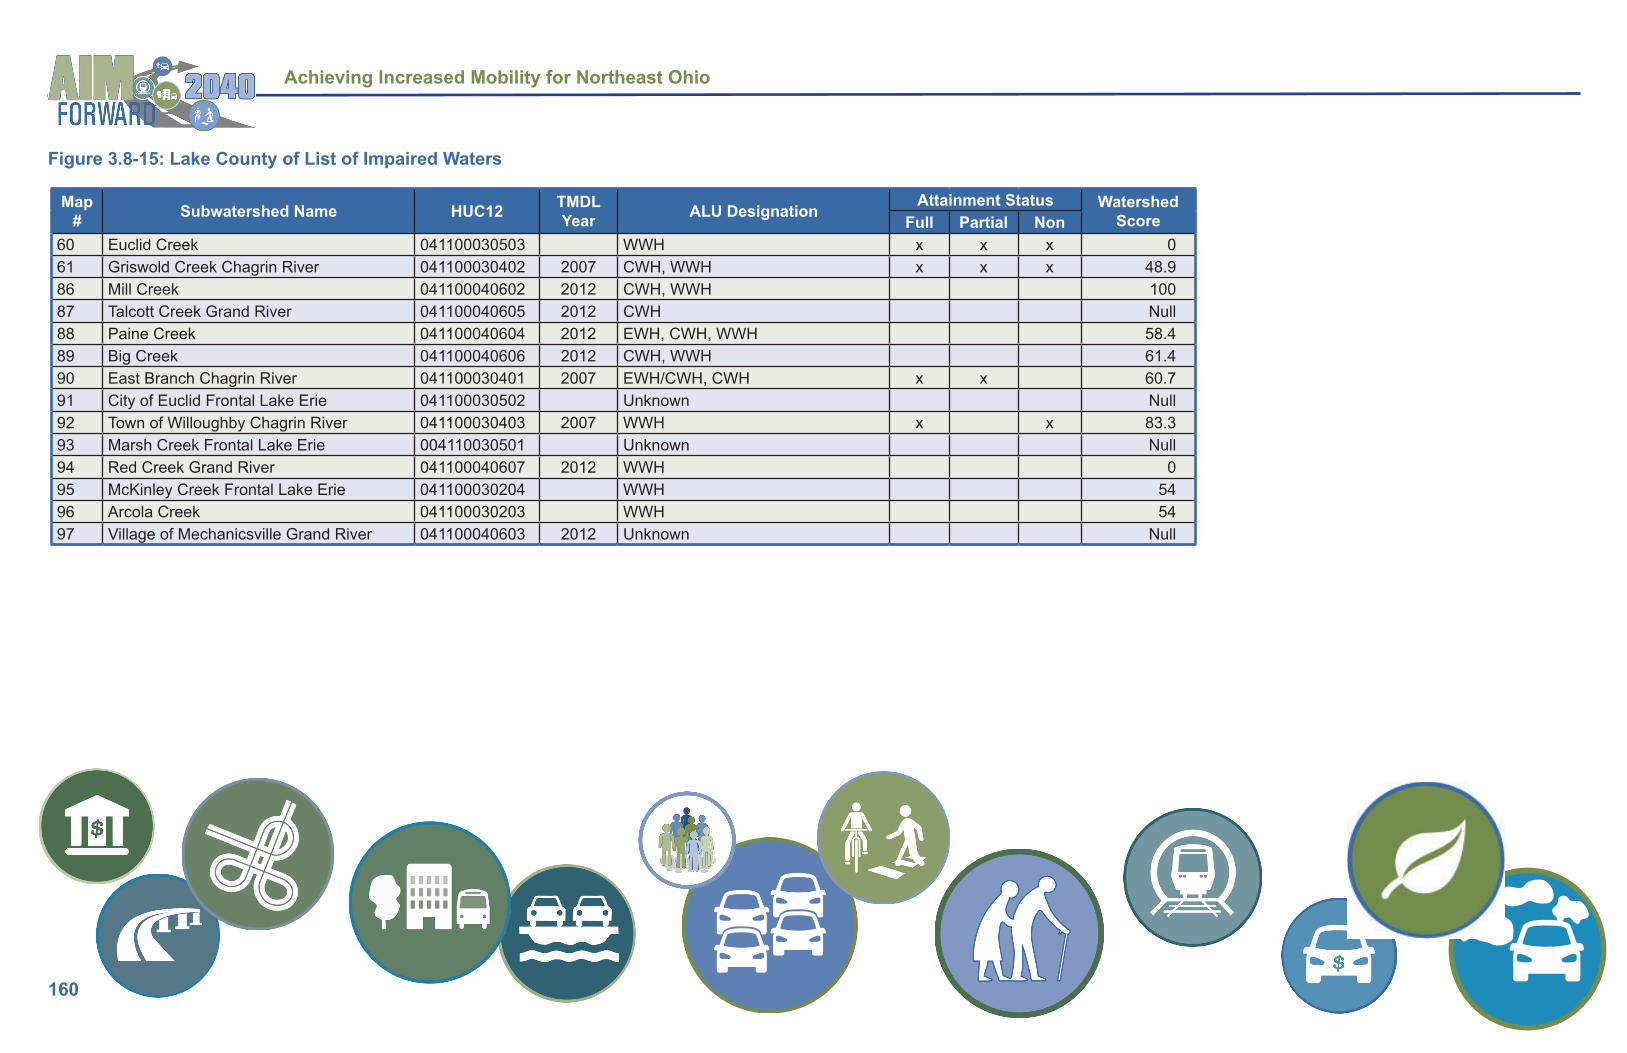
Figure 3.8-15: Lake County of List of Impaired Waters
Map # Subwatershed Name HUC12 TMDL
Year ALU Designation Attainment Status Watershed ScoreFull Partial Non
60 Euclid Creek 041100030503 WWH x x x 061 Griswold Creek Chagrin River 041100030402 2007 CWH, WWH x x x 48.986 Mill Creek 041100040602 2012 CWH, WWH 10087 Talcott Creek Grand River 041100040605 2012 CWH Null88 Paine Creek 041100040604 2012 EWH, CWH, WWH 58.489 Big Creek 041100040606 2012 CWH, WWH 61.490 East Branch Chagrin River 041100030401 2007 EWH/CWH, CWH x x 60.791 City of Euclid Frontal Lake Erie 041100030502 Unknown Null92 Town of Willoughby Chagrin River 041100030403 2007 WWH x x 83.393 Marsh Creek Frontal Lake Erie 004110030501 Unknown Null94 Red Creek Grand River 041100040607 2012 WWH 095 McKinley Creek Frontal Lake Erie 041100030204 WWH 5496 Arcola Creek 041100030203 WWH 5497 Village of Mechanicsville Grand River 041100040603 2012 Unknown Null

Long-Range Transportation Plan
161
Figure 3.8-16: Lorain County of List of Impaired Waters
Map # Subwatershed Name HUC12 TMDL
Year ALU Designation Attainment Status Watershed ScoreFull Partial Non
1 Sugar Creek Frontal Lake Erie 041000120301 2005 WWH 502 Vermillion River Mouth 041000120204 WWH 753 Quarry Creek Frontal Lake Erie 041100010703 WWH Null4 Beaver Creek Mouth 041100010702 WWH 505 Black River 041100010602 2008 WWH x x 906 Heider Ditch Frontal Lake Erie 041100010603 2008 WWH x x 07 French Creek 041100010601 2008 WWH x x x 33.38 Town of Wakeman Vermillion 000410001203 WWH 58.49 East Fork Vermillion 041000120202 WWH x x 7010 Beaver Creek Headwaters 041100010701 WWH Null11 Plum Creek 041100010505 2008 WWH x x 012 Middle West Branch Black River 041100010504 2008 WWH x x 013 Lower West Branch Black River 041100010506 2008 WWH x x x 37.514 Jackson Ditch East Branch Black River 041100010404 2008 WWH x x x 5515 Willow Creek 041100010403 2008 WWH x 016 Plum Creek 041100010107 WWH x 017 Cosset Creek West Branch Rocky River 041100010106 WWH x x 8018 Salt Creek East Branch Black River 041100010402 WWH x x x 5019 Wellington Creek 041100010503 2008 WWH x x 020 Charlemont Creek 041100010501 2008 WWH x x 021 Upper West Branch Black River 041100010502 2008 WWH x x 2522 East Branch Vermillion River 041000120201 WWH 2523 Town of Litchfield East Branch Black River 041100010401 2008 WWH x 10024 Coon Creek East Branch Black River 041100010303 2008 WWH x x 83.351 Baker Creek West Branch Rocky River 041100010108 WWH x x x 66.752 Cahoon Creek Frontal Lake Erie 041100010204 WWH x x 0
Achieving Increased Mobility for Northeast Ohio
162
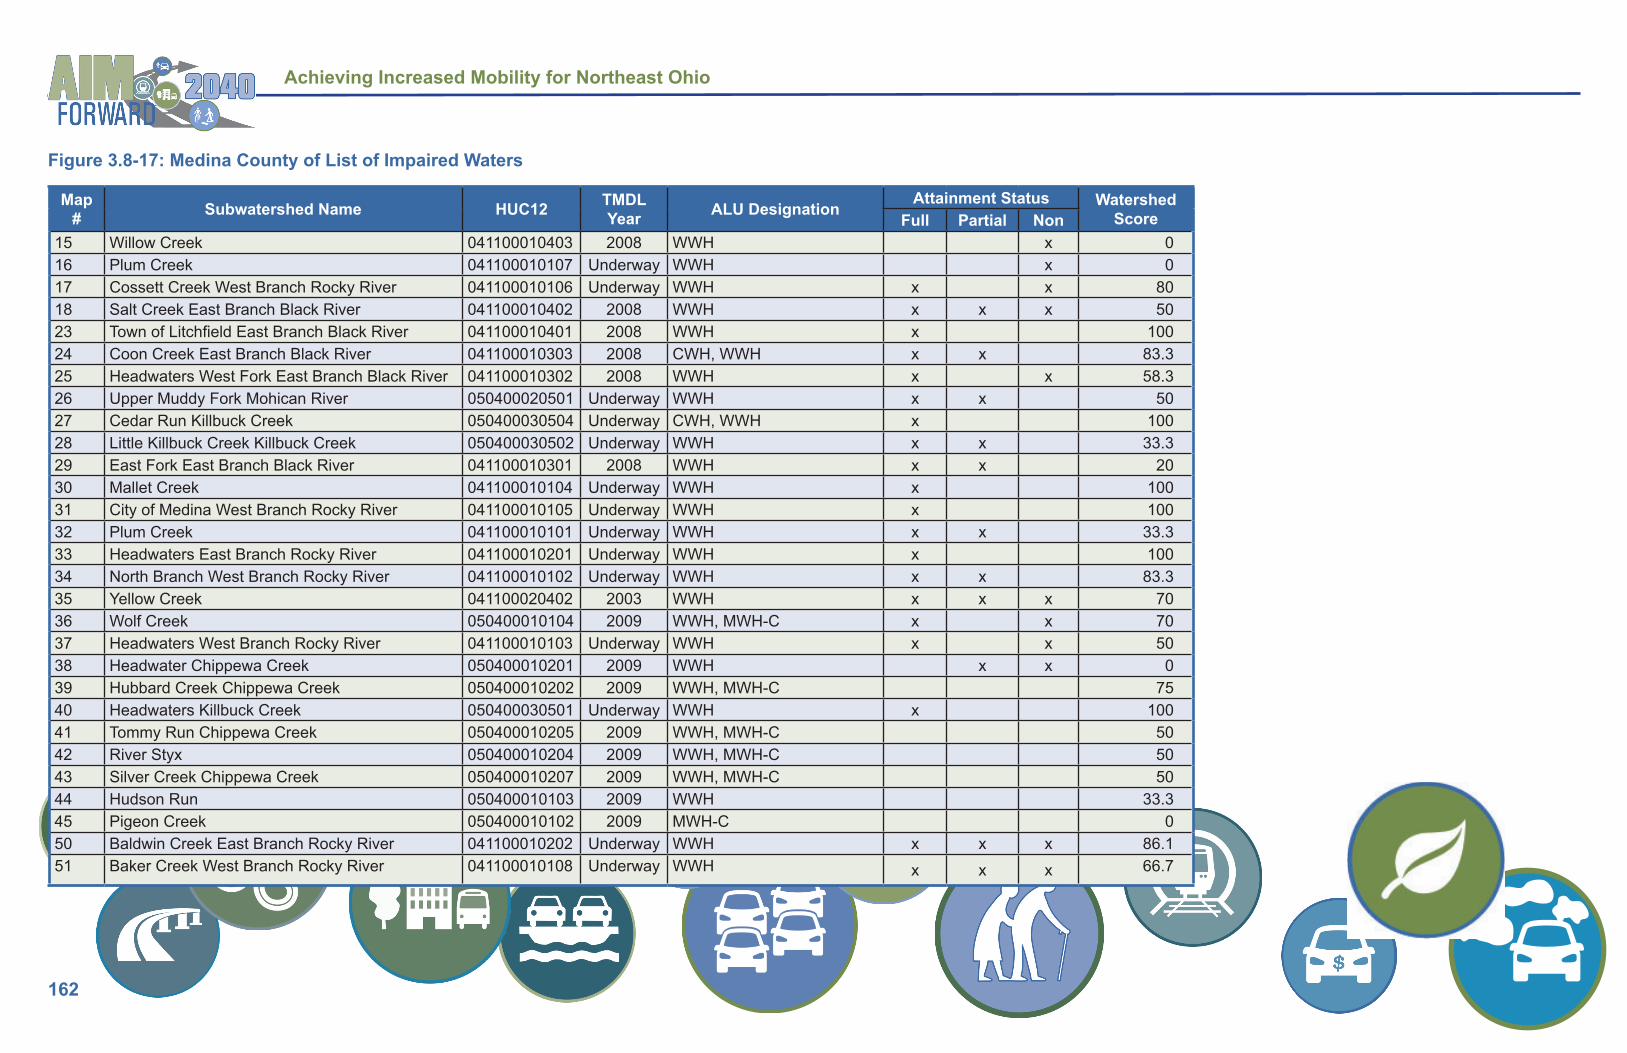
Figure 3.8-17: Medina County of List of Impaired Waters
Map # Subwatershed Name HUC12 TMDL
Year ALU Designation Attainment Status Watershed ScoreFull Partial Non
15 Willow Creek 041100010403 2008 WWH x 016 Plum Creek 041100010107 Underway WWH x 017 Cossett Creek West Branch Rocky River 041100010106 Underway WWH x x 8018 Salt Creek East Branch Black River 041100010402 2008 WWH x x x 5023 Town of Litchfield East Branch Black River 041100010401 2008 WWH x 10024 Coon Creek East Branch Black River 041100010303 2008 CWH, WWH x x 83.325 Headwaters West Fork East Branch Black River 041100010302 2008 WWH x x 58.326 Upper Muddy Fork Mohican River 050400020501 Underway WWH x x 5027 Cedar Run Killbuck Creek 050400030504 Underway CWH, WWH x 10028 Little Killbuck Creek Killbuck Creek 050400030502 Underway WWH x x 33.329 East Fork East Branch Black River 041100010301 2008 WWH x x 2030 Mallet Creek 041100010104 Underway WWH x 10031 City of Medina West Branch Rocky River 041100010105 Underway WWH x 10032 Plum Creek 041100010101 Underway WWH x x 33.333 Headwaters East Branch Rocky River 041100010201 Underway WWH x 10034 North Branch West Branch Rocky River 041100010102 Underway WWH x x 83.335 Yellow Creek 041100020402 2003 WWH x x x 7036 Wolf Creek 050400010104 2009 WWH, MWH-C x x 7037 Headwaters West Branch Rocky River 041100010103 Underway WWH x x 5038 Headwater Chippewa Creek 050400010201 2009 WWH x x 039 Hubbard Creek Chippewa Creek 050400010202 2009 WWH, MWH-C 7540 Headwaters Killbuck Creek 050400030501 Underway WWH x 10041 Tommy Run Chippewa Creek 050400010205 2009 WWH, MWH-C 5042 River Styx 050400010204 2009 WWH, MWH-C 5043 Silver Creek Chippewa Creek 050400010207 2009 WWH, MWH-C 5044 Hudson Run 050400010103 2009 WWH 33.345 Pigeon Creek 050400010102 2009 MWH-C 050 Baldwin Creek East Branch Rocky River 041100010202 Underway WWH x x x 86.151 Baker Creek West Branch Rocky River 041100010108 Underway WWH x x x 66.7
Long-Range Transportation Plan
0 5 10Miles´ NOACA makes no representations or warranties
with respect to the accuracy and/or completeness of the map.DATA SOURCES:NOACA
N O A C A S U B W A T E R S H E D S - A Q U A T I C L I F E U S E ( A L U ) A T T A I N M E N T S T A T U S
§̈¦71
§̈¦80
§̈¦480
§̈¦271
§̈¦77
§̈¦76
§̈¦490
§̈¦480
§̈¦271
§̈¦80
§̈¦90
§̈¦80
§̈¦480
§̈¦480
§̈¦71
§̈¦71
§̈¦71
§̈¦90
§̈¦90
§̈¦90
§̈¦90
¬«42
¬«322
¬«20
¬«84
¬«58
¬«528
¬«82
¬«306
¬«91
¬«283
¬«162
¬«17
¬«301
¬«3
¬«2 ¬«608
¬«511
¬«252
¬«86
¬«254
¬«94
¬«83
¬«113
¬«14
¬«57
¬«44
¬«21
¬«175
¬«43
¬«18
¬«166
¬«87
¬«8
¬«168
¬«700
¬«237
¬«174
¬«422
¬«224
¬«10
¬«615
¬«88¬«291
¬«606
¬«640
¬«176
¬«421
¬«535 ¬«307
¬«261
¬«18
¬«528
¬«176
¬«422
¬«224
¬«322
¬«301
¬«162
¬«2
¬«84
¬«20
¬«3
¬«10
¬«94
¬«175
¬«20
¬«83
¬«303
¬«44
¬«44
¬«237¬«57
¬«301
¬«422
¬«2
¬«283
¬«83
¬«87
¬«20
¬«2
¬«57
¬«252
¬«43
¬«162
¬«18
¬«303
¬«58
¬«2
¬«511
¬«252
¬«254
¬«6
¬«42
¬«82
¬«6
¬«87
¬«322
¬«306
¬«608¬«44
¬«166
¬«528
¬«528
¬«20¬«6
¬«174
¬«20
¬«2 ¬«86
¬«322
¬«91
¬«87
¬«283
¬«162
¬«303
¬«94
¬«611
City of Cleveland
Madison Township
City of Mentor
Troy Township
City of Lorain
Auburn Township
City of Avon
Leroy Township
City of Solon
City of Elyria
Newbury Township
Sharon Township
City of Parma
Burton Township
Homer Township
Hinckley Township
Grafton Township
Eaton Township
Munson Township
Parkman Township
Pittsfield Township
Carlisle Township
Chatham Township
Spencer Township
York Township
Liverpool Township
Lagrange Township
City of Strongsville
Harrisville Township
Columbia Township
Westfield Township
Chester Township
Montville Township
Granger Township
Perry Township
Concord Township
Thompson Township
Bainbridge Township
Huntington Township
Claridon Township
Chardon Township
Lafayette Township
Guilford Township
Penfield Township
Huntsburg Township
Litchfield Township
City of Kirtland
Hambden Township
Russell Township
Henrietta Township
City of Brecksville
Middlefield Township
Camden Township
New Russia Township
Medina Township
City of North Ridgeville
City of Westlake
City of North Royalton
Wellington Township
Rochester Township
Brighton Township
City of Euclid
City of Medina
Amherst Township
City of Brunswick
Wadsworth Township
City of Avon Lake
City of Willoughby
City of Wadsworth
Brownhelm Township
Village of Sheffield
Painesville Township
City of North Olmsted
Olmsted Township
City of Vermilion
City of Broadview Heights
City of Willoughby Hills
City of Independence
Brunswick Hills Township
City of Amherst
City of Berea
Village of Gates Mills
City of Brook Park
City of Eastlake
City of Painesville
City of Pepper Pike
City of Bedford
City of Oberlin
City of Lakewood
City of Cleveland Heights
Village of Walton Hills
Elyria Township
City of Garfield Heights
City of Middleburg Heights
Village of Moreland Hills
City of Wickliffe
City of Chardon
Village of Hunting Valley
City of Shaker Heights
City of Beachwood
City of Brooklyn
Village of Grafton
City of Lyndhurst
Village of Madison
Village of Kirtland Hills
City of Bay Village
City of Rocky River
City of Maple Heights
City of South Euclid
City of Fairview Park
Village of Waite Hill
Village of Orange
Village of Mayfield
City of Olmsted Falls
City of Parma Heights
Village of North Perry
Village of Oakwood
Village of South Russell
City of Willowick
Village of Lodi
Village of Perry
Village of Glenwillow
City of Sheffield Lake
City of Seven Hills Village of
Valley View
City of Highland Heights
City of Bedford Heights
Village of Wellington
City of Mayfield Heights
City of Richmond Heights
City of Warrensville Heights
Village of Seville
Village of Middlefield
City of East Cleveland
Village of Cuyahoga Heights
Village of Lagrange
Village of Chagrin Falls
Village of South Amherst
Village of Highland Hills
Sheffield Township
Village of Westfield Center
City of University Heights
Village of Brooklyn Heights
City of Rittman
Village of Burton
City of Mentor-On-The-Lake
Village of Spencer
Village of Bratenahl
Village of Rochester
Village of Fairport Harbor
Village of North Randall
Village of Grand River
Village of Kipton
Chagrin Falls Township
Village of Newburgh Heights
Village of Woodmere
Village of Timberlake
Village of Chippewa Lake
Village of Creston
Village of Aquilla
Village of Gloria Glens Park
Village of Linndale
36
27
41
51
40
39
18
25
30
45
33
26
24
43
31
17
34
16
28
38
15
37
44
50
29
32
42
233520
13
1
33
12
5252
6
811
102
2122
7
19
9
5
14
54
47
56
6664
5359
65625755
9191
91
61
63
48
58
46
7660
49
90
88
83
77
89
68
8073
7067
8179
69
86
74
84
87
78 82
71
75
85
72
96
93
959594
92
97
4
MunicipalitiesParks & GreenspaceRivers
County Boundary
NOACA SubwatershedsALU Status
FullFull/PartialFull/Partial/NonFull/NonPartialPartial/NonNonNo Data Available
L O N G - R A N G E T R A N S P O R T A T I O N P L A NA I M F O R W A R D 2 0 4 0 Figure 3.8-18
163
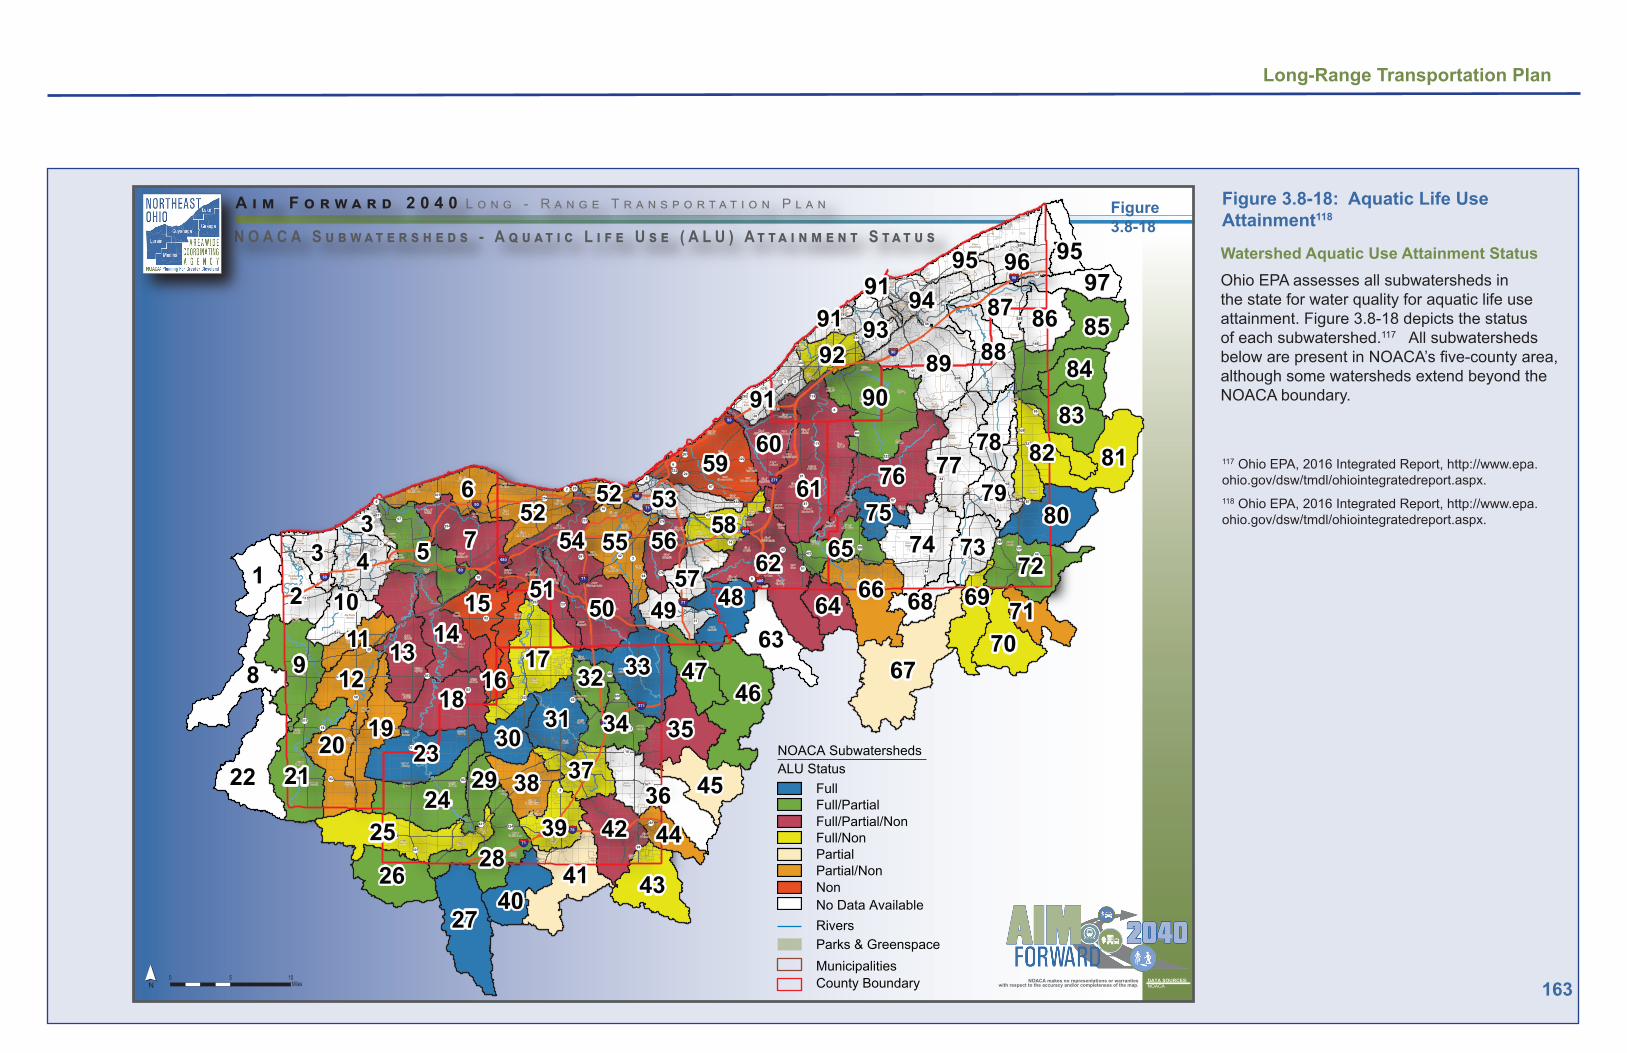
Watershed Aquatic Use Attainment StatusOhio EPA assesses all subwatersheds in the state for water quality for aquatic life use attainment. Figure 3.8-18 depicts the status of each subwatershed.117 All subwatersheds below are present in NOACA’s five-county area, although some watersheds extend beyond the NOACA boundary.
Figure 3.8-18: Aquatic Life Use Attainment118
117 Ohio EPA, 2016 Integrated Report, http://www.epa.ohio.gov/dsw/tmdl/ohiointegratedreport.aspx.118 Ohio EPA, 2016 Integrated Report, http://www.epa.ohio.gov/dsw/tmdl/ohiointegratedreport.aspx.
Achieving Increased Mobility for Northeast Ohio
164
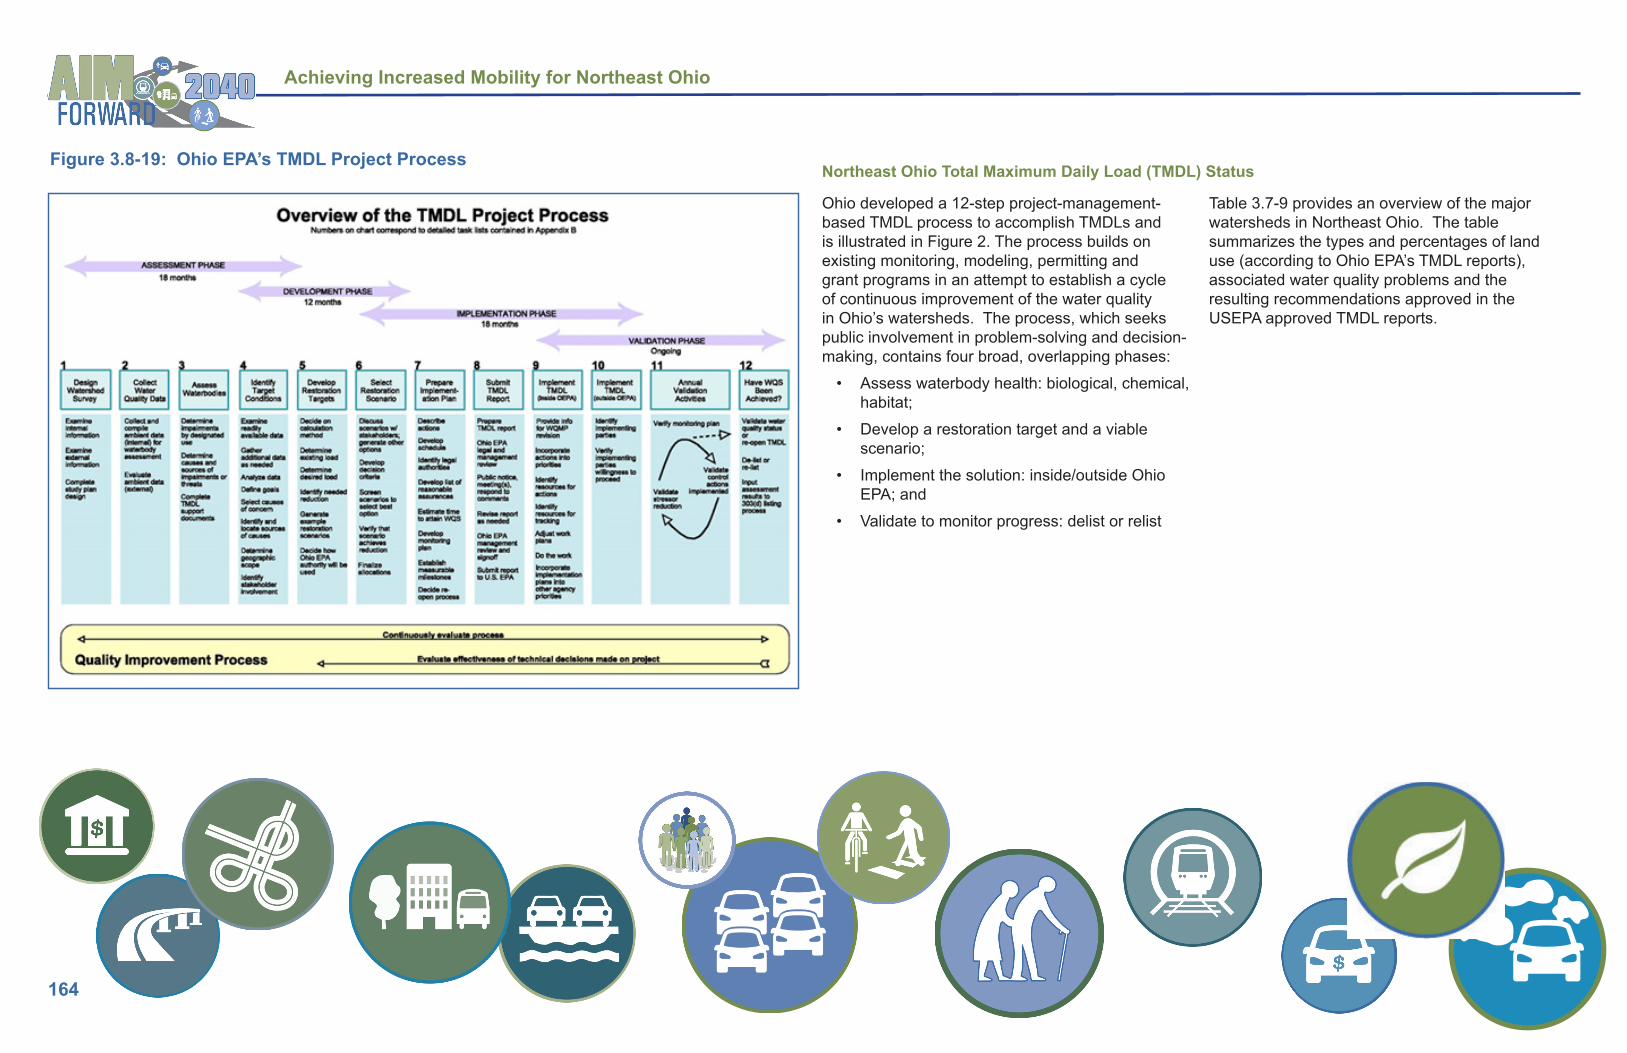
Ohio developed a 12-step project-management-based TMDL process to accomplish TMDLs and is illustrated in Figure 2. The process builds on existing monitoring, modeling, permitting and grant programs in an attempt to establish a cycle of continuous improvement of the water quality in Ohio’s watersheds. The process, which seeks public involvement in problem-solving and decision-making, contains four broad, overlapping phases:
• Assess waterbody health: biological, chemical, habitat;
• Develop a restoration target and a viable scenario;
• Implement the solution: inside/outside Ohio EPA; and
• Validate to monitor progress: delist or relist
Northeast Ohio Total Maximum Daily Load (TMDL) StatusFigure 3.8-19: Ohio EPA’s TMDL Project Process
Table 3.7-9 provides an overview of the major watersheds in Northeast Ohio. The table summarizes the types and percentages of land use (according to Ohio EPA’s TMDL reports), associated water quality problems and the resulting recommendations approved in the USEPA approved TMDL reports.

Long-Range Transportation Plan
165
Figure 3.8-20: TMDL Status Summary for Northeast Ohio’s WatershedsWatershed Counties Watershed Land Use Water Quality Problems TMDL Recommendations
Black River Ashland, Huron, Medina, Cuyahoga and Lorain
44% row crop, 25% deciduous forest, 16% residential, and 8% pasture119
Mainstem: Bacteria, Dissolved Oxygen (DO)East Branch: Phosphorus, Nitrogen, Bacteria, Total Suspended Solids (TSS), DOWest Branch: Phosphorus, Nitrogen, Bacteria, TSS, DO
Restoring stream habitats in agricultural areas; eliminate pervasive bacteria problems; reduce impacts from permitted dischargers; and manage storm water quantity and quality in developing areas120
Rocky River Lorain, Cuyahoga and Medina
34.5% deciduous forest, 24.5% pasture/hay, 15% low intensity residential, 13.75% row crops, 3.72% commercial/ industrial/transportation, 8.53% other, e.g. grasses, wetlands, forest, open water, etc.
Potentially Bacteria Draft TMDL, New TMDL in process
Plum Creek, Rocky River Lorain, Cuyahoga and Medina
18.5% developed, 22.8% forest, 15.8% grass/pas-tures, 33.40 row crops, 9.4% others121
Phosphorus, Nitrogen Address nonpoint sources of nutrients, e.g. failing home sewage treatment systems (HSTS), elimination of illicit discharges, construction site sediment/erosion controls, post-construction storm water management, public education, pollution prevention at municipal operations.
Upper Cuyahoga Geauga and Portage 44% deciduous forest, 26% pasture/hay, 11% row crop, 7% woody wetlands, 3.67% open water, 2.77% emergent herbaceous wetlands, 1.67 low intensity residential, 4% other122
Phosphorus, Nitrogen NPDES permit limits. Phase II storm water management plan implementation. Riparian protection measures. Inspection, maintenance, proper operation of HSTSs and commercial systems. Wetland protection, parks and natural areas, easements.
Middle Cuyahoga Portage, Summit and Stark Urban development, agriculture, forest and wetland areas123
Phosphorus, Ammonia, TSS, DO, Flow Monitoring and permitting of all outfalls to the Twin Lakes outlet including Akron WTP outfall 001 and 002
Lower Cuyahoga Cuyahoga,Summit and Portage
Densely populated and industrialized urban area Phosphorus, Nitrogen, Habitat, Bacteria, DO Modifications of Kent (completed 2005) and removal of Munroe Falls Dam (completed 2007);
Chagrin Portage, Geauga, Cuyahoga and Lake
64.6% deciduous forest, 16.6% residential, 7.6% crop, 4.6% commercial/ industrial/transportation, 6.4% other, e.g. grass, woody wetlands, open water, etc.124
Phosphorus, Nitrogen, Habitat, Bacteria, TSS Phase II storm water management plan implementation. Preservation, restoration and enhancement of wetlands. Adoption of riparian, wetland and headwaters protection regulations. Upstream damn removal. Proper operation and maintenance of HSTS.
Upper Grand Ashtabula, Geauga, Portage and Trumbull
41.5% forest, 36.1% cultivated crops and pasture lands, 8.9% wetlands, 6.3 % developed land and 7.2% other125
Phosphorus, Nitrogen, Ammonia, Habitat, Bacteria, TSS
Reduce NPDES permit limits. Address nonpoint sources of pollution - related to direct habitat alterations; riparian and stream restoration, dam removal. Address failing HSTSs with operation and maintenance programs. Implementation of agricultural BMPs.
Lower Grand Lake, Ashtabula and Geauga
3% deciduous forests, 21% cultivated crops, 8% pasture/hay, 8% developed open water, 7% low intensity development, 4% grasses, 3% woody wetland, and 6% other, e.g. open water, shrub/scrub, etc.
Phosphorus, Bacteria, Flow Reduce impervious surface coverage and protect/restore riparian buffer vegetation. Additional phosphorus reductions from point sources. Control storm water runoff through the implementation of storm water management plans. Proper operation and maintenance of HSTSs.
Lake Erie Tributaries – Beaver, Euclid, Quarry, Cahoon & Marsh Creeks, Heider Ditch, Doan Brook
Subwatersheds that drain directly to Lake Erie
Primarily urbanized, impervious surfaces TMDL Not Started TMDL Not Started
119 http://www.epa.state.oh.us/portals/35/tmdl/BlackRiverTMDL_final_may08_wo_app.pdf 120 http://www.epa.state.oh.us/portals/35/tmdl/BlackRiverTMDL_final_may08_wo_app.pdf121 http://wwwapp.epa.ohio.gov/gis/mapportal/IR2016.html
122 http://www.epa.state.oh.us/portals/35/tmdl/upCuy_final_090304.pdf 123 http://www.epa.state.oh.us/portals/35/tmdl/BlackRiverTMDL_final_may08_wo_app.pdf 124 http://www.epa.state.oh.us/portals/35/tmdl/BlackRiverTMDL_final_may08_wo_app.pdf125 http://wwwapp.epa.ohio.gov/gis/mapportal/IR2016.html

Achieving Increased Mobility for Northeast Ohio
166
Managing Development in FloodplainsThe U.S. Congress established the National Flood Insurance Program (NFIP) in 1968, which is administered by the Federal Emergency Management Agency (FEMA). The intent of the NFIP is to minimize future flood damage, regulate short-term impacts that can be associated with development and modifications of floodplains, and provide property owners with flood insurance protection at a reasonable cost while preserving the natural and beneficial values served by floodplains. The NFIP assists communities by requiring that they adopt and administer local flood plain management measures. This effort is intended to protect lives and new construction from future flooding.
All transportation projects must avoid increasing base flood (100-year flood) elevations when developing in Special Flood Hazard Areas (SFHAs)/regulated floodplain zones delineated on FEMA Flood Insurance Rate Maps (FIRMs).
Managing Impacts to Historical and Cultural ResourcesIn the National Historic Preservation Act of 1966 (NHPA), Congress established a comprehensive program to preserve the historical and cultural foundations of the nation as a living part of community life. Section 106 of the NHPA is crucial to that program because it requires consideration of historic preservation in the multitude of projects with federal involvement that take place across the
country. Section 106 requires federal agencies to consider the effects of projects they carry out, approve, or fund on historic properties. Additionally, federal agencies must provide the public an opportunity to comment on such projects prior to the agency’s decision on them.
Section 106 review encourages, but does not mandate, preservation. Sometimes there is no way for a needed project to proceed without harming historic properties. Section 106 review does ensure that preservation values are factored into federal agency planning and decisions. Section 106 requires federal agencies to consider their responsibility for the consequences of the projects they carry out, approve, or fund on historic properties and be publicly accountable for their decisions. In Ohio, historical and cultural resources include important archeology sites, history and architecture, historic bridges, and scenic byways.
Managing Impacts to Publically-Owned ResourcesSection 4(f) of the United States Department of Transportation (USDOT) Act protects publicly owned parks, recreation areas, wildlife and waterfowl refuges, and public or privately owned historic sites from adverse impacts resulting from the construction of transportation facilities funded by the USDOT.126
Section 6(f)Section 6(f) of the Land and Water Conservation Act applies to the conversion of certain recreation lands to non-recreational purposes. The act applies to recreation lands that have received Land and Water Conservation Fund (LWCF) money. Any land conversions on property that has received LWCF money must be approved by the U.S. Department of the Interior–National Park Service (FHWA, 1987). Section 6(f) also requires that any applicable land converted to non-recreational uses must be replaced with land of equal or greater value, location, and usefulnessManaging Ecological Resources, Noise and Other Environmental ImpactsEcological ResourcesSeveral laws and rules (including NEPA, Endangered Species Act, Fish and Wildlife Coordination Act, and the Clean Water Act) require that all proposed federally funded projects undergo studies to determine the degree and effect of impacts resulting from projects on the natural environment. More specifically, they require analysis of the impacts on the natural environment with emphasis on certain special areas of concern, particularly endangered species, streams and wetlands, and surrounding terrestrial environments.
For projects involved in stream work, wetlands, or significant amounts of new right-of-way, ecological surveys are performed to inventory the resources in the vicinity of the proposed project. These data are summarized in an ODOT Ecological Survey Report for each project. This report contains ecological analyses of water quality, aquatic ecosystems, endangered species, wetlands, and terrestrial ecosystems. Some projects may require additional separate reports for specific resources, such as mussel surveys, endangered species surveys, biological assessments, coastal consistency, and others. The Ecological Survey Report and any other resource-specific reports are used to coordinate the project impacts with the resource agencies in order to solicit comments and approvals. The coordination effort and any subsequent environmental commitments are included in the NEPA document. Environmental commitments made from ecological coordination may be carried forward in the form of plan notes, avoidance and minimization measures, species surveys, and/or compensatory mitigation or conservation measures.127
126 https://www.dot.state.oh.us/Divisions/Planning/Environment/NEPA_policy_issues/4F_6F/Pages/default.aspx 127 http://www.dot.state.oh.us/Divisions/Planning/Environment/NEPA_policy_issues/NOISE/Pages/default.aspx http://www.dot. state.oh.us/Divisions/Planning/Environment/Ecological_Resources_Permits/Ecology/Pages/default.aspx
Long-Range Transportation Plan
167
NoiseNoise is considered unwanted sound, particularly when the sound causes annoyance. Noise comes from many sources. One of the most significant sources is from transportation, particularly traffic noise.Highway noise comes from three sources: the engine, the exhaust, and the interaction of the tires and pavement. Once typical highway speeds are reached, the predominate noise from light trucks and cars is from the tire/pavement interaction. Heavy trucks produce a high volume of noise from all three sources even at high speeds.Mitigating transportation noise in the environment is important for the health and welfare of the surrounding community. Numerous studies have demonstrated the effect of noise on the health of those suffering under its impact. Effects ranging from hearing loss to cardiac arrest have been linked to noise. Prolonged exposure to noise in excess of 75 deciBels Adjusted (dBA) may initiate hearing loss. Noise may also negatively affect the quality of life of those who must live with it. Loss of sleep and the inability to hold conversations are frequent complaints. Helping to alleviate these negative impacts is the objective of noise abatement.128
OtherMitigationTransportation projects should strives to avoid, to the fullest extent practicable, any activity that adversely affects natural resources during the design, construction, or maintenance of the state transportation system. In the event that impacts to important natural resources are unavoidable, project sponsors should consider a wide variety of mitigation strategies, which always begin with evaluation of on-site mitigation opportunities within the project work area. Once the on-site resources within the project area are exhausted, the search for mitigation shifts to opportunities further from the project impact, but within the same subwatershed. Mitigation may include banking, habitat creation, restoration, and/or preservation of stream, wetland, and other natural resources.
Protect the region’s soil, air, water and ecologically sensitive areasNOACA must ensure that its transportation planning protects and enhances the natural, as well as human, environment in Northeast Ohio. To ensure that the region’s key natural resources, including soil, air, water, and ecologically sensitive areas (e.g., wetlands) are protected for current and future generations, NOACA will take the following actions, in accordance with our regional strategic plan and the Northeast Ohio Sustainable Communities Consortium (NEOSCC).
1. Provide funding priority and other preferences within project scoring criteria to projects that preserve agricultural lands; open space; and important habitat areas, woodlands, and wetlands.2. Provide funding priority and other preferences within project scoring criteria to projects that integrate the control of stormwater, protection and improvement of water quality, and control of development in floodplains, riparian areas, and wetlands.
Expand the region’s parks and open space networkCurrently, just 7% of Northeast Ohio is set aside as preserved public open space, significantly less than the 10-15% recommended for the region.129 Historically, the expansion of residential and commercial development—and the transportation infrastructure required to support it—has reduced the amount of open space remaining in the region. Potential conflicts between open space and transportation infrastructure most notably came to a head during the 1960s, when proposed freeway projects into Cleveland Heights and Shaker Heights threatened the Shaker Lakes. To minimize these conflicts and enhance Northeast Ohio’s transportation system, while promoting the expansion of parkland and open space, NOACA will provide funding priority and other preferences within project scoring criteria to projects that enhance the public’s access to and enjoyment of the region’s parks, cultural assets, and recreational activities.
Performance Measures and Targets
128 Western Reserve Land Conservancy, Common Ground The land protection report for northern Ohio (Cleveland: Western Reserve Land Conservancy, 2012), http://www.wrlandconservancy.org/pdf/REGIONALLANDPROTECTIONREPORT-FINAL_001.pdf. 129 Western Reserve Land Conservancy, Common Ground The land protection report for northern Ohio (Cleveland: Western Reserve Land Conservancy, 2012), http://www.wrlandconservancy.org/pdf/REGIONALLANDPROTECTIONREPORT-FINAL_001.pdf.
Achieving Increased Mobility for Northeast Ohio
168
As discussed earlier, Northeast Ohio’s population has remained relatively constant over the past five decades, even as residential and commercial development has expanded. This outward movement has placed additional stress on natural resources and sensitive ecosystems. Accordingly, NOACA will take the following actions, in accordance with the agency’s regional strategic plan and NEOSCC.
1. Provide funding priority and other preferences within project scoring criteria to projects that preserve or maintain existing infrastructure.2. Provide funding priority and other preferences within project scoring criteria to projects that promote the redevelopment of declining and abandoned areas.• reduce energy use and improve air quality• reduce greenhouse gas emissions• reduce reliance on auto travel, particularly
single-occupant vehicles (SOVs)
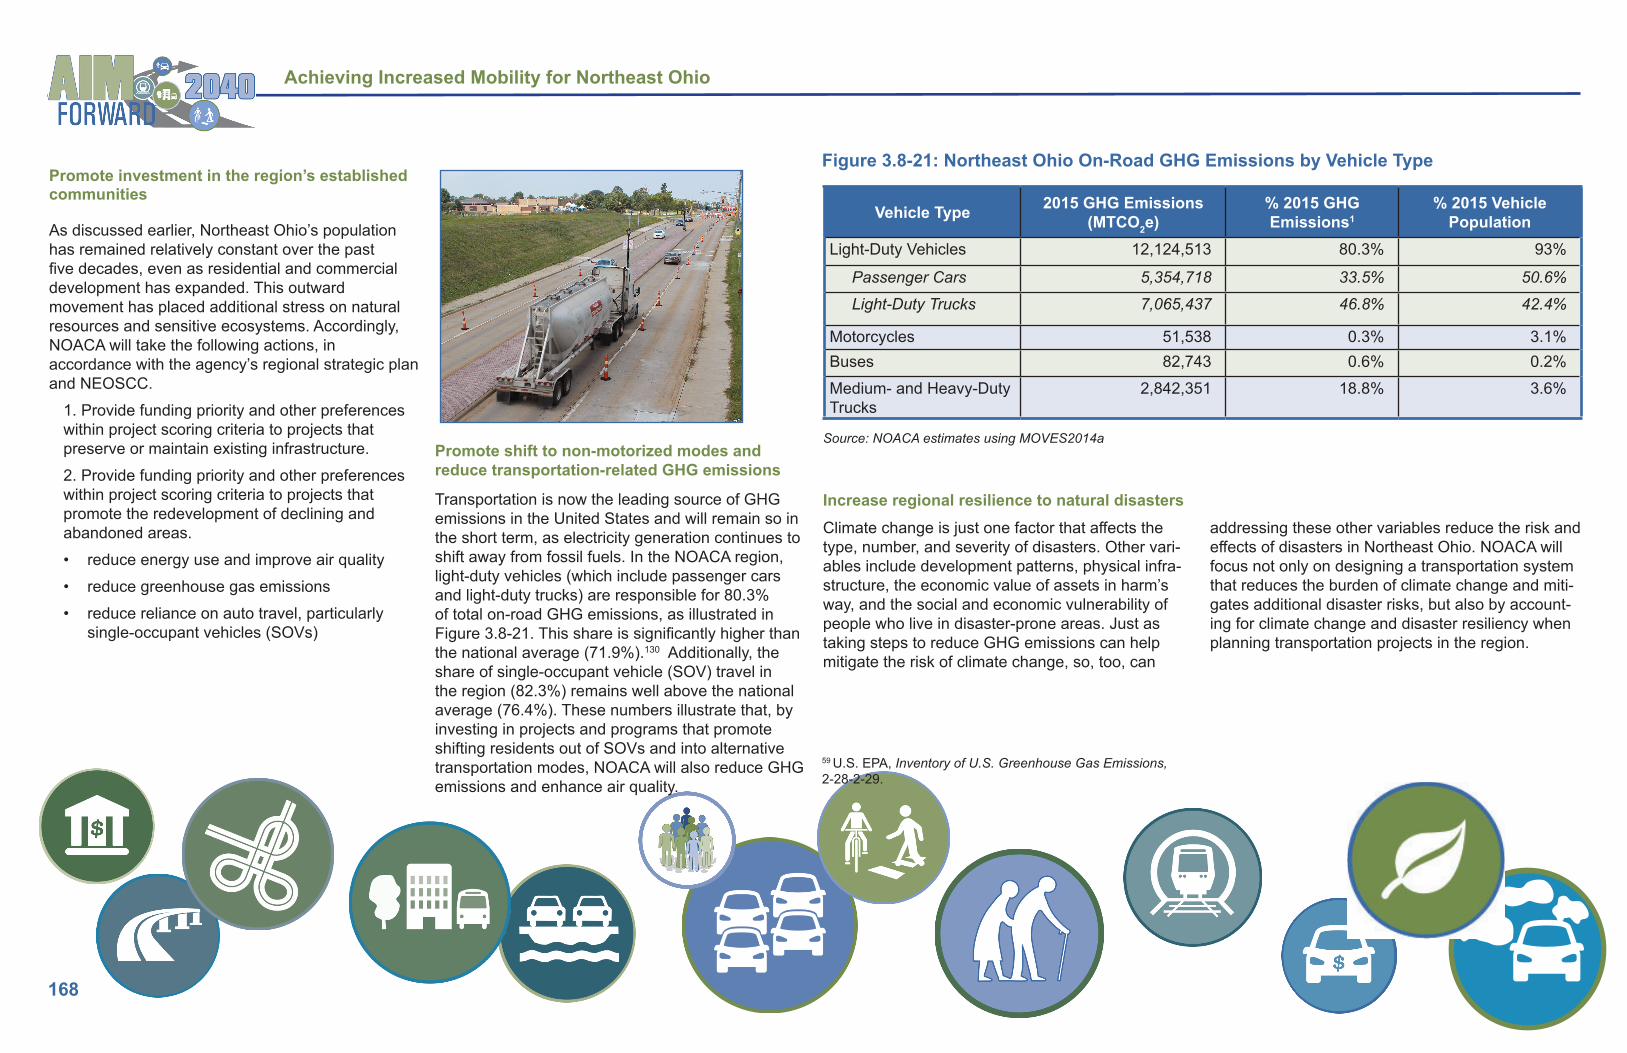
Transportation is now the leading source of GHG emissions in the United States and will remain so in the short term, as electricity generation continues to shift away from fossil fuels. In the NOACA region, light-duty vehicles (which include passenger cars and light-duty trucks) are responsible for 80.3% of total on-road GHG emissions, as illustrated in Figure 3.8-21. This share is significantly higher than the national average (71.9%).130 Additionally, the share of single-occupant vehicle (SOV) travel in the region (82.3%) remains well above the national average (76.4%). These numbers illustrate that, by investing in projects and programs that promote shifting residents out of SOVs and into alternative transportation modes, NOACA will also reduce GHG emissions and enhance air quality.
Climate change is just one factor that affects the type, number, and severity of disasters. Other vari-ables include development patterns, physical infra-structure, the economic value of assets in harm’s way, and the social and economic vulnerability of people who live in disaster-prone areas. Just as taking steps to reduce GHG emissions can help mitigate the risk of climate change, so, too, can
addressing these other variables reduce the risk and effects of disasters in Northeast Ohio. NOACA will focus not only on designing a transportation system that reduces the burden of climate change and miti-gates additional disaster risks, but also by account-ing for climate change and disaster resiliency when planning transportation projects in the region.
Promote investment in the region’s established communities
Vehicle Type 2015 GHG Emissions (MTCO2e)
% 2015 GHG Emissions1
% 2015 Vehicle Population
Light-Duty Vehicles 12,124,513 80.3% 93%
Passenger Cars 5,354,718 33.5% 50.6%
Light-Duty Trucks 7,065,437 46.8% 42.4%
Motorcycles 51,538 0.3% 3.1%Buses 82,743 0.6% 0.2%Medium- and Heavy-Duty Trucks
2,842,351 18.8% 3.6%
Figure 3.8-21: Northeast Ohio On-Road GHG Emissions by Vehicle Type
Promote shift to non-motorized modes and reduce transportation-related GHG emissions
Increase regional resilience to natural disasters
59 U.S. EPA, Inventory of U.S. Greenhouse Gas Emissions, 2-28-2-29.
Source: NOACA estimates using MOVES2014a