HEALTH EXPENDITURE REPORT 1997- 2017...Primary Care (PC) and Primary Health Care (PHC). PHC is the...
136
MNHA HEALTH EXPENDITURE REPORT 1997- 2017
Transcript of HEALTH EXPENDITURE REPORT 1997- 2017...Primary Care (PC) and Primary Health Care (PHC). PHC is the...

MNHA
HEALTH EXPENDITURE REPORT 1997- 2017
MNHA
MNHA
MALAYSIANATIONALH E A L T HACCOUNTS
HEALTH EXPENDITURE REPORT
1997- 2017M
AL
AY
SIA
NA
TIO
NA
L H
EA
LTH
AC
CO
UN
TS
HE
ALTH
EX
PE
ND
ITU
RE
RE
PO
RT 19
97- 2
017
ISSN 1985-711X
MOH/S/RAN/148.19(AR)-e
MALAYSIANATIONAL HEALTH ACCOUNTS
Health Expenditure Report 1997-2017
MALAYSIA NATIONAL HEALTH ACCOUNTS SECTIONPLANNING DIVISION
MINISTRY OF HEALTH MALAYSIA
2019

MALAYSIA NATIONAL HEALTH ACCOUNTS HEALTH EXPENDITURE REPORT 1997-2017 iii MALAYSIA NATIONAL HEALTH ACCOUNTS HEALTH EXPENDITURE REPORT 1997-2017ii MALAYSIA NATIONAL HEALTH ACCOUNTS HEALTH EXPENDITURE REPORT 1997-2017
Published byMalaysia National Health Accounts (MNHA) SectionHealth Financing, Informatics and Accounts Planning BranchPlanning DivisionMinistry of HealthLevel 6, Block E6, Complex E, Precinct 1, Federal Government Administrative Centre,62590 Putrajaya, Malaysia.
Website: www.moh.gov.myEmail: [email protected] ISSN 1985-711
© MOH 2019. All rights reserved.First published: 2019
Enquiries concerning reproduction or interpretation of the contents of this publication should be directed to the Malaysia National Health Accounts Section, Health Financing, Informatics and Accounts Planning Branch, Planning Division, Ministry of Health, Malaysia.
Printed in Malaysia

MALAYSIA NATIONAL HEALTH ACCOUNTS HEALTH EXPENDITURE REPORT 1997-2017 iii MALAYSIA NATIONAL HEALTH ACCOUNTS HEALTH EXPENDITURE REPORT 1997-2017
MESSAGE FROM THE SECRETARY-GENERAL MINISTRY OF HEALTH, MALAYSIA
Healthcare system in the country has evolved in response to changing disease patterns, rising prevalence of non-communicable diseases, rapid technology advancements, increasing health care cost and use of much more complex and expensive modalities, to name a few factors. There are increasing demands by analysts and policy makers for health expenditure information for health planning and management to improve the health sector’s growth and provide an effective healthcare system.
The Malaysia National Health Accounts (MNHA) report is important as it provides reliable, accurate and relevant macro-level financial information for effective health care planning by assisting policy makers to arrive at evidence-based decisions with confidence. The MNHA report identifies and measures the overall national health care expenditure covering both public and private sectors.
Various public and private agencies were involved in providing the related information and data which is then analysed to produce this report. I would like to take this opportunity to thank the multiple agencies and data sources for their contributions and I hope that they will continue to work closely together to support future MNHA work.
My gratitude also extends to all members of the MNHA Steering Committee for their persistent participation and contributions. I also applaud the MNHA Section for producing regular national level expenditure data that provide excellent reference on the health expenditure trend of the country over a time period. This shall contribute to the national efforts in moving forward towards efficient healthcare system to achieve the ultimate goal of a developed nation.
Thank you.
Dato’ Seri Dr. Chen Chaw MinSecretary-General Ministry of Health, Malaysia

MALAYSIA NATIONAL HEALTH ACCOUNTS HEALTH EXPENDITURE REPORT 1997-2017 iiiii MALAYSIA NATIONAL HEALTH ACCOUNTS HEALTH EXPENDITURE REPORT 1997-2017
MESSAGE FROM THE DIRECTOR-GENERAL OF HEALTH MALAYSIA
National progress and productivity is very much dependent on the country’s healthcare system. The Ministry of Health (MOH) in conjunction with multiple stakeholders play vital roles in ensuring the implementation of health-related policies in order to improve the nation’s health system. Malaysia National Health Accounts (MNHA) produces annual national health expenditure reports, where macro-level health expenditure data is obtained from various sources of public and private sectors. These reports assist in evidence-based decisions by health policy-makers to ensure affordable, equitable and accessible health care system.
As in previous reports, comparable time series expenditure data is produced using internationally accepted standardized methodology. In 2017, Malaysia reports Total Expenditure on Health (TEH) as 4.24 percent of GDP based on national MNHA framework and reports Current Health Expenditure (CHE) in 2016 as 3.8 percent of GDP internationally based on System of Health Accounts (SHA) framework.
I would like to take this opportunity to highlight a new chapter in this year’s MNHA report about expenditure on Primary Care (PC) and Primary Health Care (PHC). PHC is the thrust of Malaysian healthcare system, and hence PHC and PC expenditure both have the potential to boost investment on primary health care and motivate related policy solution.
I look forward for continuous production of annual Malaysia National Health Expenditure report, to provide detailed national health expenditure with the ultimate goal of re-engineering the healthcare system to be even better for future generations.
Thank you.
Datuk Dr. Noor Hisham bin Abdullah Director-General of Health Malaysia

MALAYSIA NATIONAL HEALTH ACCOUNTS HEALTH EXPENDITURE REPORT 1997-2017 iiiii MALAYSIA NATIONAL HEALTH ACCOUNTS HEALTH EXPENDITURE REPORT 1997-2017
ACKNOWLEDGEMENT
It is our pleasure, the team of MNHA to express our utmost gratitude to YBrs. Dr. Hj. Nordin bin Saleh, the Director of Planning Division , YBhg Datuk Dr. Hj. Rohaizat bin Hj. Yon, our ex-Director of Planning Division and YBrs. Dr. Rozita Halina binti Tun Hussein, Senior Deputy-Director of Planning Division (Health Financing, Informatics and Accounts Planning Branch), for their timely advice and overwhelming support provided in making this Malaysia National Health Accounts Health Expenditure Report 1997-2017 a success.
We genuinely thank the members of the MNHA Technical Advisory Committee and newly appointed External Editors on their dedication and keen interest which contributed in betterment of MNHA reporting format and the contents. Special thanks also to all members of the MNHA Steering Committee chaired by the Director-General of Health Malaysia and Secretary-General, Ministry of Health for their guidance and endorsement of MNHA data for this report.
Successful annual publication of MNHA reports has all this while been possible through continuous assistance and co-operation from both public sector and private sector data suppliers. The MNHA team would like to express our appreciation to all our data providers, and we look forward to future communication and collaboration to further enhance the quality and contents of the MNHA reports.

Message by Secretary-General, Ministry of Health, Malaysia i
Message by Director-General of Health Malaysia ii
Acknowledgement iii
Contents iv
List of Tables vi
List of Figures ix
List of Appendix Tables xi
List of Abbreviations xii
Executive summary xv
Report information xvii
1 Background 1
2 Malaysia National Health Accounts (MNHA): Summary of Framework 2
2.1 Overview of Total Expenditure on Health 2
2.2 The MNHA Classification 3
2.3 The SHA Classification 3
3 Methodology of Data Collection and Analysis 5
3.1 General Methodology 5
3.2 Data Collection and Analysis 5
3.3 Data Processing of Various Agencies 7
3.4 MNHA Estimation of Constant Value 12
4 Total Expenditure on Health 14
4.1 Total Expenditure on Health 14
4.2 Per Capita Health Expenditure 16
4.3 Health Expenditure by States 18
5 Health Expenditure by Sources of Financing 20
5.1 Health Expenditure by Public and Private Sector Sources of Financing 22
5.2 Health Expenditure by Public Sector Sources of Financing
5.2.1 Health Expenditure by All Public Sector Sources of Financing 28
5.2.2 Public Sector Health Expenditure as Percentage of General Government Expenditure
31
5.2.3 Health Expenditure by Public Sector Sources of Financing to Providers 33
5.2.4 Health Expenditure by Public Sector Sources of Financing by Functions 35
CONTENTS
iv MALAYSIA NATIONAL HEALTH ACCOUNTS HEALTH EXPENDITURE REPORT 1997-2017

5.3 Health Expenditure by Private Sector Sources of Financing 38
5.3.1 Health Expenditure by All Private Sector Sources of Financing 38
5.3.2 Health Expenditure by Private Sector Sources of Financing to Providers 41
5.3.3 Health Expenditure by Private Sector Sources of Financing by Functions 44
6 Health Expenditure to Providers of Health Care 47
6.1 Health Expenditure to All Providers of Health Care 49
6.2 Health Expenditure to Providers of Health Care - Hospitals 52
6.3 Health Expenditure to Providers of Health Care - Providers of Ambulatory Health Care 55
6.4 Primary Care and Primary Health Care Expenditure 58
6.4.1 Overview of Primary Care and Primary Health Care 58
6.4.2 Primary Care and Primary Health Care Expenditure 59
7 Health Expenditure by Functions of Health Care 62
7.1 Health Expenditure by All Functions of Health Care 62
7.2 Health Expenditure by Functions of Health Care - Curative Care by Sources of Financing 65
7.3 Health Expenditure by Functions of Health Care - Public Health Services (including Health Promotion and Prevention) by Sources of Financing
68
7.4 Health Expenditure by Functions of Health Care - Health Education and Training by Sources of Financing
71
8 MOH Health Expenditure 74
8.1 MOH Health Expenditure - MOH Share of Total Expenditure on Health and National GDP 74
8.2 MOH Health Expenditure - MOH Hospital 76
8.2.1 MOH Health Expenditure - MOH Hospital, Sources of Financing 77
8.2.2 MOH Health Expenditure - MOH Hospital, Function of Curative Care 80
9 Out-of-Pocket Health Expenditure 83
9.1 Out-of-Pocket Health Expenditure - OOP Share of Total Expenditure on Health and National GDP
84
9.2 Out-of-Pocket Health Expenditure to Providers 88
9.3 Out-of-Pocket Health Expenditure by Functions 93
10 International NHA Data 97
Appendix Tables 102
List of Committees and Members 112
MALAYSIA NATIONAL HEALTH ACCOUNTS HEALTH EXPENDITURE REPORT 1997-2017 viv MALAYSIA NATIONAL HEALTH ACCOUNTS HEALTH EXPENDITURE REPORT 1997-2017
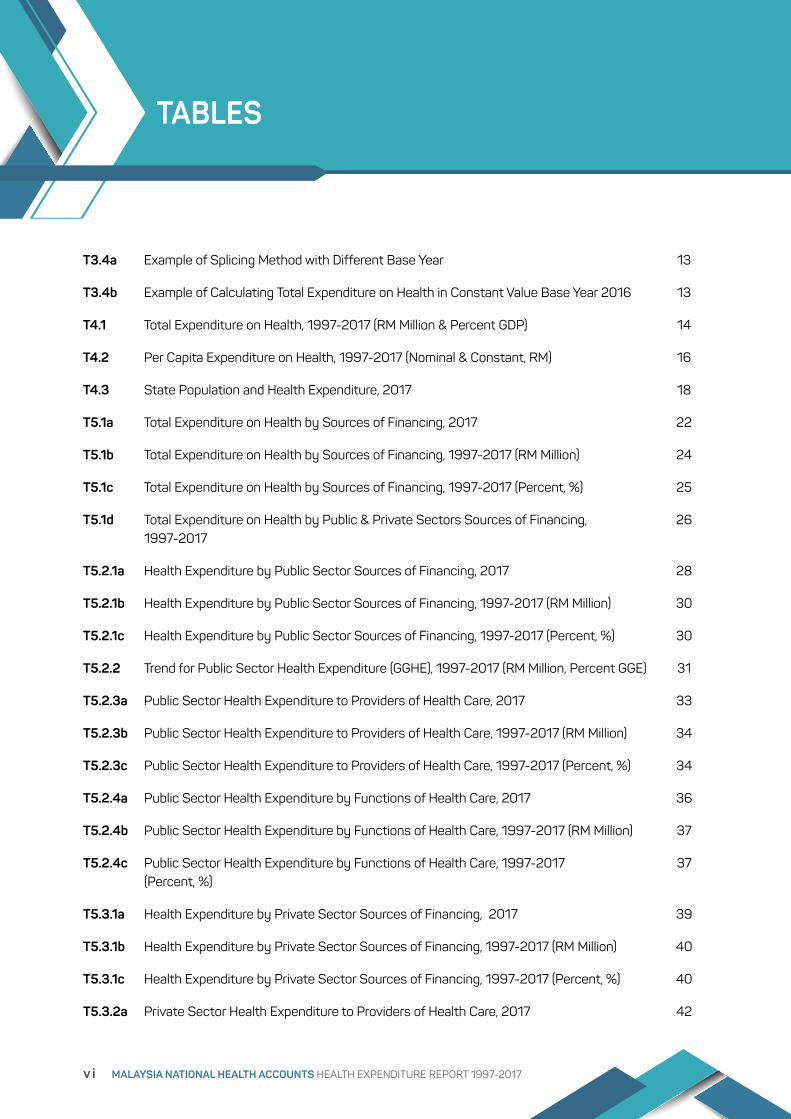
T3.4a Example of Splicing Method with Different Base Year 13
T3.4b Example of Calculating Total Expenditure on Health in Constant Value Base Year 2016 13
T4.1 Total Expenditure on Health, 1997-2017 (RM Million & Percent GDP) 14
T4.2 Per Capita Expenditure on Health, 1997-2017 (Nominal & Constant, RM) 16
T4.3 State Population and Health Expenditure, 2017 18
T5.1a Total Expenditure on Health by Sources of Financing, 2017 22
T5.1b Total Expenditure on Health by Sources of Financing, 1997-2017 (RM Million) 24
T5.1c Total Expenditure on Health by Sources of Financing, 1997-2017 (Percent, %) 25
T5.1d Total Expenditure on Health by Public & Private Sectors Sources of Financing, 1997-2017
26
T5.2.1a Health Expenditure by Public Sector Sources of Financing, 2017 28
T5.2.1b Health Expenditure by Public Sector Sources of Financing, 1997-2017 (RM Million) 30
T5.2.1c Health Expenditure by Public Sector Sources of Financing, 1997-2017 (Percent, %) 30
T5.2.2 Trend for Public Sector Health Expenditure (GGHE), 1997-2017 (RM Million, Percent GGE) 31
T5.2.3a Public Sector Health Expenditure to Providers of Health Care, 2017 33
T5.2.3b Public Sector Health Expenditure to Providers of Health Care, 1997-2017 (RM Million) 34
T5.2.3c Public Sector Health Expenditure to Providers of Health Care, 1997-2017 (Percent, %) 34
T5.2.4a Public Sector Health Expenditure by Functions of Health Care, 2017 36
T5.2.4b Public Sector Health Expenditure by Functions of Health Care, 1997-2017 (RM Million) 37
T5.2.4c Public Sector Health Expenditure by Functions of Health Care, 1997-2017 (Percent, %)
37
T5.3.1a Health Expenditure by Private Sector Sources of Financing, 2017 39
T5.3.1b Health Expenditure by Private Sector Sources of Financing, 1997-2017 (RM Million) 40
T5.3.1c Health Expenditure by Private Sector Sources of Financing, 1997-2017 (Percent, %) 40
T5.3.2a Private Sector Health Expenditure to Providers of Health Care, 2017 42
TABLES
vi MALAYSIA NATIONAL HEALTH ACCOUNTS HEALTH EXPENDITURE REPORT 1997-2017
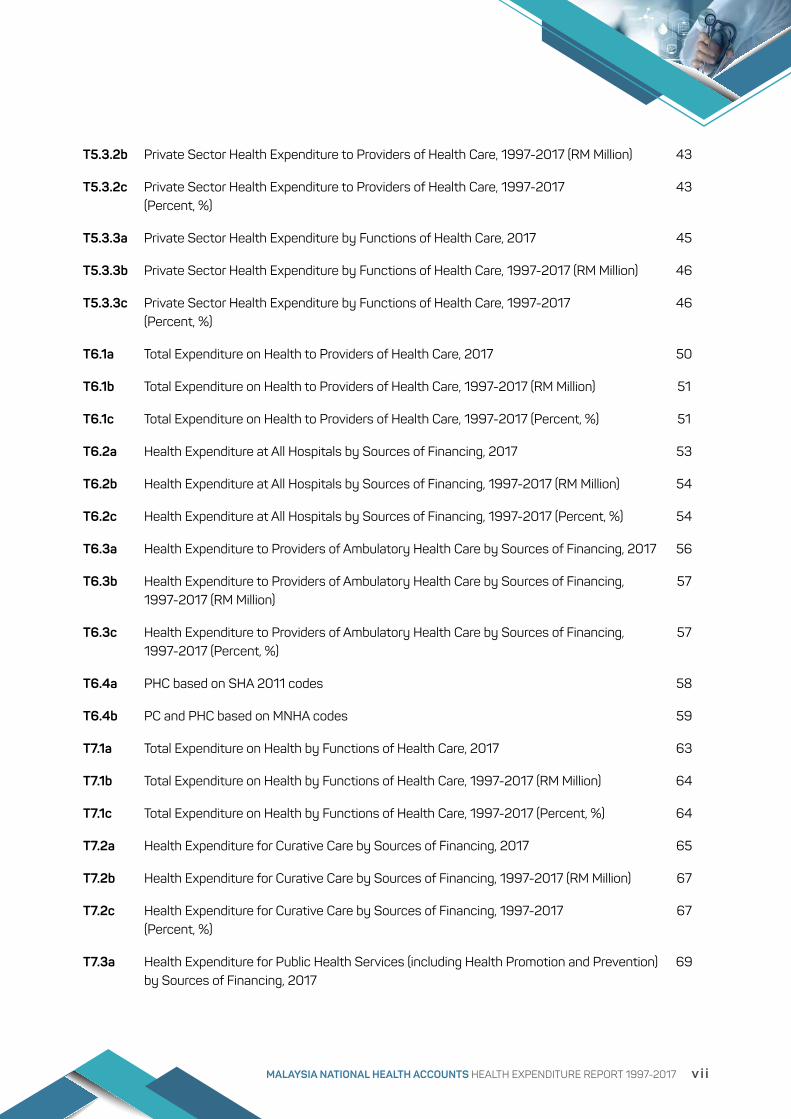
T5.3.2b Private Sector Health Expenditure to Providers of Health Care, 1997-2017 (RM Million) 43
T5.3.2c Private Sector Health Expenditure to Providers of Health Care, 1997-2017 (Percent, %)
43
T5.3.3a Private Sector Health Expenditure by Functions of Health Care, 2017 45
T5.3.3b Private Sector Health Expenditure by Functions of Health Care, 1997-2017 (RM Million) 46
T5.3.3c Private Sector Health Expenditure by Functions of Health Care, 1997-2017 (Percent, %)
46
T6.1a Total Expenditure on Health to Providers of Health Care, 2017 50
T6.1b Total Expenditure on Health to Providers of Health Care, 1997-2017 (RM Million) 51
T6.1c Total Expenditure on Health to Providers of Health Care, 1997-2017 (Percent, %) 51
T6.2a Health Expenditure at All Hospitals by Sources of Financing, 2017 53
T6.2b Health Expenditure at All Hospitals by Sources of Financing, 1997-2017 (RM Million) 54
T6.2c Health Expenditure at All Hospitals by Sources of Financing, 1997-2017 (Percent, %) 54
T6.3a Health Expenditure to Providers of Ambulatory Health Care by Sources of Financing, 2017 56
T6.3b Health Expenditure to Providers of Ambulatory Health Care by Sources of Financing, 1997-2017 (RM Million)
57
T6.3c Health Expenditure to Providers of Ambulatory Health Care by Sources of Financing, 1997-2017 (Percent, %)
57
T6.4a PHC based on SHA 2011 codes 58
T6.4b PC and PHC based on MNHA codes 59
T7.1a Total Expenditure on Health by Functions of Health Care, 2017 63
T7.1b Total Expenditure on Health by Functions of Health Care, 1997-2017 (RM Million) 64
T7.1c Total Expenditure on Health by Functions of Health Care, 1997-2017 (Percent, %) 64
T7.2a Health Expenditure for Curative Care by Sources of Financing, 2017 65
T7.2b Health Expenditure for Curative Care by Sources of Financing, 1997-2017 (RM Million) 67
T7.2c Health Expenditure for Curative Care by Sources of Financing, 1997-2017 (Percent, %)
67
T7.3a Health Expenditure for Public Health Services (including Health Promotion and Prevention) by Sources of Financing, 2017
69
MALAYSIA NATIONAL HEALTH ACCOUNTS HEALTH EXPENDITURE REPORT 1997-2017 viivi MALAYSIA NATIONAL HEALTH ACCOUNTS HEALTH EXPENDITURE REPORT 1997-2017
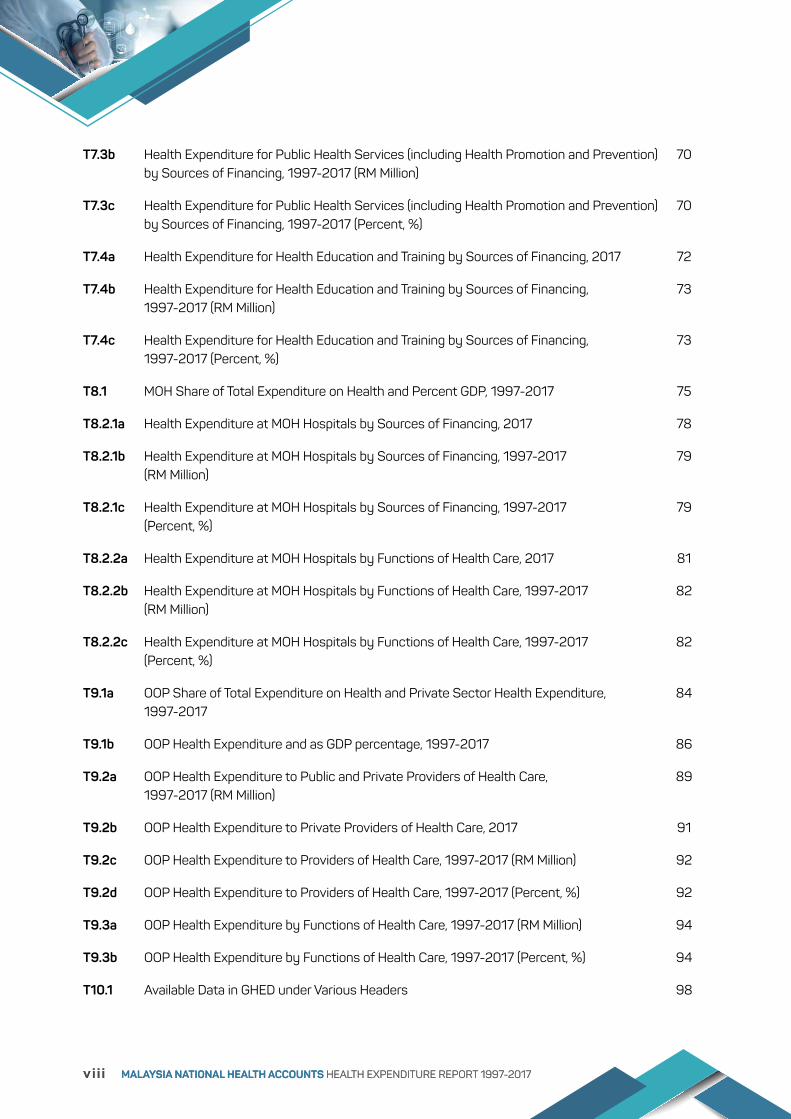
T7.3b Health Expenditure for Public Health Services (including Health Promotion and Prevention) by Sources of Financing, 1997-2017 (RM Million)
70
T7.3c Health Expenditure for Public Health Services (including Health Promotion and Prevention) by Sources of Financing, 1997-2017 (Percent, %)
70
T7.4a Health Expenditure for Health Education and Training by Sources of Financing, 2017 72
T7.4b Health Expenditure for Health Education and Training by Sources of Financing, 1997-2017 (RM Million)
73
T7.4c Health Expenditure for Health Education and Training by Sources of Financing, 1997-2017 (Percent, %)
73
T8.1 MOH Share of Total Expenditure on Health and Percent GDP, 1997-2017 75
T8.2.1a Health Expenditure at MOH Hospitals by Sources of Financing, 2017 78
T8.2.1b Health Expenditure at MOH Hospitals by Sources of Financing, 1997-2017 (RM Million)
79
T8.2.1c Health Expenditure at MOH Hospitals by Sources of Financing, 1997-2017 (Percent, %)
79
T8.2.2a Health Expenditure at MOH Hospitals by Functions of Health Care, 2017 81
T8.2.2b Health Expenditure at MOH Hospitals by Functions of Health Care, 1997-2017 (RM Million)
82
T8.2.2c Health Expenditure at MOH Hospitals by Functions of Health Care, 1997-2017 (Percent, %)
82
T9.1a OOP Share of Total Expenditure on Health and Private Sector Health Expenditure, 1997-2017
84
T9.1b OOP Health Expenditure and as GDP percentage, 1997-2017 86
T9.2a OOP Health Expenditure to Public and Private Providers of Health Care, 1997-2017 (RM Million)
89
T9.2b OOP Health Expenditure to Private Providers of Health Care, 2017 91
T9.2c OOP Health Expenditure to Providers of Health Care, 1997-2017 (RM Million) 92
T9.2d OOP Health Expenditure to Providers of Health Care, 1997-2017 (Percent, %) 92
T9.3a OOP Health Expenditure by Functions of Health Care, 1997-2017 (RM Million) 94
T9.3b OOP Health Expenditure by Functions of Health Care, 1997-2017 (Percent, %) 94
T10.1 Available Data in GHED under Various Headers 98
MALAYSIA NATIONAL HEALTH ACCOUNTS HEALTH EXPENDITURE REPORT 1997-2017 ixviii MALAYSIA NATIONAL HEALTH ACCOUNTS HEALTH EXPENDITURE REPORT 1997-2017viii MALAYSIA NATIONAL HEALTH ACCOUNTS HEALTH EXPENDITURE REPORT 1997-2017

FIGURES
F2.1 Comparison of Total Expenditure on Health in SHA 1.0 and MNHA Framework with Current Health Expenditure in SHA 2011
3
F4.1 Trend for Total Expenditure on Health, 1997-2017 (RM Million & Percent GDP) 15
F4.2 Per Capita Expenditure on Health, 1997-2017 (Nominal & Constant, RM) 17
F4.3 Health Expenditure by States, 2017 (RM Million) 19
F5.0 Organogram of Health Expenditure by Sources of Financing 21
F5.1a Total Expenditure on Health by Sources of Financing, 2017 23
F5.1b Total Expenditure on Health by Sources of Financing (Public vs. Private), 1997-2017 27
F5.2.1 Health Expenditure by Public Sector Sources of Financing, 2017 29
F5.2.2 Trend for Public Sector Health Expenditure (GGHE) as Percentage of General Government Expenditure (GGE), 2017
32
F5.2.3 Public Sector Health Expenditure to Providers of Health Care, 2017 33
F5.2.4 Public Sector Health Expenditure by Functions of Health Care, 2017 36
F5.3.1 Health Expenditure by Private Sector Sources of Financing, 2017 39
F5.3.2 Private Sector Health Expenditure to Providers of Health Care, 2017 42
F5.3.3 Private Sector Health Expenditure by Functions of Health Care, 2017 45
F6.0 Organogram of Health Expenditure to Providers of Health Care 48
F6.1 Total Expenditure on Health to Providers of Health Care, 2017 50
F6.2 Health Expenditure at All Hospitals by Sources of Financing, 2017 53
F6.3 Health Expenditure to Providers of Ambulatory Health Care (non-hospital setting) by Sources of Financing, 2017
56
F6.4a Primary Care Expenditure as Percentage of Total Expenditure on Health, 2017 60
F6.4b Primary Health Care Expenditure as Percentage of Total Expenditure on Health, 2017 60
F6.4c Primary Health Care Expenditure as Percentage of Current Health Expenditure, 2017 61
F6.4d Source of Financing of Primary Health Care Spending, 2017 61
MALAYSIA NATIONAL HEALTH ACCOUNTS HEALTH EXPENDITURE REPORT 1997-2017 ixviii MALAYSIA NATIONAL HEALTH ACCOUNTS HEALTH EXPENDITURE REPORT 1997-2017

F7.1 Total Expenditure on Health by Functions of Health Care, 2017 63
F7.2 Health Expenditure for Curative Care by Sources of Financing, 2017 66
F7.3 Health Expenditure for Public Health Services (including Health Promotion and Prevention) by Sources of Financing, 2017
69
F7.4 Health Expenditure for Health Education and Training by Sources of Financing, 2017 71
F8.1 MOH Share of Total Expenditure on Health and Percent GDP, 1997-2017 76
F8.2.1 Health Expenditure at MOH Hospitals by Sources of Financing, 1997-2017(RM Million)
78
F8.2.2 Health Expenditure at MOH Hospitals by Curative Care Functions of Health Care, 2017 81
F9.1a OOP Share of Total Expenditure on Health, 1997-2017 (Percent, %) 85
F9.1b OOP Share of Private Sector Health Expenditure, 1997-2017 (Percent, %) 85
F9.1c OOP Health Expenditure and Percent GDP, 1997-2017 (RM Million, Percent %) 87
F9.2a OOP Health Expenditure to Public and Private Providers of Health Care, 1997-2017 (RM Million)
90
F9.2b OOP Health Expenditure to Private Providers of Health Care, 2017 91
F9.3a OOP Health Expenditure by Functions of Health Care, 2017 (Percent, %) 95
F9.3b OOP Health Expenditure by Functional Proportion, 1997 & 2017 (Percent, %) 96
F10.1 International Comparison of Current Health Expenditure as Percent GDP, 2016 99
F10.2 International Comparison of Per Capita Health Expenditure, 2016 99
F10.3 International Comparison of Domestic Government and Private Health Expenditure, 2016 100
F10.4 International Comparison of Out-of-Pocket Health Financing Scheme as Percent of Current Health Expenditure, 2016
100
F10.5 International Comparison of Social Health Insurance as Percent Government and Compulsory Health Financing Schemes, 2016
101
MALAYSIA NATIONAL HEALTH ACCOUNTS HEALTH EXPENDITURE REPORT 1997-2017 xix MALAYSIA NATIONAL HEALTH ACCOUNTS HEALTH EXPENDITURE REPORT 1997-2017x MALAYSIA NATIONAL HEALTH ACCOUNTS HEALTH EXPENDITURE REPORT 1997-2017

APPENDIX TABLES
A1.1 Source of Data (Data Sources for Public Sector Estimation) 102
A1.2 Source of Data (Data Sources for Private Sector Estimation) 103
A2.1 Classification of Total Expenditure on Health by Sources of Financing 104
A2.2 Classification of Total Expenditure on Health by Providers of Health Care 105
A2.3 Classification of Total Expenditure on Health by Functions of Health Care 106
A3.1 Global Health Expenditure Database (GHED), WHO Indicators And Data 107
A3.2 Global Health Expenditure Database (GHED), WHO Indicators And Data 108
A3.3 Global Health Expenditure Database (GHED), WHO Indicators And Data 109
A4.1 List of Available Data under “Indicators” in NHA GHED Website 110
A4.2 List of Available Data under “Health Expenditure Data” in NHA GHED Website 111
MALAYSIA NATIONAL HEALTH ACCOUNTS HEALTH EXPENDITURE REPORT 1997-2017 xix MALAYSIA NATIONAL HEALTH ACCOUNTS HEALTH EXPENDITURE REPORT 1997-2017

ABBREVIATIONS
AADK Agensi Anti Dadah Kebangsaan (National Anti-Drug Agency)
AGD Accountant General’s Department of Malaysia
APM Angkatan Pertahanan Awam Malaysia (Malaysia Civil Defence Force)
BNM Bank Negara Malaysia (Central Bank of Malaysia)
CHE Current Health Expenditure
CKAPS Cawangan Kawalan Amalan Perubatan Swasta, Bahagian Amalan Perubatan (Private Medical Practice Control Section, Medical Practice Division)
COICOPS Classification of Individual Consumption by Purpose
CORPS Corporations
DC Day care
DOSH Department of Occupational Safety and Health
DOSM Department of Statistics Malaysia
DSWM Department of Social Welfare Malaysia
EPF Employees Provident Fund
EMRS Emergency Medical Rescue Services
EPU Economic Planning Unit
FOMCA Federation of Malaysia Consumers Association
FOMEMA Foreign Worker’s Medical Examination Monitoring Agency
FT Federal Territory
GDP Gross Domestic Product
GGE General Government Expenditure
GGHE General Government Health Expenditure / Public Sector Health Expenditure
GHED Global Health Expenditure Database
HC ICHA code for function of health services
HC.R ICHA code for health-related services
HES Household Expenditure Survey
HIES Household Income and Expenditure Survey
HF ICHA code for sources of financing for health services
HH Household consumption
HP ICHA code for providers of health services
xii MALAYSIA NATIONAL HEALTH ACCOUNTS HEALTH EXPENDITURE REPORT 1997-2017
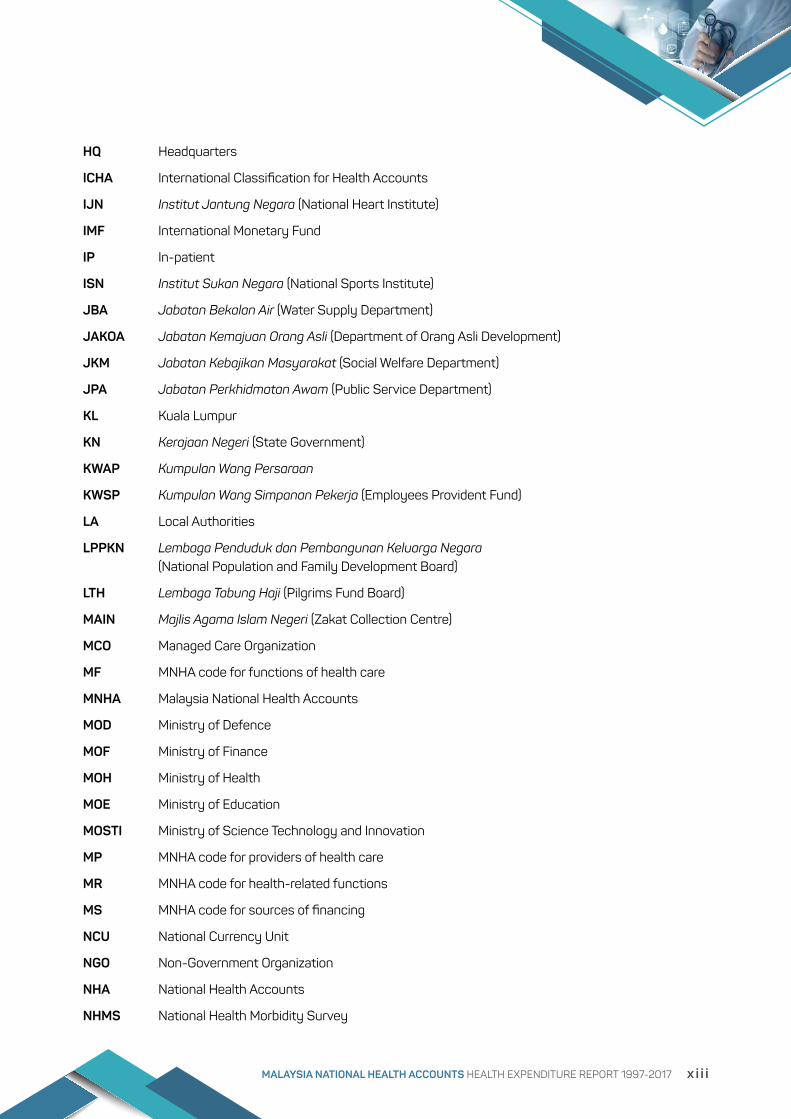
HQ Headquarters
ICHA International Classification for Health Accounts
IJN Institut Jantung Negara (National Heart Institute)
IMF International Monetary Fund
IP In-patient
ISN Institut Sukan Negara (National Sports Institute)
JBA Jabatan Bekalan Air (Water Supply Department)
JAKOA Jabatan Kemajuan Orang Asli (Department of Orang Asli Development)
JKM Jabatan Kebajikan Masyarakat (Social Welfare Department)
JPA Jabatan Perkhidmatan Awam (Public Service Department)
KL Kuala Lumpur
KN Kerajaan Negeri (State Government)
KWAP Kumpulan Wang Persaraan
KWSP Kumpulan Wang Simpanan Pekerja (Employees Provident Fund)
LA Local Authorities
LPPKN Lembaga Penduduk dan Pembangunan Keluarga Negara (National Population and Family Development Board)
LTH Lembaga Tabung Haji (Pilgrims Fund Board)
MAIN Majlis Agama Islam Negeri (Zakat Collection Centre)
MCO Managed Care Organization
MF MNHA code for functions of health care
MNHA Malaysia National Health Accounts
MOD Ministry of Defence
MOF Ministry of Finance
MOH Ministry of Health
MOE Ministry of Education
MOSTI Ministry of Science Technology and Innovation
MP MNHA code for providers of health care
MR MNHA code for health-related functions
MS MNHA code for sources of financing
NCU National Currency Unit
NGO Non-Government Organization
NHA National Health Accounts
NHMS National Health Morbidity Survey
MALAYSIA NATIONAL HEALTH ACCOUNTS HEALTH EXPENDITURE REPORT 1997-2017 xiiixii MALAYSIA NATIONAL HEALTH ACCOUNTS HEALTH EXPENDITURE REPORT 1997-2017

NIOSH National Institute of Occupational Safety and Health
NRI Non-residual items
OECD Organization for Economic Co-operation and Development
OFA Other Federal Agencies
OOP Out-of-Pocket
OP Out-patient
OTC Over the counter
PBT Pihak Berkuasa Tempatan (Local Authorities)
PC Primary Care
PEMANDU Performance Management and Delivery Unit
PHC Primary Health Care
PNI Professional and Industrial Survey
PPP Purchasing Power Parity
PSD Public Service Department
RI Residual items
RM Ringgit Malaysia (Malaysia Currency)
ROW Rest of the world
SHA System of Health Accounts
SHA 1.0 A System of Health Accounts, Version 1.0 (published in 2000)
SHA 2011 A System of Health Accounts, 2011 Edition
SOCSO Social Security Organization
SODO Specific object and detailed object code
SSB State Statutory Body
SSM Suruhanjaya Syarikat Malaysia (Company Commission of Malaysia)
TCM Traditional and Complementary Medicine
TEH Total Expenditure on Health
UK United Kingdom
UKAS Unit Kerjasama Awam Swasta (Public Private Partnership Unit)
UN United Nations
UNDP United Nations Development Programme
USA United States of America
USD US Dollar
vs Versus
WHO World Health Organization
WB World Bank
xiv MALAYSIA NATIONAL HEALTH ACCOUNTS HEALTH EXPENDITURE REPORT 1997-2017xiv MALAYSIA NATIONAL HEALTH ACCOUNTS HEALTH EXPENDITURE REPORT 1997-2017

EXECUTIVE SUMMARY
The MNHA team was established in September 2005 under the Planning and Development Division, Ministry of Health. Throughout the last fourteen years MNHA has produced multiple reports which contain macro level health expenditure information. These data has been useful for policy makers, researchers and related stakeholders.
The data in this report comprises health expenditure data of twenty one years (1997-2017) which was extracted from our national health expenditure database. As a reminder to all NHA report users, due to the methodology used during the NHA data production; it is advisable to use the latest available report as the most current data replaces all previous annual data.
The MNHA Framework is based on the SHA 1.0 classifications with some minor modifications to suit local policy. Similar to the SHA 1.0 classifications, the MNHA classifies all expenditures into three main entities: (1) Sources of financing (MS); (2) Providers of health care (MP); and (3) Functions of health care (MF). The method of data collection and analysis used in this report conforms to the method used in the previous cycle whereby detailed definitions of what constitutes health expenditure, institutional entities and types of disaggregation were drawn up based on inputs from several documents, committee meetings, and consultative advice from sources within and outside the MOH. Both primary and secondary data were used in this analysis as well as from the public and private health sectors. These data were obtained through multiple MNHA surveys and other surveys, data extraction during previous state visits, data extraction from other datasets and through discussions and meetings. The secondary health expenditure data
were retrieved through various data sources, reports, bulletins and other documents. The response rate from all data sources in 2017 was 85%.
In 2017, Malaysia reports Total Expenditure on Health (TEH) at RM57,361 million which is 4.24 percent of GDP based on MNHA framework. Per capita expenditure on health in nominal value reported as RM1,790. Selangor, a state with the largest population of about 6 million people had the highest expenditure on health of RM10,020 million. In terms of public and private expenditure, the public and private sectors health expenditure were 51% and 49% respectively. The Public Sector Health Expenditure (GGHE) as percentage of General Government Expenditure (GGE), increased from RM4,360 million in 1997 to RM29,338 million in 2017 which is equivalent to an increase from 4.84 to 7.34 percent over the 21-years’ time period
Using the MNHA Framework in 2017, a total amount of RM24,715 million or 43% of TEH has been spent by MOH. In relation to GDP, MOH health expenditure takes up 1.83 percent of the national GDP in the same year. OOP health expenditure amounts to RM21,573 million, which is equivalent to 38% of the Total Expenditure on Health and 77% share of the private sector health expenditure and at 1.59 percent of GDP.
Analysis of providers of health care shows that all hospitals consumed RM31,595 million or 55% of TEH in 2017 followed by providers of ambulatory health care at RM11,901 million or 21%. Primary Care (PC) expenditure is reported as RM10,880 million or 19% of the TEH in 2017 while Primary Health Care (PHC) shows higher value which was RM12,516 million or 22% of the TEH.
MALAYSIA NATIONAL HEALTH ACCOUNTS HEALTH EXPENDITURE REPORT 1997-2017 xvxiv MALAYSIA NATIONAL HEALTH ACCOUNTS HEALTH EXPENDITURE REPORT 1997-2017

In 2017, a total of RM40,166 million or 70% of TEH is for services of curative care. The source of financing for services of curative care is RM20,713 million (52%)from the public sector and the remaining RM19,453 million or 48% from the private sector. In the public sector 84% and in the private sector 70% of the services of curative care expenditure were spent at hospitals and the remaining in both sectors were spent at non-hospital services of curative care providers.
MNHA also managed to migrate towards new SHA 2011 framework by end of 2018. Instead of TEH, CHE
has been used by WHO for international comparison. In 2016, based on WHO GHED database, CHE of Malaysia was 3.8 percent GDP which was lower than neighbouring countries such as Singapore, Philippines, China, Sri Lanka and Korea but higher than other regional countries such as Thailand, Indonesia and Bangladesh. Health expenditures in developed countries like Australia, UK, Japan, France and Germany were between 9 to 11 percent GDP with USA at 17% GDP. Likewise the per capita health expenditure of developed countries ranged from two to four times of Malaysia with USA as the outlier.
xvi MALAYSIA NATIONAL HEALTH ACCOUNTS HEALTH EXPENDITURE REPORT 1997-2017xvi MALAYSIA NATIONAL HEALTH ACCOUNTS HEALTH EXPENDITURE REPORT 1997-2017

REPORT INFORMATION
This publication on the Malaysia National Health Accounts (MNHA) contains twenty one years of national health expenditure data from 1997 to 2017, estimated using standardised and internationally acceptable National Health Accounts (NHA) methodology.
The reporting format follows closely the MNHA Framework and is kept almost similar to previous reporting format with the addition of a few editorial improvements for ease of reading and new sections. The “Malaysia National Health Accounts: Health Expenditure Report 1997-2017” has a total of ten chapters.
Chapter 1 provides background of the report followed by Chapter 2 on the summary of the MNHA Framework and Chapter 3 on the methodology used. Chapters 4 to 7 provide details of health expenditure based on the MNHA Framework. Chapter 8 shows MOH health expenditure, Chapter 9 provides household out-of-pocket health expenditure and Chapter 10 contains international health data comparisons.
Most of the data for 2017 are exhibited in either diagrams or tables, followed by figures of the 1997-2017 time series data. All data are in nominal values and reported in Ringgit Malaysia (RM) unless stated otherwise. However, it should be noted that the best method for annual comparisons is based on data that have been adjusted for inflation, preferably using GDP deflators. MNHA derived GDP deflators were used to estimate health expenditures in constant values that can be seen in some tables and figures in Chapters 4 and 5.
Chapter 4 contains the Total Expenditure on Health (TEH) trends from year 1997 to 2017, as percentage of Gross Domestic Products (GDP), the per capita health expenditures for the same period, and state disaggregation of health expenditure. Chapter 5 contains data on the major categories of the sources of financing, namely the public and private sectors. It also contains expenditures of the various agencies under these two sectors. Both sectors’ data are then separately cross-tabulated with the dimensions of providers and functions of health care. Every set of data is also accompanied by similar time-series data. The Public Sector Health Expenditure is equivalent to the General Government Health Expenditure (GGHE) as the term internationally used, which include all public sector sources of financing as stipulated in the MNHA Framework under MS1 codes, and GGHE as percentage of General Government Expenditure (GGE) is under this chapter.
Chapter 6 and 7 provide data on the Total Expenditure on Health by providers and functions of health care. In addition, Chapter 6 also shows data on separate cross-tabulations between hospital and ambulatory care expenditure with sources of financing. Under Chapter 6, a new section regarding Primary Care (PC) and Primary Health Care (PHC) Expenditure has been added. Chapter 7 provides data on separate cross-tabulations of curative care function, expenditures for public health programmes (including health promotion and prevention), and expenditures for health education and training by sources of financing. Chapter 8 shows Ministry of Health’s (MOH) expenditure as share of TEH and the national GDP. It also contains data on separate cross-tabulations between MOH hospital expenditure with sources of financing and functions of health care.
MALAYSIA NATIONAL HEALTH ACCOUNTS HEALTH EXPENDITURE REPORT 1997-2017 xviixvi MALAYSIA NATIONAL HEALTH ACCOUNTS HEALTH EXPENDITURE REPORT 1997-2017

Chapter 9 shows Out-of-Pocket (OOP) health expenditure, OOP share of total and private sector expenditure as percentage of GDP, OOP as share of national GDP, as well as OOP by providers and functions of health care. Chapter 10 contains some international comparisons of MNHA data with NHA data from neighbouring and regional countries as well as some developed countries.
The appendix tables at the end of the report list the data sources from public and private sectors and tables related to Chapter 10.
It is important to note that the data shown in this report is based on the methodology stated under Chapter 3. Tables and figures are used to display the NHA data. Some of the figures on proportions have been adjusted
to total up to 100%. Components on tables may not add to total of 100% due to rounding up.
We would like to enlighten the readers regarding the colour scheme used in the charts of this report. All public sectors were highlighted in blue colour while private sectors were in red colour. Purple colour was used for combination of both private and public sectors.
As is the case in all reported NHA data from any country, refinements in internationally accepted methodology and inputs from new additional data source may lead to annual changes in the figures. Therefore, it is advisable to refer to the most recent MNHA data and publication for policy decisions and research purposes.
xviii MALAYSIA NATIONAL HEALTH ACCOUNTS HEALTH EXPENDITURE REPORT 1997-2017

BACKGROUND
The Malaysia National Health Accounts (MNHA) data provides a wealth of useful macro-level health expenditure information for policy makers, researchers and relevant stakeholders. The importance of these data is emphasised with the renewed need and interest in health financing reform for the country. Some knowledge on the background of this data will assist to better understand MNHA. MNHA started as a project by the Ministry of Health (MOH) with strong support from the Economic Planning Unit (EPU) of the Prime Minister’s Department. This Malaysia National Health Accounts Project (2001-2005) was funded mainly by the United Nations Development Programme (UNDP) and resulted in the production of the Malaysia National Health Accounts Project, Report on The MNHA Classification System (MNHA Framework) and the first MNHA report, Malaysia National Health Accounts Project, Health Expenditure Report (1997-2002). The outputs of this project were instrumental in the establishment of the Malaysia National Health Accounts (MNHA) Unit under the Planning & Development Division of MOH. Subsequently the MNHA Unit produced two other reports, MNHA Health Expenditure Report (1997-2006) and MNHA Health Expenditure Report (2007 & 2008).
By 2009 the country had produced three different reports containing national health expenditure data spanning over a 12 year period (1997 to 2008). These data were produced in several cycles of MNHA estimations with some variations in data sources and methodology. However, acceptable annual data comparison requires standardized methods of estimations for every year. This means ideally the method of analysis for 2008 should be applicable to 1997 analysis. This requirement resulted in the revision of previous MNHA estimations while proceeding to do the subsequent year analysis. After some challenging experiences and under close guidance
CHAPTER 1
from international consultant, the MNHA Health Expenditure Report Revised Time Series (1997-2008) and MNHA Health Expenditure Report 2009 was produced. This contained comparable annual NHA data using internationally acceptable standardized method of analysis. Subsequently a second report under the application of the new standardized method was published as the MNHA Health Expenditure Report (1997-2011). This report was later replaced by the MNHA Health Expenditure Report 1997-2011 Revision due to some error during the final analysis stage. Following this, the third time series report (1997-2012), fourth time series report (1997-2013), fifth time-series report (1997-2014), sixth time series report (1997-2015) and seventh time series (1997-2016) were later published annually. The latest report MNHA Health Expenditure Report 1997-2017 is also available on the Ministry of Health’s website.
In 2018, MNHA has progressed to produce the eighth comparable annual time series data spanning over a 21-year period by using similar methodology and reporting format with further refinements. The chapters in this publication covers some general expenditure overviews followed by expenditure reports using the standard NHA framework, which are expenditures by sources of financing, expenditures by providers of health care, and expenditures by functions of health care. The health expenditure disaggregation by states was also carried out and reported in this publication. Tables and figures are used to display the NHA data. Some of the figures on proportions have been adjusted to total up to 100%. Components on tables may not add to total of 100% due to rounding up. For those who require references to trends over time periods, whenever possible, the revised 1997 to 2017 time series data is inserted between the detailed 2017 cross-sectional data. It is reminded that most of the data are in nominal Ringgit Malaysia (RM) values unless indicated otherwise.
It is important to remind the users of any NHA report that due to the methodology in which NHA data are produced, the data in the most
current report replaces all annual data stated in previous publications.
MALAYSIA NATIONAL HEALTH ACCOUNTS HEALTH EXPENDITURE REPORT 1997-2017 1

National Health Accounts are basically standard sets of tables containing comprehensive, consistent, comparable, compatible and timely national health expenditure over a specified period. “A System of Health Accounts, Version 1.0” (SHA 1.0) manual published by the Organization for Economic Co-operation and Development (OECD) in year 2000 has been adopted by the World Health Organization (WHO) as a basis for international data collection and comparison. It proposes an integrated system of comprehensive and international comparable accounts and provides a uniform framework of basic accounting rules and a set of tables for reporting health expenditures data. It also provides a more complete picture of the performance of the nation’s health system and the needs of government, private sector analysts and policy makers for health planning purposes.
The SHA 1.0 also proposes an International Classification for Health Accounts (ICHA) in three dimensions, namely health care sources of financing including public and private sectors, health care service providers and health care functions. The MNHA Framework is based on the SHA 1.0 classification with some modifications to meet local policy needs.
2.1. OVERVIEW OF TOTAL EXPENDITURE ON HEALTH
The SHA 1.0 defines the concept of total expenditure on health (TEH) as a standardized definition of which areas of health expenditure in a given year are to be measured and reported in national totals. In SHA 1.0 manual, TEH includes expenditures of ‘health care services and goods by function’ (core functions) and one component of ‘health-related function’ namely
CHAPTER 2
‘gross capital formation’, but excludes expenditure of all other ‘health-related functions’. Core function components in SHA are classified under the codes HC.1-HC.7 and ‘health-related functions’ under the codes HC.R.1-HC.R.7. The ‘health-related functions’ codes are for ‘gross capital formation’, ‘education and training of health care personnel’, ‘research and development in health’, ‘food hygiene and drinking water control’, ‘environmental health’, ‘administration and provision of social services in kind to assist living with disease and impairment’ and ‘administration and provision of health-related cash benefits’ expenditures. The expenditures under codes HC.R.2-HC.R.7 are excluded from TEH in SHA 1.0.
In the MNHA Framework, TEH comprises expenditures from both public and private sectors, which consist of both ‘health expenditures’ and all ‘health-related expenditures’ components. This is different from SHA 1.0 that excludes ‘health-related expenditures’ (codes HC.R.2-HC.R.7) from TEH. ‘Health expenditures’ as defined in the MNHA Framework, consists of all expenditures or outlays of medical care, prevention, promotion, rehabilitation, community health activities, health administration and regulation, and capital formation with the predominant objective of improving health, and these are reflected by core function classifications under the codes MF1-MF7. ‘Health-related expenditures’ classification under the codes MR1, 2, 3 and 9 include expenditures of ‘capital formation of health care provider institutions’, ‘education and training of health personnel’, ‘research and development in health’ and ‘all other health-related expenditures’. For easier understanding, components that make up TEH according to SHA 1.0 and MNHA are as illustrated in Figure 2.1.
MALAYSIA NATIONAL HEALTH ACCOUNTS (MNHA): SUMMARY OF FRAMEWORK
2 MALAYSIA NATIONAL HEALTH ACCOUNTS HEALTH EXPENDITURE REPORT 1997-2017

FIGURE 2.1: Comparison of Total Expenditure on Health in SHA 1.0 and MNHA Framework with Current Health Expenditure in SHA 2011
TEH according to SHA 1.0SHA 1.0 SHA 2011
Code Core Functions
HC.1 Services of curative care
Total Expenditure on Health
Current Health Expenditure
HC.2 Services of rehabilitative care
HC.3 Services of long-term nursing care
HC.4 Ancillary services to health care
HC.5 Medical goods dispensed to out-patients
HC.6 Prevention and public health services
HC.7 Health administration and health insurance
Code Health-Related Functions
HC.R.1 Gross capital formation
HC.R.2 Education and training of health personnel
HC.R.3 Research and development in health
HC.R.4 Food hygiene and drinking water control
HC.R.5 Environmental health
HC.R.6 Administration and provision of social services in kind to assist living with diseases and impairment
HC.R.7 Administration and provision of health related cash-benefits
TEH according to MNHA FrameworkMNHA SHA 2011
Code Core Functions
MF1 Services of curative care
Total Expenditure on Health
Current Health Expenditure
MF2 Services of rehabilitative care
MF3 Services of long-term nursing care
MF4 Ancillary services to health care
MF5 Medical goods dispensed to out-patients
MF6 Prevention and public health services
MF7 Health program administration and health insurance
Code Health-Related Functions
MR1 Capital formation of health care provider institutions
MR2 Education and training of health personnel
MR3 Research and development in health
MR9 All other health-related expenditures
tn SHA 2011
MALAYSIA NATIONAL HEALTH ACCOUNTS HEALTH EXPENDITURE REPORT 1997-2017 3

It should also be noted that from year 2017 onwards, both OECD and WHO countries use Current Health Expenditure (CHE) for international reporting and inter-country comparisons of national health expenditures.
2.2 THE MNHA CLASSIFICATION
The SHA 1.0 classifies all health system expenditure using a tri-axial-system, known as the International Classification for Health Accounts (ICHA), which categorizes health expenditure by:• Sources of financing (HF)• Providers of health care (HP)• Functions of health care (HC)
The MNHA Framework is based on the SHA 1.0 classifications with some minor modifications to suit local policy needs (Appendix Tables A2.1, A2.2, and A2.3). Similar to the SHA 1.0 classifications, the MNHA classifies all expenditures into three main entities:• Sources of financing (MS)• Providers of health care (MP)• Functions of health care (MF)
Sources of financing are defined as entities that directly incur the expenditure and hence control and finance the amount of such expenditure. It includes the public sector expenditure inclusive of the federal government, state government, local authorities, and social security funds, and the private sector
consisting of private health insurance, managed care organizations, out-of-pocket expenditure, non-profit institutions and corporations.
Providers of health care are defined as entities that produce and provide health care goods and services. It is categorized as hospitals, nursing and residential care facility providers, ambulatory health care providers, retail sale and medical goods providers, public health programme providers and general health administration.
Functions of health care include core functions of health care (e.g. services of curative care, rehabilitative care, long term nursing care, ancillary services, out-patient medical goods, public health services, health administration and health insurance) and health-related functions (e.g. capital formation, education and training of health personnel, research and development in health).
2.3 THE SHA CLASSIFICATION
Although the MNHA classification is based on the SHA classification (SHA 1.0), there are some changes in the two sets. Chapter 10 on International NHA Data which is based on SHA 2011 briefly explains the salient differences. However, the rest of the data in various chapters are based strictly on the MNHA Framework.
4 MALAYSIA NATIONAL HEALTH ACCOUNTS HEALTH EXPENDITURE REPORT 1997-2017

CHAPTER 3
3.1 GENERAL METHODOLOGY
A general understanding of the methodology in NHA estimation provides better appreciation of the data. The previous report produced a set of MNHA data from 1997- 2016 and this report contains data from 1997-2017. However, the data in this report over the same time period of 1997-2017 may show some variations compared to the previous report. This is mainly due to variations in responses from multiple data sources at each cycle of estimation. These variations are an acceptable phenomenon under NHA because estimations have to be carried out using standard NHA methodology for agencies that do not provide the requested data and therefore would otherwise have resulted in underestimation of health expenditure. Sometimes agencies are requested to provide their total spending for health-related activities and at other times their data are used to derive at the disaggregation of health expenditure by dimensions of provider or function of health care services and products. Complete lists of the sources of data are documented at every cycle of analysis (Appendix Table A1.1, A1.2). It is difficult to obtain near 100% response rate from all data sources. Any improvements in data responses will minimize estimations of non-responders and reflects a better true data.
3.2 DATA COLLECTION AND ANALYSIS
The method of data collection and analysis used in this report conforms to the method used in the previous cycle whereby detailed definitions of what constitute health expenditure, institutional entities and types of disaggregation were drawn up based on inputs from several documents, committee meetings, and consultative advice from the internal and external MOH sources. The expertise gained through the previous international consultancy is extremely helpful in setting guidelines to ensure that estimation methods are acceptable and reliable under NHA methodology.
Both primary and secondary data were used in this analysis (Appendix Table A1.1 and A1.2). Several agencies both from the public and private sectors provide primary data in several formats. These data were obtained through multiple MNHA surveys and other surveys, data extraction during previous state visits, data extraction from other datasets and even through discussions. The secondary health expenditure data were retrieved through various data sources, reports, bulletins and other documents. All these data were analysed separately by each group of agency. The primary data were entered into various agency master dummy spreadsheets containing unprocessed data from 1997 onwards to the current year. The verification of primary data is important as this affects the several stages of analysis and the quality of final outputs. The main objective of NHA analysis is to conduct data classification and fill in any data gap. The data sets from each source or agency were processed differently depending on the availability and completeness of data. Data classification for each agency was carried out based on the tri-axial MNHA entities of sources, providers and functions. The MNHA Framework enables health expenditure disaggregates to the lowest possible level under the three entities of sources, providers and functions. Any data gaps in each of these disaggregated data from each agency were then subjected to imputation methods used by NHA experts to fill the data gaps. Even these imputation methods vary from agency to agency. As in the past, the final analysis data of each agency were dual coded according to the MNHA classification as well as the SHA 1.0 classification (Appendix Tables A2.1, A2.2, and A2.3). State codes were also assigned to every set of analysis. Data from each agency were then collated before producing the final NHA data. Some of the important data with potential policy implications were then extracted and cross-tabulated to produce various tables and figures that are easily understood by policy makers and other stakeholders. All of these stages of analyses are highly technical and involving several methods that differ under each agency.
METHODOLOGY OF DATA COLLECTION AND ANALYSIS
MALAYSIA NATIONAL HEALTH ACCOUNTS HEALTH EXPENDITURE REPORT 1997-2017 5

Besides a good understanding of NHA framework, personnel involved in NHA production also need to acquire knowledge on the use of specific software. The processes of data entry and analysis were carried out using Microsoft Excel program and statistical software Stata (Version 13). The initial MNHA data preparation, analysis, and coding were done in Microsoft Excel spreadsheets and the final output data files of each agency were uploaded into a final database in Stata. After writing several Stata programs various tables and figures are produced.
As in the previous round of analysis, improvements in quality of NHA data is enhanced by reporting all expenditures incurred for laboratories & radiological investigations as one total for curative care expenditure whenever they are delivered as part of curative care service package. However if expenditures incurred for laboratories and radiological investigations were provided separately, then they are reported under another function code. This is strictly in-keeping to definitions of functions codes under MNHA Framework for curative care services and standalone ambulatory health care centers.
Some unique verification processes of final data outputs for various data sources were also implemented. This involves validation of total estimates for each data source or agency prior to merging for the production of final database. This database is then subjected to a couple more verification measures prior to NHA data extraction to populate the various tables and figures. This report only highlights some selected findings, which may be of use for health policy development and health planning for the country. Further detailed data extractions with cross-tabulations can produce much more data as requested by policy makers and stakeholders.
3.2.1 Standardization of Hospital Expenditure ReportingHospital care as defined in NHA, embodies all services provided by a hospital to patients. This means costs incurred for ancillary services such as pharmacy charges (drugs and non-durable products), surgical costs, laboratory tests, radiological investigations and rehabilitation services are included as part of curative care expenditure.
In older reports, the functional classification, categorised expenditure provided by public MOH hospitals as inpatient, outpatient and day-care; whereas services provided at public non-MOH hospitals (Ministry of Education, Ministry of Defence, National Heart Institute) and private hospitals in addition to in-patient, out-patient and day care were also disaggregated to show ancillary services expenditure separately whenever available.
Under the refined analysis all public and private hospitals services were disaggregated only into three categories as in-patient, out-patient and day-care. This reported curative care services expenditures for public and private hospitals include all ancillary charges as well. This revision provides a more standardized estimation of curative care services spending by both public and private sector hospitals.
3.2.2 Addressing Double CountingMNHA data sources have grown over the years. Explanation on various data sources and how the health expenditure data is obtained from these sources is briefly explained in the earlier sections of this chapter. Over the years there have been increases and changes in the healthcare benefits provided by public and private employers. In addition to providing private health insurance benefits, several employers also allow their employees to claim some of their medical expenses. These claims can be for services of curative care at public MOH and public non-MOH hospitals or clinics. Estimation of expenditure along a two-dimension matrix where one dimension is sources of funds and the other dimension is types of providers, the prevalence of such claims increased the likelihood of double counting the expenditure at public MOH and public non-MOH hospitals.
In the Malaysian context estimated health expenditure for all public hospitals are obtained from the respective data sources who are also providers of health care services (Ministry of Health – budget line data, MNHA yearly survey data from Ministry of Education, Ministry of Defence and National Heart Institute). Data captured through the surveys and secondary budget data provided the total expenses for the services rendered at public MOH and non-MOH hospitals and clinics. This included expenses incurred for services provided
6 MALAYSIA NATIONAL HEALTH ACCOUNTS HEALTH EXPENDITURE REPORT 1997-2017

to public and private employees. All patient revenues collected at these public facilities are channelled to a consolidated fund managed by the treasury. Some of these revenues are payments by employees which can be reimbursed by their employers. Surveys done on these employers also reported spending at various public hospitals which in the previous analysis was also taken into consideration. This would have inflated the actual spending at the public hospitals.
The refined methodology is a downward revision to health care provider’s expenditures, resulting from removal of various agencies reimbursements when it involves claims for treatment received at public MOH and non-MOH hospitals and clinic.
Addressing this double counting is a major focus of the previous revision and accounted for some changes in the total expenditures. This approach in analysis to address double counting is carried out in this round of analysis which is similar to the previous report.
3.2.3 Review of claims from agencies for Health Care Services The data on claims refers to various financiers mainly government agencies which, based on their respective policy, allow their employee and eligible dependents to obtain services at public and private hospitals, clinics or standalone ancillary care centers which can sometimes be reimbursed back to the employee. As explained in paragraph 3.2.1, the previous NHA series addressed standardization of curative care services reporting at hospitals which includes review of the claims data collected from various agencies and ancillary care boundaries.
3.3 DATA PROCESSING OF VARIOUS AGENCIES
The methods used for data processing varied according to the availability, completion and source of data as follows:
3.3.1 Public Sector
3.3.1.1 Ministry of Health (MOH) Health expenditure data of the MOH (1997-
2017) were obtained from the Accountant-
General’s Department of Malaysia (AGD), under the Ministry of Finance (MOF). The AG raw database for the MOH is the primary source of data whereby expenditure data is entered as line item. All health expenditures are disaggregated into the tri-axial coding system under the dimensions of sources of financing, providers and functions of health care based on the MNHA Framework, omitting double counting. Some assumptions are made using budgetary allocations for respective years.
3.3.1.2 Ministry of Education (MOE) The functions of the university hospitals
under the MOE include provision of health care services, health related training and research. Health expenditures of these institutions were mainly for curative care services. Other than these institutions, data (1997-2017) on the cost of training health professionals were obtained from various training colleges, Public Service Department (PSD) and other agencies.
3.3.1.3 Other Federal Agencies (including Statutory Bodies) The agencies under “Other Federal Agencies”
currently consists of seventeen public agencies which include the National Anti-Drug Agency, Prison Department, Malaysia Civil Defence Force, Pension Department of Public Service Department (KWAP), National Heart Institute of Malaysia, Social Welfare Department of Malaysia, Department of Orang Asli Development, National Population and Family Development Board Malaysia, National Institute of Occupational Safety and Health Malaysia (NIOSH), Department of Occupational Safety and Health Malaysia (DOSH), National Sports Institute of Malaysia, Ministry of Science, Technology and Innovation (MOSTI), Federal Statutory Bodies, Institutes, Pilgrims Fund Board and Emergency Medical Rescue Services (EMRS).
The expenditure on health of other Federal Agencies (including Statutory Bodies) was captured from these sources through special MNHA surveys questionnaires which also
MALAYSIA NATIONAL HEALTH ACCOUNTS HEALTH EXPENDITURE REPORT 1997-2017 7

assist to estimate the proportions of this expenditure for disaggregation to providers and functions of health care. Other Federal Agencies (including Statutory Bodies) expenditures are mainly for curative care services, retail sales and medical goods, and research.
3.3.1.4 Local Authorities Health expenditure data of the Local
Authorities were collected from 155 agencies of locals/ municipal governments in Malaysia. Most local authorities provide preventive care services such as disease control and food quality control.
3.3.1.5 (General) State Government This consists of health expenditure by
all thirteen state governments and three Federal Territories which include Kuala Lumpur, Putrajaya and Labuan. Most of the state expenditure is mainly for curative care services, ancillary services and environmental health, such as for water treatment.
3.3.1.6 Ministry of Defence (MOD) The Ministry of Defence provides health
services through its Army Hospitals and Armed Forces Medical and Dental Centres (Rumah Sakit Angkatan Tentera dan Pusat Pergigian Angkatan Tentera). The expenditure on health of this ministry (1997-2017) is captured from these sources, together with MNHA survey to estimate the proportions of this expenditure for disaggregation to providers and functions of health care. The MOD expenditure is mainly for curative care services.
3.3.1.7 Social Security Funds There are two major organizations providing
social security funds; the Employees Provident Fund (EPF) and the Social Security Organization (SOCSO), both of which are mandated by the government. In both, samplings of the medical bill claims were done to obtain health expenditures disaggregation by states to providers and functions and health care services.
3.3.1.8 Other State Agencies (including statutory bodies) Other state agencies consist of statutory
bodies and Zakat Collection Centre (MAIN). The data (1997-2017) on the number of employees and the health expenditure for state statutory bodies were collected from various sources. In addition, the MNHA Survey of state agencies including the statutory bodies provided data on per capita spending as well as expenditure disaggregation to provider and function of health care services.
3.3.2 Private Sector
3.3.2.1 Household Out-of-Pocket (OOP) Health Expenditure Internationally, there are several methods to
estimate household out-of-pocket (OOP) health expenditure. MNHA uses Integrative approach to estimate OOP expenditure. The integrative approach involves examining expenditure flows from the perspective of all agents in the system. This approach comprises of several different health expenditure flows in the system from different perspectives: (i) from the source of financing or consumption (example: Household Expenditure Survey or Household Income and Expenditure Survey (HES/HIES) and (ii) from the provider side (example: private hospital and clinic survey). This combination approach is the best method and highly recommended by NHA international standards.
Although HES/HIES are conducted to collect data on all items of household expenditure, MNHA does not use their estimated OOP. This is because that value provides lower estimates of health spending than specialised health surveys, which focus only on healthcare use. Some of the limitations of HES/HIES survey are sampling error, biases arising from non-sampling errors and significant recall loss (inpatient: 12 months associated with 30-50% loss of recall and outpatient: > 2-3 days associated with 20% loss of recall).
8 MALAYSIA NATIONAL HEALTH ACCOUNTS HEALTH EXPENDITURE REPORT 1997-2017

3.3.2.1.2 Data Source Compilation (a) Gross OOP Expenditure The gross OOP expenditure is the net
reconciliation of various datasets using the consumption and provider approaches. It consists of two groups, namely Residual Items (RI) and Non Residual Items (NRI) which includes the following sources:
(i) Non Residual Items (NRI) • Ministry of Health User Charges • University Hospitals User Charges • National Heart Institute User Charges • Private Hospitals Gross Revenues • Private Clinics Gross Revenues • Private Dentists Gross Revenues • Private Pharmacy Sales • Medical Supplies
(ii) Residual Items (RI) • Medical durables / prosthesis / equipment • Medical Supplies • Ancillary Services • Traditional and Complementary Medicine (TCM) • Traditional Treatment Provider
(b) Third Party Payer Reimbursement The third party payer re-imbursements are the
finances claimed from the various agencies by the OOP payee after the OOP payment is made and includes the following sources:
• Private Insurance Enterprise • Private Corporations • Employees Provident Fund (EPF) • Social Security Organization (SOCSO) • Federal and State Statutory agencies
Each item in the gross spending and third party payer data can be obtained from several data sources (Appendix Table A1.1 and A1.2).
3.3.2.1.3 Residual Items Estimation Residual Items (RI) consists of gross direct
spending for medical durables, medical supplies, ancillary services, TCM and traditional treatment provider. The RI data source is from Household Expenditure (HES) or Household Income and Expenditure Survey (HIES) reported by Department of Statistics Malaysia (DOSM). There are several steps in estimating of RI as follows:
(a) Code and Grouping of HES/HIES The first step is to study similarities and
differences in Classification of Individual Consumption by Purpose (COICOP) of group 5 or 6 items (health services and medical goods) codes for different 5 series HES/HIES surveys (1993/1994, 1997/1998, 2004/2005, 2009/2010 and 2014/2015). This step follows mapping every item of group 5 or 6 based on definitions used in DOSM survey for all HES/HIES survey series.
OOP Health Expenditure = (Gross OOP Health Expenditure – Third Party Payer Reimbursement)+ OOP Expenditure for Health Education & Training
3.3.2.1.1 Integrative Approach In the integrative approach, the gross of direct spending from the consumption, provision and financing
perspective is estimated after deduction of the third-party source of financing payer reimbursements. This deduction is done to avoid double counting and over estimation of the OOP expenditure. The integrative approach under the MNHA Framework uses the formula below to derive at the estimated OOP expenditure:
MALAYSIA NATIONAL HEALTH ACCOUNTS HEALTH EXPENDITURE REPORT 1997-2017 9

(b) Additional Data or Surveys Addit ional data used for expenditure
adjustment in analysis from MNHA surveys by other agencies (example: Accountant General (AG), IMS) and data from others agencies surveys (example: Gross Domestic Product (GDP), Household Consumption, National Health Morbidity Survey (NHMS).
(c) Analysis of RI Expenditure Re-group all items of group 5 or 6 items codes
for different 5 series HES/HIES surveys based on COICOP with weighted expenditures in all series into 18 categories based on the following list:
(i) Pharmaceutical - Prescription (ii) Pharmaceutical - Over the counter (OTC) (iii) Pharmaceutical - Supplement (iv) Pharmaceutical - TCM (v) Other medical products - Medical supply (vi) Therapeutic appliances- Medical durable (vii) Medical OP - Government (viii) Medical OP - Private (ix) Medical OP - Government Corporation (x) Dental OP - Government (xi) Dental OP - Private (xii) Dental OP - Government Corporation (xiii) Ancillary Services (xiv) Ancillary Services-TCM (xv) Ancillary Services-TCM Provider (xvi) Hospital IP-Government (xvii) Hospital IP-Private (xviii) Hospital IP- Government Corporation
Compare IMS pharmaceutical items with COICOP residual items. Identify items in 3 categories (Pharmaceuticals, Supplies and TCM) which are captured in IMS data. Regroup the items as ‘IMS Grouping’. Reassign 18 groups into 10 categories identified in Gross OOP Spending estimation list:
(i) Government Facility User Charges (ii) Private Hospitals Gross Revenues (iii) Private Clinics Gross Revenues
(iv) Private Dentists Gross Revenues (v) Pharmacy Purchases (vi) Medical durables / prosthesis / equipment (vii) Medical Supplies (viii) Ancillary Services (ix) TCM (x) Traditional Treatment Provider
Next is the use of various analytical techniques (smoothing/ straight l ine imputation / interpolation/ extrapolation) to address data noise, fill data gaps, sampling issues and sampling errors, etc. This is followed by estimations to derive at various proportions for adjustment of HES/HIES data to multiple available studies (Professional and Industrial Survey (PNI) and Household Consumption (HH).
A new spreadsheet with five series of HES/HIES expenditure is created based on above 10 categories by direct method of expenditure for all categories. This spreadsheet allows all categories expenditure analysis by indirect method using Household Consumption. This adjusted value is then estimated as a share of GDP to generate the five residual items expenditure. For non-survey years data gaps are filled using linear interpolation technique.
(d) Coding of RI Expenditure to State, Provider and Function Codes The first step is selecting relevant COICOP
codes from each HES/HIES which are RI (exclude NRI and IMS data). For each year of RI re-align/map codes in various HES/HIES surveys to have the same representation for all 5 series HES/HIES surveys. Assign MNHA MP, MF codes and state codes for each COICOP code. Finally, the individual COICOP code is grouped into 10 different combinations of MNHA MP and MF codes.
10 MALAYSIA NATIONAL HEALTH ACCOUNTS HEALTH EXPENDITURE REPORT 1997-2017

3.3.2.1.4 Non-Residual Items Estimation (a) Government Facility User Charges Government facilities collect revenues from
patients in the form of official user charges. Data sources of government user charges consist of:
• AG data - MOH user charges • MNHA MOE survey • MNHA IJN survey
MOH user charges extracted from AG data by SODO Codes for OP, IP and DC are selected and assigned MNHA Provider (MP) and Function (MF) codes. Data from MOE and IJN MNHA Survey are used to assign MP, MF and state codes.
(b) Private Facilities Gross Revenue This consists of three facility revenue at
private hospital, medical clinics and dental clinics. The data source is from Professional and Industrial Survey (PNI) produced by DOSM and MNHA Private Hospital Survey. PNI are rolling surveys which has data gaps and require processing using linear interpolation and GDP values. MNHA Survey data is used to assign MP, MF and state codes. This requires hospital grouping by bed numbers based on Medical Practice Division, MOH list.
(c) Private Pharmacy Purchases Pharmaceutical data on pharmacy channel
from IMS is used for OOP estimation which includes product groups as ethical/prescription, pharmacy and over the counter (OTC). Since IMS data is warehouse price, some estimation is done to get retail price. Each of the three product groups is assign MNHA MP and MF codes. Assignment of state coding is based on number of private stand-alone pharmacies in each state (data from MOH Pharmacy Division).
(d) Private Haemodialysis Private Haemodialysis data source is from
MNHA Private Haemodialysis Survey based on Medical Practice Division, MOH (CKAPS) list. Data from each respondent are assigned MNHA MP, MF & state codes. Currently reported MNHA value is an underestimation as the response rate can be further improved.
3.3.2.1.5 Deduction of Third Party Payers The summation of all gross revenues is
considered as OOP and non-OOP health expenditure. The non-OOP health expenditure has to be deducted as the refundable payments (private insurance, private corporations, SOCSO, EPF and statutory bodies) to estimate the net OOP expenditure. This deduction is done to avoid double counting and over estimation of the OOP expenditure. Also, under the MNHA Framework, unlike the SHA 1.0 framework, the OOP spending is inclusive of expenditure for health-related education and training.
3.3.2.1.6 Training Expenditure Estimation The source of data came from public and
private universities and training institutions conducting training in the field of health at post-secondary and tertiary levels. Data on health personnel in-service training expenditure is currently not available, in part due to the resource intensiveness in the manner of capturing or extracting this type of expenditure which is embedded in other expenditures, such as expenditure for administration at each hospitals and health departments. Data from each respondent are assigned MNHA MP, MF and state codes. Data gaps are filled up using linear interpolation.
MALAYSIA NATIONAL HEALTH ACCOUNTS HEALTH EXPENDITURE REPORT 1997-2017 11

3.3.2.2 Private Corporations / Private Companies More than 90% of the total labour force
works in the private sector and gain medical benefits through the private employer medical benefit scheme. The average per capita health expenditure is calculated based on the survey conducted by Department of Statistic Malaysia (DOSM) on various types of industries. The proportions of providers and functions were estimated based on analysis and via MNHA questionnaires sent to the selected private companies. This expenditure excludes group insurance purchases by large companies for their employees for health purposes as this is captured under private health insurance expenditure.
3.3.2.3 Private Health Insurance The health expenditure of private health
insurance is calculated based on the Medical Health Insurance data from the Central Bank of Malaysia. The data includes individual and grouped insurances data. The proportions for providers and functions of health care are obtained via the MNHA survey of sampled insurance companies.
3.3.2.4 Non-Government Organizations (NGOs) Besides social activities, the non-government
organizations (NGOs) are also involved in health related activities. Health expenditure incurred by the NGOs is obtained through the MNHA survey of these organizations which enables the expenditure disaggregation to providers and functions of health care. The process of obtaining a full list of NGOs and achieving good response rate for this type of source of financing has always been a challenge.
3.3.2.5 Managed Care Organizations (MCO) Under the provisions of the existing law,
only insurance companies are allowed to undertake ‘health risk’. In Malaysia, most of the organizations considered as MCOs are third
party payers. The data obtained from these third party payers were data mainly related to health administration of health insurance.
3.4 MNHA ESTIMATION OF CONSTANT VALUE
Current or Nominal value of health expenditure refers to expenditures reported for a particular year, unadjusted for inflation. Constant value estimates indicate what expenditure would have been when anchored to a particular year value, such as 2016 values applied to all years. As a result, expenditures in different years can be compared on a Ringgit-for-Ringgit basis, using this as a measure of changes in the volume of health goods and services. Constant expenditure adjusts current or nominal values which aim to remove the effects of inflation. Hence, when making health expenditure comparisons over a time series it is more meaningful to use constant values rather than current or nominal values.
In health expenditure estimations under NHA usually the constant value is estimated using GDP deflator. The GDP deflator is a measure of the level of prices of all new, domestically produced, final goods and services in an economy. It is a price index that measures price inflation or deflation. GDP deflator can be calculated using above formula for every series in different base year for GDP current and constant values. GDP current and GDP constant time series data is published every year by Department of Statistics Malaysia (DOSM).
The constant value estimation requires a two-step method whereby the first step involves estimation of a set of GDP deflators. Based on advice from NHA experts the splicing method on series in different base year from 2000 to 2010 can be used to get a series of GDP deflator as shown in Table 3.4a. The second step involves application of this estimated GDP deflator to nominal values for estimation of constant values.
GDP CurrentGDP Deflator = –––––––––––––––– x 100 GDP Constant
12 MALAYSIA NATIONAL HEALTH ACCOUNTS HEALTH EXPENDITURE REPORT 1997-2017

TABLE 3.4a: Example of Splicing Method with Different Base Year
Year 2005 2006 2007 2008 2009 2010 2011
Deflators Base Year 2005 100 104 109 120 113 118
Deflators Base Year 2010 100 105
GDP Deflator Base Year 2010 (Splicing Method) 85 88 92 102 96 100 105
Note: Derived values in italics
TABLE 3.4b: Example of Calculating Total Expenditure on Health in Constant Value Base Year 2016
2009 2010 2011 2012 2013 2014 2015 2016
GDP Deflator Base Year 2010 (Splicing Method)
96 100 105 106 107 108 109 111
TEH Nominal (RM Million) 32,000 35,000 39,000 41,000 46,000 49,000 51,000
TEH Constant (RM Million) 35,520 37,000 40,840 42,533 47,278 49,899 51,000
Monetary values expressed in current values can be converted to constant values base year 2016 using the formula:-
Vcox = Vcurx * (Di / Dx)
Where:-• Vcox is the value expressed in constant values for the
year for which constant prices are to be calculated (Year x)
• Vcurx is the value expressed in the current values applying in Year x
• D refers to the GDP deflator applying in Years x and i, with i being the base year
For example, using the above formula to calculate TEH 2015 in constant value:-• Vcurx = RM49,000• Di = 111• Dx = 109
Then: Vcox = RM49,000 X (111/109) = RM49,899
Thus the value to be used, expressed as constant values at the base year 2016, is RM49,899 rather than the current value of RM49,000.
Example of splicing method using base year 2010 to derive at new GDP deflator for year 2009: = (100/118) x 113 = 96 For year 2008: = (100/118) x 120 = 102
Constant value estimates can be obtained by calculating GDP deflator base year 2016 from the
derived values of GDP deflator base year 2010 which then can be applied to the nominal value of health expenditure. As a result, nominal value increases when expressed in constant value at a particular base year.
This estimation can be demonstrated using 2016 base year and a set of GDP deflator values as shown in Table 3.4b.
MALAYSIA NATIONAL HEALTH ACCOUNTS HEALTH EXPENDITURE REPORT 1997-2017 13

4.1 TOTAL EXPENDITURE ON HEALTH
The Total Expenditure on Health (TEH) for Malaysia between 1997 to 2017 is as illustrated in Table 4.1 and Figure 4.1. There is a gradually increasing pattern of the TEH. Meanwhile, TEH as a share of Gross Domestic Product (GDP) for the same period ranged from 3.03 percent to 4.24 percent of GDP.
Note:*Constant values estimated using MNHA derived GDP deflators (splicing method with 2010 base year)Source: **Department of Statistics Malaysia (DOSM), published in May 2018
TABLE 4.1: Total Expenditure on Health, 1997-2017 (RM Million & Percent GDP)
Expenditure
Year
TEH, Nominal(RM Million)
TEH, Constant (RM Million)*
Total GDP,Nominal
(RM Million)**
MNHA DerivedGDP Deflator*
TEH (Nominal)as % GDP
1997 8,550 15,374 281,795 64 3.03
1998 9,156 15,189 283,243 69 3.23
1999 9,953 16,512 300,764 69 3.31
2000 11,745 18,528 356,401 73 3.30
2001 12,703 20,448 352,579 72 3.60
2002 13,640 21,305 383,213 74 3.56
2003 17,203 25,846 418,769 77 4.11
2004 18,200 25,866 474,048 81 3.84
2005 18,231 24,793 543,578 85 3.35
2006 22,072 28,862 596,784 88 3.70
2007 24,414 30,461 665,340 92 3.67
2008 27,758 31,458 769,949 102 3.61
2009 29,365 35,341 712,857 96 4.12
2010 32,872 37,885 821,434 100 4.00
2011 35,937 39,291 911,733 105 3.94
2012 39,505 42,764 971,252 106 4.07
2013 41,625 44,980 1,018,614 107 4.09
2014 46,828 49,385 1,106,443 109 4.23
2015 50,176 53,110 1,158,513 109 4.33
2016 52,018 54,004 1,231,020 111 4.23
2017 57,361 57,361 1,353,380 115 4.24
CHAPTER 4
14 MALAYSIA NATIONAL HEALTH ACCOUNTS HEALTH EXPENDITURE REPORT 1997-2017

FIGURE 4.1: Trend for Total Expenditure on Health, 1997-2017 (RM Million & Percent GDP)
8,55
0
9,15
6
9,95
3
11,7
45
12,7
03
13,6
40
17,2
03
18,2
00
18,2
31
22,0
72
24,4
14
27,7
58
29,3
65
32,8
72
35,9
37
39,5
05
41,6
25
46,8
28
50,1
76
52,0
18
57,3
61
3.03
3.23
3.31
3.30
3.60
3.56
4.11
3.84 3.35
3.70
3.67
3.61
4.12
4.00
3.94
4.07
4.09
4.23
4.33
4.23
4.24
0.00
0.50
1.00
1.50
2.00
2.50
3.00
3.50
4.00
4.50
5.00
0
5,000
10,000
15,000
20,000
25,000
30,000
35,000
40,000
45,000
50,000
55,000
60,000
65,000
70,000
75,000
1997
19
98
1999
20
00
2001
20
02
2003
20
04
2005
20
06
2007
20
08
2009
20
10
2011
20
12
2013
20
14
2015
20
16
2017
RM
Mill
ion
Perc
ent G
DP
TEH, Nominal (RM Million) TEH (Nominal) as % GDP
MALAYSIA NATIONAL HEALTH ACCOUNTS HEALTH EXPENDITURE REPORT 1997-2017 15

4.2 PER CAPITA HEALTH EXPENDITURE
Per capita expenditure on health in nominal value ranged from RM393 in 1997 to RM1,790 in 2017. In constant values, per capita health expenditure ranged from RM706 in 1997 to RM1,790 in 2017 (Table 4.2 and Figure 4.2).
Note:*Constant values estimated using MNHA derived GDP deflators (splicing method with 2010 base year)Source: ** Department of Statistics Malaysia (Population Quick Info. accessed on 21st May 2018)
TABLE 4.2: Per Capita Expenditure on Health, 1997-2017 (Nominal & Constant, RM)
Expenditure / Population
Year
TEH, Nominal(RM Million)
TEH, Constant (RM Million)*
Per CapitaExpenditure onHealth, Nominal
(RM)
Per CapitaExpenditure on
Health,Constant* (RM)
TotalPopulation**
1997 8,550 15,374 393 706 21,769,200
1998 9,156 15,189 410 680 22,333,500
1999 9,953 16,512 434 721 22,909,400
2000 11,745 18,528 500 789 23,494,900
2001 12,703 20,448 527 848 24,123,400
2002 13,640 21,305 552 862 24,727,100
2003 17,203 25,846 679 1,021 25,320,100
2004 18,200 25,866 703 998 25,905,100
2005 18,231 24,793 689 936 26,477,100
2006 22,072 28,862 823 1,076 26,831,400
2007 24,414 30,461 898 1,120 27,186,000
2008 27,758 31,458 1,008 1,142 27,540,300
2009 29,365 35,341 1,053 1,267 27,895,100
2010 32,872 37,885 1,150 1,325 28,588,800
2011 35,937 39,291 1,237 1,352 29,062,100
2012 39,505 42,764 1,339 1,449 29,509,900
2013 41,625 44,980 1,378 1,489 30,213,800
2014 46,828 49,385 1,525 1,608 30,708,600
2015 50,176 53,110 1,609 1,703 31,186,100
2016 52,018 54,004 1,644 1,707 31,633,400
2017 57,361 57,361 1,790 1,790 32,049,900
16 MALAYSIA NATIONAL HEALTH ACCOUNTS HEALTH EXPENDITURE REPORT 1997-2017
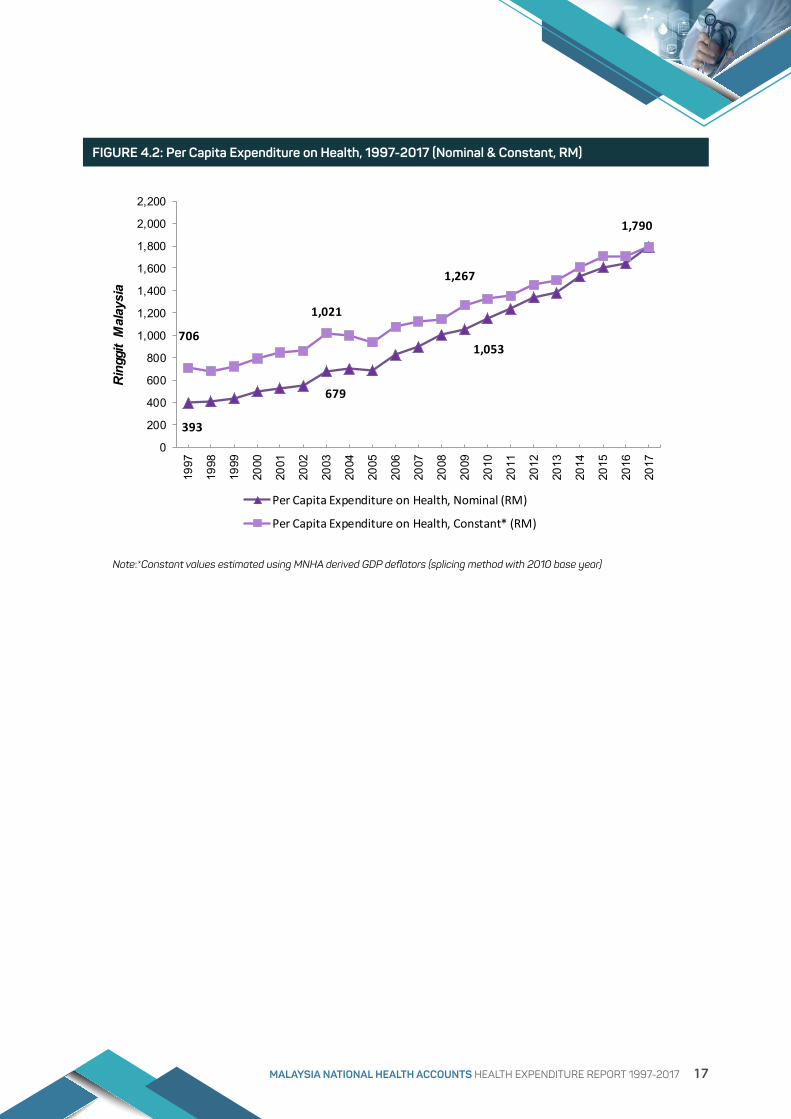
393
679
1,053706
1,021
1,267
1,790
0
200
400
600
800
1,000
1,200
1,400
1,600
1,800
2,000
2,20019
97
1998
1999
2000
2001
2002
2003
2004
2005
2006
2007
2008
2009
2010
2011
2012
2013
2014
2015
2016
2017
Rin
ggit
Mal
aysi
a
Per Capita Expenditure on Health, Nominal (RM)
Per Capita Expenditure on Health, Constant* (RM)
FIGURE 4.2: Per Capita Expenditure on Health, 1997-2017 (Nominal & Constant, RM)
Note:*Constant values estimated using MNHA derived GDP deflators (splicing method with 2010 base year)
MALAYSIA NATIONAL HEALTH ACCOUNTS HEALTH EXPENDITURE REPORT 1997-2017 17
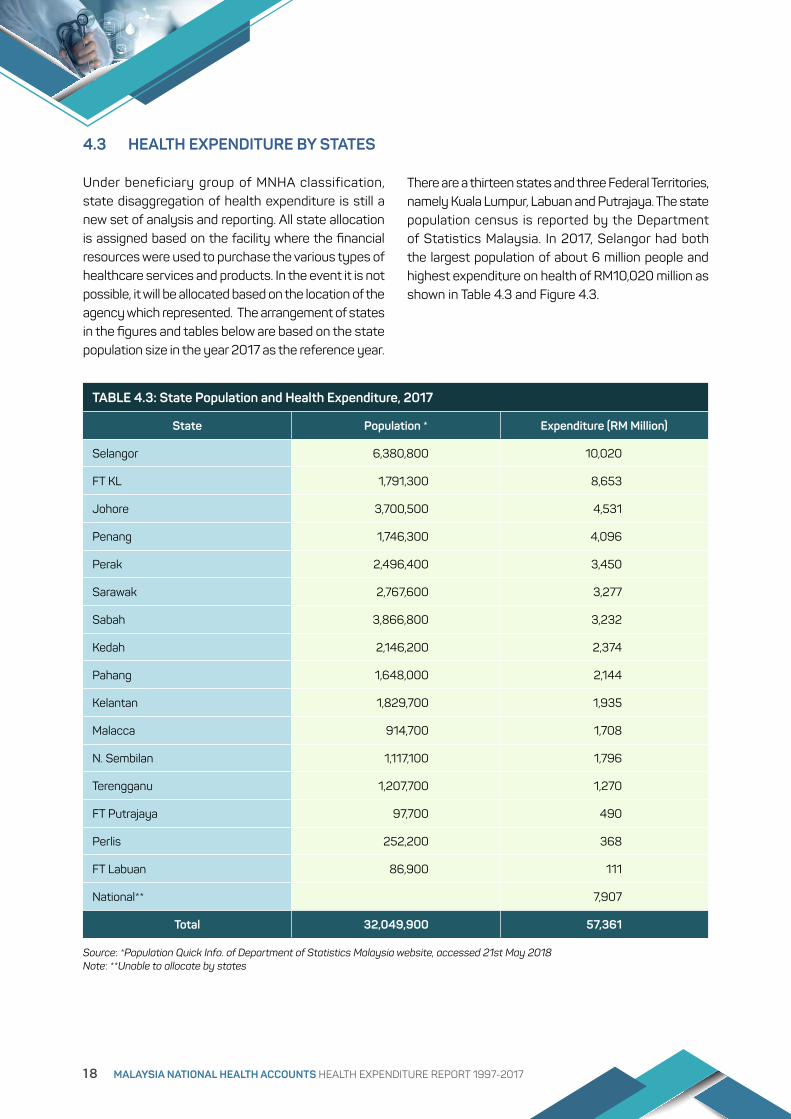
TABLE 4.3: State Population and Health Expenditure, 2017
State Population * Expenditure (RM Million)
Selangor 6,380,800 10,020
FT KL 1,791,300 8,653
Johore 3,700,500 4,531
Penang 1,746,300 4,096
Perak 2,496,400 3,450
Sarawak 2,767,600 3,277
Sabah 3,866,800 3,232
Kedah 2,146,200 2,374
Pahang 1,648,000 2,144
Kelantan 1,829,700 1,935
Malacca 914,700 1,708
N. Sembilan 1,117,100 1,796
Terengganu 1,207,700 1,270
FT Putrajaya 97,700 490
Perlis 252,200 368
FT Labuan 86,900 111
National** 7,907
Total 32,049,900 57,361
Source: *Population Quick Info. of Department of Statistics Malaysia website, accessed 21st May 2018Note: **Unable to allocate by states
There are a thirteen states and three Federal Territories, namely Kuala Lumpur, Labuan and Putrajaya. The state population census is reported by the Department of Statistics Malaysia. In 2017, Selangor had both the largest population of about 6 million people and highest expenditure on health of RM10,020 million as shown in Table 4.3 and Figure 4.3.
4.3 HEALTH EXPENDITURE BY STATES
Under beneficiary group of MNHA classification, state disaggregation of health expenditure is still a new set of analysis and reporting. All state allocation is assigned based on the facility where the financial resources were used to purchase the various types of healthcare services and products. In the event it is not possible, it will be allocated based on the location of the agency which represented. The arrangement of states in the figures and tables below are based on the state population size in the year 2017 as the reference year.
18 MALAYSIA NATIONAL HEALTH ACCOUNTS HEALTH EXPENDITURE REPORT 1997-2017
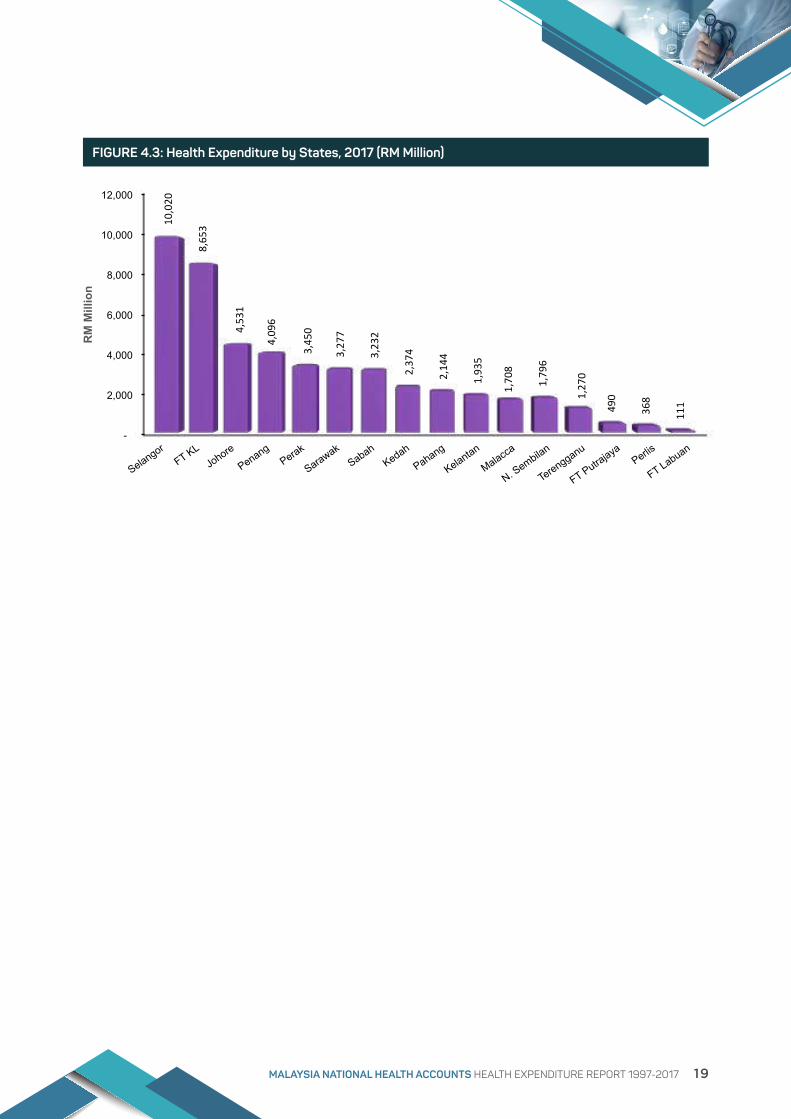
FIGURE 4.3: Health Expenditure by States, 2017 (RM Million)
-
2,000
4,000
6,000
8,000
10,000
12,000
Selangor FT KL
Johore
Penang Perak
Sarawak
Sabah
Kedah
Pahang
Kelantan
Malacca
N. Sembilan
Terengganu
FT Putrajaya
Perlis
FT Labuan
10,
020
8,6
53
4,5
31
4,0
96
3,4
50
3,2
77
3,2
32
2,3
74
2,1
44
1,9
35
1,7
08
1,7
96
1,2
70
490
368
111
RM
Mill
ion
MALAYSIA NATIONAL HEALTH ACCOUNTS HEALTH EXPENDITURE REPORT 1997-2017 19
Sources of financing for health care services and products include multiple public and private sector agencies. The public sector sources of financing are federal government, state government, local authorities and social security funds. As for the private sector, sources of financing include private insurance enterprises, managed care organizations (MCO), private household out-of-pocket (OOP), non-profit institutions, private corporations and rest of the
HEALTH EXPENDITURE BY SOURCES OF FINANCING
world (Appendix Table A2.1). The share of both sectors to the TEH can be identified for each year in the time series. This chapter contains three main sections, namely health expenditure by all sources of financing and specific public sector and private sector health expenditures are separated as section 5.2 and section 5.3 respectively. An overview of health expenditure by sources of financing is shown in Figure 5.0
CHAPTER 5
20 MALAYSIA NATIONAL HEALTH ACCOUNTS HEALTH EXPENDITURE REPORT 1997-2017
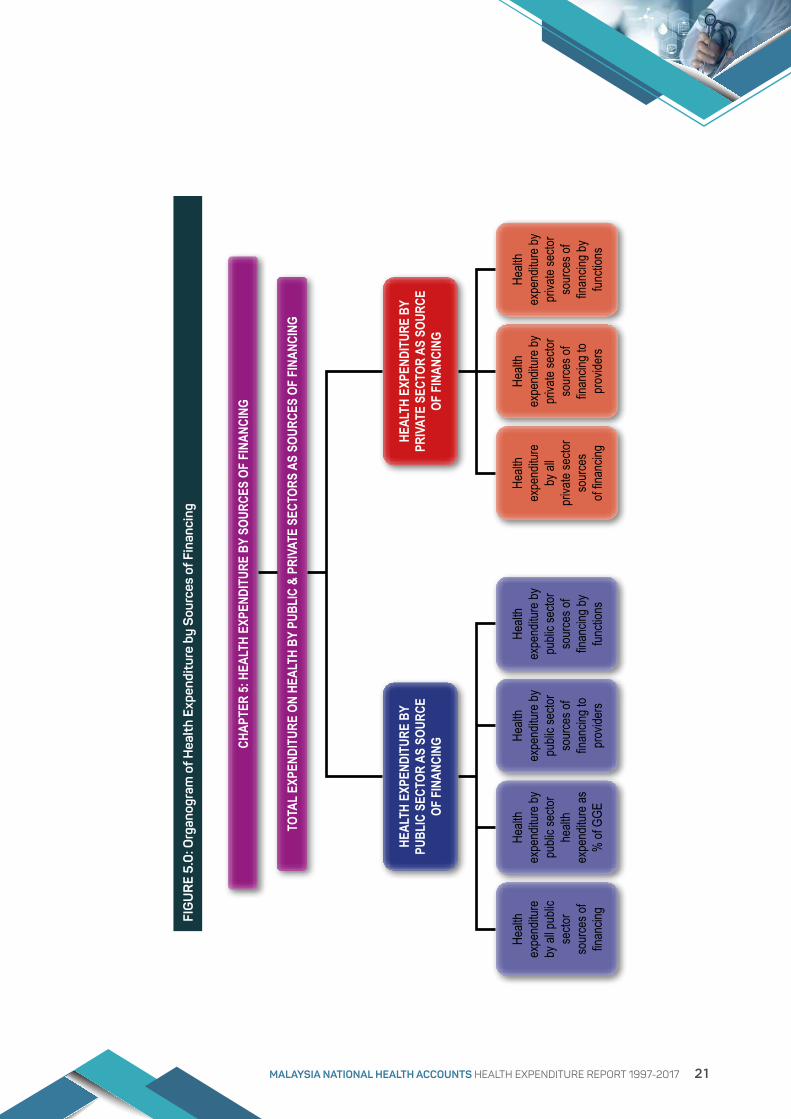
FIG
UR
E 5.
0: O
rgan
ogra
m o
f Hea
lth
Expe
ndit
ure
by S
ourc
es o
f Fin
anci
ng
Healt
h ex
pend
iture
by
all p
ublic
se
ctor
sour
ces o
f fin
ancin
g
Healt
h ex
pend
iture
by
publi
c sec
tor
healt
h ex
pend
iture
as
% of
GGE
Healt
h ex
pend
iture
by
publi
c sec
tor
sour
ces o
f fin
ancin
g to
prov
iders
Healt
h ex
pend
iture
by
publi
c sec
tor
sour
ces o
ffin
ancin
g by
functi
ons
Healt
h ex
pend
iture
by al
l pr
ivate
secto
r so
urce
s of
finan
cing
Healt
h ex
pend
iture
by
priva
te se
ctor
sour
ces o
f fin
ancin
g to
prov
iders
Healt
h ex
pend
iture
by
priva
te se
ctor
sour
ces o
ffin
ancin
g by
functi
ons
HEAL
TH E
XPEN
DITU
RE B
Y PU
BLIC
SEC
TOR
AS S
OURC
E OF
FIN
ANCI
NG
HEAL
TH E
XPEN
DITU
RE B
Y PR
IVAT
E SE
CTOR
AS
SOUR
CE
OF F
INAN
CING
TOTA
L EX
PEND
ITUR
E ON
HEA
LTH
BY P
UBLI
C &
PRIV
ATE
SECT
ORS
AS S
OURC
ES O
F FI
NANC
ING
CHAP
TER
5: H
EALT
H EX
PEND
ITUR
E BY
SOU
RCES
OF
FINA
NCIN
G
MALAYSIA NATIONAL HEALTH ACCOUNTS HEALTH EXPENDITURE REPORT 1997-2017 21

Among the various sources of financing, the Ministry of Health (MOH) has the highest expenditure amounting to RM24,715 million or 43% share of TEH (Table 5.1a and Figure 5.1a) in 2017. This is followed by private household out-of-pocket (OOP) spending (RM 21,573 million or 38%), private insurance (RM4,085 million or 7 percent) and other federal agencies including federal statutory bodies (RM2,178 million or 4 percent). The Ministry of Education (MOE) spent RM1,283 million or 2 percent, whereas all corporations (other than health insurance) spent RM1,313 million contributing to about 2 percent of the share of TEH.
The time series data trend also shows that there are changes of trend in sources of financing from 2003
onwards. Private insurance expenditure was the third highest source of financing until 2017. In 2004, other federal agencies (including statutory bodies) replaced all corporation (other than health insurance) (Table 5.1b and Table 5.1c).
In 2017, the public and private sectors health expenditure are RM29,338 million (51%) and RM28,023 million (49%) respectively (Table 5.1d and Figure 5.1b). A similar pattern is noted throughout the time series from 1997 to 2017 with the public sector share of health expenditure remained higher than the private sector share. Both public and private sectors spending generally showed an increasing trend throughout the time-series.
TABLE 5.1a: Total Expenditure on Health by Sources of Financing, 2017
MNHA Code Sources of Financing RM Million Percent
MS1.1.1.1 Ministry of Health (MOH) 24,715 43.09
MS2.4 Private household out-of-pocket expenditures (OOP) 21,573 37.61
MS2.2 Private insurance enterprises (other than social insurance) 4,085 7.12
MS1.1.1.9 Other federal agencies (including statutory bodies) 2,178 3.80
MS2.6 All corporations (other than health insurance) 1,313 2.29
MS1.1.1.2 Ministry of Education (MOE) 1,283 2.24
MS2.3 Private MCOs and other similar entities 984 1.72
MS1.1.2.2 Other state agencies (including statutory bodies) 405 0.71
MS1.2.2 Social Security Organization (SOCSO) 329 0.57
MS1.1.3 Local authorities (LA) 139 0.24
MS1.1.1.3 Ministry of Defence (MOD) 132 0.23
MS1.1.2.1 (General) State government 99 0.17
MS2.5 Non-profit institutions serving households (NGO) 63 0.11
MS1.2.1 Employees Provident Fund (EPF) 58 0.10
MS9 Rest of the world (ROW) 5 0.01
Total 57,361 100.00
5.1 Health Expenditure by Public and Private Sector Sources of Financing
22 MALAYSIA NATIONAL HEALTH ACCOUNTS HEALTH EXPENDITURE REPORT 1997-2017
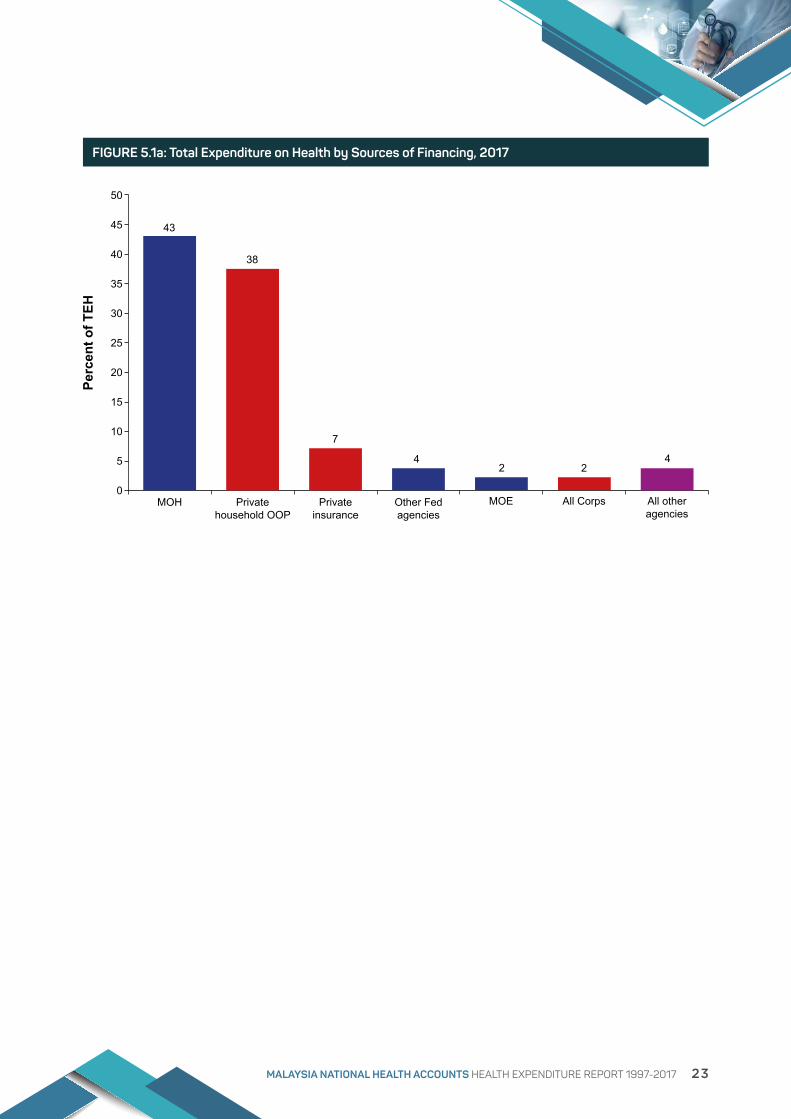
FIGURE 5.1a: Total Expenditure on Health by Sources of Financing, 2017
50
45
40
35
30
25
20
15
10
5
0
Perc
ent o
f TEH
MOH Private household OOP
Private insurance
Other Fedagencies
MOE All Corps All other agencies
43
38
7
42 2
4
MALAYSIA NATIONAL HEALTH ACCOUNTS HEALTH EXPENDITURE REPORT 1997-2017 23
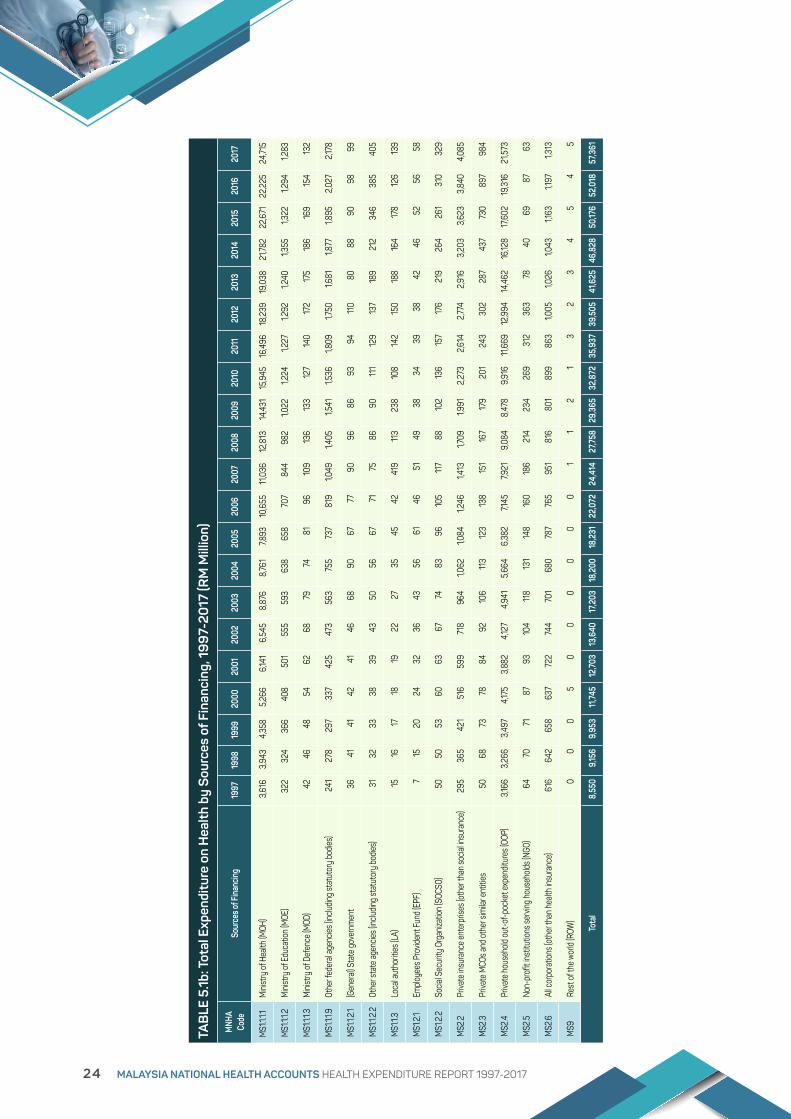
TAB
LE 5
.1b: T
otal
Exp
endi
ture
on
Hea
lth
by S
ourc
es o
f Fin
anci
ng, 1
99
7-20
17 (R
M M
illio
n)
MNH
A
Code
Sour
ces o
f Fin
ancin
g19
9719
9819
9920
0020
0120
0220
0320
0420
0520
0620
0720
0820
0920
1020
1120
1220
1320
1420
1520
1620
17
MS1
.1.1.1
Mini
stry
of H
ealth
(MOH
) 3
,616
3
,943
4
,358
5
,266
6
,141
6,5
45
8,8
76
8,76
1 7,
893
10,6
55
11,0
36
12,8
13
14,4
31
15,9
45
16,4
96
18,2
39
19,0
38
21,7
82
22,6
71
22,
225
24,7
15
MS1
.1.1.2
M
inist
ry o
f Edu
catio
n (M
OE)
322
3
24
366
4
08
501
5
55
593
6
38
658
70
7 8
44
982
1,
022
1,22
4 1,
227
1,29
2 1,
240
1,35
5 1,
322
1,29
4 1,
283
MS1
.1.1.3
M
inist
ry o
f Def
ence
(MOD
) 4
2 4
6 4
8 5
4 6
2 6
8 79
74
8
1 9
6 10
9 13
6 13
3 12
7 14
0 17
2 17
5 18
6 16
9 15
4 13
2
MS1
.1.1.9
Ot
her f
eder
al ag
encie
s (inc
luding
stat
utor
y bo
dies)
241
2
78
297
3
37
425
4
73
563
75
5 73
7 8
19
1,04
9 1,
405
1,54
1 1,
536
1,80
9 1,
750
1,68
1 1,
877
1,89
5 2
,027
2
,178
MS1
.1.2.1
(Gen
eral)
Sta
te g
over
nmen
t 3
6 4
1 4
1 4
2 4
1 4
6 6
8 9
0 6
7 77
9
0 9
6 8
6 9
3 9
4 11
0 8
0 8
8 9
0 9
8 9
9
MS1
.1.2.2
Ot
her s
tate
agen
cies (
includ
ing st
atut
ory
bodie
s) 3
1 3
2 3
3 3
8 3
9 4
3 5
0 5
6 6
7 71
75
8
6 9
0 11
1 12
9 13
7 18
9 2
12
346
3
85
405
MS1
.1.3
Loca
l aut
horit
ies (L
A) 15
16
17
18
19
2
2 2
7 3
5 4
5 4
2 4
19
113
238
10
8 14
2 15
0 18
8 16
4 17
8 12
6 13
9
MS1
.2.1
Emplo
yees
Pro
viden
t Fun
d (E
PF)
7 15
2
0 2
4 3
2 3
6 4
3 5
6 6
1 4
6 5
1 4
9 3
8 3
4 3
9 3
8 4
2 4
6 5
2 5
6 5
8
MS1
.2.2
So
cial S
ecur
ity O
rgan
izatio
n (S
OCSO
) 5
0 5
0 5
3 6
0 6
3 6
7 74
8
3 9
6 10
5 11
7 8
8 10
2 13
6 15
7 17
6 2
19
264
2
61
310
3
29
MS2
.2
Priva
te in
sura
nce
ente
rpris
es (o
ther
than
socia
l insu
ranc
e) 2
95
365
4
21
516
5
99
718
964
1,
062
1,08
4 1,
246
1,41
3 1,
709
1,99
1 2
,273
2
,614
2
,774
2,9
16
3,2
03
3,6
23
3,8
40
4,0
85
MS2
.3
Priva
te M
COs a
nd o
ther
sim
ilar e
ntitie
s 5
0 6
8 73
78
8
4 9
2 10
6 11
3 12
3 13
8 15
1 16
7 17
9 2
01
243
3
02
287
4
37
730
897
9
84
MS2
.4
Priva
te h
ouse
hold
out-
of-p
ocke
t exp
endit
ures
(OOP
) 3
,166
3,2
66
3,4
97
4,17
5 3
,882
4
,127
4,9
41
5,6
64
6,3
82
7,14
5 7,
921
9,0
84
8,47
8 9
,916
11
,669
12
,994
14
,462
16
,128
17,6
02
19,3
16
21,5
73
MS2
.5
Non-
profi
t ins
titut
ions s
ervin
g ho
useh
olds (
NGO)
64
70
71
87
93
104
118
131
148
160
186
214
2
34
269
3
12
363
78
4
0 6
9 8
7 6
3
MS2
.6
All c
orpo
ratio
ns (o
ther
than
hea
lth in
sura
nce)
616
6
42
658
6
37
722
744
701
680
78
7 76
5 9
51
816
8
01
899
8
63
1,00
5 1,
026
1,04
3 1,
163
1,19
7 1,
313
MS9
Re
st o
f the
wor
ld (R
OW)
00
0 5
0
00
00
0 1
1 2
1
3
2
3
4
5
4
5
Tota
l8,
550
9,15
69,
953
11,74
512
,703
13,6
4017
,203
18,2
0018
,231
22,0
7224
,414
27,75
829
,365
32,8
7235
,937
39,5
0541
,625
46,8
2850
,176
52,0
1857
,361
24 MALAYSIA NATIONAL HEALTH ACCOUNTS HEALTH EXPENDITURE REPORT 1997-2017
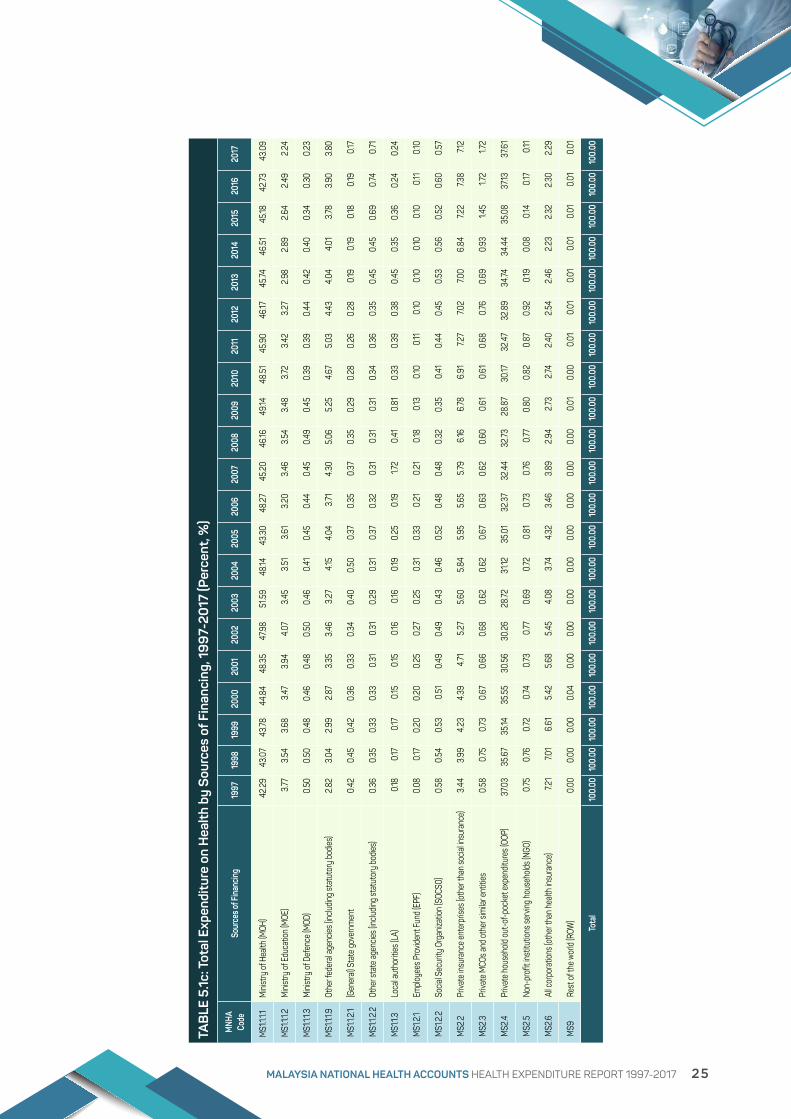
TAB
LE 5
.1c: T
otal
Exp
endi
ture
on
Hea
lth
by S
ourc
es o
f Fin
anci
ng, 1
99
7-20
17 (P
erce
nt, %
)
MNH
A Co
deSo
urce
s of F
inan
cing
1997
1998
1999
2000
2001
2002
2003
2004
2005
2006
2007
2008
2009
2010
2011
2012
2013
2014
2015
2016
2017
MS1
.1.1.1
Mini
stry
of H
ealth
(MOH
)42
.29
43.0
743
.7844
.84
48.3
547
.98
51.5
948
.1443
.30
48.2
745
.20
46.16
49.14
48.51
45.9
046
.1745
.7446
.5145
.1842
.7343
.09
MS1
.1.1.2
M
inist
ry o
f Edu
catio
n (M
OE)
3.77
3.54
3.68
3.47
3.94
4.07
3.45
3.51
3.61
3.20
3.46
3.54
3.48
3.72
3.42
3.27
2.98
2.89
2.64
2.49
2.24
MS1
.1.1.3
M
inist
ry o
f Def
ence
(MOD
)0.
500.
500.
480.
460.
480.
500.
460.
410.
450.
440.
450.
490.
450.
390.
390.
440.
420.
400.
340.
300.
23
MS1
.1.1.9
Ot
her f
eder
al ag
encie
s (inc
luding
stat
utor
y bo
dies)
2.82
3.04
2.99
2.87
3.35
3.46
3.27
4.15
4.04
3.71
4.30
5.06
5.25
4.67
5.03
4.43
4.04
4.01
3.78
3.90
3.80
MS1
.1.2.1
(Gen
eral)
Sta
te g
over
nmen
t0.
420.
450.
420.
360.
330.
340.
400.
500.
370.
350.
370.
350.
290.
280.
260.
280.1
90.1
90.1
80.1
90.1
7
MS1
.1.2.2
Ot
her s
tate
agen
cies (
includ
ing st
atut
ory
bodie
s)0.
360.
350.
330.
330.
310.
310.
290.
310.
370.
320.
310.
310.
310.
340.
360.
350.
450.
450.
690.
740.
71
MS1
.1.3
Loca
l aut
horit
ies (L
A)0.1
80.1
70.1
70.1
50.1
50.1
60.1
60.1
90.
250.1
91.7
20.
410.
810.
330.
390.
380.
450.
350.
360.
240.
24
MS1
.2.1
Emplo
yees
Pro
viden
t Fun
d (E
PF)
0.08
0.17
0.20
0.20
0.25
0.27
0.25
0.31
0.33
0.21
0.21
0.18
0.13
0.10
0.11
0.10
0.10
0.10
0.10
0.11
0.10
MS1
.2.2
So
cial S
ecur
ity O
rgan
izatio
n (S
OCSO
)0.
580.
540.
530.
510.
490.
490.
430.
460.
520.
480.
480.
320.
350.
410.
440.
450.
530.
560.
520.
600.
57
MS2
.2
Priva
te in
sura
nce
ente
rpris
es (o
ther
than
socia
l insu
ranc
e)3.
443.
994.
234.
394.7
15.
275.6
05.
845.9
55.6
55.7
96.1
66.
786.
917.2
77.0
27.0
06.
847.2
27.3
87.1
2
MS2
.3
Priva
te M
COs a
nd o
ther
sim
ilar e
ntitie
s0.
580.
750.
730.
670.
660.
680.
620.
620.
670.
630.
620.
600.
610.
610.
680.
760.
690.
931.4
51.7
21.7
2
MS2
.4
Priva
te h
ouse
hold
out-
of-p
ocke
t exp
endit
ures
(OOP
)37
.03
35.6
735
.1435
.55
30.5
630
.26
28.72
31.12
35.0
132
.37
32.4
432
.7328
.87
30.17
32.47
32.8
934
.7434
.44
35.0
837
.1337
.61
MS2
.5
Non-
profi
t ins
titut
ions s
ervin
g ho
useh
olds (
NGO)
0.75
0.76
0.72
0.74
0.73
0.77
0.69
0.72
0.81
0.73
0.76
0.77
0.80
0.82
0.87
0.92
0.19
0.08
0.14
0.17
0.11
MS2
.6
All c
orpo
ratio
ns (o
ther
than
hea
lth in
sura
nce)
7.21
7.01
6.61
5.42
5.68
5.45
4.08
3.74
4.32
3.46
3.89
2.94
2.73
2.74
2.40
2.54
2.46
2.23
2.32
2.30
2.29
MS9
Re
st o
f the
wor
ld (R
OW)
0.00
0.00
0.00
0.04
0.00
0.00
0.00
0.00
0.00
0.00
0.00
0.00
0.01
0.00
0.01
0.01
0.01
0.01
0.01
0.01
0.01
Tota
l10
0.00
100.
0010
0.00
100.
0010
0.00
100.
0010
0.00
100.
0010
0.00
100.
0010
0.00
100.
0010
0.00
100.
0010
0.00
100.
0010
0.00
100.
0010
0.00
100.
0010
0.00
MALAYSIA NATIONAL HEALTH ACCOUNTS HEALTH EXPENDITURE REPORT 1997-2017 25
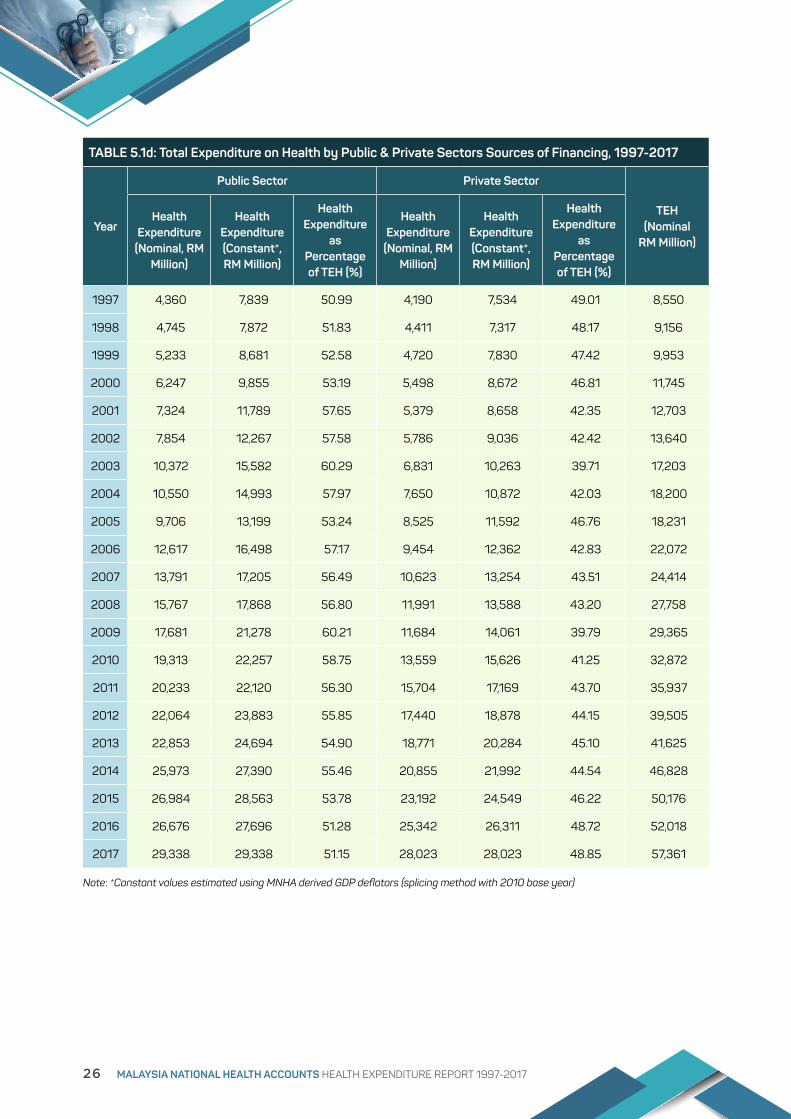
TABLE 5.1d: Total Expenditure on Health by Public & Private Sectors Sources of Financing, 1997-2017
Year
Public Sector Private Sector
TEH (Nominal
RM Million)
Health Expenditure
(Nominal, RM Million)
Health Expenditure (Constant*, RM Million)
Health Expenditure
as Percentage of TEH (%)
Health Expenditure
(Nominal, RM Million)
Health Expenditure (Constant*, RM Million)
Health Expenditure
as Percentage of TEH (%)
1997 4,360 7,839 50.99 4,190 7,534 49.01 8,550
1998 4,745 7,872 51.83 4,411 7,317 48.17 9,156
1999 5,233 8,681 52.58 4,720 7,830 47.42 9,953
2000 6,247 9,855 53.19 5,498 8,672 46.81 11,745
2001 7,324 11,789 57.65 5,379 8,658 42.35 12,703
2002 7,854 12,267 57.58 5,786 9,036 42.42 13,640
2003 10,372 15,582 60.29 6,831 10,263 39.71 17,203
2004 10,550 14,993 57.97 7,650 10,872 42.03 18,200
2005 9,706 13,199 53.24 8,525 11,592 46.76 18,231
2006 12,617 16,498 57.17 9,454 12,362 42.83 22,072
2007 13,791 17,205 56.49 10,623 13,254 43.51 24,414
2008 15,767 17,868 56.80 11,991 13,588 43.20 27,758
2009 17,681 21,278 60.21 11,684 14,061 39.79 29,365
2010 19,313 22,257 58.75 13,559 15,626 41.25 32,872
2011 20,233 22,120 56.30 15,704 17,169 43.70 35,937
2012 22,064 23,883 55.85 17,440 18,878 44.15 39,505
2013 22,853 24,694 54.90 18,771 20,284 45.10 41,625
2014 25,973 27,390 55.46 20,855 21,992 44.54 46,828
2015 26,984 28,563 53.78 23,192 24,549 46.22 50,176
2016 26,676 27,696 51.28 25,342 26,311 48.72 52,018
2017 29,338 29,338 51.15 28,023 28,023 48.85 57,361
Note: *Constant values estimated using MNHA derived GDP deflators (splicing method with 2010 base year)
26 MALAYSIA NATIONAL HEALTH ACCOUNTS HEALTH EXPENDITURE REPORT 1997-2017

FIGURE 5.1b: Total Expenditure on Health by Sources of Financing (Public vs. Private), 1997-20174,
360
4,74
5
5,23
3
6,24
7
7,32
4
7,85
4 10,3
72
10,5
50
9,70
6
12,6
17
13,7
91
15,7
67
17,6
81
19,3
13
20,2
33
22,0
64
22,8
53 25
,973
26,9
84
26,6
76 29,3
38
4,19
0
4,41
1
4,72
0
5,49
8
5,37
9
5,78
6
6,83
1
7,65
0
8,52
5
9,45
4
10,6
23
11,9
91
11,6
84
13,5
59
15,7
04
17,4
40
18,7
71
20,8
55
23,1
92
25,3
42 28,0
23
0
5,000
10,000
15,000
20,000
25,000
30,000
35,000
1997
1998
1999
2000
2001
2002
2003
2004
2005
2006
2007
2008
2009
2010
2011
2012
2013
2014
2015
2016
2017
RM M
illion
Public Sector Private Sector
MALAYSIA NATIONAL HEALTH ACCOUNTS HEALTH EXPENDITURE REPORT 1997-2017 27

5.2 HEALTH EXPENDITURE BY PUBLIC SECTOR SOURCES OF FINANCING
This section describes health expenditure by public sector sources of financing, it describe public sector health expenditure according to MNHA classification of sources of financing for year 2017, followed by time series data of 1997-2017 in RM Million and percentage.
5.2.1 Health Expenditure by All Public Sector Sources of FinancingIn 2017, analysis of the public sector sources of financing showed that MOH spent RM24,715 million (84%), making it the largest financier in this sector. This is followed by other federal agencies (including statutory bodies) RM 2,178 million (7 percent), MOE RM1,283 million (4 percent), other state agencies
(including statutory bodies) RM405 million (1 percent), SOCSO RM329 million (1 percent), and other public sector agencies with each agency spending less than RM140 million but in total amounting to RM427 million (1 percent) (Table 5.2.1a and Figure 5.2.1).
The time series expenditure data shows that MOH as the largest financier in public sector has progressively increased its spending from RM3,616 million in 1997 to RM24,715 million in 2017 (Table 5.2.1b). This MOH expenditure attributes between 81 to 85% share of public sector expenditure (Table 5.2.1c). This is followed by MOE, other federal agencies (including statutory bodies), SOCSO and other state agencies (including state statutory bodies). These sources of financing altogether contributed to a share of less than 7 percent of the total public sector expenditure per year.
TABLE 5.2.1a: Health Expenditure by Public Sector Sources of Financing, 2017
MNHA Code Sources of Financing RM Million Percent
MS1.1.1.1 Ministry of Health (MOH) 24,715 84.20
MS1.1.1.9 Other federal agencies (including statutory bodies) 2,178 8.00
MS1.1.1.2 Ministry of Education (MOE) 1,283 4.40
MS1.1.2.2 Other state agencies (including statutory bodies) 405 1.40
MS1.2.2 Social Security Organization (SOCSO) 329 1.10
MS1.1.3 Local authorities (LA) 139 0.50
MS1.1.1.3 Ministry of Defence (MOD) 132 0.40
MS1.1.2.1 (General) State government 99 0.30
MS1.2.1 Employees Provident Fund (EPF) 58 0.20
Total 29,338 100.00
28 MALAYSIA NATIONAL HEALTH ACCOUNTS HEALTH EXPENDITURE REPORT 1997-2017

84%
8%4% 4%
0%
10%
20%
30%
40%
50%
60%
70%
80%
90%
100%
MOH Other federalagencies
MOE Other public sectoragencies
Perc
ent o
f Pub
lic S
ecto
r
FIGURE 5.2.1: Health Expenditure by Public Sector Sources of Financing, 2017
MALAYSIA NATIONAL HEALTH ACCOUNTS HEALTH EXPENDITURE REPORT 1997-2017 29

TAB
LE 5
.2.1b
: Hea
lth
Expe
ndit
ure
by P
ublic
Sec
tor S
ourc
es o
f Fin
anci
ng, 1
99
7-20
17 (R
M M
illio
n)
MNH
A
Code
Sour
ces o
f Fin
ancin
g19
9719
9819
9920
0020
0120
0220
0320
0420
0520
0620
0720
0820
0920
1020
1120
1220
1320
1420
1520
1620
17
MS1
.1.1.1
Mini
stry
of H
ealth
(MOH
)3,
616
3,94
34,
358
5,266
6,141
6,54
58,
876
8,76
17,8
9310
,655
11,0
3612
,813
14,4
3115
,945
16,4
9618
,239
19,0
3821
,782
22,6
7122
,225
24,71
5
MS1
.1.1.2
M
inist
ry o
f Edu
catio
n (M
OE)
322
324
366
408
501
555
593
638
658
707
844
982
1,022
1,224
1,227
1,292
1,240
1,355
1,322
1,294
1,283
MS1
.1.1.3
M
inist
ry o
f Def
ence
(MOD
)42
4648
5462
6879
7481
9610
913
613
312
714
017
217
518
616
915
413
2
MS1
.1.1.9
Ot
her f
eder
al ag
encie
s (inc
luding
stat
utor
y bo
dies)
241
278
297
337
425
473
563
755
737
819
1,049
1,405
1,541
1,536
1,809
1,750
1,681
1,877
1,895
2,027
2,178
MS1
.1.2.1
(Gen
eral)
Sta
te g
over
nmen
t36
4141
4241
4668
9067
7790
9686
9394
110
8088
9098
99
MS1
.1.2.2
Ot
her s
tate
agen
cies (
includ
ing st
atut
ory
bodie
s)31
3233
3839
4350
5667
7175
8690
111
129
137
189
212
346
385
405
MS1
.1.3
Loca
l aut
horit
ies (L
A)15
1617
1819
2227
3545
4241
911
323
810
814
215
018
816
417
812
613
9
MS1
.2.1
Emplo
yee
Prov
ident
Fund
s (EP
F)7
1520
2432
3643
5661
4651
4938
3439
3842
4652
5658
MS1
.2.2
So
cial S
ecur
ity O
rgan
izatio
n (S
OCSO
)50
5053
6063
6774
8396
105
117
8810
213
615
717
621
926
426
131
032
9
Tota
l4,
360
4,74
55,
233
6,24
77,3
247,8
5410
,372
10,5
509,
706
12,6
1713
,791
15,76
717
,681
19,3
1320
,233
22,0
6422
,853
25,9
7326
,984
26,6
7629
,338
TAB
LE 5
.2.1c
: Hea
lth
Expe
ndit
ure
by P
ublic
Sec
tor S
ourc
es o
f Fin
anci
ng, 1
99
7-20
17 (P
erce
nt, %
)
MNH
A
Code
Sour
ces o
f Fin
ancin
g19
9719
9819
9920
0020
0120
0220
0320
0420
0520
0620
0720
0820
0920
1020
1120
1220
1320
1420
1520
1620
17
MS1
.1.1.1
Mini
stry
of H
ealth
(MOH
)82
.94
83.10
83.2
784
.30
83.8
683
.33
85.5
783
.05
81.3
284
.44
80.0
281
.26
81.6
282
.56
81.5
382
.66
83.3
183
.86
84.0
183
.32
84.2
4
MS1
.1.1.2
M
inist
ry o
f Edu
catio
n (M
OE)
7.39
6.84
7.00
6.53
6.84
7.06
5.72
6.05
6.78
5.60
6.12
6.23
5.78
6.34
6.07
5.86
5.43
5.22
4.90
4.85
4.37
MS1
.1.1.3
M
inist
ry o
f Def
ence
(MOD
)0.
970.
960.
920.
870.
840.
860.
760.
700.
840.
760.
790.
860.
750.
660.
690.
780.
770.
710.
630.
580.
45
MS1
.1.1.9
Ot
her f
eder
al ag
encie
s (inc
luding
stat
utor
y bo
dies)
5.53
5.86
5.68
5.39
5.80
6.02
5.43
7.15
7.60
6.49
7.61
8.91
8.72
7.95
8.94
7.93
7.36
7.23
7.02
7.60
7.42
MS1
.1.2.1
(Gen
eral)
Sta
te g
over
nmen
t0.
820.
860.
790.
670.
560.
580.
660.
860.
690.
610.
650.
610.
490.
480.
460.
500.
350.
340.
330.
370.
34
MS1
.1.2.2
Ot
her s
tate
agen
cies (
includ
ing st
atut
ory
bodie
s)0.
700.
670.
640.
610.
540.
540.
480.
530.
690.
570.
550.
550.
510.
570.
640.
620.
830.
821.2
81.4
41.3
8
MS1
.1.3
Loca
l aut
horit
ies (L
A)0.
350.
340.
320.
280.
270.
280.
260.
340.
470.
343.
040.
721.3
40.
560.
700.
680.
820.
630.
660.
470.
47
MS1
.2.1
Emplo
yee
Prov
ident
Fund
s (EP
F)0.1
60.
320.
380.
380.
440.
460.
410.
530.
630.
360.
370.
310.
210.1
80.1
90.1
70.1
80.1
80.1
90.
210.
20
MS1
.2.2
So
cial S
ecur
ity O
rgan
izatio
n (S
OCSO
)1.1
41.0
51.0
10.
970.
860.
860.
710.
790.
980.
830.
850.
560.
580.
700.
780.
800.
961.0
20.
971.1
61.1
2
Tota
l10
0.00
100.
0010
0.00
100.
0010
0.00
100.
0010
0.00
100.
0010
0.00
100.
0010
0.00
100.
0010
0.00
100.
0010
0.00
100.
0010
0.00
100.
0010
0.00
100.
0010
0.00
30 MALAYSIA NATIONAL HEALTH ACCOUNTS HEALTH EXPENDITURE REPORT 1997-2017

5.2.2 Public Sector Health Expenditure as Percentage of General Government ExpenditurePublic Sector Health Expenditure or internationally known as General Government Health Expenditure (GGHE) includes expenditure by all public sector
sources of financing namely federal government, state government, local authorities and social security funds. GGHE as percentage of General Government Expenditure (GGE), has increased from RM4,360 million (4.84 percent) in 1997 to RM29,338 million (7.34 percent) in 2017 (Table 5.2.2 and Figure 5.2.2).
TABLE 5.2.2: Trend for Public Sector Health Expenditure (GGHE), 1997-2017 (RM Million, Percent GGE)
YearPublic Sector Health Expenditure (GGHE)
(RM Million)
General Government Expenditure (GGE)*
(RM Million)GGHE as % GGE
1997 4,360 90,131 4.84
1998 4,745 97,040 4.89
1999 5,233 102,320 5.11
2000 6,247 114,884 5.44
2001 7,324 130,690 5.60
2002 7,854 144,278 5.44
2003 10,372 166,948 6.21
2004 10,550 157,742 6.69
2005 9,706 172,681 5.62
2006 12,617 204,255 6.18
2007 13,791 231,359 5.96
2008 15,767 289,394 5.45
2009 17,681 282,794 6.25
2010 19,313 270,171 7.15
2011 20,233 297,382 6.80
2012 22,064 365,600 6.04
2013 22,853 376,374 6.07
2014 25,973 405,788 6.40
2015 26,984 383,727 7.03
2016 26,676 381,366 6.99
2017 29,338 399,699 7.34
Source: *Treasury Malaysia website Economy Report 2017/2018 dated 25th May 2018
MALAYSIA NATIONAL HEALTH ACCOUNTS HEALTH EXPENDITURE REPORT 1997-2017 31

4.84
4.89
5.11
5.44
5.60
5.44
6.216.69
5.626.18
5.965.45
6.25
7.15
6.806.04
6.07
6.407.03
6.99
7.34
0
2
4
6
8
10
GG
HE
as p
erce
ntag
e of
GG
E
FIGURE 5.2.2: Trend for Public Sector Health Expenditure (GGHE) as Percentage of General Government Expenditure (GGE), 1997-2017
32 MALAYSIA NATIONAL HEALTH ACCOUNTS HEALTH EXPENDITURE REPORT 1997-2017

5.2.3 Health Expenditure by Public Sector Sources of Financing to Providers Cross-tabulations of public sector sources of financing and providers of health care services and products respond to the question as to where this public source of fund is spent or who provides the services and products.
In 2017, all hospitals (inclusive of general hospitals, psychiatric hospitals and specialty hospitals) consumed RM17,702 million (60%), followed by providers of ambulatory healthcare at RM4,930 million (17%) and general health administration and insurance at RM3,212 million (11%) (Table 5.2.3a and Figure
5.2.3). A significant share of expenditure for provision and administration of public health programmes is contributed by MOH expenditure.
The 1997 to 2017 time series shows a similar pattern in the share of various providers that consumed public sector source of financing. All providers showed steady increase in expenditure over the time period (Table 5.2.3b and Table 5.2.3c). Over the last seventeen years (2000-2017), expenditure by all hospitals and providers of ambulatory health care which were among the higher spending groups, exhibited steeper increase in spending compared to other providers.
60%
17%
11%
5%5%
2%Hospitals
Ambulatory health care
General health administration andinsurance
Provision and administration of publichealth programmes
Institutions
All other providers
Public Sector Health
Expenditure: 51% of TEH
(RM29,338 Million)
TABLE 5.2.3a: Public Sector Health Expenditure to Providers of Health Care, 2017
MNHA Code Providers of Health Care RM Million Percent
MP1 All hospitals 17,702 60.34
MP3 Providers of ambulatory health care 4,930 16.80
MP6 General health administration and insurance 3,212 10.95
MP5 Provision and administration of public health programmes 1,580 5.39
MP8 Institutions providing health-related services 1,376 4.69
MP4 Retail sale and other providers of medical goods 384 1.31
MP7 Other industries (rest of the Malaysian economy) 152 0.52
MP9 Rest of world (ROW) 1 <0.1
MP2 Nursing and residential care facilities 1 <0.1
Total 29,338 100.00
FIGURE 5.2.3: Public Sector Health Expenditure to Providers of Health Care, 2017
MALAYSIA NATIONAL HEALTH ACCOUNTS HEALTH EXPENDITURE REPORT 1997-2017 33

TAB
LE 5
.2.3
b: P
ublic
Sec
tor H
ealt
h Ex
pend
itur
e to
Pro
vide
rs o
f Hea
lth
Car
e, 1
99
7-20
17 (R
M M
illio
n)
MNH
A Co
dePr
ovid
ers o
f Hea
lth C
are
1997
1998
1999
2000
2001
2002
2003
2004
2005
2006
2007
2008
2009
2010
2011
2012
2013
2014
2015
2016
2017
MP1
Al
l hos
pitals
2,645
2,781
3,02
43,
366
3,86
74,0
504,7
985,2
455,4
827,1
807,7
068,
992
9,24
910
,278
11,3
3113
,303
13,6
8915
,745
16,3
8816
,587
17,70
2
MP2
Nu
rsing
and
resid
entia
l car
e fac
ilities
11
11
11
11
11
11
12
22
11
11
1
MP3
Pr
ovide
rs o
f am
bulat
ory
healt
h ca
re42
145
452
462
074
183
61,1
011,2
261,3
311,8
051,9
122,1
942,1
692,4
882,7
493,
301
3,51
84,1
434,4
044,
538
4,93
0
MP4
Re
tail s
ale an
d ot
her p
rovid
ers o
f med
ical g
oods
2730
3332
3945
5256
5970
8694
128
134
135
159
239
330
306
355
384
MP5
Pr
ovisi
on an
d ad
mini
stra
tion
of p
ublic
hea
lth p
rogr
amm
es38
435
939
543
352
562
458
859
859
276
11,1
6394
61,2
211,0
011,1
481,4
781,2
321,4
991,4
881,6
451,5
80
MP6
Ge
nera
l hea
lth ad
mini
stra
tion
and
insur
ance
663
880
973
1,473
1,713
1,797
3,20
02,6
941,5
391,9
281,9
072,
287
3,419
3,96
53,1
842,
303
2,684
2,621
2,82
51,9
123,
212
MP7
Ot
her in
dust
ries (
rest
of t
he M
alays
ian e
cono
my)
4146
4648
4752
7910
284
9510
610
710
612
412
214
227
319
913
815
915
2
MP8
In
stitu
tions
pro
viding
hea
lth-re
lated
serv
ices
178
194
238
273
389
449
553
626
615
776
908
1,143
1,384
1,322
1,561
1,376
1,215
1,434
1,429
1,476
1,376
MP9
Re
st o
f the
wor
ld (R
OW)
11
11
11
11
11
14
31
11
11
42
1
Tota
l4,
360
4,74
55,
233
6,24
77,3
247,8
5410
,372
10,5
509,
706
12,6
1713
,791
15,76
717
,681
19,3
1320
,233
22,0
6422
,853
25,9
7326
,984
26,6
7629
,338
TAB
LE 5
.2.3
c: P
ublic
Sec
tor H
ealt
h Ex
pend
itur
e to
Pro
vide
rs o
f Hea
lth
Car
e, 1
99
7-20
17 (P
erce
nt, %
)
MNH
A Co
dePr
ovid
ers o
f Hea
lth C
are
1997
1998
1999
2000
2001
2002
2003
2004
2005
2006
2007
2008
2009
2010
2011
2012
2013
2014
2015
2016
2017
MP1
Al
l Hos
pitals
60.6
858
.60
57.77
53.8
952
.81
51.5
646
.26
49.72
56.4
856
.90
55.8
857
.03
52.3
153
.22
56.0
060
.29
59.9
060
.62
60.73
62.18
60.3
4
MP2
Nu
rsing
and
resid
entia
l car
e fac
ilities
0.01
0.01
0.01
0.01
0.01
0.01
0.01
0.01
0.01
0.01
0.01
0.01
0.01
0.01
0.01
0.01
0.00
0.00
0.00
0.00
0.00
MP3
Pr
ovide
rs o
f am
bulat
ory
healt
h ca
re9.
659.
5710
.01
9.93
10.12
10.6
410
.61
11.6
213
.7114
.31
13.8
613
.92
12.2
712
.88
13.5
914
.96
15.3
915
.95
16.3
217
.01
16.8
0
MP4
Re
tail s
ale an
d ot
her p
rovid
ers o
f med
ical g
oods
0.62
0.63
0.63
0.51
0.53
0.57
0.50
0.53
0.61
0.56
0.62
0.59
0.73
0.69
0.67
0.72
1.05
1.27
1.14
1.33
1.31
MP5
Pr
ovisi
on an
d ad
mini
stra
tion
of p
ublic
hea
lth p
rogr
amm
es8.
807.5
77.5
56.
947.1
77.9
55.6
75.6
76.1
06.
048.
436.
006.
905.1
85.6
86.
705.3
95.7
75.
516.1
75.3
9
MP6
Ge
nera
l hea
lth ad
mini
stra
tion
and
insur
ance
15.2
118
.54
18.5
923
.58
23.3
922
.88
30.8
525
.53
15.8
615
.28
13.8
314
.50
19.3
420
.53
15.74
10.4
411
.7510
.09
10.47
7.17
10.9
5
MP7
Ot
her in
dust
ries (
rest
of t
he M
alays
ian e
cono
my)
0.93
0.97
0.88
0.76
0.65
0.66
0.76
0.97
0.87
0.75
0.77
0.68
0.60
0.64
0.60
0.64
1.19
0.77
0.51
0.60
0.52
MP8
In
stitu
tions
pro
viding
hea
lth-re
lated
serv
ices
4.07
4.09
4.54
4.37
5.31
5.72
5.33
5.93
6.34
6.15
6.59
7.25
7.83
6.84
7.72
6.23
5.32
5.52
5.30
5.53
4.69
MP9
Re
st o
f the
wor
ld (R
OW)
0.01
0.02
0.02
0.01
0.01
0.01
0.01
0.01
0.02
0.01
0.01
0.02
0.02
0.00
0.00
0.00
0.01
0.00
0.02
0.01
0.00
Tota
l10
0.00
100.
0010
0.00
100.
0010
0.00
100.
0010
0.00
100.
0010
0.00
100.
0010
0.00
100.
0010
0.00
100.
0010
0.00
100.
0010
0.00
100.
0010
0.00
100.
0010
0.00
34 MALAYSIA NATIONAL HEALTH ACCOUNTS HEALTH EXPENDITURE REPORT 1997-2017

5.2.4 Health Expenditure by Public Sector Sources of Financing by Functions In this section, the type of services and products spent by public sector source of financing is cross tabulated with functions of healthcare.
In 2017, the public sector source of financing spent most for curative care, consuming RM20,713 million (71 %), followed by health programme administration and health insurance at RM3,076 million (10%) and public health services (including prevention and health promotion at RM2,157 million (7 percent). The total spending by the public sector for education and training of health personnel was RM1,371 million (5 percent), and RM1,352 million (5 percent) for capital formation. The total expenditure for all other functions
of health care services and products is RM669 or 2 percent (Table 5.2.4a and Figure 5.2.4). The 1997-2017 time series showed services of curative care, and health programme administration and health insurance occupying the top two highest share of public sector expenditure by function. This was followed by capital formation but then overtaken by public health services (including health promotion and prevention) from year 2013 onwards. Ancillary services to health care showed the highest growth with an increase by 200-fold, from RM1 million in 1997 to RM284 million in 2017. The expenditure for education and training of health personnel had also increased by about 10-fold over the same time period (Table 5.2.4b and Table 5.2.4c).
MALAYSIA NATIONAL HEALTH ACCOUNTS HEALTH EXPENDITURE REPORT 1997-2017 35

TABLE 5.2.4a: Public Sector Health Expenditure by Functions of Health Care, 2017
MNHA Code Functions of Health Care RM Million Percent
MF1 Services of curative care 20,713 70.60
MF7 Health programme administration and health insurance 3,076 10.49
MF6 Public health services (including health promotion and prevention) 2,157 7.35
MR2 Education and training of health personnel 1,371 4.67
MR1 Capital formation of health care provider institutions 1,352 4.61
MF5 Medical goods dispensed to out-patients 333 1.13
MF4 Ancillary services to health care 284 0.97
MR3 Research and development in health 52 0.18
MF3 Services of long-term nursing care 0 0.00
Total 29,338 100.00
FIGURE 5.2.4: Public Sector Health Expenditure by Functions of Health Care, 2017
71%
10%
7%
5%
5%2%
Services of curative care
Health programme admin. & healthinsurance
Public health (incl. promotion &prevention)
Education & training of healthpersonnel
Capital formation
All other functions
Public Sector Health Expenditure:
51% of TEH(RM29,338 Million)
36 MALAYSIA NATIONAL HEALTH ACCOUNTS HEALTH EXPENDITURE REPORT 1997-2017

TAB
LE 5
.2.4
b: P
ublic
Sec
tor H
ealt
h Ex
pend
itur
e by
Fun
ctio
ns o
f Hea
lth
Car
e, 1
99
7-20
17 (R
M M
illio
n)
MNH
A Co
deFu
nctio
ns of
Hea
lth C
are
1997
1998
1999
2000
2001
2002
2003
2004
2005
2006
2007
2008
2009
2010
2011
2012
2013
2014
2015
2016
2017
MF1
Se
rvice
s of c
urat
ive ca
re2,9
023,
009
3,26
93,
697
4,190
4,52
15,3
605,9
036,1
348,
225
8,73
710
,291
10,5
4411
,026
12,9
5115
,135
14,9
8517
,692
18,71
019
,054
20,71
3
MF3
Se
rvice
s of l
ong-
term
nur
sing
care
00
00
00
00
00
10
01
11
01
10
0
MF4
An
cillar
y se
rvice
s to
healt
h ca
re1
11
839
4771
9895
164
139
191
192
206
224
228
310
268
276
259
284
MF5
M
edica
l goo
ds d
ispen
sed t
o ou
t-pa
tient
s24
2426
2933
3540
4751
5872
8098
114
113
129
207
293
263
303
333
MF6
Pu
blic h
ealth
serv
ices (
includ
ing h
ealth
pro
mot
ion an
d pr
even
tion)
194
197
226
230
263
275
414
480
495
635
919
803
904
876
999
1,205
1,963
1,841
1,928
2,025
2,157
MF7
He
alth
prog
ram
me
adm
inist
ratio
n an
d he
alth
insur
ance
556
533
560
657
742
914
1,177
1,167
1,142
1,537
1,589
1,791
1,929
1,906
2,166
1,918
2,24
42,9
382,9
052,1
083,
076
MR1
Ca
pital
form
ation
of h
ealth
care
pro
vider
inst
itutio
ns49
677
890
81,3
501,6
651,6
102,7
652,
274
1,212
1,308
1,510
1,561
2,699
3,81
42,1
521,9
891,7
931,4
571,4
171,4
011,3
52
MR2
Ed
ucat
ion an
d tra
ining
of h
ealth
per
sonn
el12
714
919
523
831
737
447
151
955
565
877
299
91,2
651,3
261,5
801,4
041,2
841,4
261,4
251,4
741,3
71
MR3
Re
sear
ch an
d de
velop
men
t in
healt
h61
5348
3874
7874
6121
3453
5249
4446
5667
5859
5152
Tota
l4,
360
4,74
55,
233
6,24
77,3
247,8
5410
,372
10,5
509,
706
12,6
1713
,791
15,76
717
,681
19,3
1320
,233
22,0
6422
,853
25,9
7326
,984
26,6
7629
,338
TAB
LE 5
.2.4
c: P
ublic
Sec
tor H
ealt
h Ex
pend
itur
e by
Fun
ctio
ns o
f Hea
lth
Car
e, 1
99
7-20
17 (P
erce
nt, %
)
MNH
A Co
deFu
nctio
ns of
Hea
lth C
are
1997
1998
1999
2000
2001
2002
2003
2004
2005
2006
2007
2008
2009
2010
2011
2012
2013
2014
2015
2016
2017
MF1
Se
rvice
s of c
urat
ive ca
re66
.56
63.4
262
.4759
.1857
.22
57.5
651
.68
55.9
663
.20
65.18
63.3
565
.27
59.6
357
.09
64.0
168
.59
65.5
768
.1169
.34
71.4
370
.60
MF3
Se
rvice
s of l
ong-
term
nur
sing
care
0.01
0.00
0.00
0.00
0.00
0.00
0.00
0.00
0.00
0.00
0.00
0.00
0.00
0.00
0.00
0.01
0.00
0.00
0.00
0.00
0.00
MF4
An
cillar
y se
rvice
s to
healt
h ca
re0.
030.
030.
030.1
30.
540.
600.
680.
930.
981.3
01.0
11.2
11.0
81.0
71.1
11.0
31.3
51.0
31.0
20.
970.
97
MF5
M
edica
l goo
ds d
ispen
sed t
o ou
t-pa
tient
s0.
540.
510.
490.
460.
450.
450.
380.
440.
530.
460.
520.
510.
560.
590.
560.
580.
901.1
30.
981.1
41.1
3
MF6
Pu
blic h
ealth
serv
ices (
includ
ing h
ealth
pro
mot
ion an
d pr
even
tion)
4.45
4.15
4.32
3.68
3.59
3.51
3.99
4.55
5.10
5.03
6.66
5.09
5.11
4.54
4.94
5.46
8.59
7.09
7.15
7.59
7.35
MF7
He
alth
prog
ram
me
adm
inist
ratio
n an
d he
alth
insur
ance
12.75
11.2
310
.7010
.52
10.13
11.6
311
.34
11.0
611
.7612
.1811
.52
11.3
610
.91
9.87
10.71
8.69
9.82
11.3
110
.777.9
010
.49
MR1
Ca
pital
form
ation
of h
ealth
care
pro
vider
inst
itutio
ns11
.37
16.4
017
.34
21.6
022
.7320
.50
26.6
621
.56
12.4
910
.36
10.9
59.
9015
.27
19.75
10.6
49.
017.8
45.6
15.
255.
254.
61
MR2
Ed
ucat
ion an
d tra
ining
of h
ealth
per
sonn
el2.
903.1
43.7
33.
814.
334.7
64.
544.
925.7
25.
215.6
06.
347.1
56.
877.8
16.
365.6
25.4
95.
285.
524.
67
MR3
Re
sear
ch an
d de
velop
men
t in
healt
h1.4
01.1
20.
910.
611.0
20.
990.
710.
580.
220.
270.
380.
330.
280.
230.
230.
260.
290.
220.
220.1
90.1
8
Tota
l10
0.00
100.0
010
0.00
100.
0010
0.00
100.
0010
0.00
100.
0010
0.00
100.
0010
0.00
100.
0010
0.00
100.
0010
0.00
100.
0010
0.00
100.
0010
0.00
100.
0010
0.00
MALAYSIA NATIONAL HEALTH ACCOUNTS HEALTH EXPENDITURE REPORT 1997-2017 37

5.3 HEALTH EXPENDITURE BY PRIVATE SECTOR SOURCES OF FINANCING
This section describes health expenditure by private sector sources of financing, starting with description of private sector health expenditure according to MNHA classification of sources of financing for year 2017, followed by times series data of 1997-2017 in RM Million and percentage.
5.3.1 Health Expenditure by All Private Sector Sources of FinancingIn 2017, analysis of health expenditure data showed that the highest source of financing in the private sector is private household OOP expenditure amounting to RM21,573 million (77%) of this sector’s health expenditure (Table 5.3.1a and Figure 5.3.1). The next highest spending is by private insurance enterprises (other than social insurance) which is inclusive of personal, family and company insurance policies at RM4,085 million (15%). All corporations contributed to RM1,313 million (5 percent) of private sector health
expenditure. This expenditure by all corporations is exclusive of group or company purchases of employee insurances which are reported under private insurance enterprises expenditure. The remaining agencies under private sector contributed to RM1,052 million (3 percent) of health expenditure in this sector.
The private sector expenditure data for 1997-2017 time series showed private household OOP expenditure gradually increased from RM3,166 million in 1997 to RM21,573 million in 2017, which remained the largest share of private sector health expenditure (71% to 78%) (Table 5.3.1b and Table 5.3.1c). Expenditure by private insurance enterprises also increased from 7 to 15 percent share of private sector health expenditure. Meanwhile, all corporations’ share decreased from 15 to 5 percent from 1997 to 2017. In terms of RM value, the expenditure on health by all corporations had increased two-fold, whereas private insurance enterprises expenditure increased by thirteen-fold over the twenty one years’ period (1997-2017).
38 MALAYSIA NATIONAL HEALTH ACCOUNTS HEALTH EXPENDITURE REPORT 1997-2017

TABLE 5.3.1a: Health Expenditure by Private Sector Sources of Financing, 2017
MNHA Code Sources of Financing RM Million Percent
MS2.4 Private household out-of-pocket expenditure (OOP) 21,573 76.98
MS2.2 Private insurance enterprises (other than social insurance) 4,085 14.58
MS2.6 All corporations (other than health insurance) 1,313 4.69
MS2.3 Private MCOs and other similar entities 984 3.51
MS2.5 Non-profit institutions serving households (NGO) 63 0.23
MS9 Rest of the world (ROW) 5 0.02
Total 28,023 100.00
FIGURE 5.3.1: Health Expenditure by Private Sector Sources of Financing, 2017
MNHA HEALTH EXPENDITURE REPORT 1997-2017 46
MNHA Code Sources of Financing RM Million Percent
MS2.4 Private household out-of-pocket expenditure (OOP) 21,573 76.98MS2.2 Private insurance enterprises (other than social insurance) 4,085 14.58MS2.6 All corporations (other than health insurance) 1,313 4.69MS2.3 Private MCOs and other similar entities 984 3.51MS2.5 Non-profit institutions serving households (NGO) 63 0.23MS9 Rest of the world (ROW) 5 0.02
28,023 100.00
TABLE 5.3.1a: Health Expenditure by Private Sector Sources of Financing, 2017
Total FIGURE 5.3.1: Health Expenditure by Private Sector Sources of Financing, 2017
77%
15%
5% 3%
0%
10%
20%
30%
40%
50%
60%
70%
80%
90%
100%
Private householdOOP
Private insurance Corporations All other privatesector agencies
Perc
ent o
f Priv
ate
Sect
or
MALAYSIA NATIONAL HEALTH ACCOUNTS HEALTH EXPENDITURE REPORT 1997-2017 39

TAB
LE 5
.3.1b
: Hea
lth
Expe
ndit
ure
by P
rivat
e S
ecto
r Sou
rces
of F
inan
cing
, 19
97-
2017
(RM
Mill
ion)
MNH
A Co
deSo
urce
s of F
inan
cing
1997
1998
1999
2000
2001
2002
2003
2004
2005
2006
2007
2008
2009
2010
2011
2012
2013
2014
2015
2016
2017
MS2
.2
Priva
te in
sura
nce
ente
rpris
es (o
ther
than
socia
l insu
ranc
e)29
5 3
65
421
516
599
718
964
1,062
1,084
1,246
1,413
1,709
1,991
2,27
32,6
142,7
742,9
163,
203
3,62
33,
840
4,085
MS2
.3
Priva
te M
COs a
nd o
ther
sim
ilar e
ntitie
s50
68
7378
8492
106
113
123
138
151
167
179
201
243
302
287
437
730
897
984
MS2
.4
Priva
te h
ouse
hold
out-
of-p
ocke
t exp
endit
ure
(OOP
)3,1
66 3
,266
3,4
974,1
753,
882
4,127
4,94
15,6
646,
382
7,145
7,921
9,08
48,
478
9,91
611
,669
12,9
9414
,462
16,12
817
,602
19,3
1621
,573
MS2
.5
Non-
profi
t ins
titut
ions s
ervin
g ho
useh
olds (
NGO)
64 70
71
8793
104
118
131
148
160
186
214
234
269
312
363
7840
6987
63
MS2
.6
All c
orpo
ratio
ns (o
ther
than
hea
lth in
sura
nce)
616
642
65
863
772
274
470
168
078
776
595
181
680
189
986
31,0
051,0
261,0
431,1
631,1
971,3
13
MS9
Re
st o
f the
wor
ld (R
OW)
00
05
00
00
00
11
21
32
34
54
5
Tota
l4,
190
4,41
14,
720
5,49
85,
379
5,78
66,
831
7,650
8,52
59,
454
10,6
2311
,991
11,6
8413
,559
15,70
417
,440
18,77
120
,855
23,19
225
,342
28,0
23
TAB
LE 5
.3.1c
: Hea
lth
Expe
ndit
ure
by P
rivat
e S
ecto
r Sou
rces
of F
inan
cing
, 19
97-
2017
(Per
cent
, %)
MNH
A Co
deSo
urce
s of F
inan
cing
1997
1998
1999
2000
2001
2002
2003
2004
2005
2006
2007
2008
2009
2010
2011
2012
2013
2014
2015
2016
2017
MS2
.2
Priva
te in
sura
nce
ente
rpris
es (o
ther
than
socia
l insu
ranc
e)7.0
38.
278.
929.
3811
.1312
.42
14.11
13.8
912
.7213
.1813
.30
14.2
517
.04
16.76
16.6
515
.91
15.5
315
.36
15.6
215
.1514
.58
MS2
.3
Priva
te M
COs a
nd o
ther
sim
ilar e
ntitie
s1.1
91.5
51.5
41.4
31.5
71.5
91.5
61.4
81.4
41.4
61.4
21.3
91.5
31.4
81.5
51.7
31.5
32.1
03.1
53.
543.
51
MS2
.4
Priva
te h
ouse
hold
out-
of-p
ocke
t exp
endit
ure
(OOP
)75
.55
74.0
474
.1075
.94
72.16
71.3
372
.33
74.0
474
.87
75.5
874
.56
75.76
72.5
673
.1374
.31
74.51
77.0
477
.33
75.9
076
.22
76.9
8
MS2
.5
Non-
profi
t ins
titut
ions s
ervin
g ho
useh
olds (
NGO)
1.53
1.58
1.51
1.59
1.72
1.81
1.73
1.71
1.74
1.70
1.76
1.78
2.00
1.98
1.99
2.08
0.41
0.19
0.30
0.34
0.23
MS2
.6
All c
orpo
ratio
ns (o
ther
than
hea
lth in
sura
nce)
14.70
14.5
613
.93
11.5
813
.41
12.8
510
.27
8.89
9.23
8.09
8.95
6.80
6.85
6.63
5.49
5.76
5.46
5.00
5.02
4.73
4.69
MS9
Re
st o
f the
wor
ld (R
OW)
0.00
0.00
0.00
0.09
0.00
0.00
0.00
0.00
0.00
0.00
0.01
0.01
0.02
0.01
0.02
0.01
0.02
0.02
0.02
0.02
0.02
Tota
l10
0.00
100.
0010
0.00
100.
0010
0.00
100.
0010
0.00
100.
0010
0.00
100.
0010
0.00
100.
0010
0.00
100.
0010
0.00
100.
0010
0.00
100.
0010
0.00
100.
0010
0.00
40 MALAYSIA NATIONAL HEALTH ACCOUNTS HEALTH EXPENDITURE REPORT 1997-2017

5.3.2 Health Expenditure by Private Sector Sources of Financing to Providers The cross-tabulations of private sector sources of financing with providers of health care services and products, respond to the question as to where the private source of fund is spent or who provides services and products.
In 2017, all hospitals consumed RM13,892 million (50%) of the private sources of funds, followed by providers of ambulatory health care at RM6,972 million (25%) and providers of retail sales and other providers of medical goods at RM3,504 million (13%). The remaining private sector sources of financing amounting to RM3,655 million (13%) was spent to other providers of healthcare (Table 5.3.2a and Figure 5.3.2).
The 1997 to 2017 time series data showed that all hospitals and providers of ambulatory health care spent an average of 74% of the private sector source of financing (Table 5.3.2b and Table 5.3.2c). The expenditure by all hospitals increased from RM1,486 million in 1997 to RM13,892 million in 2017 and expenditure by providers of ambulatory health care increased from RM1,696 million in 1997 to RM6,972 million in 2017. The data also shows that health expenditure at institutions providing health-related services which mainly comprises of teaching and training institutions in relation to health, remained below 9 percent. However, in terms of RM value this expenditure has increased by 18-fold from RM81 million in 1997 to RM1,483 million in 2017.
MALAYSIA NATIONAL HEALTH ACCOUNTS HEALTH EXPENDITURE REPORT 1997-2017 41

TABLE 5.3.2a: Private Sector Health Expenditure to Providers of Health Care, 2017
MNHA Code Providers of Health Care RM Million Percent
MP1 All hospitals 13,892 49.57
MP3 Providers of ambulatory health care 6,972 24.88
MP4 Retail sale and other providers of medical goods 3,504 12.50
MP6 General health administration and insurance 1,693 6.04
MP8 Institutions providing health-related services 1,483 5.29
MP7 Other industries (rest of the Malaysian economy) 466 1.66
MP9 Rest of the world (ROW) 10 0.03
MP5 Provision and administration of public health programmes 2 0.01
MP2 Nursing and residential care facilities 1 <0.01
Total 28,023 100.00
FIGURE 5.3.2: Private Sector Health Expenditure to Providers of Health Care, 2017
MNHA HEALTH EXPENDITURE REPORT 1997-2017 49
MN
HA
HE
ALT
H E
XP
EN
DIT
UR
E R
EP
OR
T 19
97-2
015
49
MN
HA
HE
ALT
H E
XP
EN
DIT
UR
E R
EP
OR
T 19
97-2
015
49
MN
HA
HE
ALT
H E
XP
EN
DIT
UR
E R
EP
OR
T 19
97-2
015
49
MNHA Code Providers of Health Care RM Million PercentMP1 All hospitals 13,892 49.57MP3 Providers of ambulatory health care 6,972 24.88MP4 Retail sale and other providers of medical goods 3,504 12.50MP6 General health administration and insurance 1,693 6.04MP8 Institutions providing health-related services 1,483 5.29MP7 Other industries (rest of the Malaysian economy) 466 1.66MP9 Rest of the world (ROW) 10 0.03MP5 Provision and administration of public health programmes 2 0.01MP2 Nursing and residential care facilities 1 <0.01
28,023 100.00
TABLE 5.3.2a: Private Sector Health Expenditure to Providers of Health Care, 2017
Total
FIGURE 5.3.2: Private Sector Health Expenditure to Providers of Health Care, 2017
FIGURE 5.3.2: Private Sector Health Expenditure to Providers of Health Care, 2017
50%
25%
13%
6%5% 2%
All hospitals
Providers of ambulatory healthcare
Retail sale & medical goodsproviders
General health admin. &insurance
Institutions providing health-related services
All other providers
Private SectorHealth
Expenditure: 49% of TEH(RM28,023
42 MALAYSIA NATIONAL HEALTH ACCOUNTS HEALTH EXPENDITURE REPORT 1997-2017

TAB
LE 5
.3.2
b: P
rivat
e S
ecto
r Hea
lth
Expe
ndit
ure
to P
rovi
ders
of H
ealt
h C
are,
19
97-
2017
(RM
Mill
ion)
MNH
A Co
dePr
ovid
ers o
f Hea
lth C
are
1997
1998
1999
2000
2001
2002
2003
2004
2005
2006
2007
2008
2009
2010
2011
2012
2013
2014
2015
2016
2017
MP1
Al
l hos
pitals
1,486
1,556
1,715
2,068
2,097
2,32
82,
841
3,191
3,56
04,0
064,
510
5,722
5,856
6,56
57,3
077,7
488,
269
9,03
910
,411
11,8
8713
,892
MP2
Nu
rsing
and
resid
entia
l car
e fac
ilities
11
22
35
910
1111
144
512
1418
11
14
1
MP3
Pr
ovide
rs o
f am
bulat
ory
healt
h ca
re1,6
961,7
041,7
471,9
711,8
331,8
852,0
682,
369
2,83
13,1
563,
517
3,456
2,59
03,1
333,
897
4,56
25,2
296,1
796,
300
6,50
96,
972
MP4
Re
tail s
ale an
d ot
her p
rovid
ers o
f med
ical g
oods
490
544
586
661
625
660
741
888
916
985
1,143
1,255
1,375
1,486
1,774
1,961
2,172
2,703
3,06
03,
287
3,50
4
MP5
Pr
ovisi
on an
d ad
mini
stra
tion
of p
ublic
hea
lth p
rogr
amm
es5
65
56
66
69
712
177
811
173
323
302
MP6
Ge
nera
l hea
lth ad
mini
stra
tion
and
insur
ance
363
427
452
527
542
580
760
787
799
852
909
1,011
1,088
1,256
1,450
1,600
1,297
1,246
1,547
1,656
1,693
MP7
Ot
her in
dust
ries (
rest
of t
he M
alays
ian e
cono
my)
6364
7676
8284
9510
210
511
014
815
717
020
326
929
333
835
840
844
346
6
MP8
In
stitu
tions
pro
viding
hea
lth-re
lated
serv
ices
8110
613
317
918
622
930
128
628
131
335
336
159
082
288
01,1
581,4
591,3
191,4
301,5
171,4
83
MP9
Re
st o
f the
wor
ld (R
OW)
43
56
69
911
1215
198
475
101
845
811
910
Tota
l4,
190
4,41
14,
720
5,49
85,
379
5,78
66,
831
7,650
8,52
59,
454
10,6
2311
,991
11,6
8413
,559
15,70
417
,440
18,77
120
,855
23,19
225
,342
28,0
23
TAB
LE 5
.3.2
c: P
rivat
e S
ecto
r Hea
lth
Expe
ndit
ure
to P
rovi
ders
of H
ealt
h C
are,
19
97-
2017
(Per
cent
, %)
MNH
A Co
dePr
ovid
ers o
f Hea
lth C
are
1997
1998
1999
2000
2001
2002
2003
2004
2005
2006
2007
2008
2009
2010
2011
2012
2013
2014
2015
2016
2017
MP1
Al
l hos
pitals
35.47
35.2
836
.33
37.6
238
.99
40.2
441
.59
41.71
41.77
42.3
742
.45
47.72
50.12
48.4
246
.53
44.4
244
.05
43.3
444
.89
46.9
149
.57
MP2
Nu
rsing
and
resid
entia
l car
e fac
ilities
0.03
0.03
0.04
0.04
0.05
0.09
0.14
0.13
0.13
0.12
0.13
0.04
0.04
0.09
0.09
0.10
0.00
0.00
0.00
0.01
0.00
MP3
Pr
ovide
rs o
f am
bulat
ory
healt
h ca
re40
.48
38.6
437
.01
35.8
634
.08
32.5
730
.28
30.9
633
.21
33.3
833
.1028
.82
22.16
23.10
24.8
226
.1627
.86
29.6
327
.1625
.68
24.8
8
MP4
Re
tail s
ale an
d ot
her p
rovid
ers o
f med
ical g
oods
11.70
12.3
412
.42
12.0
311
.62
11.4
110
.84
11.6
110
.7510
.41
10.76
10.47
11.77
10.9
611
.30
11.2
411
.57
12.9
613
.20
12.9
712
.50
MP5
Pr
ovisi
on an
d ad
mini
stra
tion
of p
ublic
hea
lth p
rogr
amm
es0.1
30.1
30.1
10.1
00.1
10.1
00.
090.
080.1
00.
070.1
10.1
40.
060.
060.
070.1
00.
010.
010.1
00.1
20.
01
MP6
Ge
nera
l hea
lth ad
mini
stra
tion
and
insur
ance
8.67
9.67
9.57
9.59
10.0
710
.02
11.12
10.2
99.
379.
018.
558.
439.
319.
269.
239.1
76.
915.9
86.
676.
536.
04
MP7
Ot
her in
dust
ries (
rest
of t
he M
alays
ian e
cono
my)
1.50
1.45
1.60
1.38
1.52
1.46
1.40
1.33
1.23
1.16
1.39
1.31
1.46
1.50
1.72
1.68
1.80
1.72
1.76
1.75
1.66
MP8
In
stitu
tions
pro
viding
hea
lth-re
lated
serv
ices
1.93
2.39
2.81
3.26
3.45
3.96
4.40
3.74
3.30
3.31
3.32
3.01
5.05
6.06
5.60
6.64
7.77
6.32
6.17
5.98
5.29
MP9
Re
st o
f the
wor
ld (R
OW)
0.09
0.08
0.12
0.11
0.11
0.15
0.14
0.15
0.14
0.16
0.18
0.07
0.03
0.55
0.64
0.48
0.02
0.04
0.05
0.04
0.03
Tota
l10
0.00
100.
0010
0.00
100.
0010
0.00
100.
0010
0.00
100.
0010
0.00
100.
0010
0.00
100.
0010
0.00
100.
0010
0.00
100.
0010
0.00
100.
0010
0.00
100.
0010
0.00
MALAYSIA NATIONAL HEALTH ACCOUNTS HEALTH EXPENDITURE REPORT 1997-2017 43

5.3.3 Health Expenditure by Private Sector Sources of Financing by Functions Cross-tabulations of private sector sources of financing and functions of health care respond to the question as to what is purchased or the type of services and products consumed with this source of financing.
In 2017, the private sector source of financing spent the most for services of curative care, amounting RM19,453 million (70%), followed by medical goods dispensed to out-patients at RM4,218 million (15%). health programme administration and health insurance expenditure was at RM1,693 million (6 percent) and
education and training of health personnel at RM1,494 million (5 percent). The remaining functions of health-care constitute only 4 percent of health expenditure by private sector sources of financing (Table 5.3.3a and Figure 5.3.3).
The time series 1997-2017 data showed a similar pattern with expenditures for services of curative care and medical goods dispensed to out-patient totalling 80 to 84% (Table 5.3.3b and Table 5.3.3c). Although expenditure for education and training over this time period has remained below 8 percent share of this spending, it has increased by 18-fold from RM79 million in 1997 to RM1,494 million in 2017.
44 MALAYSIA NATIONAL HEALTH ACCOUNTS HEALTH EXPENDITURE REPORT 1997-2017

TABLE 5.3.3a: Private Sector Health Expenditure by Functions of Health Care, 2017
MNHA Code Functions of Health Care RM Million Percent
MF1 Services of curative care 19,453 69.42
MF5 Medical goods dispensed to out-patients 4,218 15.05
MF7 Health programme administration and health insurance 1,693 6.04
MR2 Education and training of health personnel 1,494 5.33
MF6 Public health services (including health promotion and prevention) 804 2.87
MR3 Research and development in health 286 1.02
MF4 Ancillary services to health care 46 0.17
MR1 Capital formation of health care provider institutions 27 0.10
MF3 Services of long-term nursing care 1 <0.1
MR9 All other health-related expenditures 0 <0.1
Total 28,023 100.00
FIGURE 5.3.3: Private Sector Health Expenditure by Functions of Health Care, 2017
70%
15%
6%
5%3% 1%
Services of curative care
Medical goods
Health programme admin. &health insurance
Education & training of healthpersonnel
Public health (incl. promotion &prevention)
All other functions
Private SectorHealth Expenditure:
49% of TEH (RM28,023 Million)
MALAYSIA NATIONAL HEALTH ACCOUNTS HEALTH EXPENDITURE REPORT 1997-2017 45

TAB
LE 5
.3.3
b: P
rivat
e S
ecto
r Hea
lth
Expe
ndit
ure
by F
unct
ions
of H
ealt
h C
are,
19
97-
2017
(RM
Mill
ion)
MNH
A Co
deFu
nctio
ns of
Hea
lth C
are
1997
1998
1999
2000
2001
2002
2003
2004
2005
2006
2007
2008
2009
2010
2011
2012
2013
2014
2015
2016
2017
MF1
Se
rvice
s of c
urat
ive ca
re2,
584
2,644
2,86
03,4
363,
355
3,66
84,4
275,1
325,8
826,
638
7,416
8,55
17,8
529,
094
10,6
2711
,620
12,5
4114
,228
15,5
6717
,151
19,4
53
MF2
Se
rvice
s of r
ehab
ilitat
ive ca
re0
00
00
00
00
10
01
11
00
00
00
MF3
Se
rvice
s of l
ong-
term
nur
sing
care
11
22
35
910
1111
144
512
1418
11
14
1
MF4
An
cillar
y se
rvice
s to
healt
h ca
re10
111
010
098
7863
4729
3337
4248
4358
7286
9711
277
4046
MF5
M
edica
l goo
ds d
ispen
sed t
o ou
t-pa
tient
s77
382
685
393
986
187
592
91,0
501,1
111,2
011,3
871,5
561,6
661,8
182,1
362,
339
2,56
13,1
173,
610
3,93
34,
218
MF6
Pu
blic h
ealth
serv
ices (
includ
ing h
ealth
pro
mot
ion an
d pr
even
tion)
281
292
315
309
348
357
350
347
398
390
488
441
413
474
498
580
620
618
719
768
804
MF7
He
alth
prog
ram
me
adm
inist
ratio
n an
d he
alth
insur
ance
363
427
452
527
542
580
760
787
799
852
909
1,011
1,088
1,256
1,450
1,600
1,297
1,246
1,547
1,656
1,693
MR1
Ca
pital
form
ation
of h
ealth
care
pro
vider
inst
itutio
ns6
67
75
78
99
1011
1315
1820
2317
1619
2127
MR2
Ed
ucat
ion an
d tra
ining
of h
ealth
per
sonn
el79
104
131
174
187
229
299
284
280
312
355
364
598
827
884
1,157
1,464
1,327
1,440
1,528
1,494
MR3
Re
sear
ch an
d de
velop
men
t in
healt
h1
11
61
11
11
22
32
22
1717
518
821
124
128
6
MR9
Al
l oth
er h
ealth
-relat
ed ex
pend
iture
s0
00
00
00
00
00
00
00
00
00
00
Tota
l4,
190
4,41
14,
720
5,49
85,
379
5,78
66,
831
7,650
8,52
59,
454
10,6
2311
,991
11,6
8413
,559
15,70
417
,440
18,77
120
,855
23,19
225
,342
28,0
23
TAB
LE 5
.3.3
c: P
rivat
e S
ecto
r Hea
lth
Expe
ndit
ure
by F
unct
ions
of H
ealt
h C
are,
19
97-
2017
(Per
cent
, %)
MNH
A Co
deFu
nctio
ns of
Hea
lth C
are
1997
1998
1999
2000
2001
2002
2003
2004
2005
2006
2007
2008
2009
2010
2011
2012
2013
2014
2015
2016
2017
MF1
Se
rvice
s of c
urat
ive ca
re61
.68
59.9
460
.58
62.4
962
.38
63.3
964
.81
67.0
869
.00
70.2
269
.81
71.3
167
.21
67.0
767
.67
66.6
366
.81
68.2
267
.1267
.68
69.4
2
MF2
Se
rvice
s of r
ehab
ilitat
ive ca
re0.
000.
000.
000.
000.
000.
000.
000.
000.
000.
010.
000.
000.
000.
010.
010.
000.
000.
000.
000.
000.
00
MF3
Se
rvice
s of l
ong-
term
nur
sing
care
0.03
0.03
0.04
0.04
0.05
0.09
0.14
0.13
0.13
0.12
0.13
0.04
0.04
0.09
0.09
0.10
0.00
0.00
0.00
0.01
0.00
MF4
An
cillar
y se
rvice
s to
healt
h ca
re2.4
12.
502.1
21.7
91.4
41.1
00.
690.
380.
390.
390.
390.
400.
370.
420.
460.
490.
520.
540.
330.1
60.1
7
MF5
M
edica
l goo
ds d
ispen
sed t
o ou
t-pa
tient
s18
.45
18.73
18.0
817
.08
16.0
115
.1313
.60
13.73
13.0
312
.7013
.05
12.9
714
.26
13.4
113
.60
13.4
113
.64
14.9
515
.57
15.5
215
.05
MF6
Pu
blic h
ealth
serv
ices (
includ
ing h
ealth
pro
mot
ion an
d pr
even
tion)
6.72
6.62
6.68
5.61
6.46
6.17
5.12
4.54
4.67
4.13
4.60
3.68
3.54
3.50
3.17
3.33
3.30
2.96
3.10
3.03
2.87
MF7
He
alth
prog
ram
me
adm
inist
ratio
n an
d he
alth
insur
ance
8.67
9.67
9.57
9.59
10.0
710
.02
11.12
10.2
99.
379.
018.
568.
439.
319.
269.
249.1
76.
915.9
86.
676.
536.
04
MR1
Ca
pital
form
ation
of h
ealth
care
pro
vider
inst
itutio
ns0.1
40.1
40.1
50.1
30.
090.1
20.1
20.1
20.1
10.1
00.1
10.1
10.1
30.1
30.1
30.1
30.
090.
080.
080.
080.1
0
MR2
Ed
ucat
ion an
d tra
ining
of h
ealth
per
sonn
el1.8
92.
352.7
73.1
63.
483.
964.
383.7
13.
293.
313.
343.
045.1
26.1
05.6
36.
647.8
06.
366.
216.
035.3
3
MR3
Re
sear
ch an
d de
velop
men
t in
healt
h0.
030.
020.
020.1
00.
020.
020.
020.
020.
020.
020.
020.
020.
020.
010.
010.1
00.
930.
900.
910.
951.0
2
MR9
Al
l oth
er h
ealth
-relat
ed ex
pend
iture
s0.
000.
000.
000.
000.
000.
000.
000.
000.
000.
000.
000.
000.
000.
000.
000.
000.
000.
000.
000.
000.
00
Tota
l10
0.00
100.
0010
0.00
100.
0010
0.00
100.
0010
0.00
100.
0010
0.00
100.
0010
0.00
100.
0010
0.00
100.
0010
0.00
100.
0010
0.00
100.
0010
0.00
100.
0010
0.00
46 MALAYSIA NATIONAL HEALTH ACCOUNTS HEALTH EXPENDITURE REPORT 1997-2017

The providers of health care services and products include all hospitals (i.e. health care facilities under MP1 code of MNHA Framework which include general hospitals, psychiatric hospitals and speciality hospitals), nursing and residential care facility providers, providers of ambulatory health care, retail sale and other providers of medical goods, and provision and administration of public health programme providers (Appendix Table A2.2).
HEALTH EXPENDITURE TO PROVIDERS OF HEALTH CARE
This chapter contains four sections. Section 6.1 describes health expenditure to all providers of health care as classified in MNHA Framework. All hospitals and providers of ambulatory care services are reported in the sections (6.2 and 6.3 respectively). A new sub-chapter section 6.4 is added explains further regarding Primary Care (PC) and Primary Health Care (PHC) expenditure. The overview of health expenditure to providers of health care is as shown in Figure 6.0.
CHAPTER 6
MALAYSIA NATIONAL HEALTH ACCOUNTS HEALTH EXPENDITURE REPORT 1997-2017 47
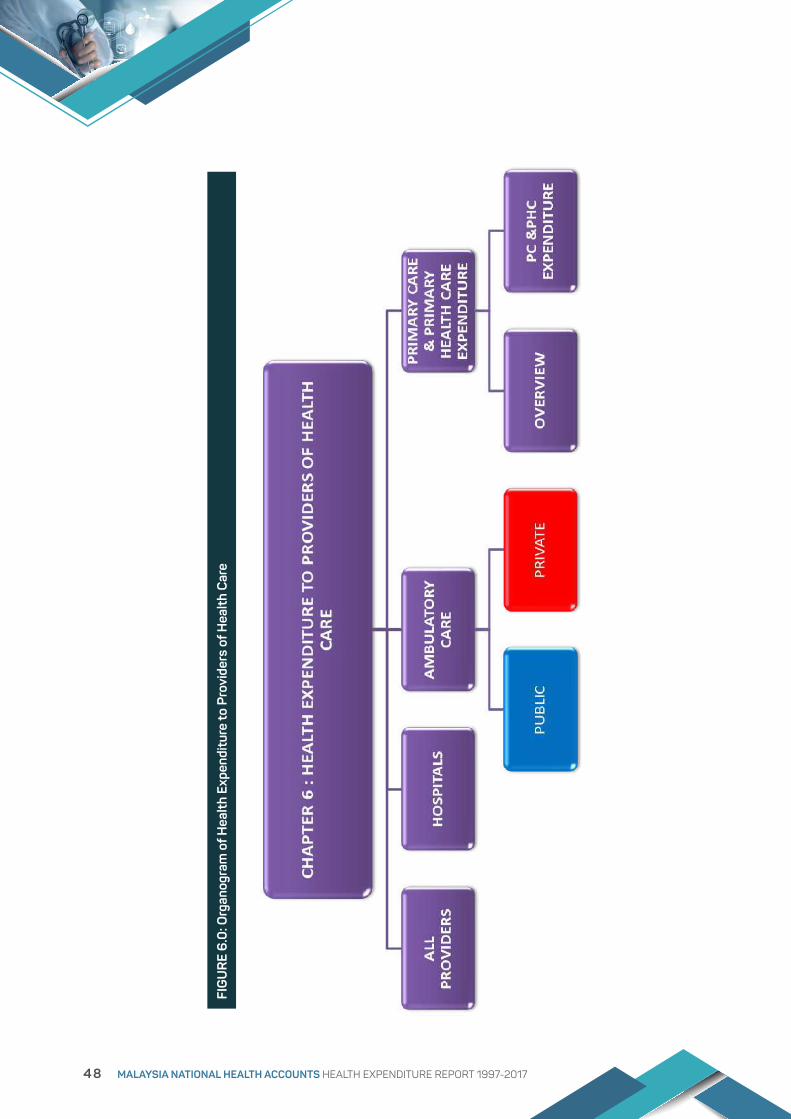
FIG
UR
E 6
.0: O
rgan
ogra
m o
f Hea
lth
Expe
ndit
ure
to P
rovi
ders
of H
ealt
h C
are
48 MALAYSIA NATIONAL HEALTH ACCOUNTS HEALTH EXPENDITURE REPORT 1997-2017
In 2017, analysis of providers of health care shows that all hospitals consumed RM31,595 million or 55% of TEH (Table 6.1a and Figure 6.1). This is followed by providers of ambulatory health care at RM11,901 million (21%), general health administration and insurance providers at RM4,905 million (8 percent), and retail sale and other providers of medical goods at RM3,888 million (7 percent). The remaining providers of health care services and products amounted to RM5,072 million (9 percent) of the TEH.
The 1997 to 2017 time series data also showed a similar pattern with the same top two providers (all hospitals and providers of ambulatory health care)
contributing to an average of 76% share of TEH throughout the time period. Third highest expenditure from 1997 to 2017 was contributed by expenditure to general health administration and insurance providers, however in 2016 third highest expenditure was to retail sale and other providers of medical goods as shown in (Table 6.1b and Table 6.1c). The expenditures of the top two providers increased in absolute Ringgit Malaysia (RM) value by 7-fold over the same time period, whereas spending at retail sale and other providers of medical goods showed increase in absolute RM value by 8-fold. Providers of institutions providing health-related services showed even a higher increase which is by 11-fold.
6.1 HEALTH EXPENDITURE TO ALL PROVIDERS OF HEALTH CARE
MALAYSIA NATIONAL HEALTH ACCOUNTS HEALTH EXPENDITURE REPORT 1997-2017 49

TABLE 6.1a: Total Expenditure on Health to Providers of Health Care, 2017
MNHA Code Providers of Health Care RM Million Percent
MP1 All hospitals 31,595 55.08
MP3 Providers of ambulatory health care 11,901 20.75
MP6 General health administration and insurance 4,905 8.55
MP4 Retail sale and other providers of medical goods 3,888 6.78
MP8 Institutions providing health-related services 2,859 4.98
MP5 Provision and administration of public health programmes 1,582 2.76
MP7 Other industries (rest of the Malaysian economy) 618 1.08
MP9 Rest of the world (ROW) 11 0.02
MP2 Nursing and residential care facilities 2 0.00
Total 57,361 100.00
FIGURE 6.1: Total Expenditure on Health to Providers of Health Care, 2017
55%
21%
8%7%
9%
0%
10%
20%
30%
40%
50%
60%
All hospitals Providers ofambulatory health
care
General healthadmin. &insurance
Retail sale &medical goods
providers
All other providers
Perc
ent
of p
rovi
ders
of h
ealth
car
e
50 MALAYSIA NATIONAL HEALTH ACCOUNTS HEALTH EXPENDITURE REPORT 1997-2017
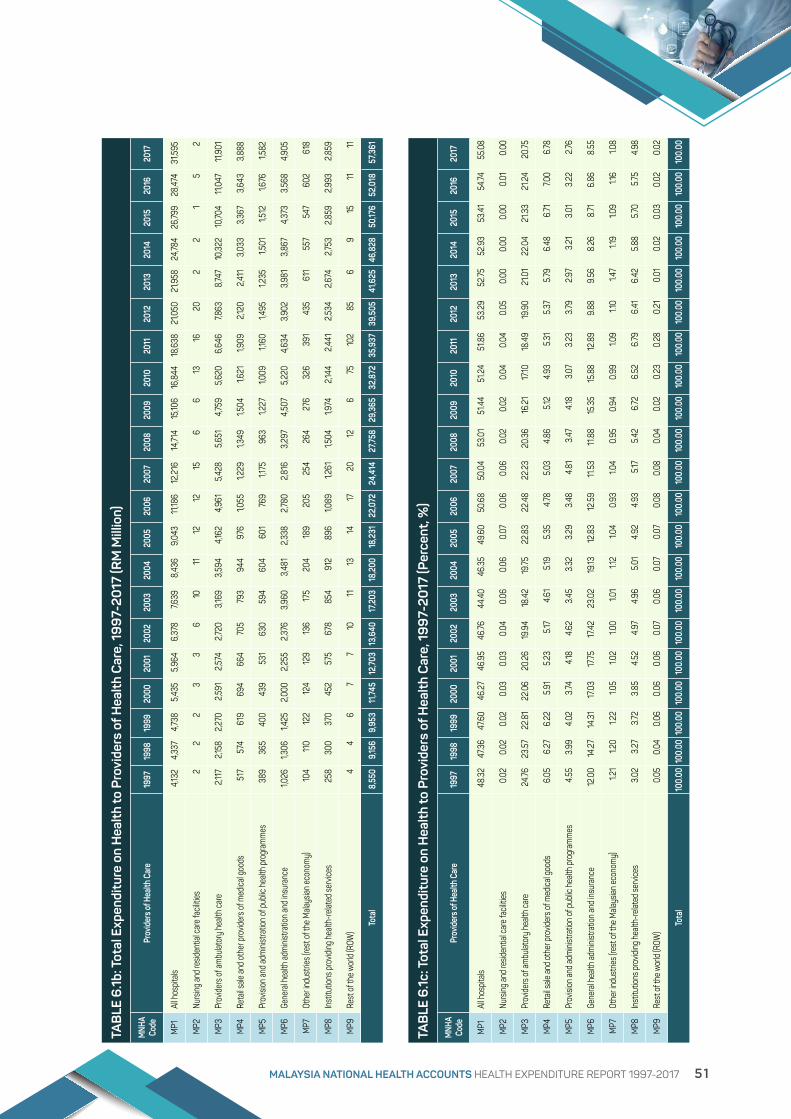
TAB
LE 6
.1b: T
otal
Exp
endi
ture
on
Hea
lth
to P
rovi
ders
of H
ealt
h C
are,
19
97-
2017
(RM
Mill
ion)
MNH
A Co
dePr
ovid
ers o
f Hea
lth C
are
1997
1998
1999
2000
2001
2002
2003
2004
2005
2006
2007
2008
2009
2010
2011
2012
2013
2014
2015
2016
2017
MP1
Al
l hos
pitals
4,13
2 4
,337
4
,738
5,4
35
5,9
64
6,3
78
7,63
9 8
,436
9
,043
11
,186
12,2
16
14,71
4 15
,106
16,8
44
18,6
38
21,0
50
21,9
58
24,7
84
26,7
99
28,
474
31,5
95
MP2
Nu
rsing
and
resid
entia
l car
e fac
ilities
2
2
2
3
3
6
10
11
12
12
15
6
6
13
16
20
2
2
1 5
2
MP3
Pr
ovide
rs o
f am
bulat
ory
healt
h ca
re 2
,117
2,15
8 2
,270
2
,591
2
,574
2
,720
3,16
9 3
,594
4
,162
4,9
61
5,4
28
5,6
51
4,75
9 5
,620
6
,646
7,
863
8,74
7 10
,322
10
,704
11,0
47
11,9
01
MP4
Re
tail s
ale an
d ot
her p
rovid
ers o
f med
ical g
oods
517
5
74
619
6
94
664
70
5 79
3 9
44
976
1,
055
1,22
9 1,
349
1,50
4 1,
621
1,90
9 2
,120
2,41
1 3
,033
3
,367
3
,643
3
,888
MP5
Pr
ovisi
on an
d ad
mini
stra
tion
of p
ublic
hea
lth p
rogr
amm
es 3
89
365
4
00
439
5
31
630
5
94
604
6
01
769
1,17
5 9
63
1,22
7 1,
009
1,16
0 1,
495
1,23
5 1,
501
1,51
2 1,
676
1,58
2
MP6
Ge
nera
l hea
lth ad
mini
stra
tion
and
insur
ance
1,02
6 1,
306
1,42
5 2
,000
2
,255
2
,376
3
,960
3
,481
2
,338
2
,780
2,8
16
3,2
97
4,5
07
5,2
20
4,6
34
3,9
02
3,9
81
3,8
67
4,3
73
3,5
68
4,9
05
MP7
Ot
her in
dust
ries (
rest
of t
he M
alays
ian e
cono
my)
104
110
122
124
129
136
175
204
18
9 2
05
254
2
64
276
3
26
391
4
35
611
5
57
547
6
02
618
MP8
In
stitu
tions
pro
viding
hea
lth-re
lated
serv
ices
258
3
00
370
4
52
575
6
78
854
9
12
896
1,
089
1,26
1 1,
504
1,97
4 2
,144
2,4
41
2,5
34
2,6
74
2,75
3 2
,859
2
,993
2
,859
MP9
Re
st o
f the
wor
ld (R
OW)
4
4
6
7 7
10
11
13
14
17
20
12
6
75
102
85
6
9
15
11
11
Tota
l 8
,550
9
,156
9,9
53
11,74
5 12
,703
13,6
40
17,2
03
18,2
00
18,2
31
22,
072
24,
414
27,7
58
29,
365
32,
872
35,
937
39,
505
41,6
25
46,8
28
50,
176
52,
018
57,3
61
TAB
LE 6
.1c: T
otal
Exp
endi
ture
on
Hea
lth
to P
rovi
ders
of H
ealt
h C
are,
19
97-
2017
(Per
cent
, %)
MNH
A Co
dePr
ovid
ers o
f Hea
lth C
are
1997
1998
1999
2000
2001
2002
2003
2004
2005
2006
2007
2008
2009
2010
2011
2012
2013
2014
2015
2016
2017
MP1
Al
l hos
pitals
48.
32
47.3
6 4
7.60
46.
27
46.
95
46.
76
44.4
0 4
6.35
4
9.60
5
0.68
5
0.04
5
3.01
5
1.44
51.2
4 5
1.86
53.
29
52.7
5 5
2.93
5
3.41
5
4.74
55.0
8
MP2
Nu
rsing
and
resid
entia
l car
e fac
ilities
0.0
2 0
.02
0.0
2 0
.03
0.0
3 0
.04
0.0
6 0
.06
0.0
7 0
.06
0.0
6 0
.02
0.0
2 0
.04
0.0
4 0
.05
0.0
0 0
.00
0.0
0 0
.01
0.0
0
MP3
Pr
ovide
rs o
f am
bulat
ory
healt
h ca
re 2
4.76
23.
57
22.
81
22.0
6 2
0.26
19
.94
18.4
2 19
.75
22.
83
22.4
8 2
2.23
2
0.36
16
.21
17.10
18
.49
19.9
0 2
1.01
22.0
4 2
1.33
21.2
4 2
0.75
MP4
Re
tail s
ale an
d ot
her p
rovid
ers o
f med
ical g
oods
6.0
5 6
.27
6.2
2 5
.91
5.2
3 5
.17
4.6
1 5
.19
5.3
5 4
.78
5.0
3 4
.86
5.12
4
.93
5.3
1 5
.37
5.79
6
.48
6.71
7.
00
6.78
MP5
Pr
ovisi
on an
d ad
mini
stra
tion
of p
ublic
hea
lth p
rogr
amm
es 4
.55
3.9
9 4
.02
3.74
4
.18
4.6
2 3
.45
3.3
2 3
.29
3.4
8 4
.81
3.47
4
.18
3.0
7 3
.23
3.79
2
.97
3.2
1 3
.01
3.2
2 2
.76
MP6
Ge
nera
l hea
lth ad
mini
stra
tion
and
insur
ance
12.0
0 14
.27
14.3
1 17
.03
17.75
17
.42
23.
02
19.13
12
.83
12.5
9 11
.53
11.8
8 15
.35
15.8
8 12
.89
9.8
8 9
.56
8.2
6 8
.71
6.8
6 8
.55
MP7
Ot
her in
dust
ries (
rest
of t
he M
alays
ian e
cono
my)
1.21
1.
20
1.22
1.
05
1.02
1.
00
1.01
1.
12
1.04
0
.93
1.04
0
.95
0.9
4 0
.99
1.09
1.
10
1.47
1.
19
1.09
1.
16
1.08
MP8
In
stitu
tions
pro
viding
hea
lth-re
lated
serv
ices
3.0
2 3
.27
3.72
3
.85
4.5
2 4
.97
4.9
6 5
.01
4.9
2 4
.93
5.17
5
.42
6.72
6
.52
6.79
6
.41
6.4
2 5
.88
5.70
5
.75
4.9
8
MP9
Re
st o
f the
wor
ld (R
OW)
0.0
5 0
.04
0.0
6 0
.06
0.0
6 0
.07
0.0
6 0
.07
0.0
7 0
.08
0.0
8 0
.04
0.0
2 0
.23
0.2
8 0
.21
0.0
1 0
.02
0.0
3 0
.02
0.0
2
Tota
l 10
0.00
100
.00
100.
00
100.
00
100.
00
100.
00
100.
00
100.
00
100.
00
100.
00
100.
00
100.
00
100.
00
100.
00
100.
00
100.
00
100.
00
100.
00
100.
00
100.
00
100.
00
MALAYSIA NATIONAL HEALTH ACCOUNTS HEALTH EXPENDITURE REPORT 1997-2017 51

The cross-tabulations of expenditure at all hospitals and sources of financing responds to the question as to who or which agencies finance for health care services provided at all hospitals in the country.
In 2017, of the RM31,595 million spent at all hospitals, MOH incurred the highest spending at RM15,377 million (49%) followed by private household OOP at RM10,405 million (33%), private insurance enterprises (other than social insurance) at RM3,307 million (10%), Ministry of Education (MOE) at RM1,277 million (4 percent) and other federal agencies (including
statutory bodies) at RM605 million (2 percent) (Table 6.2a and Figure 6.2). The remaining expenditure from various sources at all hospitals amounted to RM623 million (2 percent).
The 1997 to 2017 time-series expenditure by the top two sources of financing at all hospitals, which are MOH and private household OOP amounted to an average of 82% as shown in (Table 6.2b and Table 6.2c). Average of 18% was spent by the remaining sources of financing.
6.2 HEALTH EXPENDITURE TO PROVIDERS OF HEALTH CARE - HOSPITALS
52 MALAYSIA NATIONAL HEALTH ACCOUNTS HEALTH EXPENDITURE REPORT 1997-2017

TABLE 6.2a: Health Expenditure at All Hospitals by Sources of Financing, 2017
MNHA Code Sources of Financing RM Million Percent
MS1.1.1.1 Ministry of Health (MOH) 15,377 48.67
MS2.4 Private household out-of-pocket expenditures (OOP) 10,405 32.93
MS2.2 Private insurance enterprises (other than social insurance) 3,307 10.47
MS1.1.1.2 Ministry of Education (MOE) 1,277 4.04
MS1.1.1.9 Other federal agencies (including statutory bodies) 605 1.91
MS2.6 All corporations (other than health insurance) 179 0.57
MS1.1.2.2 Other state agencies (including statutory bodies) 150 0.48
MS1.2.2 Social Security Organization (SOCSO) 125 0.40
MS1.1.1.3 Ministry of Defence (MOD) 84 0.26
MS1.2.1 Employees Provident Fund (EPF) 48 0.15
MS1.1.3 Local authorities (LA) 20 0.06
MS1.1.2.1 (General) State government 16 0.05
MS2.5 Non-profit institutions serving households (NGO) 1 <0.01
Total 31,595 100.00
FIGURE 6.2: Health Expenditure at All Hospitals by Sources of Financing, 2017
49%33%
10%
4%2% 2%
MOH
Private household OOP
Private insurance
MOE
Other federal agencies
All other sources offinancing
Health Expenditure at All Hospitals:55% of TEH(RM31,595
Million)
MALAYSIA NATIONAL HEALTH ACCOUNTS HEALTH EXPENDITURE REPORT 1997-2017 53
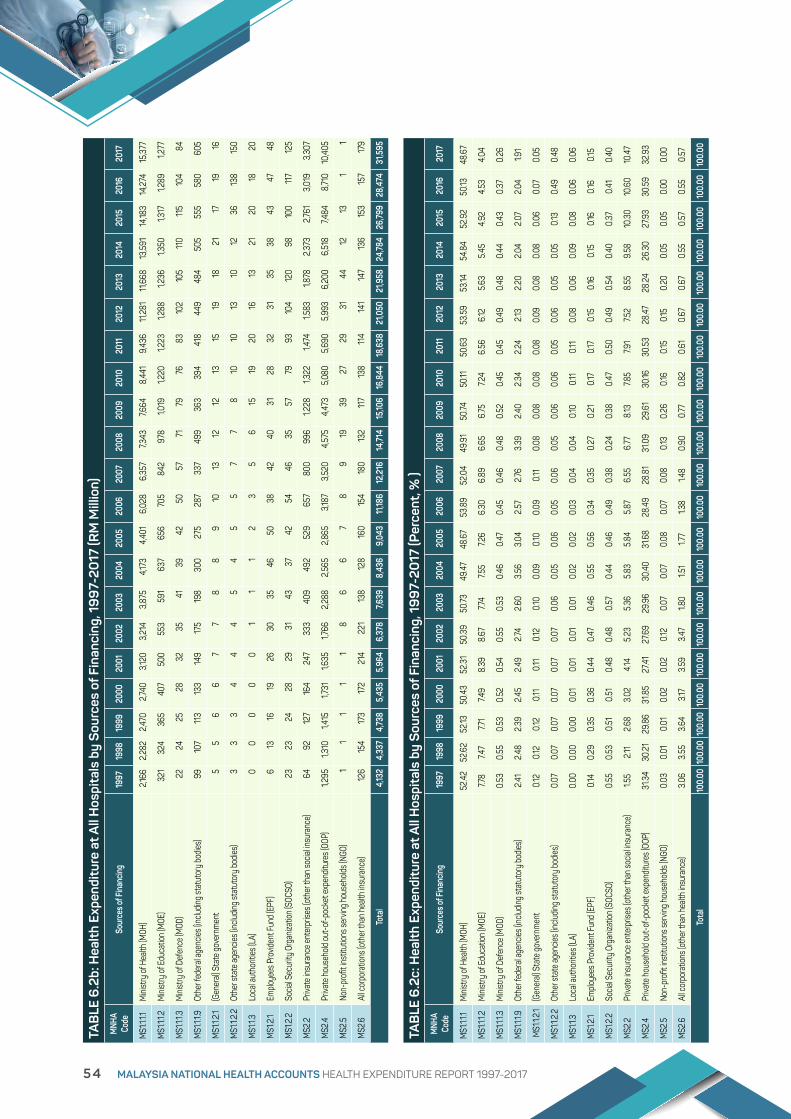
TAB
LE 6
.2b:
Hea
lth
Expe
ndit
ure
at A
ll H
ospi
tals
by
Sou
rces
of F
inan
cing
, 19
97-
2017
(RM
Mill
ion)
MNH
A Co
deSo
urce
s of F
inan
cing
1997
1998
1999
2000
2001
2002
2003
2004
2005
2006
2007
2008
2009
2010
2011
2012
2013
2014
2015
2016
2017
MS1
.1.1.1
Mini
stry
of H
ealth
(MOH
)2,1
662,
282
2,470
2,740
3,120
3,21
43,
875
4,173
4,401
6,02
86,
357
7,343
7,664
8,44
19,
436
11,2
8111
,668
13,5
9114
,183
14,2
7415
,377
MS1
.1.1.2
M
inist
ry o
f Edu
catio
n (M
OE)
321
324
365
407
500
553
591
637
656
705
842
978
1,019
1,220
1,223
1,288
1,236
1,350
1,317
1,289
1,277
MS1
.1.1.3
M
inist
ry o
f Def
ence
(MOD
)22
2425
2832
3541
3942
5057
7179
7683
102
105
110
115
104
84
MS1
.1.1.9
Ot
her f
eder
al ag
encie
s (inc
luding
stat
utor
y bo
dies)
9910
711
313
314
917
519
830
027
528
733
749
936
339
441
844
948
450
555
558
060
5
MS1
.1.2.1
(Gen
eral)
Sta
te g
over
nmen
t5
56
67
78
89
1013
1212
1315
1918
2117
1916
MS1
.1.2.2
Ot
her s
tate
agen
cies (
includ
ing st
atut
ory
bodie
s)3
33
44
45
45
57
78
1010
1310
1236
138
150
MS1
.1.3
Loca
l aut
horit
ies (L
A)0
00
00
11
12
35
615
1920
1613
2120
1820
MS1
.2.1
Emplo
yees
Pro
viden
t Fun
d (E
PF)
613
1619
2630
3546
5038
4240
3128
3231
3538
4347
48
MS1
.2.2
So
cial S
ecur
ity O
rgan
izatio
n (S
OCSO
)23
2324
2829
3143
3742
5446
3557
7993
104
120
9810
011
712
5
MS2
.2
Priva
te in
sura
nce
ente
rpris
es (o
ther
than
socia
l insu
ranc
e)64
9212
716
424
733
340
949
252
965
780
099
61,2
281,3
221,4
741,5
831,8
782,
373
2,761
3,01
93,
307
MS2
.4
Priva
te h
ouse
hold
out-
of-p
ocke
t exp
endit
ures
(OOP
)1,2
951,3
101,4
151,7
311,6
351,7
662,
288
2,56
52,
865
3,187
3,52
04,
575
4,473
5,080
5,690
5,993
6,20
06,
518
7,484
8,71
010
,405
MS2
.5
Non-
profi
t ins
titut
ions s
ervin
g ho
useh
olds (
NGO)
11
11
18
66
78
919
3927
2931
4412
131
1
MS2
.6
All c
orpo
ratio
ns (o
ther
than
hea
lth in
sura
nce)
126
154
173
172
214
221
138
128
160
154
180
132
117
138
114
141
147
136
153
157
179
Tota
l 4,
132
4,33
74,
738
5,43
55,
964
6,37
87,6
398,
436
9,04
311
,186
12,2
1614
,714
15,10
616
,844
18,6
3821
,050
21,9
5824
,784
26,79
928
,474
31,5
95
TAB
LE 6
.2c:
Hea
lth
Expe
ndit
ure
at A
ll H
ospi
tals
by
Sou
rces
of F
inan
cing
, 19
97-
2017
(Per
cent
, % )
MNH
A Co
deSo
urce
s of F
inan
cing
1997
1998
1999
2000
2001
2002
2003
2004
2005
2006
2007
2008
2009
2010
2011
2012
2013
2014
2015
2016
2017
MS1
.1.1.1
Mini
stry
of H
ealth
(MOH
)52
.42
52.6
252
.1350
.43
52.3
150
.39
50.73
49.47
48.6
753
.89
52.0
449
.91
50.74
50.11
50.6
353
.59
53.14
54.8
452
.92
50.13
48.6
7
MS1
.1.1.2
M
inist
ry o
f Edu
catio
n (M
OE)
7.78
7.47
7.71
7.49
8.39
8.67
7.74
7.55
7.26
6.30
6.89
6.65
6.75
7.24
6.56
6.12
5.63
5.45
4.92
4.53
4.04
MS1
.1.1.3
M
inist
ry o
f Def
ence
(MOD
)0.
530.
550.
530.
520.
540.
550.
530.
460.
470.
450.
460.
480.
520.
450.
450.
490.
480.
440.
430.
370.
26
MS1
.1.1.9
Ot
her f
eder
al ag
encie
s (inc
luding
stat
utor
y bo
dies)
2.41
2.48
2.39
2.45
2.49
2.74
2.60
3.56
3.04
2.57
2.76
3.39
2.40
2.34
2.24
2.13
2.20
2.04
2.07
2.04
1.91
MS1
.1.2.1
(Gen
eral)
Sta
te g
over
nmen
t0.1
20.1
20.1
20.1
10.1
10.1
20.1
00.
090.1
00.
090.1
10.
080.
080.
080.
080.
090.
080.
080.
060.
070.
05
MS1
.1.2.2
Ot
her s
tate
agen
cies (
includ
ing st
atut
ory
bodie
s)0.
070.
070.
070.
070.
070.
070.
060.
050.
060.
050.
060.
050.
060.
060.
050.
060.
050.
050.1
30.
490.
48
MS1
.1.3
Loca
l aut
horit
ies (L
A)0.
000.
000.
000.
010.
010.
010.
010.
020.
020.
030.
040.
040.1
00.1
10.1
10.
080.
060.
090.
080.
060.
06
MS1
.2.1
Emplo
yees
Pro
viden
t Fun
d (E
PF)
0.14
0.29
0.35
0.36
0.44
0.47
0.46
0.55
0.56
0.34
0.35
0.27
0.21
0.17
0.17
0.15
0.16
0.15
0.16
0.16
0.15
MS1
.2.2
So
cial S
ecur
ity O
rgan
izatio
n (S
OCSO
)0.
550.
530.
510.
510.
480.
480.
570.
440.
460.
490.
380.
240.
380.
470.
500.
490.
540.
400.
370.
410.
40
MS2
.2
Priva
te in
sura
nce
ente
rpris
es (o
ther
than
socia
l insu
ranc
e)1.5
52.1
12.6
83.
024.1
45.
235.3
65.
835.
845.
876.
556.
778.1
37.8
57.9
17.5
28.
559.
5810
.30
10.6
010
.47
MS2
.4
Priva
te h
ouse
hold
out-
of-p
ocke
t exp
endit
ures
(OOP
)31
.34
30.2
129
.86
31.8
527
.41
27.6
929
.96
30.4
031
.68
28.4
928
.81
31.0
929
.61
30.16
30.5
328
.4728
.24
26.3
027
.93
30.5
932
.93
MS2
.5
Non-
profi
t ins
titut
ions s
ervin
g ho
useh
olds (
NGO)
0.03
0.01
0.01
0.02
0.02
0.12
0.07
0.07
0.08
0.07
0.08
0.13
0.26
0.16
0.15
0.15
0.20
0.05
0.05
0.00
0.00
MS2
.6
All c
orpo
ratio
ns (o
ther
than
hea
lth in
sura
nce)
3.06
3.55
3.64
3.17
3.59
3.47
1.80
1.51
1.77
1.38
1.48
0.90
0.77
0.82
0.61
0.67
0.67
0.55
0.57
0.55
0.57
Tota
l10
0.00
100.
0010
0.00
100.
0010
0.00
100.
0010
0.00
100.
0010
0.00
100.
0010
0.00
100.
0010
0.00
100.
0010
0.00
100.
0010
0.00
100.
0010
0.00
100.
0010
0.00
54 MALAYSIA NATIONAL HEALTH ACCOUNTS HEALTH EXPENDITURE REPORT 1997-2017
Providers of ambulatory health care services is the next largest provider of health care after all hospitals. Ambulatory healthcare comprises a wide range of providers such as providers of medical clinics, dental clinics, family planning centres, substance abuse centres, dialysis centres, medical and diagnostic centres, ambulance providers and many other outpatient providers who do provide inpatient services. The MNHA Framework and SHA 1.0 also includes providers of Traditional and Complementary Medicine under this category.
In 2017, providers of ambulatory health care consumed RM11,901 million (21%) of TEH. Of this amount, RM6,972 million (59%) is funded by private sector source of financing and the remaining RM4,930 million (41%) by public sector source of financing (Table 6.3a and Figure 6.3).
6.3 HEALTH EXPENDITURE TO PROVIDERS OF HEALTH CARE – PROVIDERS OF AMBULATORY HEALTH CARE
The 1997 to 2017 time-series data shows that the expenditure in absolute Ringgit Malaysia (RM) value for ambulatory care services increased by 4-fold in private sector and 11-fold in public sector (Table 6.3b and Table 6.3c). The private sector spending was higher than public sector spending over the time period, with the rate of increase in private sector spending in absolute RM value from 2010 onwards showed rapid rise compared to public sector expenditure. One of the possible contributing factors for this finding is that there was increased demand for services delivered by standalone private providers of ambulatory health care and most of these services are delivered as part of public hospital services at subsidised cost.
MALAYSIA NATIONAL HEALTH ACCOUNTS HEALTH EXPENDITURE REPORT 1997-2017 55

TABLE 6.3a: Health Expenditure to Providers of Ambulatory Health Care by Sources of Financing, 2017
MNHA Code Sources of Financing RM Million Percent
MS2 Private sector 6,972 58.58
MS1 Public sector 4,930 41.42
Total 11,901 100.00
FIGURE 6.3: Health Expenditure to Providers of Ambulatory Health Care (non-hospital setting) by Sources of Financing, 2017
MNHA HEALTH EXPENDITURE REPORT 1997-2017 63
MN
HA
HE
ALT
H E
XP
EN
DIT
UR
E R
EP
OR
T 19
97-2
015
63
MNHA Code Sources of Financing RM Million PercentMS2 Private sector 6,972 58.58MS1 Public sector 4,930 41.42
11,901 100.00
TABLE 6.3a: Health Expenditure to Providers of Ambulatory Health Care by Sources of Financing, 2017
Total
FIGURE 6.3: Health Expenditure to Providers of Ambulatory Health Care (non-hospital setting)by Sources of Financing, 2017
59%
41%Private sector
Public Sector
Ambulatory Health Care 21% of TEH
(RM11,901 million)
56 MALAYSIA NATIONAL HEALTH ACCOUNTS HEALTH EXPENDITURE REPORT 1997-2017

TAB
LE 6
.3b:
Hea
lth
Expe
ndit
ure
to P
rovi
ders
of A
mbu
lato
ry H
ealt
h C
are
by S
ourc
es o
f Fin
anci
ng, 1
99
7-20
17 (R
M M
illio
n)
MNH
A Co
deSo
urce
s of F
inan
cing
1997
1998
1999
2000
2001
2002
2003
2004
2005
2006
2007
2008
2009
2010
2011
2012
2013
2014
2015
2016
2017
MS1
Pu
blic s
ecto
r 4
21
454
5
24
620
74
1 8
36
1,10
1 1,
226
1,33
1 1,
805
1,91
2 2
,194
2,16
9 2
,488
2
,749
3,3
01
3,51
8 4
,143
4,4
04
4,5
38
4,9
30
MS2
Pr
ivate
sect
or 1,
696
1,70
4 1,
747
1,97
1 1,
833
1,88
5 2
,068
2
,369
2
,831
3
,156
3,51
7 3
,456
2
,590
3
,133
3,8
97
4,5
62
5,2
29
6,17
9 6
,300
6
,509
6
,972
Tota
l 2
,117
2,15
8 2
,270
2
,591
2
,574
2
,720
3,16
9 3
,594
4
,162
4,9
61
5,4
28
5,6
51
4,75
9 5
,620
6
,646
7,
863
8,74
7 10
,322
10
,704
11,0
47
11,9
01
TAB
LE 6
.3c:
Hea
lth
Expe
ndit
ure
to P
rovi
ders
of A
mbu
lato
ry H
ealt
h C
are
by S
ourc
es o
f Fin
anci
ng, 1
99
7-20
17 (P
erce
nt, %
)
MNH
A Co
deSo
urce
s of F
inan
cing
1997
1998
1999
2000
2001
2002
2003
2004
2005
2006
2007
2008
2009
2010
2011
2012
2013
2014
2015
2016
2017
MS1
Pu
blic s
ecto
r 19
.87
21.0
5 2
3.07
2
3.93
2
8.78
3
0.72
3
4.73
34.1
0 3
1.97
36.
39
35.
22
38.
83
45.
58
44.
26
41.3
6 4
1.98
40.
22
40.1
4 4
1.14
41.0
8 4
1.42
MS2
Pr
ivate
sect
or 8
0.13
78.9
5 76
.93
76.0
7 71
.22
69.
28
65.
27
65.9
0 6
8.03
6
3.61
6
4.78
61.1
7 5
4.42
55.7
4 5
8.64
5
8.02
5
9.78
59.
86
58.
86
58.
92
58.
58
Tota
l 10
0.00
100
.00
100.
00 1
00.0
0 10
0.00
10
0.00
10
0.00
10
0.00
10
0.00
10
0.00
10
0.00
10
0.00
10
0.00
10
0.00
10
0.00
10
0.00
10
0.00
10
0.00
10
0.00
10
0.00
10
0.00
MALAYSIA NATIONAL HEALTH ACCOUNTS HEALTH EXPENDITURE REPORT 1997-2017 57
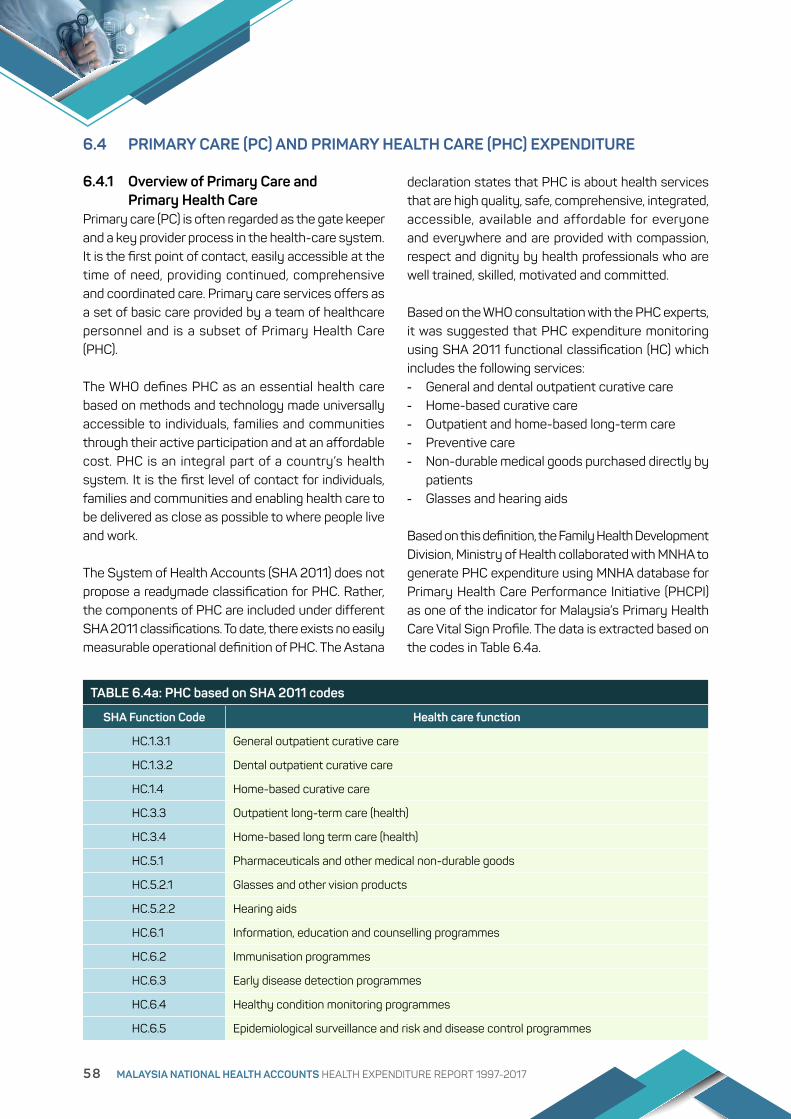
6.4.1 Overview of Primary Care and Primary Health CarePrimary care (PC) is often regarded as the gate keeper and a key provider process in the health-care system. It is the first point of contact, easily accessible at the time of need, providing continued, comprehensive and coordinated care. Primary care services offers as a set of basic care provided by a team of healthcare personnel and is a subset of Primary Health Care (PHC).
The WHO defines PHC as an essential health care based on methods and technology made universally accessible to individuals, families and communities through their active participation and at an affordable cost. PHC is an integral part of a country’s health system. It is the first level of contact for individuals, families and communities and enabling health care to be delivered as close as possible to where people live and work.
The System of Health Accounts (SHA 2011) does not propose a readymade classification for PHC. Rather, the components of PHC are included under different SHA 2011 classifications. To date, there exists no easily measurable operational definition of PHC. The Astana
declaration states that PHC is about health services that are high quality, safe, comprehensive, integrated, accessible, available and affordable for everyone and everywhere and are provided with compassion, respect and dignity by health professionals who are well trained, skilled, motivated and committed.
Based on the WHO consultation with the PHC experts, it was suggested that PHC expenditure monitoring using SHA 2011 functional classification (HC) which includes the following services:- General and dental outpatient curative care- Home-based curative care- Outpatient and home-based long-term care- Preventive care- Non-durable medical goods purchased directly by patients- Glasses and hearing aids
Based on this definition, the Family Health Development Division, Ministry of Health collaborated with MNHA to generate PHC expenditure using MNHA database for Primary Health Care Performance Initiative (PHCPI) as one of the indicator for Malaysia’s Primary Health Care Vital Sign Profile. The data is extracted based on the codes in Table 6.4a.
6.4 PRIMARY CARE (PC) AND PRIMARY HEALTH CARE (PHC) EXPENDITURE
TABLE 6.4a: PHC based on SHA 2011 codes
SHA Function Code Health care function
HC.1.3.1 General outpatient curative care
HC.1.3.2 Dental outpatient curative care
HC.1.4 Home-based curative care
HC.3.3 Outpatient long-term care (health)
HC.3.4 Home-based long term care (health)
HC.5.1 Pharmaceuticals and other medical non-durable goods
HC.5.2.1 Glasses and other vision products
HC.5.2.2 Hearing aids
HC.6.1 Information, education and counselling programmes
HC.6.2 Immunisation programmes
HC.6.3 Early disease detection programmes
HC.6.4 Healthy condition monitoring programmes
HC.6.5 Epidemiological surveillance and risk and disease control programmes
58 MALAYSIA NATIONAL HEALTH ACCOUNTS HEALTH EXPENDITURE REPORT 1997-2017
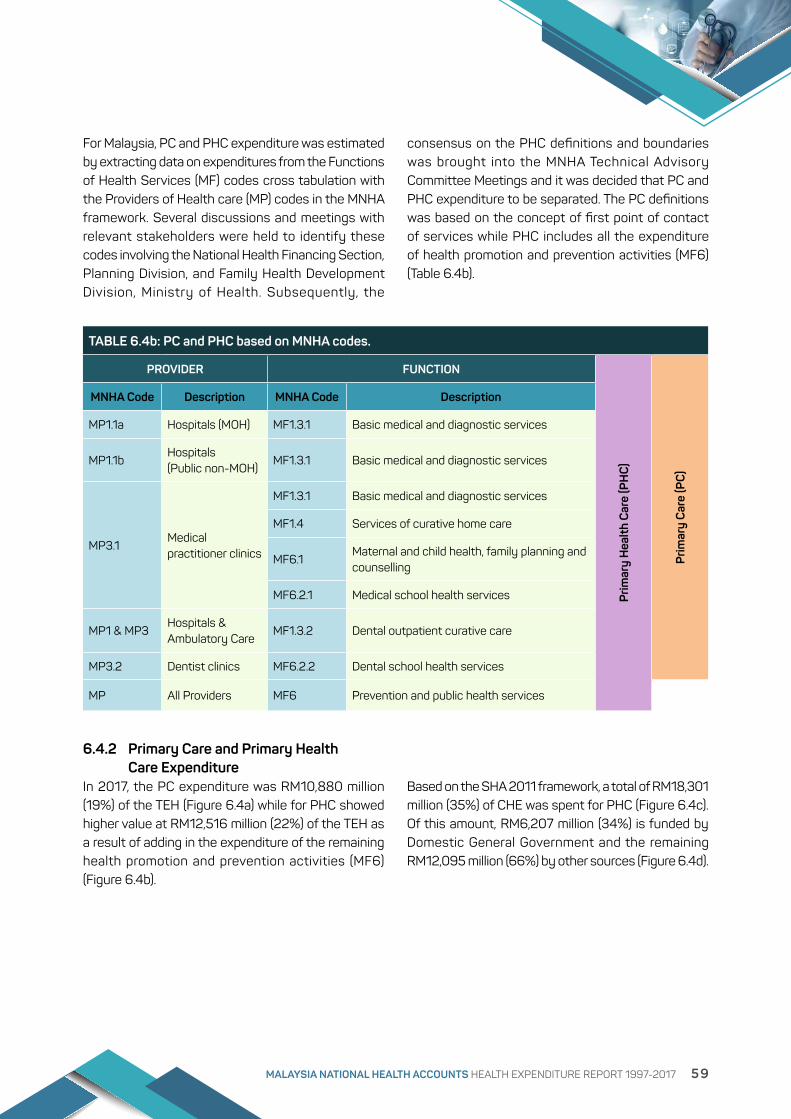
For Malaysia, PC and PHC expenditure was estimated by extracting data on expenditures from the Functions of Health Services (MF) codes cross tabulation with the Providers of Health care (MP) codes in the MNHA framework. Several discussions and meetings with relevant stakeholders were held to identify these codes involving the National Health Financing Section, Planning Division, and Family Health Development Division, Ministry of Health. Subsequently, the
consensus on the PHC definitions and boundaries was brought into the MNHA Technical Advisory Committee Meetings and it was decided that PC and PHC expenditure to be separated. The PC definitions was based on the concept of first point of contact of services while PHC includes all the expenditure of health promotion and prevention activities (MF6) (Table 6.4b).
6.4.2 Primary Care and Primary Health Care ExpenditureIn 2017, the PC expenditure was RM10,880 million (19%) of the TEH (Figure 6.4a) while for PHC showed higher value at RM12,516 million (22%) of the TEH as a result of adding in the expenditure of the remaining health promotion and prevention activities (MF6) (Figure 6.4b).
Based on the SHA 2011 framework, a total of RM18,301 million (35%) of CHE was spent for PHC (Figure 6.4c). Of this amount, RM6,207 million (34%) is funded by Domestic General Government and the remaining RM12,095 million (66%) by other sources (Figure 6.4d).
TABLE 6.4b: PC and PHC based on MNHA codes.
PROVIDER FUNCTION
Prim
ary
Hea
lth
Car
e (P
HC
)
Prim
ary
Car
e (P
C)
MNHA Code Description MNHA Code Description
MP1.1a Hospitals (MOH) MF1.3.1 Basic medical and diagnostic services
MP1.1bHospitals (Public non-MOH)
MF1.3.1 Basic medical and diagnostic services
MP3.1Medical practitioner clinics
MF1.3.1 Basic medical and diagnostic services
MF1.4 Services of curative home care
MF6.1Maternal and child health, family planning and counselling
MF6.2.1 Medical school health services
MP1 & MP3Hospitals & Ambulatory Care
MF1.3.2 Dental outpatient curative care
MP3.2 Dentist clinics MF6.2.2 Dental school health services
MP All Providers MF6 Prevention and public health services
MALAYSIA NATIONAL HEALTH ACCOUNTS HEALTH EXPENDITURE REPORT 1997-2017 59

MNHA HEALTH EXPENDITURE REPORT 1997-2017 68
FIGURE 6.4a: Primary Care Expenditure as Percentage of Total Expenditure on Health, 2017
FIGURE 6.4b: Primary Health Care Expenditure as Percentage of Total Expenditure on Health, 2017
19%
81%
Primary Care Others
22%
78%
Primary Health Care Others
Total Expenditure on
Health 2017: RM57,361
Million
Total Expenditure on Health 2017:
RM 57,361 Million
FIGURE 6.4a: Primary Care Expenditure as Percentage of Total Expenditure on Health, 2017
FIGURE 6.4b: Primary Health Care Expenditure as Percentage of Total Expenditure on Health, 2017
60 MALAYSIA NATIONAL HEALTH ACCOUNTS HEALTH EXPENDITURE REPORT 1997-2017
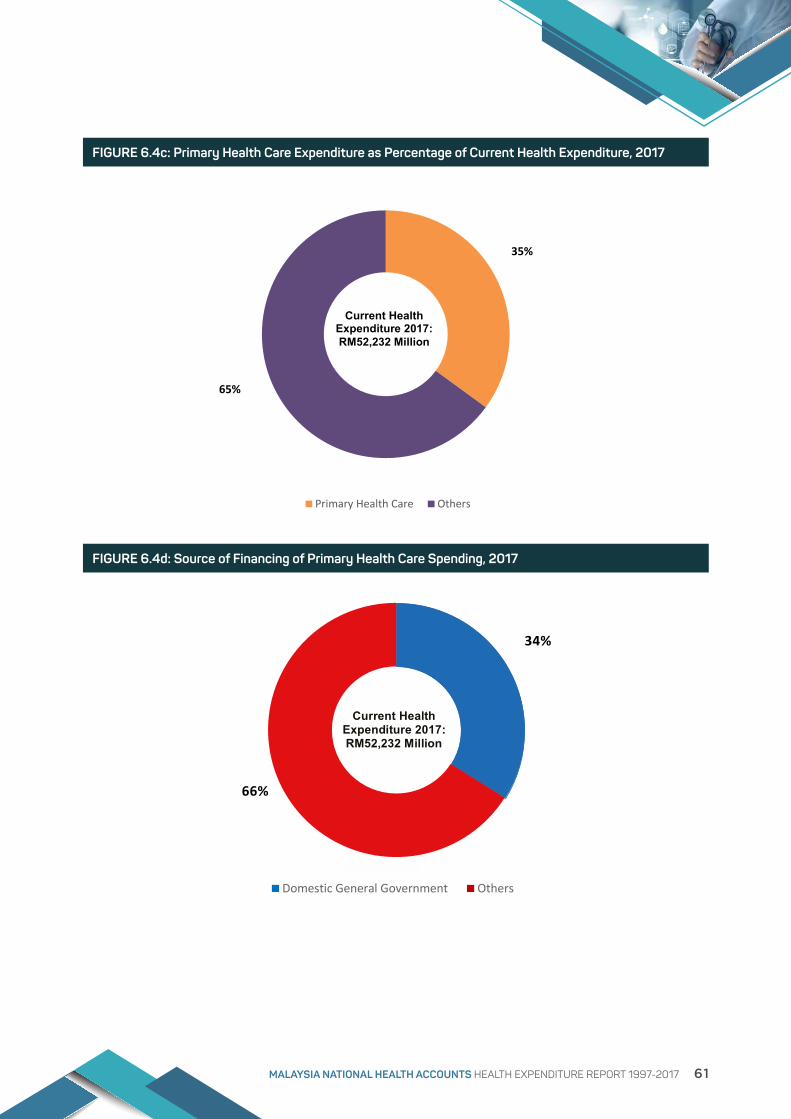
MNHA HEALTH EXPENDITURE REPORT 1997-2017 69
FIGURE 6.4c: Primary Health Care Expenditure as Percentage of Current Health Expenditure, 2017
FIGURE 6.4d: Source of Financing of Primary Health Care Spending, 2017
35%
65%
Primary Health Care Others
34%
66%
Domestic General Government Others
Current Health Expenditure 2017: RM52,232 Million
Current Health Expenditure 2017:RM52,232 Million
FIGURE 6.4d: Source of Financing of Primary Health Care Spending, 2017
FIGURE 6.4c: Primary Health Care Expenditure as Percentage of Current Health Expenditure, 2017
34%
66%
Current Health Expenditure 2017: RM52,232 Million
MALAYSIA NATIONAL HEALTH ACCOUNTS HEALTH EXPENDITURE REPORT 1997-2017 61
This chapter describes the type of services purchased with the financial resources. Health expenditure by functions of health care is categorised into two, namely the ‘core functions of health care’ (MF) and ‘health-related functions’ (MR).
This chapter has four sections. Section 7.1 describes health expenditure according to MNHA classification of all functions of health care for year 2017, followed by time series data of 1997-2017 in RM Million and percentage. Section 7.2 explains about services of curative care expenditure, section 7.3 is regarding public health services (including health promotion and prevention) expenditure and section 7.4 describes expenditure for health education and training.
7.1 HEALTH EXPENDITURE BY ALL FUNCTIONS OF HEALTH CARE
In 2017, the expenditure for services of curative care amounted to RM40,166 million (70%) of TEH (Table 7.1a and Figure 7.1). This is followed by expenditure of health programme administration and health insurance at
HEALTH EXPENDITURE BY FUNCTIONS OF HEALTH CARE
RM4,770 million (8 percent), medical goods dispensed to out-patient at RM4,551 million (8 percent) and RM2,961 million (5 percent) for public health services (including health promotion and prevention). A total of RM2,865 million (5 percent) was spent for education and training of health personnel, RM1,379 million (2 percent) for capital formation of health care provider institutions with the remaining RM668 million (2 percent) was spent on all remaining.
The 1997 to 2017 time series data showed an average of 90% of the total expenditure was spent for the top five functions as illustrated in Table 7.1b and Table 7.1c. Between 1997 and 2009, the top four functions were services of curative care, medical goods dispensed to outpatients, health programme administration and health insurance and capital formation. A change in pattern started in year 2010 and from 2011 onwards, education and training of health personnel took over the place of capital formation in the top four health expenditure by functions. It is important to also note that services of curative care expenditure trend showed increasing pattern throughout the time period.
CHAPTER 7
62 MALAYSIA NATIONAL HEALTH ACCOUNTS HEALTH EXPENDITURE REPORT 1997-2017
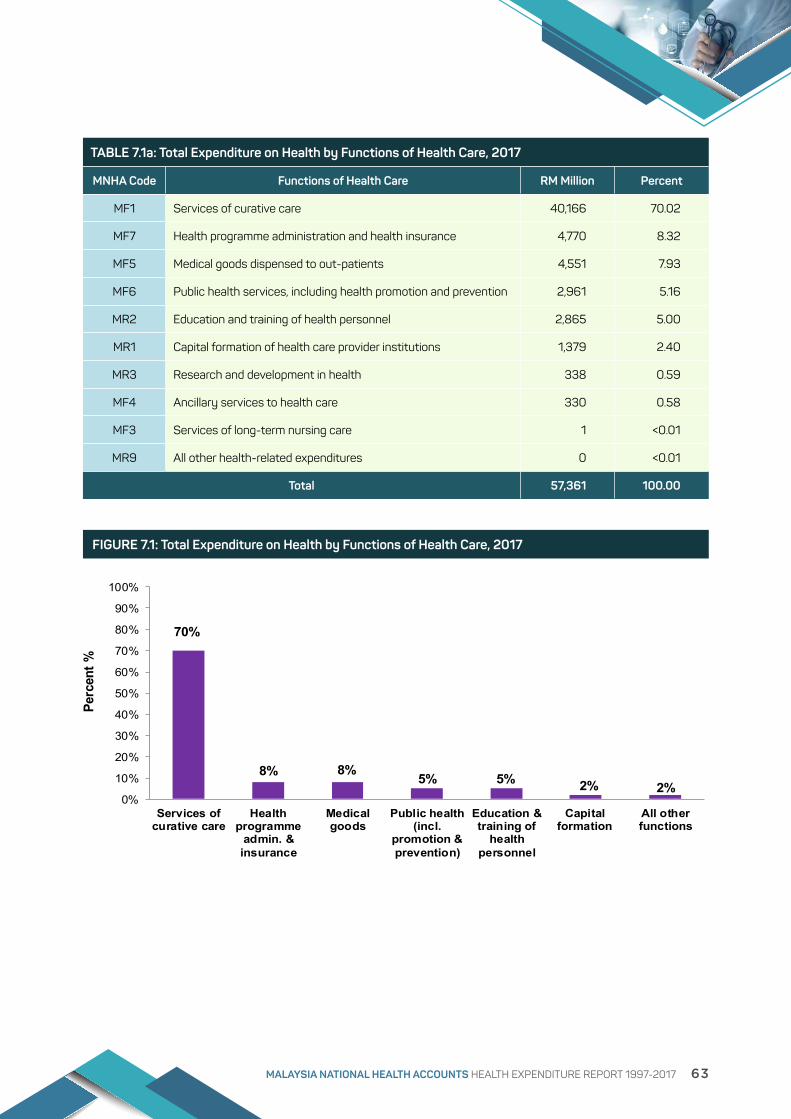
70%
8% 8%5% 5% 2% 2%
0%
10%
20%
30%
40%
50%
60%
70%
80%
90%
100%
Services ofcurative care
Healthprogramme
admin. &insurance
Medicalgoods
Public health(incl.
promotion &prevention)
Education &training of
healthpersonnel
Capitalformation
All otherfunctions
Perc
ent %
FIGURE 7.1: Total Expenditure on Health by Functions of Health Care, 2017
TABLE 7.1a: Total Expenditure on Health by Functions of Health Care, 2017
MNHA Code Functions of Health Care RM Million Percent
MF1 Services of curative care 40,166 70.02
MF7 Health programme administration and health insurance 4,770 8.32
MF5 Medical goods dispensed to out-patients 4,551 7.93
MF6 Public health services, including health promotion and prevention 2,961 5.16
MR2 Education and training of health personnel 2,865 5.00
MR1 Capital formation of health care provider institutions 1,379 2.40
MR3 Research and development in health 338 0.59
MF4 Ancillary services to health care 330 0.58
MF3 Services of long-term nursing care 1 <0.01
MR9 All other health-related expenditures 0 <0.01
Total 57,361 100.00
MALAYSIA NATIONAL HEALTH ACCOUNTS HEALTH EXPENDITURE REPORT 1997-2017 63
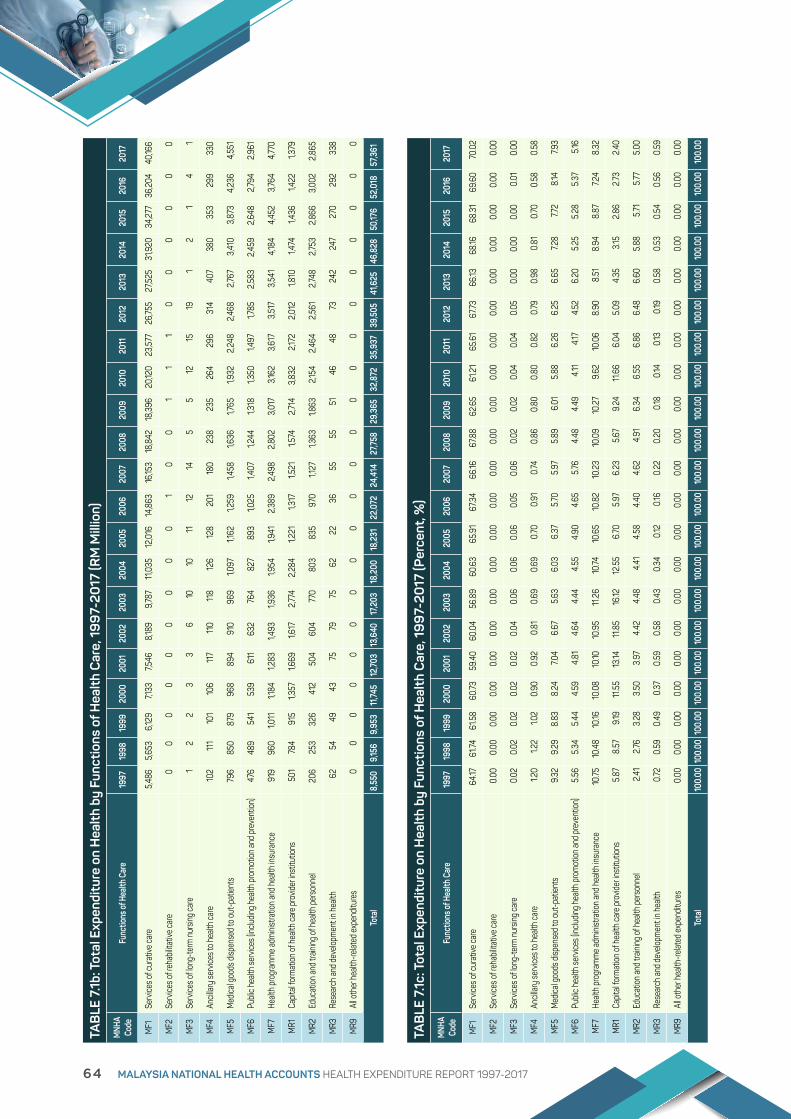
TAB
LE 7
.1b: T
otal
Exp
endi
ture
on
Hea
lth
by F
unct
ions
of H
ealt
h C
are,
19
97-
2017
(RM
Mill
ion)
MNH
A Co
deFu
nctio
ns of
Hea
lth C
are
1997
1998
1999
2000
2001
2002
2003
2004
2005
2006
2007
2008
2009
2010
2011
2012
2013
2014
2015
2016
2017
MF1
Se
rvice
s of c
urat
ive ca
re5,4
865,6
536,1
297,1
337,5
468,1
899,7
8711
,035
12,0
1614
,863
16,15
318
,842
18,3
9620
,120
23,5
7726
,755
27,5
2531
,920
34,2
7736
,204
40,16
6
MF2
Se
rvice
s of r
ehab
ilitat
ive ca
re0
00
00
00
00
10
01
11
00
00
00
MF3
Se
rvice
s of l
ong-
term
nur
sing
care
12
23
36
1010
1112
145
512
1519
12
14
1
MF4
An
cillar
y se
rvice
s to
healt
h ca
re10
211
110
110
611
711
011
812
612
820
118
023
823
526
429
631
440
738
035
329
933
0
MF5
M
edica
l goo
ds d
ispen
sed t
o ou
t-pa
tient
s79
685
087
996
889
491
096
91,0
971,1
621,2
591,4
581,6
361,7
651,9
322,
248
2,468
2,767
3,410
3,87
34,
236
4,55
1
MF6
Pu
blic h
ealth
serv
ices (
includ
ing h
ealth
pro
mot
ion an
d pr
even
tion)
476
489
541
539
611
632
764
827
893
1,025
1,407
1,244
1,318
1,350
1,497
1,785
2,58
32,4
592,6
482,7
942,9
61
MF7
He
alth
prog
ram
me
adm
inist
ratio
n an
d he
alth
insur
ance
919
960
1,011
1,184
1,283
1,493
1,936
1,954
1,941
2,38
92,4
982,
802
3,01
73,1
623,
617
3,51
73,
541
4,184
4,452
3,764
4,770
MR1
Ca
pital
form
ation
of h
ealth
care
pro
vider
inst
itutio
ns50
178
491
51,3
571,6
691,6
172,7
742,
284
1,221
1,317
1,521
1,574
2,714
3,83
22,1
722,0
121,8
101,4
741,4
361,4
221,3
79
MR2
Ed
ucat
ion an
d tra
ining
of h
ealth
per
sonn
el20
625
332
641
250
460
477
080
383
597
01,1
271,3
631,8
632,1
542,4
642,
561
2,748
2,753
2,86
63,
002
2,86
5
MR3
Re
sear
ch an
d de
velop
men
t in
healt
h62
5449
4375
7975
6222
3655
5551
4648
7324
224
727
029
233
8
MR9
Al
l oth
er h
ealth
-relat
ed ex
pend
iture
s0
00
00
00
00
00
00
00
00
00
00
Tota
l8,
550
9,15
69,
953
11,74
512
,703
13,6
4017
,203
18,2
0018
,231
22,0
7224
,414
27,75
829
,365
32,8
7235
,937
39,5
0541
,625
46,8
2850
,176
52,0
1857
,361
TAB
LE 7
.1c: T
otal
Exp
endi
ture
on
Hea
lth
by F
unct
ions
of H
ealt
h C
are,
19
97-
2017
(Per
cent
, %)
MNH
A Co
deFu
nctio
ns of
Hea
lth C
are
1997
1998
1999
2000
2001
2002
2003
2004
2005
2006
2007
2008
2009
2010
2011
2012
2013
2014
2015
2016
2017
MF1
Se
rvice
s of c
urat
ive ca
re64
.1761
.7461
.58
60.73
59.4
060
.04
56.8
960
.63
65.9
167
.34
66.16
67.8
862
.65
61.2
165
.61
67.73
66.13
68.16
68.3
169
.60
70.0
2
MF2
Se
rvice
s of r
ehab
ilitat
ive ca
re0.
000.
000.
000.
000.
000.
000.
000.
000.
000.
000.
000.
000.
000.
000.
000.
000.
000.
000.
000.
000.
00
MF3
Se
rvice
s of l
ong-
term
nur
sing
care
0.02
0.02
0.02
0.02
0.02
0.04
0.06
0.06
0.06
0.05
0.06
0.02
0.02
0.04
0.04
0.05
0.00
0.00
0.00
0.01
0.00
MF4
An
cillar
y se
rvice
s to
healt
h ca
re1.2
01.2
21.0
20.
900.
920.
810.
690.
690.
700.
910.
740.
860.
800.
800.
820.
790.
980.
810.
700.
580.
58
MF5
M
edica
l goo
ds d
ispen
sed t
o ou
t-pa
tient
s9.
329.
298.
838.
247.0
46.
675.6
36.
036.
375.7
05.9
75.
896.
015.
886.
266.
256.
657.2
87.7
28.1
47.9
3
MF6
Pu
blic h
ealth
serv
ices (
includ
ing h
ealth
pro
mot
ion an
d pr
even
tion)
5.56
5.34
5.44
4.59
4.81
4.64
4.44
4.55
4.90
4.65
5.76
4.48
4.49
4.11
4.17
4.52
6.20
5.25
5.28
5.37
5.16
MF7
He
alth
prog
ram
me
adm
inist
ratio
n an
d he
alth
insur
ance
10.75
10.4
810
.1610
.08
10.10
10.9
511
.26
10.74
10.6
510
.82
10.2
310
.09
10.2
79.
6210
.06
8.90
8.51
8.94
8.87
7.24
8.32
MR1
Ca
pital
form
ation
of h
ealth
care
pro
vider
inst
itutio
ns5.
878.
579.1
911
.55
13.14
11.8
516
.1212
.55
6.70
5.97
6.23
5.67
9.24
11.6
66.
045.0
94.
353.1
52.
862.7
32.4
0
MR2
Ed
ucat
ion an
d tra
ining
of h
ealth
per
sonn
el2.4
12.7
63.
283.
503.
974.4
24.4
84.4
14.
584.4
04.
624.
916.
346.
556.
866.
486.
605.
885.7
15.7
75.0
0
MR3
Re
sear
ch an
d de
velop
men
t in
healt
h0.
720.
590.
490.
370.
590.
580.
430.
340.1
20.1
60.
220.
200.1
80.1
40.1
30.1
90.
580.
530.
540.
560.
59
MR9
Al
l oth
er h
ealth
-relat
ed ex
pend
iture
s0.
000.
000.
000.
000.
000.
000.
000.
000.
000.
000.
000.
000.
000.
000.
000.
000.
000.
000.
000.
000.
00
Tota
l10
0.00
100.
0010
0.00
100.
0010
0.00
100.
0010
0.00
100.
0010
0.00
100.
0010
0.00
100.
0010
0.00
100.
0010
0.00
100.
0010
0.00
100.
0010
0.00
100.
0010
0.00
64 MALAYSIA NATIONAL HEALTH ACCOUNTS HEALTH EXPENDITURE REPORT 1997-2017

Services of curative care include medical, paramedical and allied health services which could be either allopathic or TCM services and is inclusive of dental care services. It could be provided either in hospital or non-hospital setting. The non-hospital setting includes medical or dental clinics.
In 2017, a total of RM40,166 million (70%) of TEH is for services of curative care as shown in Table 7.2a and Figure 7.2. The source of financing for services of curative care is RM20,713 million (52%) from the public sector and the remaining RM19,453 million or
48 percent from the private sector. For the services of curative care expenditure the public sector spent 84% and the private sector 70% for hospitals. The remaining expenditure was for non-hospital services. Noted that there is an increasing trend on curative care spending at private sector hospitals.
The 1997 to 2017 time-series data shows a similar pattern in absolute Ringgit Malaysia (RM) value and percentage (Table 7.2b and 7.2c). The public sector share is higher than the private sector source of financing over the time period.
7.2 HEALTH EXPENDITURE BY FUNCTIONS OF HEALTH CARE - CURATIVE CARE BY SOURCES OF FINANCING
TABLE 7.2a: Health Expenditure for Curative Care by Sources of Financing, 2017
Source Provider RM Million Percent
Public Sector
Hospital 17,384 83.93
Non-Hospital 3,330 16.07
Sub-Total 20,713 51.57
Private Sector
Hospital 13,569 69.75
Non-Hospital 5,884 30.25
Sub-Total 19,453 48.43
Total 40,166 100.00
MALAYSIA NATIONAL HEALTH ACCOUNTS HEALTH EXPENDITURE REPORT 1997-2017 65

FIG
UR
E 7.
2: H
ealt
h Ex
pend
itur
e fo
r Cur
ativ
e C
are
by S
ourc
es o
f Fin
anci
ng, 2
017
MN
HA
HE
ALT
H E
XP
EN
DIT
UR
E R
EP
OR
T 19
97-2
017
74
FI
GU
RE
7.2:
Hea
lth E
xpen
ditu
re fo
r C
urat
ive
Car
e by
Sou
rces
of F
inan
cing
, 201
7
HEAL
THEXP
ENDITU
REFORCU
RATIVE
CAR
E,201
7
RM40
,166
MILLION
70%ofT
OTA
LEX
PENDITU
REONHEA
LTH
SOURC
E:G
OVE
RNMEN
T
RM20
,713
MILLION
52%
CURA
TIVE
CAR
E
HOSPITAL
S
RM17
,383
MILLION
84%
NON-HOSPITAL
S
RM3,33
0MILLION
16%
SOURC
E:P
RIVA
TE
RM19
,453
MILLION
48%CURA
TIVE
CAR
E
HOSPITAL
S
RM13
,569
MILLION
70%
NON-HOSPITAL
S
RM5,88
4M
ILLION
30%
66 MALAYSIA NATIONAL HEALTH ACCOUNTS HEALTH EXPENDITURE REPORT 1997-2017

TAB
LE 7
.2b:
Hea
lth
Expe
ndit
ure
for C
urat
ive
Car
e by
Sou
rces
of F
inan
cing
, 19
97-
2017
(RM
Mill
ion)
Sour
cePr
ovid
er19
9719
9819
9920
0020
0120
0220
0320
0420
0520
0620
0720
0820
0920
1020
1120
1220
1320
1420
1520
1620
17
Publ
ic Se
ctor
Hosp
ital
2,55
62,
654
2,86
23,
222
3,63
43,
872
4,59
35,
035
5,20
56,
973
7,425
8,76
48,
921
9,23
610
,877
12,6
5613
,021
15,2
5715
,858
16,0
3717
,384
Non-
Hosp
ital
346
356
408
475
556
649
767
869
929
1,252
1,312
1,527
1,623
1,790
2,07
42,
479
1,964
2,43
52,
852
3,01
63,
330
Sub-
Tota
l 2,
902
3,00
93,
269
3,69
74,
190
4,52
15,
360
5,90
36,
134
8,22
58,
737
10,2
9110
,544
11,0
2612
,951
15,13
514
,985
17,6
9218
,710
19,0
5420
,713
Priva
te S
ecto
r
Hosp
ital
1,481
1,551
1,709
2,06
12,
090
2,32
02,
833
3,182
3,55
13,
995
4,49
45,
702
5,83
16,
540
7,282
7,710
8,07
38,
827
10,17
311
,615
13,5
69
Non-
Hosp
ital
1,103
1,093
1,151
1,375
1,265
1,348
1,594
1,950
2,33
12,
643
2,92
22,
848
2,02
12,
554
3,34
53,
910
4,46
75,
401
5,39
45,
536
5,88
4
Sub-
Tota
l 2,
584
2,64
42,
860
3,43
63,
355
3,66
84,
427
5,13
25,
882
6,63
87,4
168,
551
7,852
9,09
410
,627
11,6
2012
,541
14,2
2815
,567
17,15
119
,453
Tota
l 5,
486
5,65
36,
129
7,133
7,546
8,18
99,
787
11,0
3512
,016
14,8
6316
,153
18,8
4218
,396
20,12
023
,577
26,7
5527
,525
31,9
2034
,277
36,2
0440
,166
TAB
LE 7
.2c:
Hea
lth
Expe
ndit
ure
for C
urat
ive
Car
e by
Sou
rces
of F
inan
cing
, 19
97-
2017
(Per
cent
, %)
Sour
cePr
ovid
er19
9719
9819
9920
0020
0120
0220
0320
0420
0520
0620
0720
0820
0920
1020
1120
1220
1320
1420
1520
1620
17
Publ
ic Se
ctor
Hosp
ital
88.0
988
.1887
.53
87.15
86.73
85.6
585
.7085
.29
84.8
684
.7884
.98
85.17
84.6
183
.7683
.98
83.6
286
.90
86.2
484
.7684
.1783
.93
Non-
Hosp
ital
11.9
111
.82
12.4
712
.85
13.2
714
.35
14.3
014
.7115
.1415
.22
15.0
214
.83
15.3
916
.24
16.0
216
.38
13.10
13.76
15.2
415
.83
16.0
7
Sub-
Tota
l 52
.89
53.2
353
.34
51.8
455
.53
55.2
154
.77
53.5
051
.05
55.3
454
.09
54.6
257
.32
54.8
054
.93
56.5
754
.44
55.4
354
.58
52.6
351
.57
Priva
te S
ecto
r
Hosp
ital
57.3
158
.66
59.76
59.9
962
.29
63.2
564
.00
62.0
160
.38
60.18
60.6
066
.69
74.2
671
.92
68.5
266
.35
64.3
862
.04
65.3
567
.7269
.75
Non-
Hosp
ital
42.6
941
.34
40.2
440
.01
37.71
36.75
36.0
037
.99
39.6
239
.82
39.4
033
.31
25.74
28.0
831
.48
33.6
535
.62
37.9
634
.65
32.2
830
.25
Sub-
Tota
l 47
.1146
.77
46.6
648
.1644
.47
44.7
945
.23
46.5
048
.95
44.6
645
.91
45.3
842
.68
45.2
045
.07
43.4
345
.56
44.5
745
.42
47.3
748
.43
Tota
l 10
0.00
100.
0010
0.00
100.
0010
0.00
100.
0010
0.00
100.
0010
0.00
100.
0010
0.00
100.
0010
0.00
100.
0010
0.00
100.
0010
0.00
100.
0010
0.00
100.
0010
0.00
MALAYSIA NATIONAL HEALTH ACCOUNTS HEALTH EXPENDITURE REPORT 1997-2017 67

This section refers to expenditure for services designed to enhance the health status of the population in the form of structured public health services including promotive and preventive programmes. This excludes the expenditure of similar services delivered on individual basis which is captured as part of services of curative care. In 2017, a total of RM2,961 million (5 percent) of TEH is spent on public health programmes. From this, RM2,157 million (73%) is by the public sector sources of financing. MOH is the highest financier of public health services with the expenditure of RM1,902 million (64%) of the total expenditure on public health services (Table 7.3a). About 88% of public sector health
expenditure on public health services is by MOH as shown in Figure 7.3. The second highest financier for public health services is all corporations (other than health insurance) that spent RM797 million (27%) followed by other federal agencies (including statutory bodies) amounted to RM140 million (5%).
The 1997 to 2017 time series data also showed MOH as the largest source of financing for this function of health care service with a 13-fold increase in absolute Ringgit Malaysia (RM) value over the time period. However, other state agencies (including statutory bodies) showed an even higher increase in absolute RM value of 16-fold over the same time period (Table 7.3b and 7.3c).
7.3 HEALTH EXPENDITURE BY FUNCTIONS OF HEALTH CARE – PUBLIC HEALTH SERVICES (INCLUDING HEALTH PROMOTION AND PREVENTION) BY SOURCES OF FINANCING
68 MALAYSIA NATIONAL HEALTH ACCOUNTS HEALTH EXPENDITURE REPORT 1997-2017

MOH88%
RM2,157 Million (73%)
Non-MOH12%
RM804 Million (27%)
0
500
1000
1500
2000
2500
Public Sector Private Sector
RM
Mill
ion
FIGURE 7.3: Health Expenditure for Public Health Services (Including Health Promotion and Prevention) by Sources of Financing, 2017
TABLE 7.3a: Health Expenditure for Public Health Services (Including Health Promotion and Prevention) by Sources of Financing, 2017
MNHA Code Sources of Financing RM Million Percent
MS1.1.1.1 Ministry of Health (MOH) 1,902 64.24
MS2.6 All corporations (other than health insurance) 797 26.92
MS1.1.1.9 Other federal agencies (including statutory bodies) 140 4.73
MS1.1.2.2 Other state agencies (including statutory bodies) 50 1.68
MS1.1.2.1 (General) State government 31 1.03
MS1.1.3 Local authorities (LA) 26 0.87
MS1.2.2 Social Security Organization (SOCSO) 8 0.28
MS2.4 Private household out-of-pocket expenditures (OOP) 6 0.19
MS2.5 Non-profit institutions serving households (NGO) 1 0.03
MS9 Rest of the world (ROW) < 1 0.00
Total 2,961 100.00
MALAYSIA NATIONAL HEALTH ACCOUNTS HEALTH EXPENDITURE REPORT 1997-2017 69

TAB
LE 7
.3b:
Hea
lth
Expe
ndit
ure
for P
ublic
Hea
lth
Ser
vice
s (in
clud
ing
Hea
lth
Pro
mot
ion
and
Pre
vent
ion)
by
Sou
rces
of F
inan
cing
, 19
97-
2017
(RM
Mill
ion)
MNH
A Co
deSo
urce
s of F
inan
cing
1997
1998
1999
2000
2001
2002
2003
2004
2005
2006
2007
2008
2009
2010
2011
2012
2013
2014
2015
2016
2017
MS1
.1.1.1
Mini
stry
of H
ealth
(MOH
) 14
6 13
9 16
6 16
7 19
7 2
01
307
3
41
364
4
96
495
6
03
628
6
73
752
898
1,
634
1,54
1 1,
653
1,77
7 1,
902
MS1
.1.1.9
Ot
her f
eder
al ag
encie
s (inc
luding
stat
utor
y bo
dies)
13
17
19
22
25
28
32
37
42
48
55
56
67
74
94
118
128
121
140
128
140
MS1
.1.2.1
(Gen
eral)
Sta
te g
over
nmen
t 2
4 2
9 2
9 2
8 2
7 3
0 5
2 73
4
9 5
6 6
7 71
5
8 6
3 5
7 6
8 2
7 3
3 3
1 3
5 3
1
MS1
.1.2.2
Ot
her s
tate
agen
cies (
includ
ing st
atut
ory
bodie
s) 3
3
3
3
3
3
6
6
10
9
6
6
13
2
6 3
0 3
4 6
6 78
4
3 5
2 5
0
MS1
.1.3
Loca
l aut
horit
ies (L
A) 6
6
7
7 8
10
13
19
2
6 2
1 2
91
65
138
40
62
83
73
45
53
23
26
MS1
.2.2
So
cial S
ecur
ity O
rgan
izatio
n (S
OCSO
) 2
2
2
3
3
3
3
4
4
5
5
1
1 2
4
5
3
5 2
3 9
11
8
MS2
.4
Priva
te h
ouse
hold
out-
of-p
ocke
t exp
endit
ures
(OOP
) 5
5
5
5
5
5
5
6
9
11
10
10
8
9
8
10
10
8
6
6
6
MS2
.5
Non-
profi
t ins
titut
ions s
ervin
g ho
useh
olds (
NGO)
5
6
5
5
6
6
6
6
9
7 11
16
6
7
10
16
1 1
21
28
1
MS2
.6
All c
orpo
ratio
ns (o
ther
than
hea
lth in
sura
nce)
271
2
81
305
2
98
337
3
46
338
3
35
381
3
73
467
4
15
399
4
58
480
5
54
609
6
09
692
73
4 79
7
MS9
Re
st o
f the
wor
ld (R
OW)
00
00
00
00
00
1 0
00
00
00
00
0
Tota
l 4
76
489
5
41
539
6
11
632
76
4 8
27
893
1,
025
1,40
7 1,
244
1,31
8 1,
350
1,49
7 1,
785
2,5
83
2,4
59
2,6
48
2,79
4 2
,961
TAB
LE 7
.3c:
Hea
lth
Expe
ndit
ure
for P
ublic
Hea
lth
Ser
vice
s (in
clud
ing
Hea
lth
Pro
mot
ion
and
Pre
vent
ion)
by
Sou
rces
of F
inan
cing
, 19
97-
2017
(Per
cent
, %)
MNH
A Co
deSo
urce
s of F
inan
cing
1997
1998
1999
2000
2001
2002
2003
2004
2005
2006
2007
2008
2009
2010
2011
2012
2013
2014
2015
2016
2017
MS1
.1.1.1
Mini
stry
of H
ealth
(MOH
) 3
0.71
2
8.51
3
0.68
3
1.05
32.
29
31.8
0 4
0.23
4
1.24
40.
81
48.
39
35.1
5 4
8.49
4
7.64
49.
83
50.
25
50.
32
63.
26
62.6
6 6
2.44
63.
59
64.
23
MS1
.1.1.9
Ot
her f
eder
al ag
encie
s (inc
luding
stat
utor
y bo
dies)
2.6
4 3
.43
3.5
2 4
.03
4.0
4 4
.45
4.2
0 4
.43
4.6
9 4
.67
3.9
0 4
.51
5.0
7 5
.46
6.2
7 6
.59
4.9
7 4
.93
5.2
8 4
.57
4.73
MS1
.1.2.1
(Gen
eral)
Sta
te g
over
nmen
t 5
.14
5.9
3 5
.33
5.2
7 4
.38
4.76
6
.80
8.8
6 5
.45
5.4
5 4
.74
5.72
4
.38
4.6
4 3
.82
3.8
0 1.
04
1.34
1.
16
1.26
1.
03
MS1
.1.2.2
Ot
her s
tate
agen
cies (
includ
ing st
atut
ory
bodie
s) 0
.58
0.6
8 0
.51
0.4
8 0
.52
0.51
0
.84
0.76
1.
11
0.9
1 0
.42
0.4
9 0
.98
1.90
1.
99
1.89
2
.55
3.17
1.
62
1.84
1.
68
MS1
.1.3
Loca
l aut
horit
ies (L
A) 1.
26
1.29
1.
25
1.37
1.
36
1.53
1.
67
2.3
0 2
.87
2.0
3 2
0.68
5
.23
10.4
9 2
.97
4.11
4
.63
2.8
1 1.
83
1.99
0
.84
0.8
7
MS1
.2.2
So
cial S
ecur
ity O
rgan
izatio
n (S
OCSO
) 0
.49
0.47
0
.46
0.5
2 0
.48
0.5
0 0
.45
0.47
0
.50
0.4
8 0
.39
0.0
9 0
.08
0.12
0
.28
0.2
9 1.
37
0.9
4 0
.33
0.4
0 0
.28
MS2
.4
Priva
te h
ouse
hold
out-
of-p
ocke
t exp
endit
ures
(OOP
) 1.
10
1.07
0
.97
0.9
8 0
.86
0.8
4 0
.69
0.77
0
.99
1.04
0
.71
0.78
0
.62
0.6
4 0
.53
0.5
6 0
.38
0.3
1 0
.24
0.2
1 0
.19
MS2
.5
Non-
profi
t ins
titut
ions s
ervin
g ho
useh
olds (
NGO)
1.14
1.
14
0.9
8 1.
02
0.9
4 0
.92
0.8
3 0
.70
0.9
7 0
.69
0.8
0 1.
31
0.4
6 0
.55
0.6
9 0
.87
0.0
5 0
.05
0.8
1 1.
02
0.0
3
MS2
.6
All c
orpo
ratio
ns (o
ther
than
hea
lth in
sura
nce)
56.
94
57.4
7 5
6.31
5
5.29
5
5.13
54.
69
44.
29
40.
47
42.6
2 3
6.33
3
3.16
33.
35
30.
29
33.
91
32.0
6 3
1.05
23.
57
24.7
7 2
6.12
26.
28
26.
92
MS9
Re
st o
f the
wor
ld (R
OW)
0.0
0 0
.00
0.0
0 0
.00
0.0
0 0
.00
0.0
0 0
.00
0.0
0 0
.00
0.0
4 0
.02
0.0
0 0
.00
0.0
0 0
.00
0.0
0 0
.00
0.0
0 0
.00
0.0
0
Tota
l 10
0.00
10
0.00
10
0.00
10
0.00
10
0.00
10
0.00
10
0.00
10
0.00
10
0.00
10
0.00
10
0.00
10
0.00
10
0.00
10
0.00
10
0.00
10
0.00
10
0.00
10
0.00
10
0.00
10
0.00
10
0.00
70 MALAYSIA NATIONAL HEALTH ACCOUNTS HEALTH EXPENDITURE REPORT 1997-2017

This section describes expenditure for all health and health-related education and training of personnel. Although MNHA Framework includes this expenditure under the TEH, the SHA 1.0 framework excludes this because of the shortfall in the assumptions and difficulties in the capture of this expenditure. Furthermore, personnel who undergo health and health-related education and training may not continue to provide services in the health sector.
In 2017, a total of RM2,865 million or about 5 percent of TEH was spent on health education and training of health personnel. A total of RM1,371 million (48%) of this amount is funded by public sector source of financing (Table 4.1a). The MOH spent about 18% of public sector health expenditure on health education and training as shown in Figure 7.4.
7.4 HEALTH EXPENDITURE BY FUNCTIONS OF HEALTH CARE - HEALTH EDUCATION AND TRAINING BY SOURCES OF FINANCING
The 1997 to 2017 time series data shows that both the public sector and private sector sources of financing has an increasing trend in expenditure for this function. The public sector expenditure remains almost two times of private sector in absolute Ringgit Malaysia (RM) value between year 1997 and 2011. From year 2012 onwards, public sector sources showed slower increase compared to private sector sources. In years 2015-2017, private sector source of financing has overtaken public sector in this expenditure by 4 percent difference (Table 7.4b and Table 7.4c). In the public sources of financing alone, the non-MOH spent about 4-fold of MOH expenditure for health education and training throughout the years.
MALAYSIA NATIONAL HEALTH ACCOUNTS HEALTH EXPENDITURE REPORT 1997-2017 71
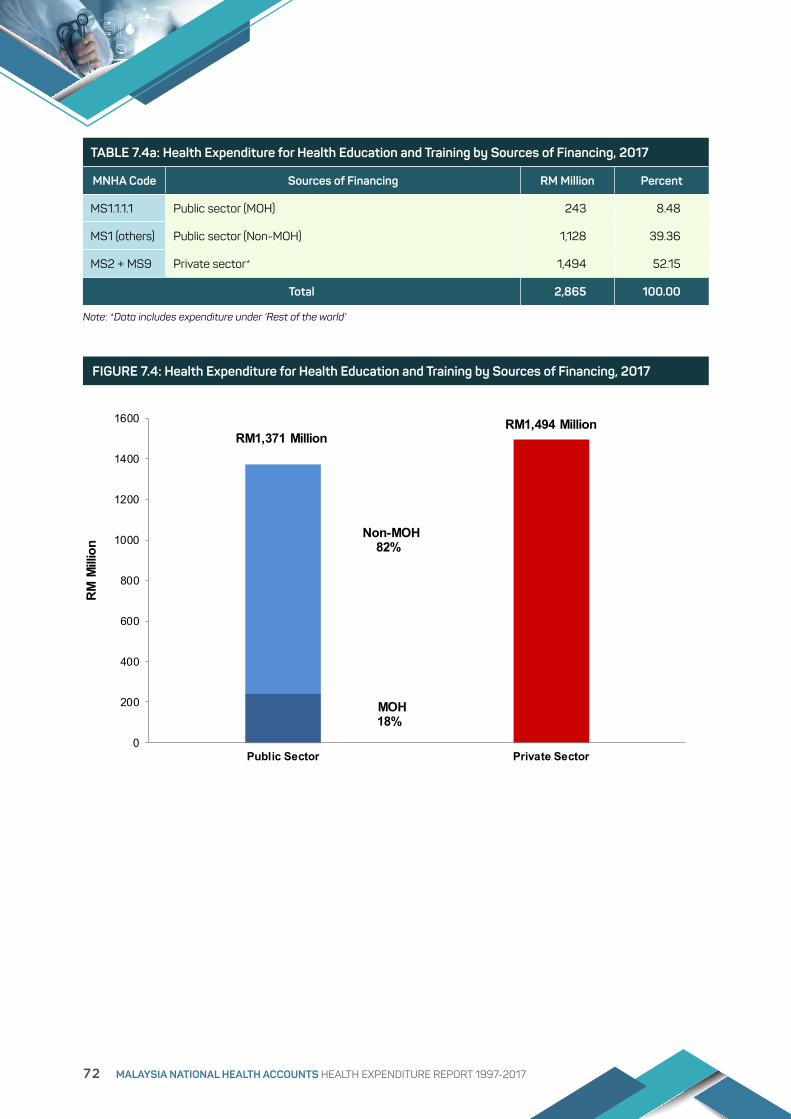
MOH18%
RM1,371 Million
Non-MOH82%
RM1,494 Million
0
200
400
600
800
1000
1200
1400
1600
Public Sector Private Sector
RM
Mill
ion
TABLE 7.4a: Health Expenditure for Health Education and Training by Sources of Financing, 2017
MNHA Code Sources of Financing RM Million Percent
MS1.1.1.1 Public sector (MOH) 243 8.48
MS1 (others) Public sector (Non-MOH) 1,128 39.36
MS2 + MS9 Private sector* 1,494 52.15
Total 2,865 100.00
Note: *Data includes expenditure under ‘Rest of the world’
FIGURE 7.4: Health Expenditure for Health Education and Training by Sources of Financing, 2017
72 MALAYSIA NATIONAL HEALTH ACCOUNTS HEALTH EXPENDITURE REPORT 1997-2017
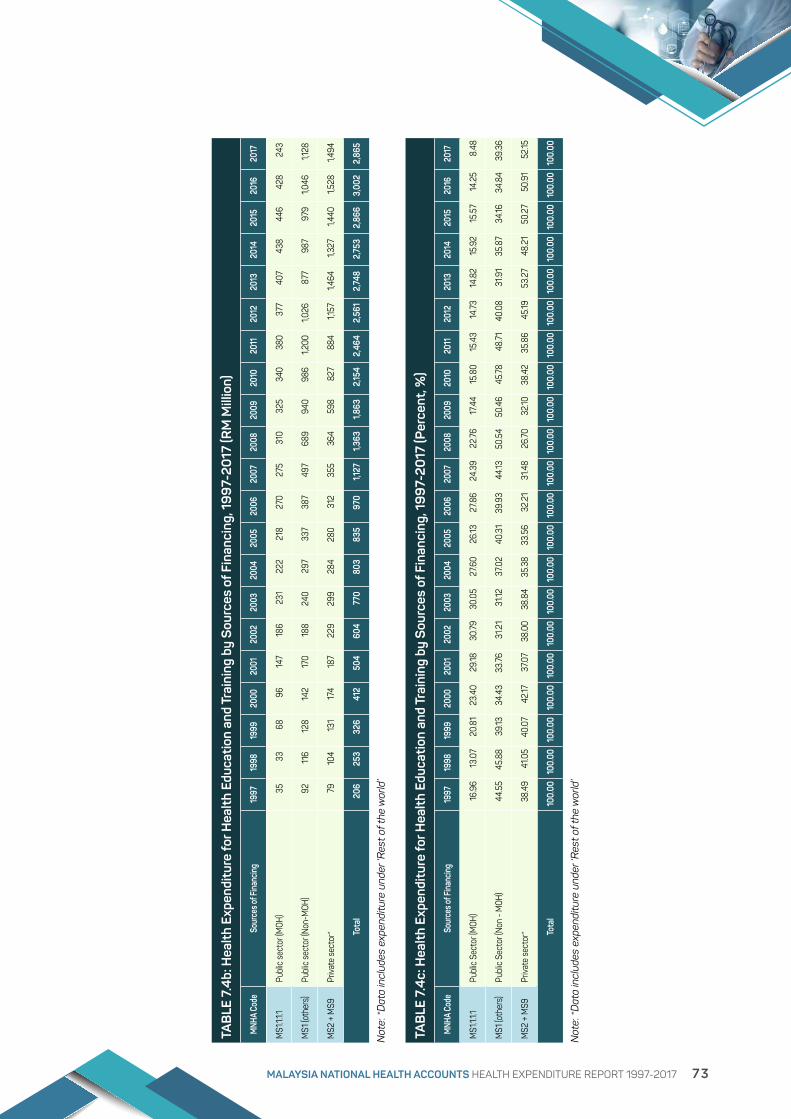
TAB
LE 7
.4b:
Hea
lth
Expe
ndit
ure
for H
ealt
h Ed
ucat
ion
and
Trai
ning
by
Sou
rces
of F
inan
cing
, 19
97-
2017
(RM
Mill
ion)
MNH
A Co
deSo
urce
s of F
inan
cing
1997
1998
1999
2000
2001
2002
2003
2004
2005
2006
2007
2008
2009
2010
2011
2012
2013
2014
2015
2016
2017
MS1
.1.1.1
Publ
ic se
ctor
(MOH
) 3
5 3
3 6
8 9
6 14
7 18
6 2
31
222
2
18
270
2
75
310
3
25
340
3
80
377
4
07
438
4
46
428
2
43
MS1
(oth
ers)
Pu
blic
sect
or (N
on-M
OH)
92
116
128
142
170
188
240
2
97
337
3
87
497
6
89
940
9
86
1,20
0 1,
026
877
9
87
979
1,
046
1,12
8
MS2
+ M
S9
Priva
te s
ecto
r* 7
9 10
4 13
1 17
4 18
7 2
29
299
2
84
280
3
12
355
3
64
598
8
27
884
1,
157
1,46
4 1,
327
1,44
0 1,
528
1,49
4
Tota
l 2
06
253
3
26
412
5
04
604
7
70
803
8
35
970
1,
127
1,36
3 1,
863
2,15
4 2
,464
2
,561
2
,748
2,7
53
2,8
66
3,0
02
2,8
65
Not
e: *
Dat
a in
clud
es e
xpen
ditu
re u
nder
‘Res
t of t
he w
orld
’
TAB
LE 7
.4c:
Hea
lth
Expe
ndit
ure
for H
ealt
h Ed
ucat
ion
and
Trai
ning
by
Sou
rces
of F
inan
cing
, 19
97-
2017
(Per
cent
, %)
MNH
A Co
deSo
urce
s of F
inan
cing
1997
1998
1999
2000
2001
2002
2003
2004
2005
2006
2007
2008
2009
2010
2011
2012
2013
2014
2015
2016
2017
MS1
.1.1.1
Publ
ic Se
ctor
(MOH
) 16
.96
13.0
7 2
0.81
2
3.40
2
9.18
3
0.79
3
0.05
2
7.60
26.
13
27.8
6 2
4.39
2
2.76
17
.44
15.8
0 15
.43
14.73
14
.82
15.9
2 15
.57
14.2
5 8
.48
MS1
(oth
ers)
Pu
blic
Sect
or (N
on -
MOH
) 4
4.55
4
5.88
3
9.13
3
4.43
3
3.76
3
1.21
31.1
2 3
7.02
40.
31
39.
93
44.1
3 5
0.54
5
0.46
4
5.78
4
8.71
4
0.08
3
1.91
35.
87
34.1
6 3
4.84
3
9.36
MS2
+ M
S9
Priva
te s
ecto
r* 3
8.49
4
1.05
40.
07
42.1
7 3
7.07
38.
00
38.
84
35.
38
33.
56
32.
21
31.4
8 2
6.70
3
2.10
38.
42
35.
86
45.1
9 5
3.27
4
8.21
5
0.27
5
0.91
5
2.15
Tota
l 10
0.00
10
0.00
10
0.00
10
0.00
10
0.00
10
0.00
10
0.00
10
0.00
10
0.00
10
0.00
10
0.00
10
0.00
10
0.00
10
0.00
10
0.00
10
0.00
10
0.00
10
0.00
10
0.00
10
0.00
10
0.00
Not
e: *
Dat
a in
clud
es e
xpen
ditu
re u
nder
‘Res
t of t
he w
orld
’
MALAYSIA NATIONAL HEALTH ACCOUNTS HEALTH EXPENDITURE REPORT 1997-2017 73

There has been much interest among policy makers to further explore the Ministry of Health (MOH). There are differences in reporting MOH expenditures using MNHA Framework and government treasury accounting system used by MOH Accounts Division (AG database). This chapter aims to provide some information on MOH expenditure as share of total expenditure on health and national GDP, as well as to enlighten the differences in expenditure reporting of MOH hospitals as the provider of health care services and MOH source of financing at MOH hospitals using MNHA Framework.
The first section in this chapter describes the proportion of MOH expenditure from TEH, and MOH health expenditure as percentage of national GDP using MNHA Framework. The second section aims to explain some differences in NHA reporting of expenditure at hospitals based on the two dimensions of MNHA Framework sources of financing and functions of health care.
8.1 MOH HEALTH EXPENDITURE – MOH SHARE OF TOTAL EXPENDITURE ON HEALTH AND NATIONAL GDP
MOH health expenditure reported in this section describes what MOH as a ‘source of financing’ spends on health care. Expenditure of MOH as ‘source of financing’ differs from what is reported in the
MOH HEALTH EXPENDITURE
government treasury accounting system based on AG data as total MOH expenditure, which is inclusive of operating and development expenditures) for a particular year. The NHA framework allows tracking of reimbursements by various agencies (e.g. EPF, SOCSO, private health insurance, state government (including statutory bodies), etc.) which are then deducted from total MOH expenditure to reflect the actual MOH expenditure at health care providers level, thus leaving MOH expenditure as ‘source of financing’ to be of slightly lower value under the MNHA Framework. (This is due to the effect of ‘addressing double counting’ as explained in Chapter 3).
Using the MNHA Framework in 2017, a total amount of RM24,715 million (43%) of TEH has been spent by MOH. In relation to GDP, MOH health expenditure takes up 1.83 percent of the national GDP in the same year. The 1997-2017 time-series MOH expenditure data in general shows an increasing pattern of expenditure except for 2016. MOH expenditure throughout the same period dominates the TEH, ranging between 42 and 52% of the TEH. In 1997, MOH spent RM3,616 million (42%) of TEH while in year 2017, RM24,715 million (43%) of TEH was spent by MOH. In relation to GDP, MOH expenditure in 1997 is equivalent to 1.28 percent of national GDP while in 2017, MOH expenditure was 1.83 percent of the national GDP (Table 8.1 and Figure 8.1).
CHAPTER 8
74 MALAYSIA NATIONAL HEALTH ACCOUNTS HEALTH EXPENDITURE REPORT 1997-2017
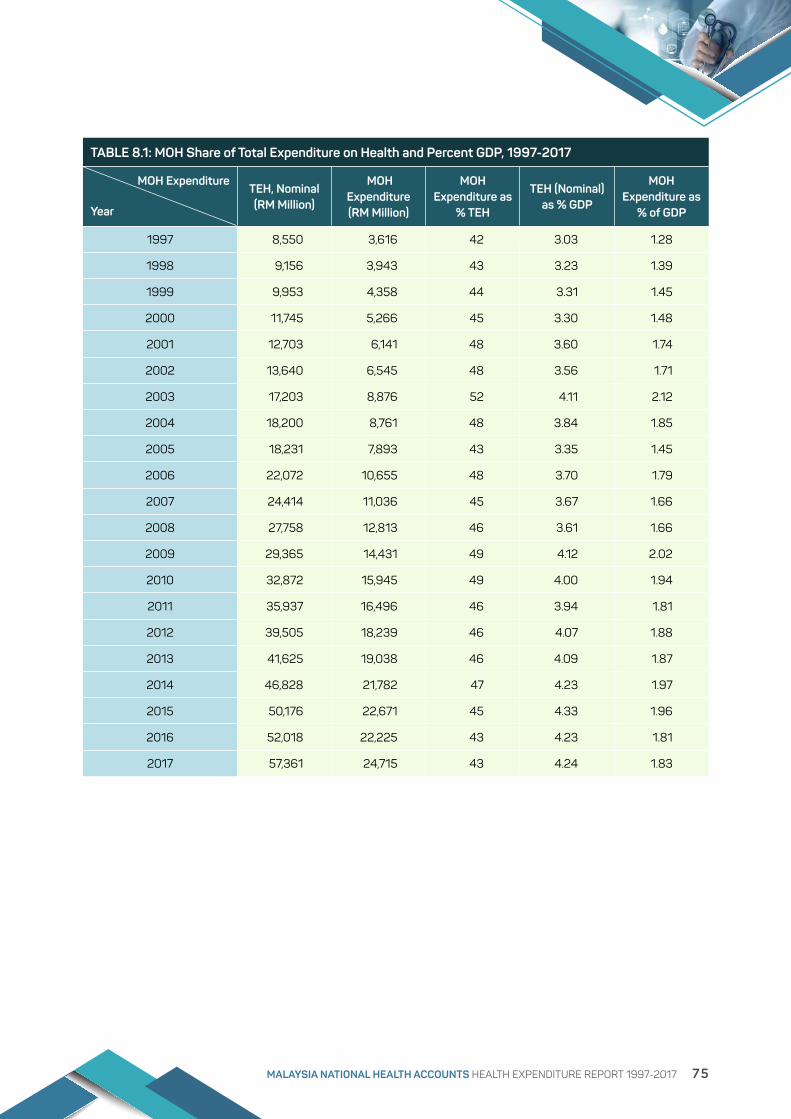
TABLE 8.1: MOH Share of Total Expenditure on Health and Percent GDP, 1997-2017
MOH Expenditure
Year
TEH, Nominal (RM Million)
MOH Expenditure (RM Million)
MOH Expenditure as
% TEH
TEH (Nominal) as % GDP
MOH Expenditure as
% of GDP
1997 8,550 3,616 42 3.03 1.28
1998 9,156 3,943 43 3.23 1.39
1999 9,953 4,358 44 3.31 1.45
2000 11,745 5,266 45 3.30 1.48
2001 12,703 6,141 48 3.60 1.74
2002 13,640 6,545 48 3.56 1.71
2003 17,203 8,876 52 4.11 2.12
2004 18,200 8,761 48 3.84 1.85
2005 18,231 7,893 43 3.35 1.45
2006 22,072 10,655 48 3.70 1.79
2007 24,414 11,036 45 3.67 1.66
2008 27,758 12,813 46 3.61 1.66
2009 29,365 14,431 49 4.12 2.02
2010 32,872 15,945 49 4.00 1.94
2011 35,937 16,496 46 3.94 1.81
2012 39,505 18,239 46 4.07 1.88
2013 41,625 19,038 46 4.09 1.87
2014 46,828 21,782 47 4.23 1.97
2015 50,176 22,671 45 4.33 1.96
2016 52,018 22,225 43 4.23 1.81
2017 57,361 24,715 43 4.24 1.83
MALAYSIA NATIONAL HEALTH ACCOUNTS HEALTH EXPENDITURE REPORT 1997-2017 75
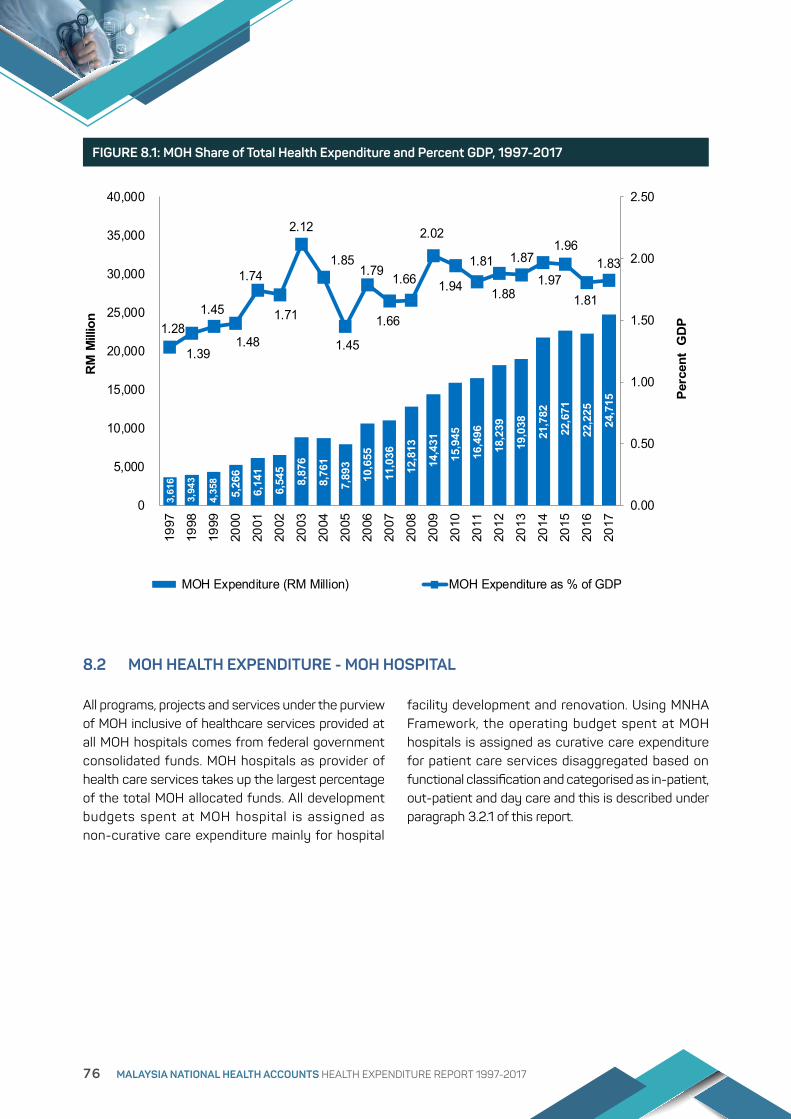
3,61
6
3,94
3
4,35
8
5,26
6
6,14
1
6,54
5
8,87
6
8,76
1
7,89
3
10,6
55
11,0
36
12,8
13
14,4
31
15,9
45
16,4
96
18,2
39
19,0
38
21,7
82
22,6
71
22,2
25
24,7
15
1.28
1.39
1.45
1.48
1.74
1.71
2.12
1.85
1.45
1.79
1.66
1.66
2.02
1.94
1.81
1.88
1.87
1.97
1.96
1.81
1.83
0.00
0.50
1.00
1.50
2.00
2.50
0
5,000
10,000
15,000
20,000
25,000
30,000
35,000
40,000
1997
1998
1999
2000
2001
2002
2003
2004
2005
2006
2007
2008
2009
2010
2011
2012
2013
2014
2015
2016
2017
RM
Mill
ion
Perc
ent
GD
P
MOH Expenditure (RM Million) MOH Expenditure as % of GDP
All programs, projects and services under the purview of MOH inclusive of healthcare services provided at all MOH hospitals comes from federal government consolidated funds. MOH hospitals as provider of health care services takes up the largest percentage of the total MOH allocated funds. All development budgets spent at MOH hospital is assigned as non-curative care expenditure mainly for hospital
8.2 MOH HEALTH EXPENDITURE - MOH HOSPITAL
facility development and renovation. Using MNHA Framework, the operating budget spent at MOH hospitals is assigned as curative care expenditure for patient care services disaggregated based on functional classification and categorised as in-patient, out-patient and day care and this is described under paragraph 3.2.1 of this report.
FIGURE 8.1: MOH Share of Total Health Expenditure and Percent GDP, 1997-2017
76 MALAYSIA NATIONAL HEALTH ACCOUNTS HEALTH EXPENDITURE REPORT 1997-2017

8.2.1 MOH Health Expenditure - MOH Hospital, Sources of Financing
In 2017, both the public sectors and the private sectors sources of financing at MOH hospitals totaled RM15,827 million. Various financiers were tracked through MOH hospitals accounting systems and sources of financing codes were assigned for payments made through private household out-of-pocket, private health insurance and other types of sources of financing. As a result, of the RM15,827 million spent, only RM 15,377 million or 97 % is assigned as MOH source of financing. A small amount of RM450 million (3 percent) were accounted by other financiers such as private household OOP (RM300
million), other state agencies (including statutory bodies) (RM70 million), private insurance enterprises (other than social insurance) (RM47 million), Social Security Organization or SOCSO (RM26 million) and the remaining non-MOH expenditure at RM7 million (Table 8.2.1a).
The 1997 to 2017 time-series expenditure on sources of financing show similar trend with MOH as the highest financier followed by non-MOH (Table 8.2.1b and Figure 8.2.1). The time-series data on MOH as source of financing shows that the expenditure has increased by 7-fold in absolute RM value. The same time-series indicate an average of 97% (Table 8.2.1c).
MALAYSIA NATIONAL HEALTH ACCOUNTS HEALTH EXPENDITURE REPORT 1997-2017 77

Note: *MOH Hospital Provider codes include MP1.1a, MP1.2a and MP1.3a
FIGURE 8.2.1: Health Expenditure at MOH Hospitals by Sources of Financing, 1997-2017
MNHA HEALTH EXPENDITURE REPORT 1997-2017 86
MNHA code Sources of Financing RM Million PercentMinistry of Health (MOH) MS1.1.1.1 Ministry of Health (MOH) 15,377 97.16
MS2.4 Private household out-of-pocket expenditures (OOP) 300 1.89 MS1.1.2.2 Other state agencies (including statutory bodies) 70 0.44 MS2.2 Private insurance enterprises (other than social insurance) 47 0.30 MS1.2.2 Social Security Organization (SOCSO) 26 0.16 MS2.6 All corporations (other than health insurance) 5 0.03 MS1.2.1 Employees Provident Fund (EPF) 1 0.01 MS2.5 Non-profit institutions serving households (NGO) 1 0.01 MS1.1.1.9 Other federal agencies (including statutory bodies) 0 0.00 MS1.1.3 Local authorities (LA) 0 0.00 MS1.1.2.1 (General) State government 0 0.00
Non-MOH Sub-total 450 2.84 Total 15,827 100.00
TABLE 8.2.1a: Health Expenditure at MOH Hospitals by Sources of Financing, 2017*
Non-Ministry of Health (Non-MOH)
Note: *MOH Hospital Provider codes include MP1.1a, MP1.2a and MP1.3a
FIGURE 8.2.1: Health Expenditure at MOH Hospitals by Sources of Financing, 1997-2017
0
2000
4000
6000
8000
10000
12000
14000
16000
18000
1997
1998
1999
2000
2001
2002
2003
2004
2005
2006
2007
2008
2009
2010
2011
2012
2013
2014
2015
2016
2017
15,377
450
RM
Mill
ion
Ministry of Health (MOH) Non-Ministry of Health (Non-MOH)
TABLE 8.2.1a: Health Expenditure at MOH Hospitals by Sources of Financing, 2017*
MNHA code Sources of Financing RM Million Percent
Ministry of Health (MOH)
MS1.1.1.1 Ministry of Health (MOH) 15,377 97.16
Non-Ministry of Health (Non-MOH)
MS2.4 Private household out-of-pocket expenditures (OOP) 300 1.89
MS1.1.2.2 Other state agencies (including statutory bodies) 70 0.44
MS2.2Private insurance enterprises (other than social insurance)
47 0.30
MS1.2.2 Social Security Organization (SOCSO) 26 0.16
MS2.6 All corporations (other than health insurance) 5 0.03
MS1.2.1 Employees Provident Fund (EPF) 1 0.01
MS2.5 Non-profit institutions serving households (NGO) 1 0.01
MS1.1.1.9 Other federal agencies (including statutory bodies) 0 0.00
MS1.1.3 Local authorities (LA) 0 0.00
MS1.1.2.1 (General) State government 0 0.00
Non-MOH Sub-total 450 2.84
Total 15,827 100.00
78 MALAYSIA NATIONAL HEALTH ACCOUNTS HEALTH EXPENDITURE REPORT 1997-2017

TAB
LE 8
.2.1b
: Hea
lth
Expe
ndit
ure
at M
OH
Hos
pita
ls b
y S
ourc
es o
f Fin
anci
ng, 1
99
7-20
17* (
RM
Mill
ion)
Sour
ces o
f Fin
ancin
g19
9719
9819
9920
0020
0120
0220
0320
0420
0520
0620
0720
0820
0920
1020
1120
1220
1320
1420
1520
1620
17
Mini
stry
of H
ealth
(MOH
) 2
,166
2,2
82
2,47
0 2
,740
3,12
0 3
,214
3
,875
4
,173
4,4
01
6,0
28
6,3
57
7,34
3 7,
664
8,4
41
9,4
36
11,2
81
11,6
68
13,5
91
14,18
3 14
,274
15
,377
Non-
Mini
stry
of H
ealth
(N
on-M
OH)
82
79
82
89
96
109
118
133
142
156
175
188
238
2
75
303
2
86
288
2
53
336
4
59
450
Tota
l 2,
248
2,36
12,
552
2,82
93,
216
3,32
33,
993
4,30
64,
542
6,18
46,
532
7,531
7,903
8,71
59,
739
11,5
6711
,956
13,8
4514
,519
14,73
215
,827
Not
e: *
MO
H H
ospi
tal P
rovi
der c
odes
incl
ude
MP
1.1a,
MP
1.2a
and
MP
1.3a
TAB
LE 8
.2.1c
: Hea
lth
Expe
ndit
ure
at M
OH
Hos
pita
ls b
y S
ourc
es o
f Fin
anci
ng, 1
99
7-20
17* (
Per
cent
, %)
Sour
ces o
f Fin
ancin
g19
9719
9819
9920
0020
0120
0220
0320
0420
0520
0620
0720
0820
0920
1020
1120
1220
1320
1420
1520
1620
17
Mini
stry
of H
ealth
(MOH
) 9
6.37
9
6.64
9
6.79
9
6.86
9
7.01
96.
71
97.0
4 9
6.91
9
6.88
9
7.48
97.3
2 9
7.51
96.
98
96.
85
96.
89
97.5
3 9
7.59
98.1
7 9
7.69
96.
89
97.1
6
Non-
Mini
stry
of H
ealth
(N
on-M
OH)
3.6
3 3
.36
3.2
1 3
.14
2.9
9 3
.29
2.9
6 3
.09
3.12
2
.52
2.6
8 2
.49
3.0
2 3
.15
3.11
2
.47
2.4
1 1.
83
2.3
1 3
.11
2.8
4
Tota
l 10
0.00
10
0.00
10
0.00
10
0.00
10
0.00
10
0.00
10
0.00
10
0.00
10
0.00
10
0.00
10
0.00
10
0.00
10
0.00
10
0.00
10
0.00
10
0.00
10
0.00
10
0.00
10
0.00
10
0.00
10
0.00
Not
e: *
MO
H H
ospi
tal P
rovi
der c
odes
incl
ude
MP
1.1a,
MP
1.2a
and
MP
1.3a
MALAYSIA NATIONAL HEALTH ACCOUNTS HEALTH EXPENDITURE REPORT 1997-2017 79
8.2.2 MOH Health Expenditure - MOH Hospital, Function of Curative Care This section provides further information on patient care services at MOH hospitals. Function of curative care services provided in MOH hospital is further categorised as in-patient curative care, out-patient curative care and day cases of curative care. Under the MNHA Framework, these types of services were inclusive of allopathic as well as some traditional and complementary health care services. In 2017, RM15,827 million is spent at MOH hospitals. From this amount, RM15,716 million (99%) is for
curative care services (Table 8.2.2a). In the same year, the expenditure for curative care services at MOH hospitals showed that RM9,941 million (63%) was spent for in-patient curative care services. This is followed by RM4,641 million (30%) for out-patient curative care services and RM1,133 million (7%) for day cases of curative care services (Figure 8.2.2).
The 1997 to 2017 time-series data shows that in absolute RM value the curative care services expenditure has increased by 7-fold (Table 8.2.2b). The curative care services expenditure in time-series shows an average of 99% spending at the MOH hospitals (Table 8.2.2c).
80 MALAYSIA NATIONAL HEALTH ACCOUNTS HEALTH EXPENDITURE REPORT 1997-2017
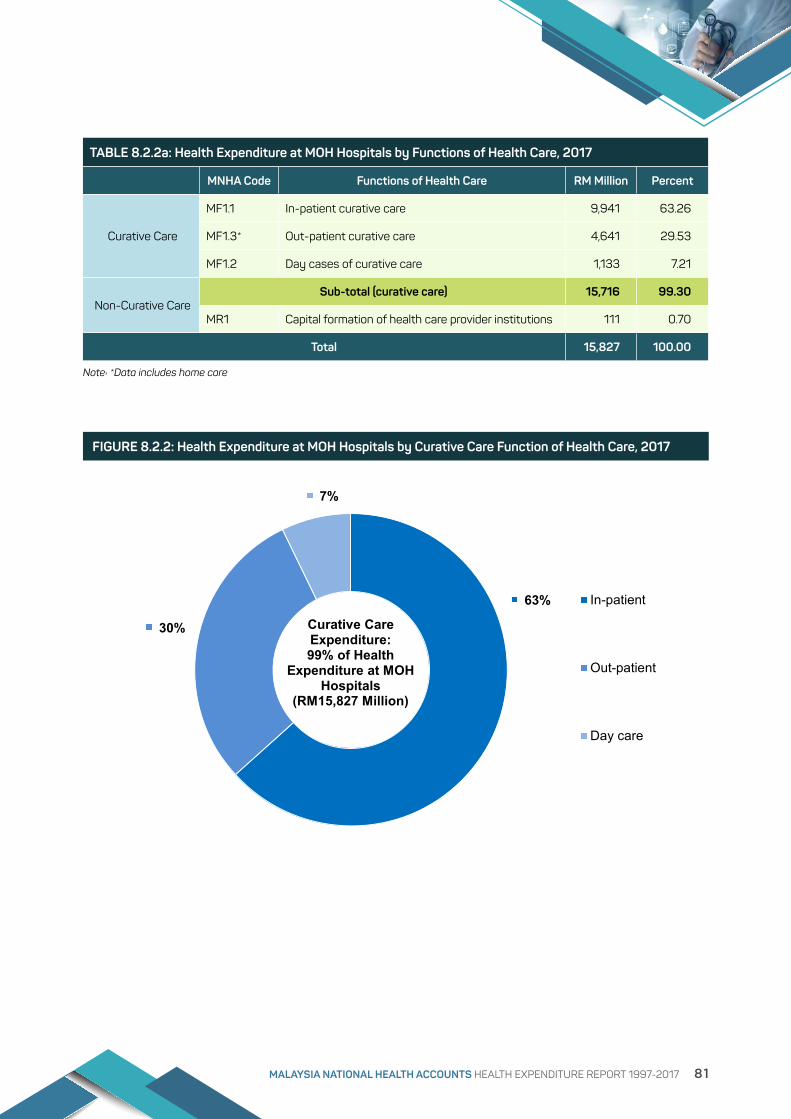
Note: *Data includes home care
89
MNHA Code Functions of Health Care RM Million PercentMF1.1 In-patient curative care 9,941 63.26 MF1.3* Out-patient curative care 4,641 29.53 MF1.2 Day cases of curative care 1,133 7.21
15,716 99.30 MR1 Capital formation of health care provider institutions 111 0.70
15,827 100.00
TABLE 8.2.2a: Health Expenditure at MOH Hospitals by Functions of Health Care, 2017
Curative Care
Sub-total (curative care)
Total
Non-Curative Care
Note: *Data includes home care
FIGURE 8.2.2: Health Expenditure at MOH Hospitals by Curative Care Function of Health Care, 2017
63%
30%
7%
In-patient
Out-patient
Day care
Curative Care Expenditure:99% of Health
Expenditure at MOH Hospitals
(RM15,827 Million)
FIGURE 8.2.2: Health Expenditure at MOH Hospitals by Curative Care Function of Health Care, 2017
TABLE 8.2.2a: Health Expenditure at MOH Hospitals by Functions of Health Care, 2017
MNHA Code Functions of Health Care RM Million Percent
Curative Care
MF1.1 In-patient curative care 9,941 63.26
MF1.3* Out-patient curative care 4,641 29.53
MF1.2 Day cases of curative care 1,133 7.21
Non-Curative Care Sub-total (curative care) 15,716 99.30
MR1 Capital formation of health care provider institutions 111 0.70
Total 15,827 100.00
MALAYSIA NATIONAL HEALTH ACCOUNTS HEALTH EXPENDITURE REPORT 1997-2017 81

TAB
LE 8
.2.2
b: H
ealt
h Ex
pend
itur
e at
MO
H H
ospi
tals
by
Func
tion
s of
Hea
lth
Car
e, 1
99
7-20
17**
(RM
Mill
ion)
Func
tions
of H
ealth
Car
e19
9719
9819
9920
0020
0120
0220
0320
0420
0520
0620
0720
0820
0920
1020
1120
1220
1320
1420
1520
1620
17
Cur
ative
Car
e*
2,21
52,
308
2,474
2,766
3,08
63,
255
3,87
24,1
514,
295
6,00
86,
318
7,427
7,781
8,09
79,
643
11,3
0211
,590
13,5
7614
,228
14,41
715
,716
Non
-Cur
ative
Car
e 32
5378
6313
068
121
155
247
176
214
103
122
618
9626
536
626
929
131
511
1
Tota
l2,
248
2,36
12,
552
2,82
93,
216
3,32
33,
993
4,30
64,
542
6,18
46,
532
7,531
7,903
8,71
59,
739
11,5
6711
,956
13,8
4514
,519
14,73
215
,827
Not
e: *
Dat
a in
clud
es h
ome
care
TAB
LE 8
.2.2
c: H
ealt
h Ex
pend
itur
e at
MO
H H
ospi
tals
by
Func
tion
s of
Hea
lth
Car
e, 1
99
7-20
17**
(Per
cent
, %)
Func
tions
of H
ealth
Car
e19
9719
9819
9920
0020
0120
0220
0320
0420
0520
0620
0720
0820
0920
1020
1120
1220
1320
1420
1520
1620
17
Cura
tive
Care
* 98
.57
97.74
96.9
497
.7795
.95
97.9
696
.97
96.4
094
.56
97.15
96.73
98.6
398
.45
92.9
199
.02
97.71
96.9
498
.06
97.9
997
.86
99.3
0
Non-
Cura
tive
Care
1.4
32.
263.
062.
234.
052.0
43.
033.
605.4
42.
853.
271.3
71.5
57.0
90.
982.
293.
061.9
42.0
12.1
40.
70
Tota
l10
0.00
100.
0010
0.00
100.
0010
0.00
100.
0010
0.00
100.
0010
0.00
100.
0010
0.00
100.
0010
0.00
100.
0010
0.00
100.
0010
0.00
100.
0010
0.00
100.
0010
0.00
Not
e: *
Dat
a in
clud
es h
ome
care
82 MALAYSIA NATIONAL HEALTH ACCOUNTS HEALTH EXPENDITURE REPORT 1997-2017

OUT-OF-POCKET HEALTH EXPENDITURE
Most often, many countries attain household out-of-pocket (OOP) health expenditures through community surveys. However, the best approach for this health expenditure estimation as used in this report, is through a complex method called the integrative method whereby the gross level of direct health spending from consumption, provision and financing perspectives are collated followed by a deduction of third party financial reimbursements by various agencies to avoid double counting.
The data shown in this chapter includes OOP spending for TCM as well as OOP spending for health-related education and training. OOP health expenditure estimation through integrative method is explained in Chapter 3. In brief, OOP health expenditure estimation uses the formula as follows:
OOP Health Expenditure = (Gross OOP Health Expenditure – Third Party Payer Reimbursement) + OOP Expenditure for Health Education & Training
CHAPTER 9
MALAYSIA NATIONAL HEALTH ACCOUNTS HEALTH EXPENDITURE REPORT 1997-2017 83

In 2017, the OOP health expenditure amounts to RM21,573 million, which is equivalent to 38% of the TEH and 77% share of the private sector health expenditure (Table 9.1a). The 1997-2017 time series data shows that the household OOP health expenditure is between 29% and 38% of TEH. Throughout the years, it remains the largest single source of financing
9.1 OUT-OF-POCKET HEALTH EXPENDITURE – OOP SHARE OF TOTAL EXPENDITURE ON HEALTH AND NATIONAL GDP
in the private sector amounting to an average of 77% of this sector spending (Figure 9.1a, Figure 9.1b). The OOP health expenditure from 1997 to 2017 has increased from RM3,166 million to RM21,573 million which is an increase from 1 percent GDP to 2 percent GDP (Table 9.1b and Figure 9.1c).
TABLE 9.1a: OOP Share of Total Expenditure on Health and Private Sector Health Expenditure, 1997-2017
Year
Private Sector Health
Expenditure (RM Million)
Total Expenditure on
Health (RM Million)
OOP Health Expenditure (RM million)
OOP Share of Total
Expenditure on Health (%)
OOP Share of Private Sector
Health Expenditure (%)
1997 4,190 8,550 3,166 37.03 75.55
1998 4,411 9,156 3,266 35.67 74.04
1999 4,720 9,953 3,497 35.14 74.10
2000 5,498 11,745 4,175 35.55 75.94
2001 5,379 12,703 3,882 30.56 72.16
2002 5,786 13,640 4,127 30.26 71.33
2003 6,831 17,203 4,941 28.72 72.33
2004 7,650 18,200 5,664 31.12 74.04
2005 8,525 18,231 6,382 35.01 74.87
2006 9,454 22,072 7,145 32.37 75.58
2007 10,623 24,414 7,921 32.44 74.56
2008 11,991 27,758 9,084 32.73 75.76
2009 11,684 29,365 8,478 28.87 72.56
2010 13,559 32,872 9,916 30.17 73.13
2011 15,704 35,937 11,669 32.47 74.31
2012 17,440 39,505 12,994 32.89 74.51
2013 18,771 41,625 14,462 34.74 77.04
2014 20,855 46,828 16,128 34.44 77.33
2015 23,192 50,176 17,602 35.08 75.90
2016 25,342 52,018 19,316 37.13 76.22
2017 28,023 57,361 21,573 37.61 76.98
84 MALAYSIA NATIONAL HEALTH ACCOUNTS HEALTH EXPENDITURE REPORT 1997-2017

FIGURE 9.1a: OOP Share of Total Health Expenditure, 1997-2017 (Percent, %)
FIGURE 9.1b: OOP Share of Private Sector Health Expenditure, 1997-2017 (Percent, %)
93
FIGURE 9.1a: OOP Share of Total Health Expenditure, 1997-2017 (Percent, %)
37%
36%
35%
36%
31%
30%
29%
31%35%
32%
32%
33%
29%
30%32%
33%
35%
34%
35%
37%
38%
0%
5%
10%
15%
20%
25%
30%
35%
40%
45%
50%
OO
P %
of T
EH
FIGURE 9.1b: OOP Share of Private Sector Health Expenditure, 1997-2017 (Percent, %)
76% 74%
74%
76%
72%
71%
72%74%
75%76%
75%76%
73%
73%
74%
75%
77%
77% 76%
76%
77%
68%
69%
70%
71%
72%
73%
74%
75%
76%
77%
78%
OO
P %
Priv
ate
Sect
or H
ealth
Exp
endi
ture
MALAYSIA NATIONAL HEALTH ACCOUNTS HEALTH EXPENDITURE REPORT 1997-2017 85
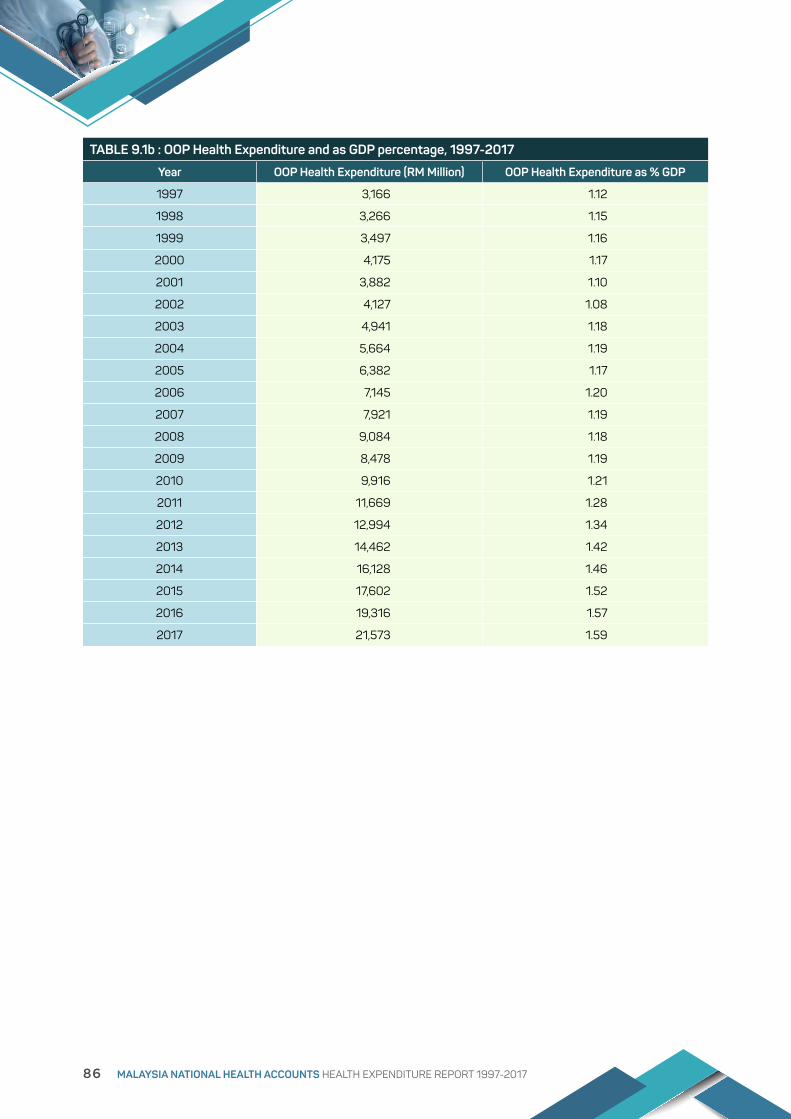
TABLE 9.1b : OOP Health Expenditure and as GDP percentage, 1997-2017
Year OOP Health Expenditure (RM Million) OOP Health Expenditure as % GDP
1997 3,166 1.12
1998 3,266 1.15
1999 3,497 1.16
2000 4,175 1.17
2001 3,882 1.10
2002 4,127 1.08
2003 4,941 1.18
2004 5,664 1.19
2005 6,382 1.17
2006 7,145 1.20
2007 7,921 1.19
2008 9,084 1.18
2009 8,478 1.19
2010 9,916 1.21
2011 11,669 1.28
2012 12,994 1.34
2013 14,462 1.42
2014 16,128 1.46
2015 17,602 1.52
2016 19,316 1.57
2017 21,573 1.59
86 MALAYSIA NATIONAL HEALTH ACCOUNTS HEALTH EXPENDITURE REPORT 1997-2017

3,16
6
3,26
6
3,49
7
4,17
5
3,88
2
4,12
7
4,94
1
5,66
4
6,38
2
7,14
5
7,92
1
9,08
4
8,47
8
9,91
6
11,6
69
12,9
94
14,4
62
16,1
28
17,6
02
19,3
16
21,5
73
1.12
1.15
1.16
1.17
1.10
1.081.18
1.19
1.17
1.20
1.19
1.18
1.19
1.21
1.28
1.34
1.42
1.461.52
1.57 1.59
0.00
0.20
0.40
0.60
0.80
1.00
1.20
1.40
1.60
1.80
0
5000
10000
15000
20000
25000
RM M
illion
Perc
ent G
DP
OOP Health Expenditure (RM Million) OOP Health Expenditure as % GDP
FIGURE 9.1c: OOP Health Expenditure and as GDP percentage, 1997-2017 (RM Million, Percent, %)
MALAYSIA NATIONAL HEALTH ACCOUNTS HEALTH EXPENDITURE REPORT 1997-2017 87
This section cross tabulates OOP health expenditure with providers of health care. Health providers are defined as entities that produce and provide health care goods and services, which benefit individuals or population groups. These providers could be either public or private providers of health care. The bulk of public sector health care services for patients in this country have always been heavily subsidized by the government, even if the government outsources any of the services to private providers of health care. However, under the provision of public sector services there are some components of healthcare services and several products like most prostheses, which are purchased by patients from private providers of health care. When patients seek private sector services they are often at liberty to purchase these services or prod-ucts separately or as part of the services. The private providers of health care include several categories of standalone private facilities such as private hospitals, private medical clinics, providers of medical appliances, TCM providers, private dental clinic, private pharmacies and private laboratories. OOP is the mode of payment for services either in public sector or private sector. Furthermore, the final amount reported under OOP health expenditure includes expenditure reported by this mode for health education and training.
Throughout the 1997-2017 time series, OOP health expenditure generally shows an increasing pattern, with a slight reduction in year 2009, followed by a pro-gressive increase from then onwards (Table 9.2a and
9.2 OUT-OF-POCKET HEALTH EXPENDITURE TO PROVIDERS
Figure 9.2a).In 2017, of the total RM20,372 million of OOP health expenditure to private providers of health care, private hospitals consumed the largest share at RM9,958 million (49%) followed by private medical clinics at RM4,542 million (22%), private pharmacies at RM2,923 million (14%), private dental clinics at RM825 million (4 percent), TCM providers at RM684 million (3 percent), retail sale and other suppliers of medical goods and appliances at RM575 million (3 percent), private medical and diagnostic laboratories at RM37 ( <1 percent) and the balance, RM 829 million (4%) comprise of other private providers of health care (Table 9.2b and Figure 9.2b).
The 1997 to 2017 time series data shows an average of 94% OOP health expenditure occurred at private providers of health care, with increasing expenditure pattern at all the various private providers. The highest increase in absolute amount is seen at private hospi-tals from RM1,159 million in 1997 to RM9,958 million in 2017, a difference of RM8,799 million. However, there is an 8-fold increase in spending at private pharmacies from RM325 million in 1997 to RM2,923 million in 2017. The OOP health expenditure at private medical clinics showed a steady increase from RM815 million in 1997 to RM2,315 million in 2007 but declined from 2008 to 2010 and increasing back from 2011 onwards to RM4,542 in 2017. The time series data also showed an increasing pattern of OOP health expenditure at public providers with an average of 7 percent throughout the years (Table 9.2c and Table 9.2d).
88 MALAYSIA NATIONAL HEALTH ACCOUNTS HEALTH EXPENDITURE REPORT 1997-2017
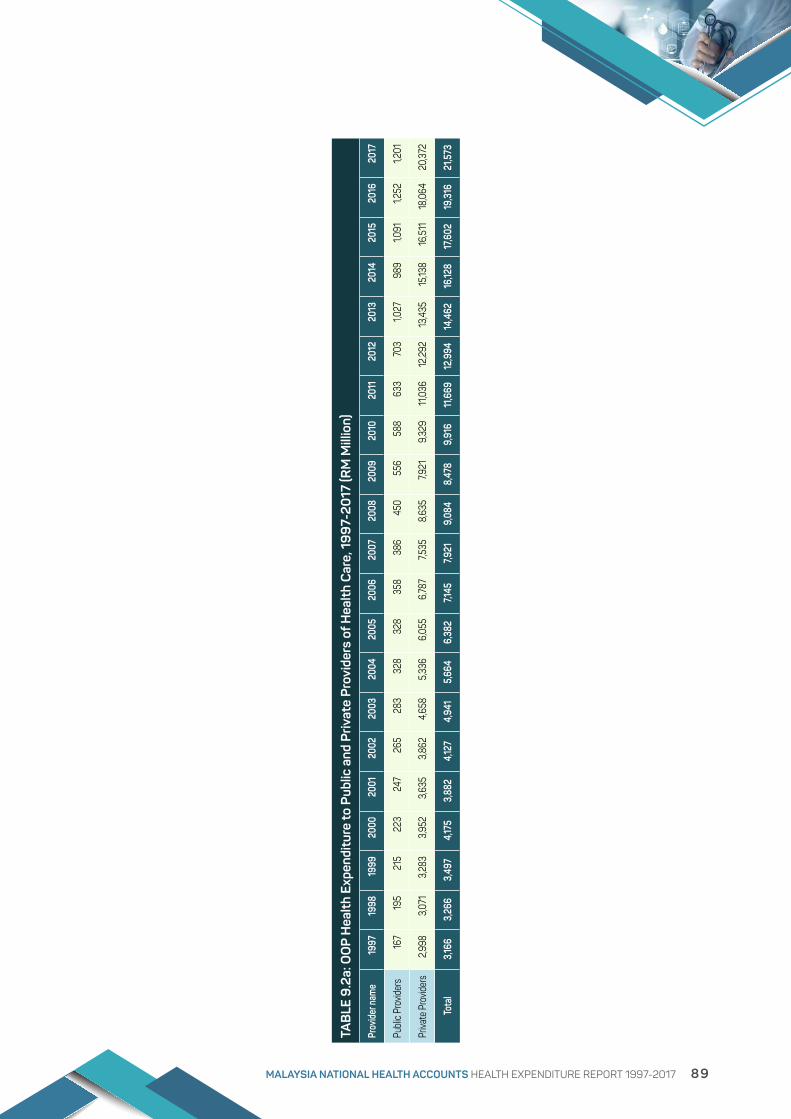
TAB
LE 9
.2a:
OO
P H
ealt
h Ex
pend
itur
e to
Pub
lic a
nd P
rivat
e P
rovi
ders
of H
ealt
h C
are,
19
97-
2017
(RM
Mill
ion)
Prov
ider
nam
e19
9719
9819
9920
0020
0120
0220
0320
0420
0520
0620
0720
0820
0920
1020
1120
1220
1320
1420
1520
1620
17
Publi
c Pro
vider
s 16
7 19
5 2
15
223
2
47
265
2
83
328
3
28
358
3
86
450
5
56
588
6
33
703
1,02
7 9
89
1,09
1 1,
252
1,20
1
Priva
te P
rovid
ers
2,9
98
3,0
71
3,2
83
3,9
52
3,6
35
3,8
62
4,6
58
5,3
36
6,0
55
6,78
7 7,
535
8,6
35
7,92
1 9
,329
11
,036
12
,292
13
,435
15
,138
16,51
1 18
,064
20
,372
Tota
l 3
,166
3,2
66
3,4
97
4,17
5 3
,882
4
,127
4,9
41
5,6
64
6,3
82
7,14
5 7,
921
9,0
84
8,4
78
9,9
16
11,6
69
12,9
94
14,4
62
16,12
8 17
,602
19
,316
2
1,573
MALAYSIA NATIONAL HEALTH ACCOUNTS HEALTH EXPENDITURE REPORT 1997-2017 89

20,3
72
1,20
1
0
5000
1000
0
1500
0
2000
0
2500
0
RM Million
Priv
ate
Pro
vide
rsP
ublic
Pro
vide
rs
FIG
UR
E 9
.2a:
OO
P H
ealt
h Ex
pend
itur
e to
Pub
lic a
nd P
rivat
e P
rovi
ders
of H
ealt
h C
are,
19
97-
2017
(RM
Mill
ion)
90 MALAYSIA NATIONAL HEALTH ACCOUNTS HEALTH EXPENDITURE REPORT 1997-2017

FIGURE 9.2b: OOP Health Expenditure to Private Providers of Health Care, 2017 (RM Million, Percent %)
TABLE 9.2b: OOP Health Expenditure to Private Providers of Health Care, 2017
Provider name RM (Million) Percent
Private hospitals 9,958 48.88
Private medical clinics 4,542 22.29
Private pharmacies 2,923 14.35
All other private sector providers of health care 829 4.07
Private dental clinics 825 4.05
Traditional and Complementary Medicine (TCM) providers 684 3.36
Retail sale and other suppliers of medical goods & appliances 575 2.82
Private medical and diagnostic laboratories 37 0.18
Total 20,372 100.00
Error!Notopicspecified.
Error!Notavalidlink.
49%
22%
14%
4%
4%
4%
3% <1% Private hospitals
Private medical clinics
Private pharmacies
All other private providers
Private dental clinics
TCM providers
Retail sale of medical goods & appliances
Private medical & diagnostic labs
OOP Health Expenditure to Private
Providers: 94% of OOP Health
Expenditure (RM 20,372 Million)
MALAYSIA NATIONAL HEALTH ACCOUNTS HEALTH EXPENDITURE REPORT 1997-2017 91

TAB
LE 9
.2c:
OO
P H
ealt
h Ex
pend
itur
e to
Pro
vide
rs o
f Hea
lth
Car
e, 1
99
7-20
17 (R
M M
illio
n)Pr
ovid
er N
ame
1997
1998
1999
2000
2001
2002
2003
2004
2005
2006
2007
2008
2009
2010
2011
2012
2013
2014
2015
2016
2017
Priva
te h
ospit
als 1,
159
1,16
6 1,
257
1,57
3 1,
467
1,59
2 2
,109
2,3
60
2,6
63
2,9
64
3,2
90
4,3
19
4,2
30
4,8
14
5,4
04
5,6
88
5,8
49
6,2
11
7,11
6 8
,230
9
,958
Priva
te m
edica
l clin
ics 8
15
816
8
63
1,06
5 9
51
1,01
3 1,
149
1,48
1 1,
810
2,0
96
2,3
15
2,15
2 1,
374
1,72
4 2
,422
2
,912
3
,455
4
,345
4
,292
4
,341
4
,542
Priva
te p
harm
acies
3
25
363
4
08
464
4
48
479
5
72
718
712
755
871
9
43
1,07
5 1,
144
1,40
7 1,
580
1,84
3 2
,363
2
,629
2
,751
2,9
23
Priva
te d
enta
l clin
ics
135
140
152
183
182
200
2
27
249
2
77
288
2
96
371
3
64
451
5
13
562
5
95
651
6
92
742
825
Trad
itiona
l and
Com
plem
enta
ry M
edici
ne
(TCM
) pro
vider
s 2
94
292
2
77
289
2
47
227
2
02
176
210
2
40
277
3
33
319
3
61
394
4
12
424
4
52
529
6
22
684
Reta
il sale
and
othe
r sup
plier
s of m
edica
l go
ods &
appli
ance
s 15
0 16
1 15
8 17
3 15
6 15
4 15
1 15
1 18
1 2
08
239
2
87
275
3
03
321
3
26
325
3
34
421
5
23
575
Priva
te m
edica
l and
diag
nost
ic lab
orat
ories
2
5 2
6 2
5 2
6 2
1 18
14
9
11
12
14
18
17
2
9 4
3 5
9 78
10
8 71
3
3 3
7
All o
ther
priv
ate
sect
or p
rovid
ers o
f hea
lth
care
9
6 10
7 14
4 17
9 16
2 18
0 2
36
192
191
225
2
34
213
2
66
502
5
32
753
866
6
75
761
821
8
29
Sub-
Tota
l (Priv
ate P
rovid
ers)
2,99
83,
071
3,28
33,
952
3,63
53,
862
4,65
85,
336
6,05
56,
787
7,535
8,63
57,9
219,
329
11,0
3612
,292
13,4
3515
,138
16,5
1118
,064
20,3
72
Publi
c hos
pitals
136
143
158
158
167
174
180
205
2
02
223
2
30
255
2
42
266
2
86
305
3
51
307
3
68
480
4
48
Publi
c med
ical c
linics
10
10
11
11
13
16
19
23
25
27
32
35
26
31
23
10
42
44
54
57
72
Publi
c ins
titut
ions p
rovid
ing h
ealth
-relat
ed
serv
ices
22
42
46
54
66
75
84
100
101
108
124
159
288
2
91
324
3
88
634
6
38
669
71
6 6
81
Sub-
Tota
l (Pub
lic P
rovid
ers)
167
195
215
2
23
247
2
65
283
3
28
328
3
58
386
4
50
556
5
88
633
70
3 1,
027
989
1,
091
1,25
2 1,
201
Tota
l 3
,166
3,2
66
3,4
97
4,17
5 3
,882
4
,127
4,9
41
5,6
64
6,3
82
7,14
5 7,
921
9,0
84
8,4
78
9,9
16
11,6
69
12,9
94
14,4
62
16,12
8 17
,602
19
,316
2
1,573
TAB
LE 9
.2d:
OO
P H
ealt
h Ex
pend
itur
e to
Pro
vide
rs o
f Hea
lth
Car
e, 1
99
7-20
17 (P
erce
nt, %
)Pr
ovid
er N
ame
1997
1998
1999
2000
2001
2002
2003
2004
2005
2006
2007
2008
2009
2010
2011
2012
2013
2014
2015
2016
2017
Priva
te h
ospit
als 3
6.60
3
5.72
35.9
4 3
7.68
37.8
0 3
8.57
4
2.68
41.6
6 4
1.73
41.4
8 4
1.53
47.5
5 4
9.90
4
8.55
4
6.31
4
3.77
40.
44
38.
51
40.
43
42.6
1 4
6.16
Priva
te m
edica
l clin
ics 2
5.74
24.
98
24.
67
25.
50
24.
50
24.
54
23.
25
26.1
4 2
8.36
2
9.33
2
9.22
2
3.69
16
.21
17.3
9 2
0.75
2
2.41
23.
89
26.
94
24.
38
22.4
8 2
1.05
Priva
te p
harm
acies
10
.26
11.11
11
.65
11.11
11
.54
11.6
0 11
.57
12.6
7 11
.15
10.5
7 10
.99
10.3
8 12
.68
11.5
4 12
.06
12.16
12
.74
14.6
5 14
.94
14.2
4 13
.55
Priva
te d
enta
l clin
ics
4.2
6 4
.29
4.3
4 4
.38
4.6
8 4
.85
4.5
8 4
.40
4.3
3 4
.03
3.73
4
.08
4.3
0 4
.55
4.4
0 4
.33
4.11
4
.04
3.9
3 3
.84
3.8
2
Trad
itiona
l and
Com
plem
enta
ry M
edici
ne
(TCM
) pro
vider
s 9
.28
8.9
5 7.
93
6.9
3 6
.37
5.4
9 4
.08
3.11
3
.29
3.3
5 3
.50
3.6
6 3
.76
3.6
4 3
.37
3.17
2
.93
2.8
0 3
.01
3.2
2 3
.17
Reta
il sale
and
othe
r sup
plier
s of m
edica
l go
ods &
appli
ance
s 4
.73
4.9
2 4
.52
4.15
4
.02
3.73
3
.07
2.6
7 2
.84
2.9
1 3
.02
3.16
3
.24
3.0
6 2
.75
2.51
2
.25
2.0
7 2
.39
2.71
2
.67
Priva
te m
edica
l and
diag
nost
ic lab
orat
ories
0
.80
0.79
0
.70
0.6
1 0
.55
0.4
5 0
.29
0.16
0
.17
0.17
0
.18
0.2
0 0
.20
0.2
9 0
.37
0.4
6 0
.54
0.6
7 0
.40
0.17
0
.17
All o
ther
priv
ate
sect
or p
rovid
ers o
f hea
lth
care
3
.04
3.2
7 4
.11
4.2
9 4
.18
4.3
5 4
.77
3.3
8 2
.99
3.14
2
.95
2.3
4 3
.14
5.0
6 4
.56
5.79
5
.99
4.18
4
.32
4.2
5 3
.84
Sub-
Tota
l (Priv
ate P
rovid
ers)
94.
71
94.
03
93.
86
94.
65
93.
65
93.
58
94.
28
94.
21
94.
87
94.
99
95.1
3 9
5.05
9
3.44
9
4.08
9
4.57
9
4.59
9
2.90
9
3.86
9
3.80
9
3.52
9
4.43
Publi
c hos
pitals
4.3
0 4
.39
4.51
3
.77
4.3
1 4
.22
3.6
3 3
.62
3.16
3
.12
2.9
0 2
.81
2.8
6 2
.68
2.4
5 2
.35
2.4
3 1.
90
2.0
9 2
.48
2.0
7
Publi
c med
ical c
linics
0.3
0 0
.31
0.3
0 0
.27
0.3
3 0
.38
0.3
9 0
.40
0.3
8 0
.38
0.4
0 0
.39
0.3
0 0
.31
0.19
0
.07
0.2
9 0
.27
0.3
1 0
.29
0.3
3
Publi
c ins
titut
ions p
rovid
ing h
ealth
-relat
ed
serv
ices
0.6
9 1.
27
1.32
1.
30
1.71
1.
82
1.70
1.
77
1.59
1.
51
1.57
1.
75
3.4
0 2
.94
2.78
2
.99
4.3
9 3
.96
3.8
0 3
.71
3.16
Sub-
Tota
l (Pub
lic P
rovid
ers)
5.2
9 5
.97
6.14
5
.35
6.3
5 6
.42
5.72
5
.79
5.13
5
.01
4.8
7 4
.95
6.5
6 5
.92
5.4
3 5
.41
7.10
6
.14
6.2
0 6
.48
5.5
7
Tota
l 10
0.00
10
0.00
10
0.00
10
0.00
10
0.00
10
0.00
10
0.00
10
0.00
10
0.00
10
0.00
10
0.00
10
0.00
10
0.00
10
0.00
10
0.00
10
0.00
10
0.00
10
0.00
10
0.00
10
0.00
10
0.00
92 MALAYSIA NATIONAL HEALTH ACCOUNTS HEALTH EXPENDITURE REPORT 1997-2017

The data under this section responds to the question on the type of health care services and products that are purchased with the OOP spending. This includes expenditures for core functions of health care such as for services of curative care, ancillary services, medical goods & appliances and others, as well as health-related functions such as capital asset purchases, education & training, research & development and others.
In 2017 the largest proportion of OOP health expenditure is RM9,904 million (46%) for out-patient care services (Figure 9.3a). This would include out-patient care services provided both in standalone medical clinics as well as in hospital facilities. In the same year in-patient care services is RM5,090 million (24%) of OOP health spending. This would include spending at both public and private hospitals with greater proportion at private hospitals. The OOP health spending for pharmaceuticals including over-the-counter and prescription drugs is RM2,923 million (13%), health education and training is RM1,443 million (7 percent), medical appliances and non-durable goods
9.3 OUT-OF-POCKET HEALTH EXPENDITURE BY FUNCTIONS
is RM749 million (3 percent), day-care services at RM564 million (3 percent), TCM is RM541 million (2 percent) and the remaining RM358 million (2 percent) is for other functions.
The 1997 to 2017 time series data although shows general increase in the level of OOP health spending for various functions, the proportions show some variations. Over this 21-year time period, the OOP health spending for out-patient services has increased from RM1,450 million in 1997 to RM9,904 million in 2017, the proportion of out-patient services has actually remains the same, around 46% (Figure 9.3b). This time period has also seen a rise in in-patient services from RM745 million in 1997 to RM5,090 million in 2017 with the proportion of this function remains around 18 to 25% over this time. There is nearly 52-fold increase in OOP health spending for health education and training from RM28 million in 1997 to RM1,443 million in 2017 and 8-fold increase in OOP health expenditure for pharmaceuticals from RM325 million in 1997 to RM2,923 million in 2017 (Table 9.3a and Table 9.3b).
MALAYSIA NATIONAL HEALTH ACCOUNTS HEALTH EXPENDITURE REPORT 1997-2017 93
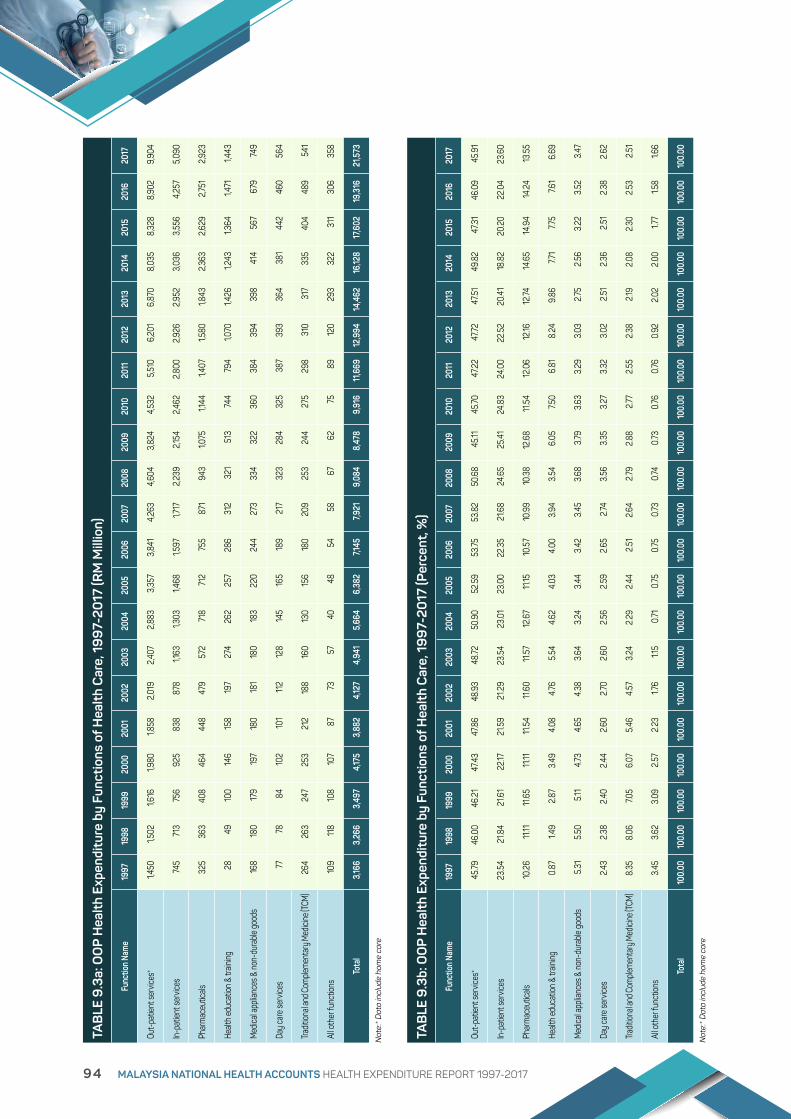
Not
e:*
Dat
a in
clud
e ho
me
care
TAB
LE 9
.3a:
OO
P H
ealt
h Ex
pend
itur
e by
Fun
ctio
ns o
f Hea
lth
Car
e, 1
99
7-20
17 (R
M M
illio
n)
Func
tion
Nam
e19
9719
9819
9920
0020
0120
0220
0320
0420
0520
0620
0720
0820
0920
1020
1120
1220
1320
1420
1520
1620
17
Out-
patie
nt se
rvice
s*1,4
501,5
021,6
161,9
801,8
582,0
192,4
072,
883
3,35
73,
841
4,26
34,6
043,
824
4,53
25,5
106,
201
6,87
08,
035
8,32
88,
902
9,90
4
In-p
atien
t ser
vices
745
713
756
925
838
878
1,163
1,303
1,468
1,597
1,717
2,23
92,1
542,4
622,
800
2,926
2,952
3,03
63,
556
4,25
75,0
90
Phar
mac
eutic
als
325
363
408
464
448
479
572
718
712
755
871
943
1,075
1,144
1,407
1,580
1,843
2,36
32,6
292,7
512,9
23
Healt
h ed
ucat
ion &
train
ing28
4910
014
615
819
727
426
225
728
631
232
151
374
479
41,0
701,4
261,2
431,3
641,4
711,4
43
Med
ical a
pplia
nces
& n
on-d
urab
le go
ods
168
180
179
197
180
181
180
183
220
244
273
334
322
360
384
394
398
414
567
679
749
Day
care
serv
ices
7778
8410
210
111
212
814
516
518
921
732
328
432
538
739
336
438
144
246
056
4
Tradit
ional
and C
omple
men
tary
Med
icine
(TCM
) 26
426
324
725
321
218
816
013
015
618
020
925
324
427
529
831
031
733
540
448
954
1
All o
ther
func
tions
109
118
108
107
8773
5740
4854
5867
6275
8912
029
332
231
130
635
8
Tota
l 3,1
663,
266
3,49
74,
175
3,88
24,
127
4,94
15,
664
6,38
27,1
457,9
219,
084
8,47
89,
916
11,6
6912
,994
14,4
6216
,128
17,6
0219
,316
21,5
73
Not
e:*
Dat
a in
clud
e ho
me
care
TAB
LE 9
.3b:
OO
P H
ealt
h Ex
pend
itur
e by
Fun
ctio
ns o
f Hea
lth
Car
e, 1
99
7-20
17 (P
erce
nt, %
)
Func
tion
Nam
e19
9719
9819
9920
0020
0120
0220
0320
0420
0520
0620
0720
0820
0920
1020
1120
1220
1320
1420
1520
1620
17
Out-
patie
nt se
rvice
s*45
.7946
.00
46.2
147
.43
47.8
648
.93
48.72
50.9
052
.59
53.75
53.8
250
.68
45.11
45.70
47.2
247
.7247
.5149
.82
47.3
146
.09
45.9
1
In-p
atien
t ser
vices
23.5
421
.84
21.6
122
.1721
.59
21.2
923
.54
23.0
123
.00
22.3
521
.68
24.6
525
.41
24.8
324
.00
22.5
220
.41
18.8
220
.20
22.0
423
.60
Phar
mac
eutic
als
10.2
611
.1111
.65
11.11
11.5
411
.60
11.5
712
.67
11.15
10.5
710
.99
10.3
812
.68
11.5
412
.06
12.16
12.74
14.6
514
.94
14.2
413
.55
Healt
h ed
ucat
ion &
train
ing0.
871.4
92.
873.
494.
084.7
65.
544.
624.
034.
003.
943.
546.
057.5
06.
818.
249.
867.7
17.7
57.6
16.
69
Med
ical a
pplia
nces
& n
on-d
urab
le go
ods
5.31
5.50
5.11
4.73
4.65
4.38
3.64
3.24
3.44
3.42
3.45
3.68
3.79
3.63
3.29
3.03
2.75
2.56
3.22
3.52
3.47
Day
care
serv
ices
2.43
2.38
2.40
2.44
2.60
2.70
2.60
2.56
2.59
2.65
2.74
3.56
3.35
3.27
3.32
3.02
2.51
2.36
2.51
2.38
2.62
Tradit
ional
and C
omple
men
tary
Med
icine
(TCM
) 8.
358.
067.0
56.
075.4
64.
573.
242.
292.4
42.
512.6
42.7
92.
882.7
72.
552.
382.1
92.0
82.
302.
532.
51
All o
ther
func
tions
3.45
3.62
3.09
2.57
2.23
1.76
1.15
0.71
0.75
0.75
0.73
0.74
0.73
0.76
0.76
0.92
2.02
2.00
1.77
1.58
1.66
Tota
l 10
0.00
100.
0010
0.00
100.
0010
0.00
100.
0010
0.00
100.
0010
0.00
100.
0010
0.00
100.
0010
0.00
100.
0010
0.00
100.
0010
0.00
100.
0010
0.00
100.
0010
0.00
94 MALAYSIA NATIONAL HEALTH ACCOUNTS HEALTH EXPENDITURE REPORT 1997-2017
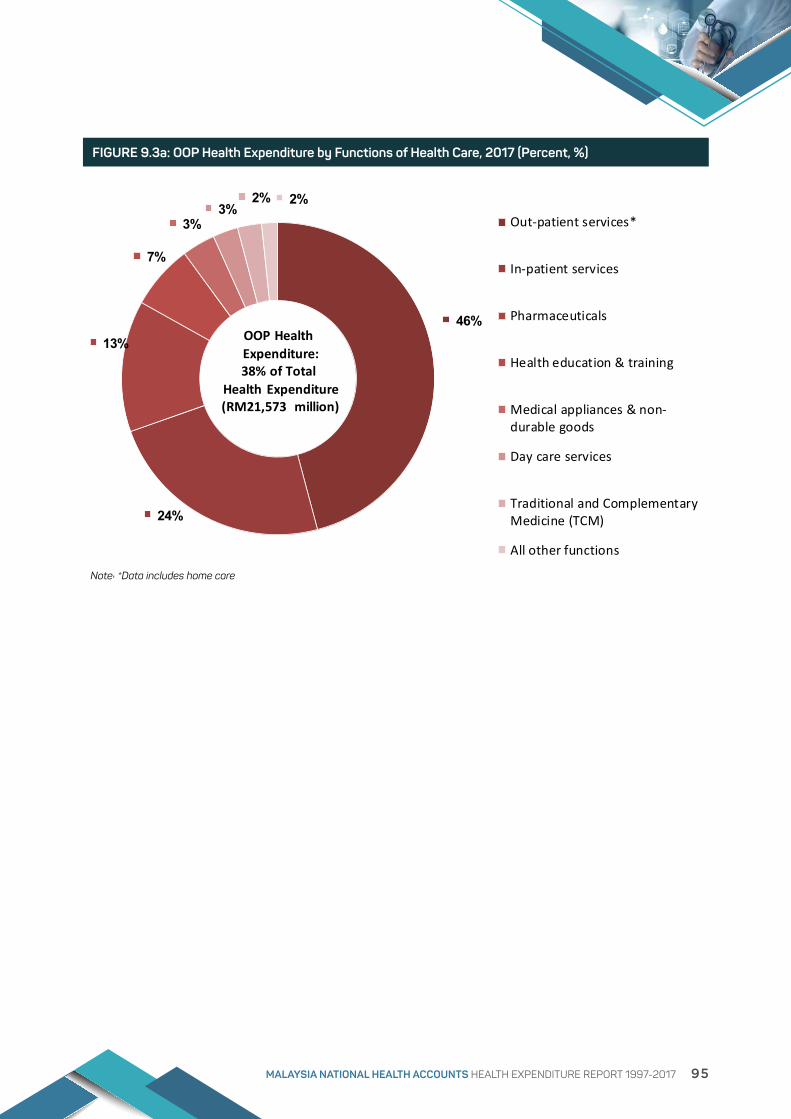
MNHA HEALTH EXPENDITURE REPORT 1997-2017 103
FIGURE 9.3a: OOP Health Expenditure by Functions of Health Care, 2017 (Percent, %)
46%
24%
13%
7%
3%3%
2% 2%Out-patient services*
In-patient services
Pharmaceuticals
Health education & training
Medical appliances & non-durable goods
Day care services
Traditional and ComplementaryMedicine (TCM)
All other functions
OOPHealthExpenditure:38%ofTotal
HealthExpenditure(RM21,573million)
Note: *Data includes home care
Note: *Data includes home care
FIGURE 9.3a: OOP Health Expenditure by Functions of Health Care, 2017 (Percent, %)
MALAYSIA NATIONAL HEALTH ACCOUNTS HEALTH EXPENDITURE REPORT 1997-2017 95

46%46%
24% 24%
10% 14%
5%7%
8%3%
2%3%1%3%4%2%
0%
20%
40%
60%
80%
100%
120%
1997 2017
All other functions
Health education &training
Day care services
TCM
Medical appliances &non-durable goods
Pharmaceuticals
In-patient services
Out-patient services
FIGURE 9.3b: OOP Health Expenditure by Functional Proportion, 1997 & 2017 (Percent %)
96 MALAYSIA NATIONAL HEALTH ACCOUNTS HEALTH EXPENDITURE REPORT 1997-2017

INTERNATIONAL NHA DATA
Global Health Expenditure Database (GHED) is the main data source for international level data on national health expenditure for more than 190 World Health Organization (WHO) member states. This is freely accessible via the related website. On an annual basis every member country is obliged to submit their national health expenditure data according to WHO request formats. However WHO carries out their own country level analysis based on System of Health Accounts (SHA) framework for several reasons. It could be that data submitted by various countries could either be estimated in SHA framework or a different framework. Furthermore some countries are unable to produce timely annual NHA data. However available country specific data form the basis of WHO analysis. In addition to the submitted country specific NHA data, WHO also uses country specific macro level data from various sources such as United Nations (UN), World Bank (WB), International Monetary Fund (IMF) and other sources for their NHA analysis.
The outputs of WHO analysis are then uploaded onto GHED database as the international health expenditure data for member countries. These WHO estimations for member countries allow standardization in NHA reporting and ensure better cross-country comparability. However it is important to recognize that every member country, like Malaysia, may produce their own NHA reporting based on local needs. As such MNHA Framework with slightly different boundaries of definitions is more important in the Malaysian context especially for policy makers, health planners, researchers and other interested parties.
SHA is an internationally accepted methodology for summarizing, describing, and analyzing financial flow in health systems of various countries. It was first published in 2000 by Organization for Economic Cooperation and Development (OECD) and then adapted by WHO to inform health policy and measure health system performance. This first version of the SHA is referred to as SHA 1.0. Over time, more than 100 developing countries have completed their NHA estimations based on SHA 1.0. After ten
years, following an intensive exercise involving large numbers of people and working closely with country counterparts for more than a year, the related international organizations of OECD, Eurostat, and WHO produced an updated version called SHA 2011.
In keeping with this new development, December 2017 saw the challenging transformation of GHED under WHO website to accommodate NHA data reporting based on the latest SHA 2011 framework. It was decided that for countries which are yet to migrate to this new format of NHA reporting, WHO would carry out their own analysis based on whatever available data, either in SHA 1.0 or SHA 2011 formats. For the time being, Malaysia NHA data from 2000 to 2017 was submitted using the previous SHA 1.0 format.
Navigation of GHED website faces few changes however remains as 4 main headings of “Data explorer”, “Visualisations”, “Documentation Centre” and “Help”, Visualisations is previously known as Quick reports. However each heading comprise different contents. Each one of these 4 main headings can further be expanded to obtain more information. As such the section on “Data explorer” is further divided into another 3 sections namely “Indicators”, “Health expenditure data” and “Macro data” whereby various NHA related data is available under the first two sections. Tables 10.1 contain headers of the 3 sections which have further disaggregated data as listed in Appendix Table A4.1 and A4.2. Some selected data for country comparison will be highlighted further in this chapter.
A total of 16 developing and developed countries with potential policy relevance to Malaysia are selected from WHO GHED database. Comparisons are made based on the year 2016 as the latest available year at the time of this report is produced. The countries include Australia, Bangladesh, China, France, Germany, India, Indonesia, Japan, Malaysia, Philippines, Republic of Korea, Singapore, Sri Lanka, Thailand, United Kingdom and United States of America.
CHAPTER 10
MALAYSIA NATIONAL HEALTH ACCOUNTS HEALTH EXPENDITURE REPORT 1997-2017 97

As mentioned earlier, all Malaysia NHA estimations use MNHA Framework & SHA 1.0 Framework. Therefore, as stated earlier international data for Malaysia is estimated by WHO Geneva experts using the SHA 1.0 data. Appendix Tables A2.1-A2.3 contains all the recent international data submitted to WHO using WHO prepared templates. However, the following comparisons below are based on WHO estimations which were extracted from GHED database to ensure better country comparability.
As clarified earlier in section 2.1, CHE instead of TEH has been used by WHO for international comparison. In 2016 based on WHO GHED database, CHE of Malaysia was 3.8 percent GDP which is lower than neighbouring countries such as Singapore, Philippines, China, Sri Lanka and Korea but higher than other regional countries such as Thailand, Indonesia and Bangladesh (Figure 10.1). Health expenditures in developed countries like Australia, UK, Japan, France and Germany were between 9 to 11 percent GDP with USA at 17% GDP. Likewise the per capita health expenditure of developed countries ranged from twice to four times of Malaysia with USA as the outlier (Figure 10.2). However this reported value of per capita is not based on actual utilization of healthcare services and is a very gross comparison.
Even though SHA 2011 does not use the terms “public” or “private” sources of financing, GHED database maintains this terminology under the list of indicators under “domestic general government” and “domestic private” health expenditure (Appendix Table A4.1). Most developed countries including China, Thailand and Malaysia have a higher domestic government health expenditure compared to domestic private health expenditure (Figure 10.3). International Comparison of Out-of-pocket Health Financing Scheme as Percent of Current Health Expenditure, lists Malaysia on fifth rank after Bangladesh, India, Philippines and Sri Lanka in 2016 (Figure 10.4). Amongst the selected country comparison, those with some form of Social Health Insurance include Japan, France, Germany, Republic of Korea, China, USA, Philippines, Indonesia, Thailand, India, Singapore, Malaysia and Sri Lanka. SHA 2011 identifies classification of government and compulsory financing schemes which includes social health insurance (SHI) schemes. The proportion of SHI of all government and compulsory health financing schemes varies from 1 to 95 percent in countries with SHI (Figure 10.5). Although the SOCSO health expenditure is a very small proportion of all Current Health Expenditure in Malaysia, it is considered as a form of SHI.
Source: Global Health Expenditure Database (GHED) WHO NHA on 29th March 2019
Table 10.1: Available Data in GHED under Various Headers
Main Header Sub-Header
1 Indicators
1.1 Aggregates
1.2 Financing Sources
1.3 Financing Schemes
1.4 Primary Health Care (Preliminary Data)
1.5 Cross classifications
1.6 Macro
2 Health Expenditure Data
2.1 Revenues
2.2 Financing Schemes
2.3 Health Care Function (Preliminary Data)
2.4 Disease and Conditions
2.5 Age
2.6 Capital Expenditure
3 Macro Data
3.1 Consumption
3.2 Exchanges Rates
3.3 Price Index
3.4 Population
98 MALAYSIA NATIONAL HEALTH ACCOUNTS HEALTH EXPENDITURE REPORT 1997-2017
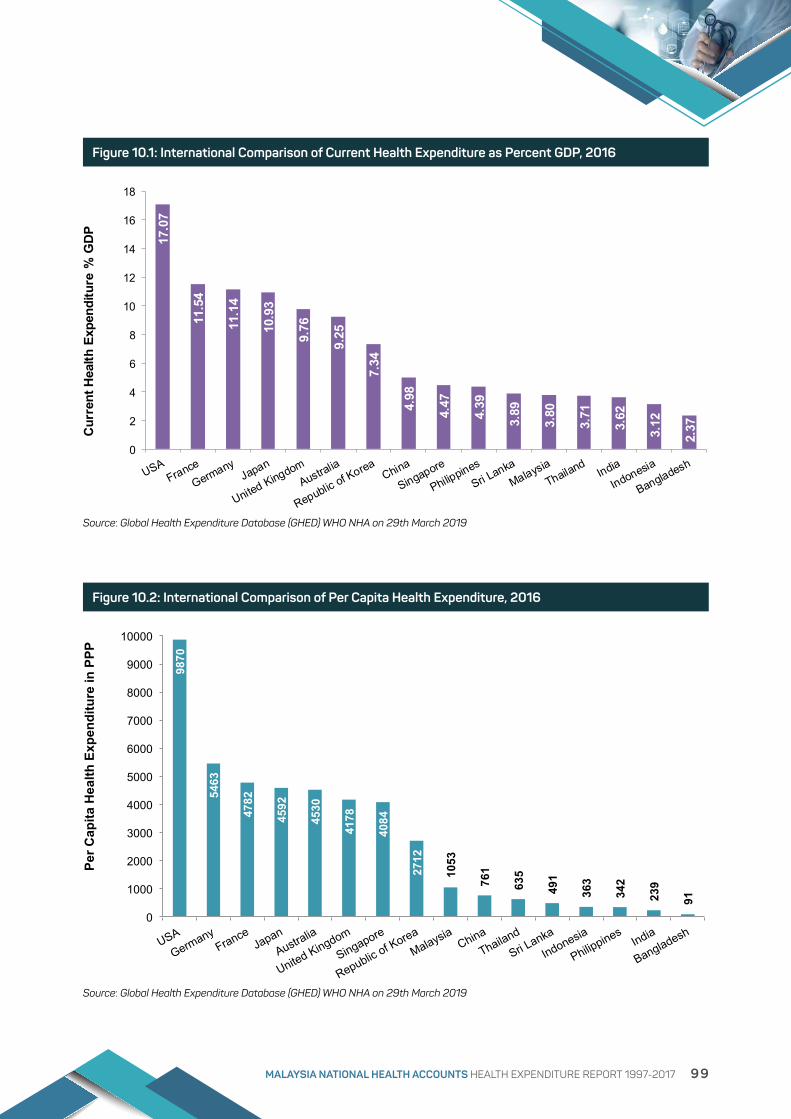
Source: Global Health Expenditure Database (GHED) WHO NHA on 29th March 2019
Figure 10.1: International Comparison of Current Health Expenditure as Percent GDP, 2016
Source: Global Health Expenditure Database (GHED) WHO NHA on 29th March 2019
Figure 10.2: International Comparison of Per Capita Health Expenditure, 2016
MNHA HEALTH EXPENDITURE REPORT 1997-2017 108
Figure 10.1: International Comparison of Current Health Expenditure as Percent GDP, 2016
17.0
7
11.5
4
11.1
4
10.9
3
9.76
9.25
7.34
4.98
4.47
4.39
3.89
3.80
3.71
3.62
3.12
2.37
0
2
4
6
8
10
12
14
16
18
Cur
rent
Hea
lth E
xpen
ditu
re %
GD
P
Source: Global Health Expenditure Database (GHED) WHO NHA on 29th March 2019
Figure 10.2: International Comparison of Per Capita Health Expenditure, 2016
Source: Global Health Expenditure Database (GHED) WHO NHA on 29th March 2019
9870
5463
4782
4592
4530
4178
4084
2712
1053
761
635
491
363
342
239
91
0
1000
2000
3000
4000
5000
6000
7000
8000
9000
10000
Per C
apita
Hea
lth E
xpen
ditu
re in
PPP
MALAYSIA NATIONAL HEALTH ACCOUNTS HEALTH EXPENDITURE REPORT 1997-2017 99
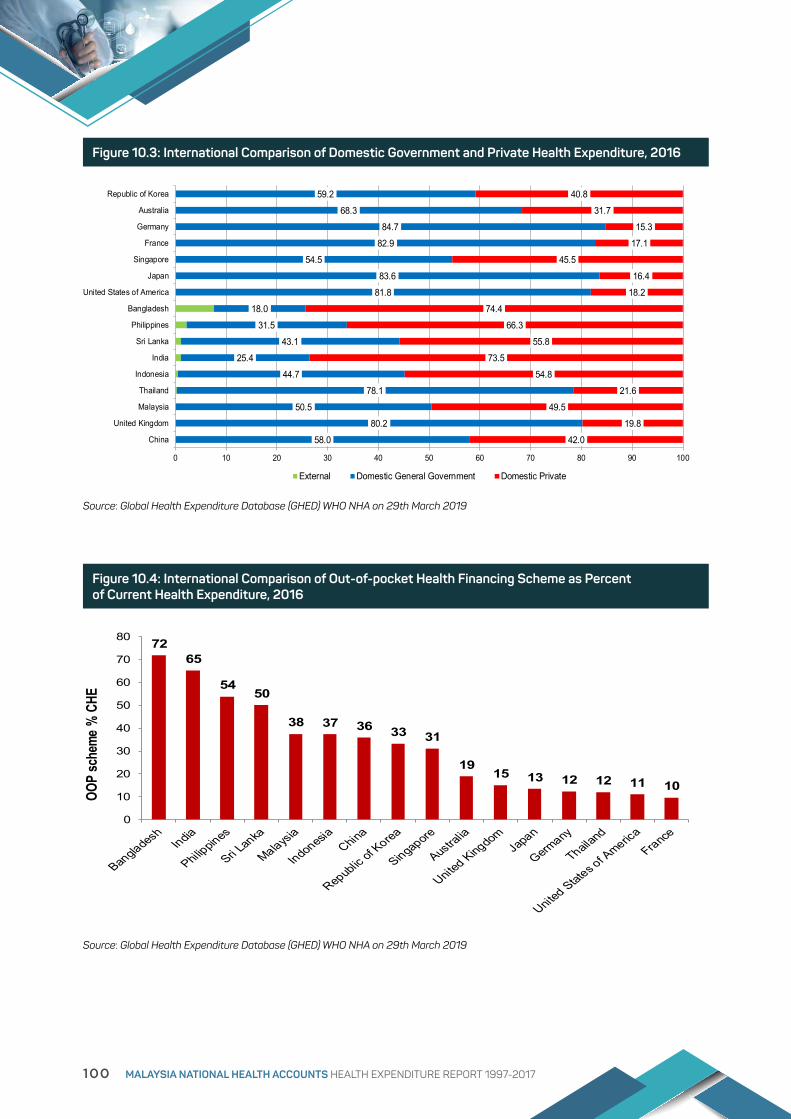
58.0
80.2
50.5
78.1
44.7
25.4
43.1
31.5
18.0
81.8
83.6
54.5
82.9
84.7
68.3
59.2
42.0
19.8
49.5
21.6
54.8
73.5
55.8
66.3
74.4
18.2
16.4
45.5
17.1
15.3
31.7
40.8
0 10 20 30 40 50 60 70 80 90 100
China
United Kingdom
Malaysia
Thailand
Indonesia
India
Sri Lanka
Philippines
Bangladesh
United States of America
Japan
Singapore
France
Germany
Australia
Republic of Korea
External Domestic General Government Domestic Private
7265
5450
38 37 36 33 31
1915 13 12 12 11 10
0
10
20
30
40
50
60
70
80
OOP
sche
me %
CHE
Source: Global Health Expenditure Database (GHED) WHO NHA on 29th March 2019
Source: Global Health Expenditure Database (GHED) WHO NHA on 29th March 2019
Figure 10.3: International Comparison of Domestic Government and Private Health Expenditure, 2016
Figure 10.4: International Comparison of Out-of-pocket Health Financing Scheme as Percent of Current Health Expenditure, 2016
100 MALAYSIA NATIONAL HEALTH ACCOUNTS HEALTH EXPENDITURE REPORT 1997-2017

9086 83 80
67
4137
28
15 13 12
1 10
10
20
30
40
50
60
70
80
90
100
SHI s
chem
e %
Gov
ernm
ent &
Com
pulso
ry
Sche
me
Figure 10.5: International Comparison of Social Health Insurance as Percent Government and Compulsory Health Financing Schemes, 2016
Source: Global Health Expenditure Database (GHED) WHO NHA on 29th March 2019
MALAYSIA NATIONAL HEALTH ACCOUNTS HEALTH EXPENDITURE REPORT 1997-2017 101

APPENDIX TABLES
TABLE A1.1 : Source of Data
Data Sources for Public Sector Estimation
PUBLIC SECTOR
Main Agencies Specific Organisation Source of Data
1 Ministry of Health (MOH)
Accountant-General’s Department MOH - AG DATA (expenditure)
District Health Office MNHA survey
District Health Office - Vaccine MNHA survey
District Health Office – Sarawak Pharmaceutical Office MNHA survey
2
Other Ministries
Ministry of Education MNHA survey - MOE
Ministry of Education – Collaboration MOE and MOH MNHA survey - KPT - KKM
University Health Center MNHA survey - MOHE - PKU
Ministry of Defence MNHA survey - MOD
3 Other Federal Agencies
National Population and Family Development Board MNHA survey - LPPKN
Department of Orang Asli Development MNHA survey - JAKOA
Public Service Department-Pension MNHA survey - JPA
Civil Defence Department MNHA survey - JPAM
Prison Department of Malaysia MNHA survey - PENJARA
Social Welfare Department MNHA survey - JKM
Occupational Safety And Health Department MNHA survey - DOSH
National Institute of Occupational Safety & Health Malaysia MNHA survey - NIOSH
National Anti-Drug Agency MNHA survey - AADK
Pilgrims Fund Board MNHA survey - LTH
National Heart Institute MNHA survey - IJN
Federal Statutory Bodies MNHA survey - BERKANUN (Fed)
Public Water Supply Department (Federal) MNHA survey - JBA (OFA)
National Sports Institute of Malaysia MNHA survey - ISN
Employee Provident Fund - HQ MNHA survey - KWSP (0001)
Employee Provident Fund - state MNHA survey - KWSP (0002)
Emergency Medical Rescue Services (EMRS) MNHA survey - EMRS
Social Security Organization - HQ MNHA survey - PERKESO (0001)
Social Security Organization - state MNHA survey - PERKESO (0002)
Ministry of Science Technology and Innovation MNHA survey - MOSTI
Public Higher Education Institutions MNHA survey - TRAINING (OFA-Pu)
Private Higher Education Institutions MNHA survey - TRAINING (OFA-Pr)
4 State Agencies
State Government (General) MNHA survey - KN
Public Water Supply Department (State) MNHA survey - JBA (state)
State Statutory Body (SSB) MNHA survey - BERKANUN (state)
Public Water Supply Department (State Statutory Body) MNHA survey - JBA (SSB)
State Islamic Religious Council / Zakat Collection Centre MNHA survey - MAIN
5 Local Authorities Local Authority - Health care Services MNHA survey - PBT (Perkhid)
Local Authority - Staff MNHA survey - PBT (Ktgn)
102 MALAYSIA NATIONAL HEALTH ACCOUNTS HEALTH EXPENDITURE REPORT 1997-2017

TABLE A1.2 : Source of Data Data Sources for Private Sector Estimation
PRIVATE SECTOR
Main Agencies Specific Organisation Source of Data
1 Private Insurance Central Bank of Malaysia MNHA survey - BNM
Insurance Agencies MNHA survey - INSURAN
2 Managed Care Organization MCO Agencies MNHA Survey - MCO
3 Out of Pocket (Gross Spending)
MOH user charges MOH - AG DATA (Revenue)
IJN user charges MNHA Survey - IJN
MOHE user charges MNHA Survey - KPT
Private Hospital (MNHA) MNHA Survey - PRIVATE HOSPITAL
Private Hospital (DOSM) DOSM Survey - PRIVATE HOSPITAL
Private Clinic (Medical), DOSM DOSM Survey - PRIVATE MEDICAL CLINIC
Private Clinic (Dental), DOSM DOSM Survey - PRIVATE DENTAL CLINIC
Private Haemodialysis Centre (MNHA) MNHA Survey - PRIVATE HEMO (0001)
Pharmacy Division, MOH MNHA Survey - FARMASI (0001)
IMS MNHA Survey - FARMASI (0002)
Medical supplies HIES, DOSM DOSM Survey - HES DATA
Medical durables / prostheses / equipments HIES, DOSM DOSM Survey - HES DATA
Ancillary services HIES, DOSM DOSM Survey - HES DATA
Private TCM HIES, DOSM DOSM Survey - HES DATA
Public Higher Education Institutions MNHA survey - TRAINING (OOP-Pu)
Private Higher Education Institutions MNHA survey - TRAINING (OOP-Pr)
4 Out-of Pocket (Third Party Deductions)
Insurance Agencies MNHA Survey - INSURAN
Central Bank of Malaysia MNHA survey - BNM
Private Corporations MNHA Survey - PRIVATE CORPORATION
Employees Provident Fund MNHA Survey - KWSP
Social Security Organization MNHA Survey - PERKESO
Federal Statutory Bodies MNHA Survey - BERKANUN (Fed)
State Statutory Body MNHA Survey - BERKANUN (state)
FOMEMA/UNITAB MEDIC - OOP data MNHA Survey - UNITABMEDIC
GROWARISAN - OOP data MNHA Survey - GROWARISAN
5 Non-Government Organization Non-Governmental Organizations MNHA survey - NGO
6 Corporations Limited and Private Limited Corporations MNHA Survey - PRIVATE CORPORATION
Corps - Labour Force Survey DOSM Survey - CORPS_DOS (0002)
Industrial Survey & Manufacturing, DOSM DOSM Survey - CORPS_DOS (0001-non med)
Private Hospital staff, DOSM DOSM Survey - CORPS_DOS (0001-hosp)
Private Clinic Medical, DOSM DOSM Survey - CORPS_DOS (0001-clinic)
Private Clinic Dental, DOSM DOSM Survey - CORPS_DOS (0001-dental)
Private Water Supply Department MNHA survey - JBA (corp)
FOMEMA/UNITAB MEDIC MNHA Survey - UNITABMEDIC
GROWARISAN MNHA Survey - GROWARISAN
Public Higher Education Institutions MNHA survey - TRAINING (Corp-Pu)
Private Higher Education Institutions MNHA survey - TRAINING (Corp-Pr)
7 Rest of the world International Organizations in Malaysia MNHA survey - Rest
8 Other National Surveys DOSM-Population survey General-DOS General_DOS (0001)
DOSM-GDP & GDP Deflator General-DOS General_DOS (0002)
DOSM-Household Consumption General-DOS General_DOS (0003)
MALAYSIA NATIONAL HEALTH ACCOUNTS HEALTH EXPENDITURE REPORT 1997-2017 103

TABLE A2: Comparison of MNHA Framework to SHA 1.0 with SHA Tables
The data in this document is reported using the MNHA Framework. However, the revised data analysis is produced under dual coding and a set of tables showing the comparison of MNHA codes mapped
to ICHA codes are shown for reference (Appendix Table A2.1 to A2.3). This is followed by six SHA Tables (Appendix Table A3 to A4).
TABLE A2.1 : Classification of Total Expenditure on Health by Sources of Financing
MNHA Code ICHA Code Sources of Financing Description
MS1 HF.1 Public Sector Refers to MS1.1 and MS1.2 classifications
MS1.1 HF.1.1 Public sector excluding social security funds
Refers to Federal Government, state government & local authorities
MS1.2 HF.1.2 Social security funds SOCSO & EPF
MS2 HF.2 Private sector Refers to MS2 classification
MS2.1 HF.2.1 Private social insurance Currently does not exist in Malaysia
MS2.2 HF.2.2 Private insurance enterprises (other than social insurance)
Private health insurance
MS2.3 HF.2.2 Private MCOs and other similar entities Registered MCO other than private health insurance
MS2.4 HF.2.3 Private household out-of-pocket expenditures
Individual OOP spending on health
MS2.5 HF.2.4 Non-profit institutions serving households
Health - related NGOs
MS2.6 HF.2.5 All corporations (other than health insurance)
Private employers
MS9 HF.3 Rest of the world Rest of the world
104 MALAYSIA NATIONAL HEALTH ACCOUNTS HEALTH EXPENDITURE REPORT 1997-2017
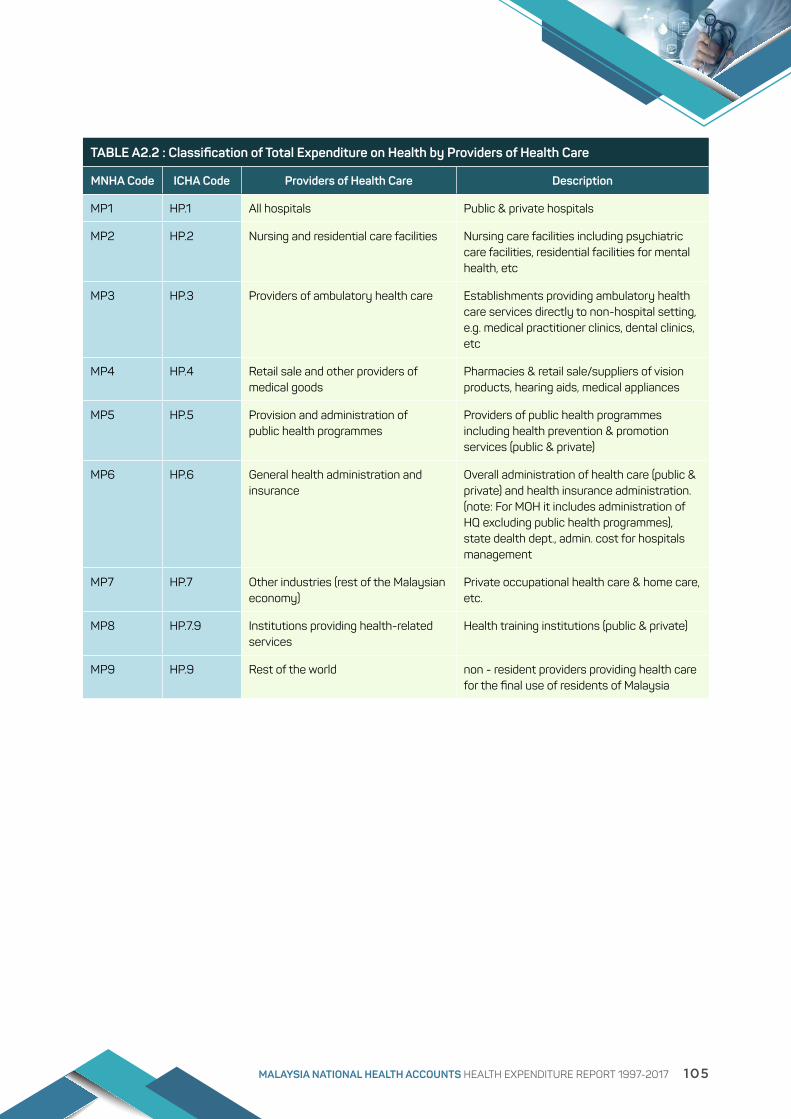
TABLE A2.2 : Classification of Total Expenditure on Health by Providers of Health Care
MNHA Code ICHA Code Providers of Health Care Description
MP1 HP.1 All hospitals Public & private hospitals
MP2 HP.2 Nursing and residential care facilities Nursing care facilities including psychiatric care facilities, residential facilities for mental health, etc
MP3 HP.3 Providers of ambulatory health care Establishments providing ambulatory health care services directly to non-hospital setting, e.g. medical practitioner clinics, dental clinics, etc
MP4 HP.4 Retail sale and other providers of medical goods
Pharmacies & retail sale/suppliers of vision products, hearing aids, medical appliances
MP5 HP.5 Provision and administration of public health programmes
Providers of public health programmes including health prevention & promotion services (public & private)
MP6 HP.6 General health administration and insurance
Overall administration of health care (public & private) and health insurance administration. (note: For MOH it includes administration of HQ excluding public health programmes), state dealth dept., admin. cost for hospitals management
MP7 HP.7 Other industries (rest of the Malaysian economy)
Private occupational health care & home care, etc.
MP8 HP.7.9 Institutions providing health-related services
Health training institutions (public & private)
MP9 HP.9 Rest of the world non - resident providers providing health care for the final use of residents of Malaysia
MALAYSIA NATIONAL HEALTH ACCOUNTS HEALTH EXPENDITURE REPORT 1997-2017 105

TABLE A2.3 : Classification of Total Expenditure on Health by Functions of Health Care
MNHA Code ICHA Code Functions of Health Care Description
MF1 HC.1 Services of curative care Curative care provider at inpatient, outpatient, daycare & homecare services
MF2 HC.2 Services of rehabilitative care Rehabilitative care provider at inpatient, outpatient, daycare & homecare services
MF3 HC.3 Services of long-term nursing care Long term nursing care provider at inpatient, outpatient, daycare & homecare services
MF4 HC.4 Ancillary services to health care Stand-alone laboratory, diagnostic imaging, transport & emergency rescue, etc.
MF5 HC.5 Medical goods dispensed to out-patients
Pharmaceuticals, appliances, western medicines, TCM, etc.
MF6 HC.6 Public health services, including health promotion and prevention
Health promotion, prevention, family planning, school health services, etc.
MF7 HC.7 Health program administration and health insurance
Administration at HQ, State health dept, local authorities, SOCSO, EPF, private insurance, etc.
MR1 HC.R.1 Capital formation of health care provider institutions
Administration at HQ, State health dept, local authorities, SOCSO, EPF, private insurance, etc.
MR2 HC.R.2 Education and training of health personnel
Government & private provision of education and training of health personnel, including admin., etc.
MR3 HC.R.3 Research and development in health Research and development in relation to health care
MR9 HC.R.6 All other health-related expenditures Category to capture all other expenditures that not classified elsewhere in MNHA
106 MALAYSIA NATIONAL HEALTH ACCOUNTS HEALTH EXPENDITURE REPORT 1997-2017
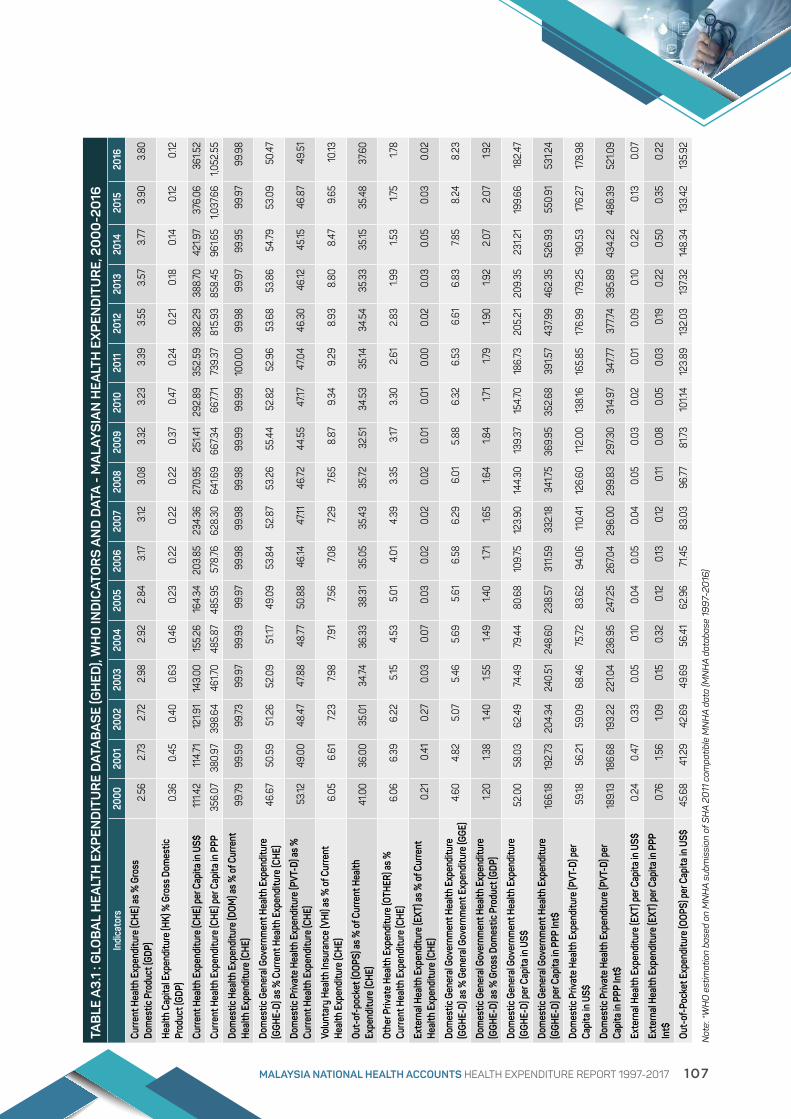
Not
e: *
WH
O e
stim
atio
n ba
sed
on M
NH
A su
bmis
sion
of S
HA
2011
com
patib
le M
NH
A da
ta (M
NH
A da
taba
se 1
99
7-20
16)
TAB
LE A
3.1
: GLO
BA
L H
EALT
H E
XP
END
ITU
RE
DAT
AB
AS
E (G
HED
), W
HO
IND
ICAT
OR
S A
ND
DAT
A -
MA
LAY
SIA
N H
EALT
H E
XP
END
ITU
RE,
20
00
-20
16In
dica
tors
2000
2001
2002
2003
2004
2005
2006
2007
2008
2009
2010
2011
2012
2013
2014
2015
2016
Curre
nt H
ealth
Exp
endi
ture
(CHE
) as %
Gro
ss
Dom
estic
Pro
duct
(GDP
)2.
562.
732.
722.
982.
922.
843.
173.
123.
083.
323.
233.
393.
553.
573.
773.
903.
80
Heal
th C
apita
l Exp
endi
ture
(HK)
% G
ross
Dom
estic
Pr
oduc
t (GD
P)0.
360.
450.
400.
630.
460.
230.
220.
220.
220.
370.
470.
240.
210.
180.
140.
120.
12
Curre
nt H
ealth
Exp
endi
ture
(CHE
) per
Cap
ita in
US$
111.4
211
4.71
121.9
114
3.00
155.
2616
4.34
203.
8523
4.36
270.
9525
1.41
292.
8935
2.59
382.
2938
8.70
421.9
737
6.06
361.5
2
Curre
nt H
ealth
Exp
endi
ture
(CHE
) per
Cap
ita in
PPP
356.
0738
0.97
398.
6446
1.70
485.
8748
5.95
578.
7662
8.30
641.6
966
7.34
667.7
173
9.37
815.
9385
8.45
961.6
51,0
37.6
61,0
52.5
5
Dom
estic
Hea
lth E
xpen
ditu
re (D
OM) a
s % o
f Cur
rent
He
alth
Exp
endi
ture
(CHE
)99
.7999
.59
99.73
99.9
799
.93
99.9
799
.98
99.9
899
.98
99.9
999
.99
100.
0099
.98
99.9
799
.95
99.9
799
.98
Dom
estic
Gen
eral
Gov
ernm
ent H
ealth
Exp
endi
ture
(G
GHE-
D) a
s % C
urre
nt H
ealth
Exp
endi
ture
(CHE
)46
.67
50.5
951
.26
52.0
951
.1749
.09
53.8
452
.87
53.2
655
.44
52.8
252
.96
53.6
853
.86
54.79
53.0
950
.47
Dom
estic
Priv
ate
Heal
th E
xpen
ditu
re (P
VT-D
) as %
Cu
rrent
Hea
lth E
xpen
ditu
re (C
HE)
53.12
49.0
048
.47
47.8
848
.7750
.88
46.14
47.11
46.72
44.5
547
.1747
.04
46.3
046
.1245
.1546
.87
49.5
1
Volu
ntar
y He
alth
Insu
ranc
e (V
HI) a
s % o
f Cur
rent
He
alth
Exp
endi
ture
(CHE
)6.
056.
617.2
37.9
87.9
17.5
67.0
87.2
97.6
58.
879.
349.
298.
938.
808.
479.
6510
.13
Out-
of-p
ocke
t (OO
PS) a
s % o
f Cur
rent
Hea
lth
Expe
nditu
re (C
HE)
41.0
036
.00
35.0
134
.7436
.33
38.3
135
.05
35.4
335
.7232
.51
34.5
335
.1434
.54
35.3
335
.1535
.48
37.6
0
Othe
r Priv
ate
Heal
th E
xpen
ditu
re (O
THER
) as %
Cu
rrent
Hea
lth E
xpen
ditu
re (C
HE)
6.06
6.39
6.22
5.15
4.53
5.01
4.01
4.39
3.35
3.17
3.30
2.61
2.83
1.99
1.53
1.75
1.78
Exte
rnal
Hea
lth E
xpen
ditu
re (E
XT) a
s % o
f Cur
rent
He
alth
Exp
endi
ture
(CHE
)0.
210.
410.
270.
030.
070.
030.
020.
020.
020.
010.
010.
000.
020.
030.
050.
030.
02
Dom
estic
Gen
eral
Gov
ernm
ent H
ealth
Exp
endi
ture
(G
GHE-
D) a
s % G
ener
al G
over
nmen
t Exp
endi
ture
(GGE
)4.
604.
825.
075.
465.
695.
616.
586.
296.
015.
886.
326.
536.
616.
837.8
58.
248.
23
Dom
estic
Gen
eral
Gov
ernm
ent H
ealth
Exp
endi
ture
(G
GHE-
D) a
s % G
ross
Dom
estic
Pro
duct
(GDP
)1.2
01.3
81.4
01.5
51.4
91.4
01.7
11.6
51.6
41.8
41.7
11.7
91.9
01.9
22.
072.
071.9
2
Dom
estic
Gen
eral
Gov
ernm
ent H
ealth
Exp
endi
ture
(G
GHE-
D) p
er C
apita
in U
S$52
.00
58.0
362
.49
74.4
979
.44
80.6
810
9.75
123.
9014
4.30
139.
3715
4.70
186.
7320
5.21
209.
3523
1.21
199.
6618
2.47
Dom
estic
Gen
eral
Gov
ernm
ent H
ealth
Exp
endi
ture
(G
GHE-
D) p
er C
apita
in P
PP In
t$16
6.18
192.
7320
4.34
240.
5124
8.60
238.
5731
1.59
332.1
834
1.75
369.
9535
2.68
391.5
743
7.99
462.
3552
6.93
550.
9153
1.24
Dom
estic
Priv
ate
Heal
th E
xpen
ditu
re (P
VT-D
) per
Ca
pita
in U
S$59
.1856
.21
59.0
968
.46
75.72
83.6
294
.06
110.
4112
6.60
112.
0013
8.16
165.
8517
6.99
179.
2519
0.53
176.
2717
8.98
Dom
estic
Priv
ate
Heal
th E
xpen
ditu
re (P
VT-D
) per
Ca
pita
in P
PP In
t$18
9.13
186.
6819
3.22
221.0
423
6.95
247.2
526
7.04
296.
0029
9.83
297.3
031
4.97
347.7
737
7.74
395.
8943
4.22
486.
3952
1.09
Exte
rnal
Hea
lth E
xpen
ditu
re (E
XT) p
er C
apita
in U
S$0.
240.
470.
330.
050.
100.
040.
050.
040.
050.
030.
020.
010.
090.
100.
220.
130.
07
Exte
rnal
Hea
lth E
xpen
ditu
re (E
XT) p
er C
apita
in P
PP
Int$
0.76
1.56
1.09
0.15
0.32
0.12
0.13
0.12
0.11
0.08
0.05
0.03
0.19
0.22
0.50
0.35
0.22
Out-
of-P
ocke
t Exp
endi
ture
(OOP
S) p
er C
apita
in U
S$45
.68
41.2
942
.69
49.6
956
.41
62.9
671
.45
83.0
396
.7781
.7310
1.14
123.
8913
2.03
137.3
214
8.34
133.
4213
5.92
MALAYSIA NATIONAL HEALTH ACCOUNTS HEALTH EXPENDITURE REPORT 1997-2017 107

Not
e: *
WH
O e
stim
atio
n ba
sed
on M
NH
A su
bmis
sion
of S
HA
2011
com
patib
le M
NH
A da
ta (M
NH
A da
taba
se 1
99
7-20
16)
TAB
LE A
3.2
: GLO
BA
L H
EALT
H E
XP
END
ITU
RE
DAT
AB
AS
E (G
HED
), W
HO
IND
ICAT
OR
S A
ND
DAT
A -
MA
LAY
SIA
N H
EALT
H E
XP
END
ITU
RE,
20
00
-20
16
Indi
cato
rs20
0020
0120
0220
0320
0420
0520
0620
0720
0820
0920
1020
1120
1220
1320
1420
1520
16
Com
pulso
ry F
inan
cing A
rrang
emen
ts (C
FA)
as %
of C
urre
nt H
ealth
Exp
endi
ture
(CHE
)46
.67
50.5
951
.26
52.0
951
.1749
.1053
.86
52.8
853
.26
55.4
552
.83
52.9
653
.69
53.8
754
.84
53.2
150
.59
Gove
rnm
ent F
inan
cing A
rrang
emen
ts
(GFA
) as %
of C
urrre
nt H
ealth
Exp
endi
ture
(C
HE)
45.8
249
.67
50.3
351
.23
50.2
348
.1253
.09
52.10
52.70
54.8
852
.1952
.33
53.0
753
.1654
.1052
.52
49.8
1
Com
pulso
ry H
ealth
Insu
ranc
e (CH
I) as %
of
Curre
nt H
ealth
Exp
endi
ture
(CHE
)0.
860.
920.
920.
870.
940.
980.
770.
780.
560.
570.
640.
630.
620.
720.
740.
580.
66
Socia
l Hea
lth In
sura
nce (
SHI) a
s % of
Cu
rrent
Hea
lth E
xpen
ditu
re (C
HE)
0.86
0.92
0.92
0.87
0.94
0.98
0.77
0.78
0.56
0.57
0.64
0.63
0.62
0.72
0.74
0.58
0.66
Volu
ntar
y Fi
nanc
ing A
rrang
emen
ts (V
FA)
as %
of C
urre
nt H
ealth
Exp
endi
ture
(CHE
)53
.33
49.4
148
.7447
.91
48.8
350
.90
46.14
47.12
46.74
44.5
547
.1747
.04
46.3
146
.1345
.1646
.7949
.41
Gene
ral G
over
nmen
t Exp
endi
ture
(GGE
) as
% G
ross
Dom
estic
Pro
duct
(GDP
)26
.00
28.6
227
.53
28.47
26.2
524
.89
25.9
426
.26
27.3
031
.33
26.9
827
.4728
.80
28.17
26.3
325
.1223
.33
Gros
s Dom
estic
Pro
duct
(GDP
) per
Cap
ita
in U
S$4,
344.
024,
204.
364,4
75.2
34,7
93.4
35,3
21.5
85,7
77.19
6,42
7.00
7,507
.50
8,79
2.59
7,566
.87
9,07
1.40
10,4
05.11
10,77
9.49
10,8
82.2
611
,183.
869,
648.
559,
508.
24
Gros
s Dom
estic
Pro
duct
(GDP
) per
Cap
ita
in P
PP In
t$13
,882
.81
13,9
63.5
714
,633
.54
15,47
6.00
16,6
52.8
417
,082
.94
18,24
6.84
20,12
7.18
20,8
23.74
20,0
85.6
820
,680
.32
21,8
18.8
823
,006
.90
24,0
33.9
725
,487
.59
26,6
23.3
327
,682
.63
Curre
nt h
ealth
expe
nditu
re by
reve
nues
of
healt
h ca
re fi
nanc
ing s
chem
es9,
816.
3010
,330
.1411
,210
.61
13,41
6.09
14,8
52.8
915
,969
.57
19,5
49.4
621
,450
.30
24,5
03.76
24,4
60.6
326
,521
.88
30,8
95.5
034
,444
.92
36,3
83.2
541
,746.
3045
,122.
8546
,771.6
0
Tran
sfer
s fro
m go
vern
men
t dom
estic
re
venu
e (all
ocat
ed to
hea
lth pu
rpos
es)
4,497
.38
5,131
.46
5,642
.746,
872.
547,4
60.3
37,6
83.6
110
,374
.29
11,17
2.34
12,9
13.3
413
,420
.52
13,8
39.2
516
,166.
4518
,275
.80
19,3
34.74
22,5
64.6
523
,696
.04
23,2
96.15
Inte
rnal
trans
fers
and g
rant
s4,4
97.3
85,1
31.4
65,6
42.74
6,87
2.54
7,460
.33
7,683
.61
10,3
74.2
911
,172.
3412
,913
.34
13,4
20.5
213
,839
.25
16,16
6.45
18,2
75.8
019
,334
.7422
,564
.65
23,6
96.0
423
,296
.15
Tran
sfer
s dist
ribut
ed by
gove
rnm
ent f
rom
fo
reig
n or
igin
0.00
0.00
0.00
0.00
0.00
0.25
3.79
2.68
0.12
2.44
1.78
0.70
4.79
4.98
18.5
51.1
10.
81
Socia
l insu
ranc
e con
tribu
tions
83.9
494
.53
103.
6611
6.17
139.
2215
6.54
150.
6416
8.35
136.
9513
9.77
169.
5319
5.68
214.
3226
0.80
309.
8626
0.62
310.
20
Volu
ntar
y pr
epay
men
t59
4.00
683.
0081
0.70
1,070
.30
1,175
.30
1,207
.101,3
84.10
1,564
.20
1,875
.702,1
69.4
02,4
77.9
02,
869.1
03,
076.1
03,
202.
503,
535.6
04,
352.7
94,7
37.51
Othe
r dom
estic
reve
nues
n.e.
c.4,6
19.9
44,
378.
894,6
22.9
05,3
52.72
6,06
8.18
6,91
8.24
7,635
.92
8,54
1.37
9,57
3.57
8,72
7.98
10,0
33.0
611
,662
.97
12,8
70.6
313
,576
.09
15,3
14.3
416
,798.1
518
,418.
07
Othe
r rev
enue
s fro
m h
ouse
hold
s n.e.
c.4,0
24.70
3,718
.83
3,92
5.27
4,661
.40
5,395
.91
6,118
.38
6,85
1.70
7,599
.80
8,75
1.73
7,951
.96
9,158
.81
10,8
55.2
511
,896
.41
12,8
53.4
914
,675
.23
16,0
09.4
017
,584
.18
Othe
r rev
enue
s fro
m co
rpor
atio
ns n
.e.c.
534.
0161
1.88
627.6
558
1.83
557.1
066
0.25
629.
5776
2.54
617.6
154
7.85
615.
5550
8.18
629.
0665
3.40
604.
9368
3.83
702.1
6
Othe
r rev
enue
s fro
m N
PISH
n.e.
c.61
.23
48.18
69.9
810
9.49
115.1
713
9.62
154.
6517
9.03
204.
2322
8.17
258.
7029
9.54
345.1
669
.20
34.18
53.0
875
.43
Unsp
ecifi
ed ot
her d
omes
tic re
venu
es
(n.e.
c.)51
.84
56.3
0
108 MALAYSIA NATIONAL HEALTH ACCOUNTS HEALTH EXPENDITURE REPORT 1997-2017

Not
e: *
WH
O e
stim
atio
n ba
sed
on M
NH
A su
bmis
sion
of S
HA
2011
com
patib
le M
NH
A da
ta (M
NH
A da
taba
se 1
99
7-20
16)
TAB
LE A
3.3
: GLO
BA
L H
EALT
H E
XP
END
ITU
RE
DAT
AB
AS
E (G
HED
), W
HO
IND
ICAT
OR
S A
ND
DAT
A -
MA
LAY
SIA
N H
EALT
H E
XP
END
ITU
RE,
20
00
-20
16
Indi
cato
rs20
0020
0120
0220
0320
0420
0520
0620
0720
0820
0920
1020
1120
1220
1320
1420
1520
16
Dire
ct fo
reign
tran
sfer
s21
.0542
.2530
.614.3
69.8
53.8
20.7
31.3
74.0
80.5
30.3
60.5
93.2
94.1
53.3
114
.148.8
6
Curre
nt he
alth e
xpen
ditur
e by
finan
cing s
chem
es9,8
16.30
10,33
0.14
11,21
0.61
13,41
6.09
14,85
2.89
15,96
9.57
19,54
9.46
21,45
0.30
24,50
3.76
24,46
0.63
26,52
1.88
30,89
5.50
34,44
4.92
36,38
3.25
41,74
6.30
45,12
2.86
46,77
1.60
Gove
rnm
ent s
chem
es an
d com
-pu
lsory
cont
ribut
ory h
ealth
care
fin
ancin
g sch
emes
4,581
.315,2
26.00
5,746
.416,9
88.71
7,599
.567,8
40.40
10,52
8.72
11,34
3.37
13,05
0.41
13,56
2.72
14,01
0.55
16,36
2.83
18,49
4.90
19,60
0.51
22,89
3.05
24,00
9.61
23,66
3.45
Gove
rnm
ent s
chem
es4,4
97.38
5,131
.465,6
42.74
6,872
.547,4
60.33
7,683
.8610
,378.0
811
,175.0
212
,913.4
613
,422.9
513
,841.0
216
,167.1
518
,280.5
819
,339.7
222
,583.2
023
,697.1
423
,296.9
5
Com
pulso
ry co
ntrib
utor
y hea
lth
insur
ance
sche
mes
83.94
94.53
103.6
611
6.17
139.2
215
6.54
150.6
416
8.35
136.9
513
9.77
169.5
319
5.68
214.3
226
0.80
309.8
626
0.62
310.2
0
Socia
l hea
lth in
sura
nce s
chem
es83
.9494
.5310
3.66
116.1
713
9.22
156.5
415
0.64
168.3
513
6.95
139.7
716
9.53
195.6
821
4.32
260.8
030
9.86
260.6
231
0.20
Com
pulso
ry M
edica
l Sav
ing
Acco
unts
(CMS
A)0.0
00.0
00.0
00.0
00.0
00.0
00.0
00.0
00.0
00.0
00.0
00.0
00.0
00.0
00.0
051
.8456
.30
Volun
tary
healt
h car
e pay
men
t sc
hem
es1,2
10.29
1,385
.321,5
38.93
1,765
.981,8
57.42
2,010
.792,1
69.04
2,507
.132,7
01.62
2,945
.953,3
52.51
3,677
.414,0
53.61
3,929
.254,1
78.02
5,103
.855,5
23.97
Volun
tary
healt
h ins
uran
ce
sche
mes
594.0
068
3.00
810.7
01,0
70.30
1,175
.301,2
07.10
1,384
.101,5
64.20
1,875
.702,1
69.40
2,477
.902,8
69.10
3,076
.103,2
02.50
3,535
.604,3
52.79
4,737
.51
NPIS
H fin
ancin
g sch
emes
(inclu
d-ing
deve
lopm
ent a
genc
ies)
82.28
90.43
100.5
911
3.85
125.0
214
3.44
155.3
718
0.39
208.3
122
8.70
259.0
630
0.13
348.4
573
.3537
.4967
.2284
.30
Ente
rpris
e fina
ncing
sche
mes
534.0
161
1.88
627.6
558
1.83
557.1
066
0.25
629.5
776
2.54
617.6
154
7.85
615.5
550
8.18
629.0
665
3.40
604.9
368
3.83
702.1
6
Hous
ehold
out-o
f-poc
ket p
aym
ent
4,024
.703,7
18.83
3,925
.274,6
61.40
5,395
.916,1
18.38
6,851
.707,5
99.80
8,751
.737,9
51.96
9,158
.8110
,855.2
511
,896.4
112
,853.4
914
,675.2
316
,009.4
017
,584.1
8
Capit
al he
alth e
xpen
ditur
e1,3
76.00
1,692
.001,6
42.00
2,815
.002,3
30.00
1,270
.001,3
66.00
1,542
.001,7
35.00
2,759
.003,8
65.00
2,195
.002,0
57.00
1,831
.001,5
02.00
1,435
.801,4
22.45
Gros
s Dom
estic
Pro
duct
38
2,731
.0037
8,627
.0041
1,522
.0044
9,706
.0050
9,071
.0056
1,395
.0061
6,344
.0068
7,148
.0079
5,184
.0073
6,221
.0082
1,435
.0091
1,733
.0097
1,251
.001,0
18,61
4.00
1,106
,442.0
01,1
57,72
3.00
1,230
,121.0
0
Final
cons
umpt
ion ex
pend
iture
of
Hous
ehold
s and
profi
t ins
titut
ions
serv
ing ho
useh
olds
166,9
25.00
174,0
72.00
184,6
34.00
199,8
22.00
223,2
64.00
250,7
34.00
276,2
03.00
313,6
09.00
359,3
30.00
363,4
57.00
395,2
45.00
437,3
40.00
482,2
37.00
527,7
49.00
579,9
85.00
626,2
67.00
674,8
38.00
Gene
ral g
over
nmen
t exp
endit
ure
99,49
6.00
108,3
79.00
113,2
90.00
128,0
22.00
133,6
42.00
139,7
11.00
159,8
65.00
180,4
21.00
217,1
05.00
230,6
43.00
221,6
43.00
250,4
77.00
279,7
00.00
286,9
92.00
291,2
79.00
290,8
00.00
286,9
40.00
Purc
hasin
g Pow
er P
arity
(NCU
pe
r Int$
)1.1
91.1
41.1
61.1
81.2
11.2
81.2
91.2
81.4
11.3
31.4
11.4
61.4
51.4
31.4
41.4
21.4
2
Exch
ange
Rat
e (N
CU pe
r US$
)3.8
03.8
03.8
03.8
03.8
03.7
93.6
73.4
43.3
43.5
23.2
23.0
63.0
93.1
53.2
73.9
14.1
5
Gros
s dom
estic
prod
uct -
Pric
e ind
ex72
.9371
.7874
.0276
.4781
.0685
.1688
.5592
.8710
2.52
96.37
100.0
010
5.41
106.4
710
6.65
109.2
810
8.88
111.0
0
Popu
lation
(in th
ousa
nds)
23,18
5.61
23,69
8.91
24,19
8.81
24,68
8.70
25,17
4.11
25,65
9.39
26,14
3.57
26,62
5.85
27,11
1.07
27,60
5.38
28,11
2.29
28,63
5.13
29,17
0.46
29,70
6.72
30,22
8.02
30,72
3.16
31,18
7.27
Popu
lation
<5 -
UN2,6
84.24
2,688
.562,6
64.49
2,622
.022,5
76.08
2,536
.612,4
79.85
2,444
.742,4
28.95
2,425
.942,4
29.27
2,423
.772,4
47.04
2,488
.402,5
33.59
2,569
.35
Fem
ale P
opula
tion 1
5-49
8,570
.358,7
34.61
8,899
.009,0
61.73
9,221
.299,3
77.55
9,550
.559,7
11.05
9,861
.7210
,008.1
710
,155.5
510
,304.1
910
,446.7
210
,582.6
410
,711.0
510
,833.2
4
MALAYSIA NATIONAL HEALTH ACCOUNTS HEALTH EXPENDITURE REPORT 1997-2017 109

Table A4.1: List of Available Data under “Indicators” in NHA GHED Website1. INDICATORS
1.1 AGGREGATES
Current Health Expenditure (CHE) as % Gross Domestic Product (GDP)
Health Capital Expenditure (HK) % Gross Domestic Product (GDP)
Current Health Expenditure (CHE) per Capita in US$
Current Health Expenditure (CHE) per Capita in PPP
1.2 FINANCING SOURCES
Domestic Health Expenditure (DOM) as % of Current Health Expenditure (CHE)
Domestic General Government Health Expenditure (GGHE-D) as % Current Health Expenditure (CHE)
Domestic Private Health Expenditure (PVT-D) as % Current Health Expenditure (CHE)
Voluntary Health Insurance (VHI) as % Current Health Expenditure (CHE)
Out of Pocket (OOPS) as % Current Health Expenditure (CHE)
Other Private Health Expenditure as % Current Health Expenditure
External Health Expenditure (EXT) as % of Current Health Expenditure (CHE)
Domestic General Government Health Expenditure (GGHE-D) as % General Government Expenditure (GGE)
Domestic General Government Health Expenditure (GGHE-D) as % Gross Domestic Product (GDP)
Domestic General Government Health Expenditure (GGHE-D) per Capita in US$
Domestic General Government Health Expenditure (GGHE-D) per Capita in PPP Int$
Domestic Private Health Expenditure (PVT-D) per Capita in US$
Domestic Private Health Expenditure (PVT-D) per Capita in PPP Int$
External Health Expenditure (EXT) per Capita in US$
External Health Expenditure (EXT) per Capita in PPP Int$
Out-of-Pocket Expenditure (OOPS) per Capita in US$
Out-of-Pocket Expenditure (OOPS) per Capita in PPP Int$
1.3 FINANCING SCHEMES
Compulsory Financing Arrangements (CFA) as % of Current Health Expenditure (CHE)
Government Financing Arrangements (GFA) as % of Currrent Health Expenditure (CHE)
Compulsory Health Insurance (CHI) as % of Current Health Expenditure (CHE)
Social Health Insurance (SHI) as % of Current Health Expenditure (CHE)
Voluntary Financing Arrangements (VFA) as % of Current Health Expenditure (CHE)
Voluntary Health Insurance (VHI) as % of Current Health Expenditure (CHE)
Rest of the World (RoW) as % of Current Health Expenditure (CHE)
1.4 PRIMARY HEALTH CARE (preliminary data)
Primary health care (PHC) expenditure per Capita in US$
Primary health care (PHC) expenditure as % of Current Health Expenditure
Domestic General Government Expenditure on primary health care (PHC) as % Domestic General Government Health Expenditure (GGHE-D)
Domestic General Government Expenditure on PHC as % PHC
1.5 CROSS CLASSIFICATIONS
Government Budget Transfers to Social Health Insurance (SHI-G) as % of Social Health Insurance (SHI)
Self-Employed Contributions to Social Health Insurance (SHI-SE) as % of Social Health Insurance Expenditure (SHI)
1.6 MACRO
General Government Expenditure (GGE) as % of Gross Domestic Product (GDP)
Gross Domestic Product (GDP) per Capita in US$
Gross Domestic Product (GDP) per Capita in PPP Int$
110 MALAYSIA NATIONAL HEALTH ACCOUNTS HEALTH EXPENDITURE REPORT 1997-2017

Table A4.2: List of Available Data Under “Health Expenditure Data” in NHA GHED Website 2. HEALTH EXPENDITURE DATA
2.1 REVENUES Current health expenditure by revenues of health care financing schemes
2.1.1 Transfers from government domestic revenue (allocated to health purposes)
2.1.2 Transfers distributed by government from foreign origin
2.1.3 Social insurance contributions
2.1.4 Compulsory prepayment (Other, and unspecified, than FS.3)
2.1.5 Voluntary prepayment
2.1.6 Other domestic revenues n.e.c.
2.1.7 Direct foreign transfers
2.1.8 Unspecified revenues of health care financing schemes (n.e.c.)
2.2 FINANCING SCHEMES Current health expenditure by financing schemes
2.2.1 Government schemes and compulsory contributory health care financing schemes
2.2.2 Voluntary health care payment schemes
2.2.3 Household out-of-pocket payment
2.2.4 Rest of the world financing schemes (non-resident)
2.2.5 Unspecified financing schemes (n.e.c.)
2.3 HEALTH CARE FUNCTIONS (Preliminary Data)
2.3.1 Current health expenditure by health care functions ( preliminary data)
2.3.1.1 Currative Care
2.3.1.2 Rehabilitative Care
2.3.1.3 Long Term Care (health)
2.3.1.4 Ancillary services (specified by function)
2.3.1.5 Medical good (specified by function)
2.3.1.6 Preventive care
2.3.1.7 Governance and Health System, and Financing administration
2.3.1.8 Other Health Care Services not elsewhere classified (n.e.c)
2.3.2 Domestic General Government Helath Expenditure by health care functions ( preliminary data)
2.3.2.1 Domestic General Government Helath Expenditure on Curative Care
2.3.2.2 Domestic General Government Helath Expenditure on Rehabilitative Care
2.3.2.3 Domestic General Government Helath Expenditure on Long-tern Care (health)
2.3.2.4 Domestic General Government Helath Expenditure on Ancillary Services (nonspecific by function)
2.3.2.5 Domestic General Government Helath Expenditure on Medical Goods (nonspecific by function)
2.3.2.6 Domestic General Government Helath Expenditure on Preventive Care
2.3.2.7 Domestic General Government Helath Expenditure on Governance, Health System & Financing Administration
2.3.2.8 Domestic General Government Helath Expenditure on Other Health Care Services (n.e.c)
3. DISEASE AND CONDITION
3.1 Domestic General Government Helath Expenditure by Disease and conditions
3.1 External Sources of Funding by Disease and conditions
4. AGE
4.1 Domestic General Government Helath Expenditure in the <5 years old population
3.1 External Sources of Funding in the <5 years old population
5. CAPITAL EXPENDITURE
MALAYSIA NATIONAL HEALTH ACCOUNTS HEALTH EXPENDITURE REPORT 1997-2017 111

MNHA COMMITTEES AND MEMBERS
1 STEERING COMMITTEE
Joint Chairmanship
Secretary-General, Ministry of Health, Malaysia
Director-General of Health Malaysia
Secretariat
Malaysia National Health Accounts Section, Planning Division, Ministry of Health, Malaysia
Ministry of Health
Deputy Secretary-General (Management)
Deputy Secretary-General (Finance)
Deputy Director-General (Research & Technical Support)
Deputy Director-General (Medical)
Deputy Director-General (Public Health)
Senior Director of Oral Health Division
Senior Director of Pharmaceutical Service Division
Director of Planning Division
Director of Medical Development Division
Director of Medical Practices Division
Director of Family Health Development Division
Director of Disease Control Division, Ministry of Health, Malaysia
Director of Food Safety and Quality Division, Ministry of Health, Malaysia
Chief Executive, Medical Device Authority, Ministry of Health, Malaysia
Undersecretary of Policy and International Relations Division
Senior Deputy Director of Planning Division
Deputy Director of National Health Financing Section, Planning Division
Other Ministries and Statutory Bodies
Secretary-General, Ministry of Finance
Secretary-General, Ministry of Human Resource
Secretary-General, Ministry of Defence
Secretary-General, Ministry of Higher Education
Director-General, Economic Planning Unit, Prime Minister’s Department
Director-General, Public Private Partnership Unit (UKAS), Prime Minister’s Department
Governor, Central Bank of Malaysia
Accountant-General of Malaysia, National Accountant Department
Deputy Director-General of Civil Service (Development), Civil Service Department
Chief Statistician of Malaysia, Department of Statistics
112 MALAYSIA NATIONAL HEALTH ACCOUNTS HEALTH EXPENDITURE REPORT 1997-2017
Undersecretary, Prison, Anti-Drug and Civil Defence Division, Ministry of Home Affairs
Chief Executive Officer, Performance Management and Delivery Unit (PEMANDU),
Prime Minister’s Department
Chief Executive Officer, Employees Provident Fund
Chief Executive Officer, Social Security Organization
Other Professional Associations
President, Malaysian Employers Federation
President, Association of Private Hospitals of Malaysia
President, Malaysian Medical Association
General Manager, IQ VIA (IMS)
President, Malaysian Dental Association
President, Malaysia Medical Device Association
President, Federation of Malaysian Consumers Associations (FOMCA)
2 MNHA Technical Advisory Committees Advisor: Deputy Director-General of Health (Research & Technical Support)
Chairperson: Director of Planning Division
Deputy Chairperson: Senior Deputy Director, Planning Division
Secretary: Deputy Director, MNHA Section, Planning Division
Ordinary Members
Accounts Division
Disease Control Division
Family Health Development Division
Finance Division
Health Informatics Centre, Planning Division
Health Policy and Plan Planning Section, Planning Division
Medical Development Division
Medical Practice Division
Oral Health Division
Pharmaceutical Services Division
Policy and International Relations Division
Public Health Development Division
Section for National Health Financing, Planning Division
Institute of Health System Research
3 MNHA SECRETARIAT Permanent staff
Dr. Jameela binti Zainuddin
Dr. Noryati binti Yusof @ Atan
Dr. Maizura binti Musa
Dr. Premila Devi a/p Jeganathan
Dr. Mohamad Kairul Aneeza bin Zakaria
MALAYSIA NATIONAL HEALTH ACCOUNTS HEALTH EXPENDITURE REPORT 1997-2017 113

Dr. Vikneswaran Sabramani
Dr. Hazwani binti Halim
Dr. Nur Farhana binti Mohd Rashidi
Dr. Anegala a/p Periana Kovindear
Dr. Diyana binti Sabri
Pn. Nur Syazana binti Mad Tahir
Pn. Fazlina Suriayanti binti Fazil
Pn. Kamsiah binti Hj. Nawi
KJ Radin Nor’adriana binti Radin Tahir
En. Muhd Azwan bin Anuar
KJ Noor Kamielia binti Kamarudin
Pn. Nurlinda binti Ahmad Razimi
Pn. Hartini binti Mohamad
En. Hishamudden bin Alias
Pn. Noriza binti Ab Rahman
Pn. Fhaziatulhanim binti Tajuddin
Cik Zurina binti Bulee
Pn. Siti Nadiah binti Arifin
Pn. Norazuin binti Jamaludin
Pn. Fatimah binti Md Zain
Temporary staff
Pn. Syuzita binti Salehudin
En. Mohd Akid Aizuddin bin Othman
En. Mohd Norazam bin Bidin
4 AUTHORS
Dr. Jameela binti Zainuddin (Deputy Director of MNHA)
Dr. Noryati binti Yusof @ Atan
Dr. Hazwani binti Halim
Dr. Nur Farhana binti Mohd Rashidi
Dr. Anegala a/p Periana Kovindear
Pn. Nur Syazana binti Mad Tahir
En. Hishamudden bin Alias
5 EXTERNAL EDITORIAL COMMITTEE MEMBERS Dr. Nordin bin Saleh (Director of Palnning Division)
Dr. Nuraidah binti Mohd Marzuki (Chief Editor)
Dr. Nor Zam Azihan bin Mohd Hassan
Dr. Malar Velli a/p Segarmurthy
Dr. Noramalina binti Jaafar
114 MALAYSIA NATIONAL HEALTH ACCOUNTS HEALTH EXPENDITURE REPORT 1997-2017

MNHA
HEALTH EXPENDITURE REPORT 1997- 2017
MNHA
MNHA
MALAYSIANATIONALH E A L T HACCOUNTS
HEALTH EXPENDITURE REPORT
1997- 2017
MA
LA
YS
IA N
AT
ION
AL
HE
ALT
H A
CC
OU
NT
SH
EA
LTH E
XP
EN
DIT
UR
E R
EP
OR
T 199
7- 20
17
ISSN 1985-711X