Health and Well-Being Touchstone Survey Results & Well-being Touchstone Survery results PwC This...
63
Health and Well-Being Touchstone Survey Results May 2012 www.pwc.com
-
Upload
hoangkhuong -
Category
Documents
-
view
220 -
download
3
Transcript of Health and Well-Being Touchstone Survey Results & Well-being Touchstone Survery results PwC This...

Health and Well-Being Touchstone Survey Results
May 2012
www.pwc.com

Health & Well-being Touchstone Survery results PwC
This document is for general information purposes only, and should not be used as a substitute for consultation with professional advisors.
OverviewSection 1 – Key trends 3
Section 2 – Summary of findings 4
Detailed findingsSection 3 – Medical plan costs 7
Section 4 – Medical plan design highlights 11
Section 5 – Wellness and disease management 28
Section 6 – Welfare benefits 36
Section 7 – Retiree medical 40
Section 8 – Retirement plans 43
Section 9 – Health reform—Patient Protection and Affordable Care Act (PPACA) 50
Section 10 – Future solutions 57
AppendixSection 11 – Summary of survey participants 60
ContactsPwC contacts 63

• The average reported trend in medical plan costs before plan changes in 2011 was 8.1% and is projected to decrease to 7.0% in 2012. Almost half of employers responding had gross costs per employee over $10,000 and net costs per employee over $8,000.
• Employee contributions as a percentage of premiums have started to creep up again in 2012 after remaining largely flat in 2011.
• Plan design features with the most significant changes in 2012 were in-network deductibles, emergency room copays, and prescription drug copays.
• Enrollment in high deductible plans continues to rise, albeit more slowly. There was a slight shift towards HSA based plans from HRA based plans, the most significant increase in average high deductible health plan enrollment was with HRA based plans (increased from 37.9% to 43.2% in 2012).
• Almost three in four employers continue to offer wellness programs while the percentage of employers offering disease management programs decreased significantly from 66% to 58%. Only 12% of employers are able to measure an ROI for wellness and disease management programs.
• Nine in ten employers indicate an increase in compliance/administrative burdens due to health reform but a small minority of employers reported a significant financial impact.
• While satisfaction with vendors remains high, the percent reporting very satisfied has declined significantly. Satisfaction is lowest related to wellness and consumer/decision support.
Overview Section 1: Key trends
12%
Percentage of employers able to measure ROI for wellness and disease management programs

Overview Section 2: Summary of findingsBackground
• The survey was completed in the first quarterof 2012
• The survey data contains detailed benefitsinformation provided by approximately 1,400participating companies in 34 different industriesacross the nation
• The 2012 survey provides summary data onmedical and prescription drug plan design, costs,COBRA rates, wellness and disease managementprograms, work-life programs, fringe benefits,future healthcare strategies, retirement benefits,and health reform
• Customized reports are available upon requestbased on industry, size and geographic location
Medical plan costs continue to increase faster than inflation
• The average reported increase in medical plancosts before plan changes was 8.1% in 2011;however, it is expected to be 7.0% in 2012
— The average reported increases after planchanges were 5.9% and 5.1% respectively
• 44% of survey participants have gross costsgreater than $10,000 per employee per year (upfrom 35% last year and 25% in 2010)
• 45% of survey participants have net costs greaterthan $8,000 per employee per year (up from 38%last year and 28% in 2010)
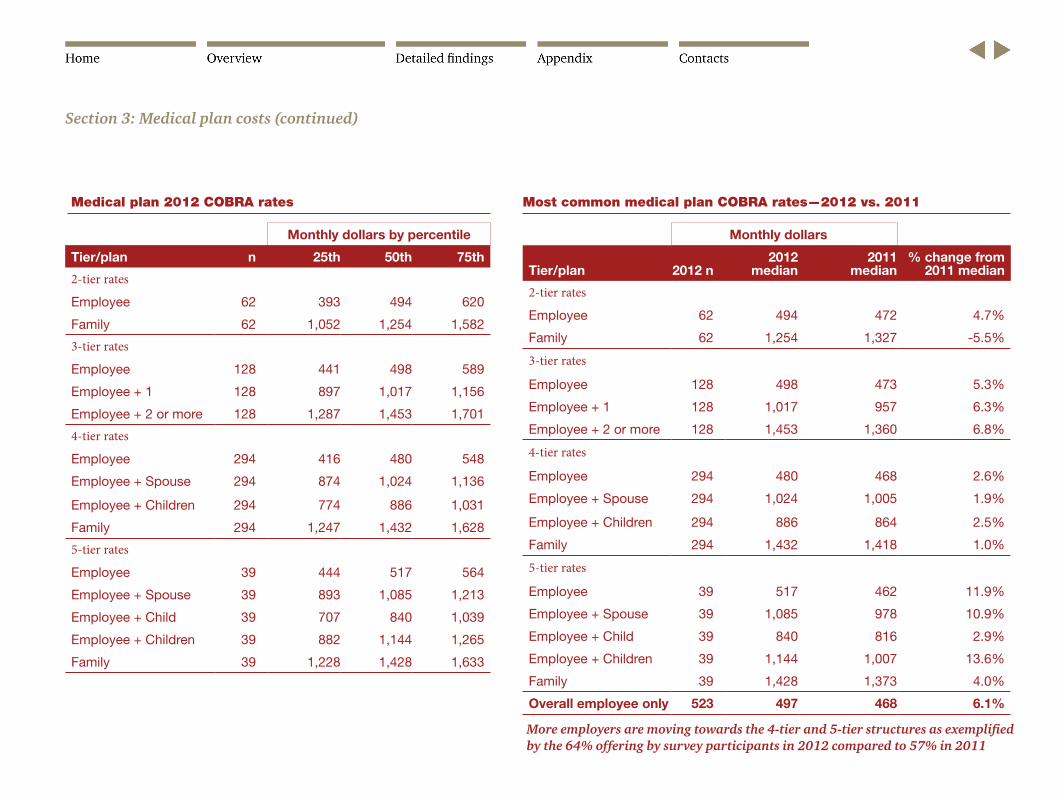
• The overall median COBRA rate for employee onlycoverage increased by 6.1% from $468 in 2011 to$497 in 2012
— A higher percentage of employers are utilizing4-tier and 5-tier rate structures (57% in 2011 increased to 64% in 2012) to be more responsive to dependent participation patterns
Employee contributions as a percent of premium increased in 2012
• 31% of employees (up from 25% in 2011)contribute 25% or more for employee coveragewhile 48% of employees (up from 46% in 2011)contribute 25% or more for dependent coverage
• 10% of employees (up from 5% in 2011)contribute 35% or more for employee coveragewhile 20% of employees (up from 16% in 2011)contribute 35% or more for dependent coverage
Medical plan features • Approximately half of employers offer three ormore medical plan options
• 57% have the highest enrollment in PPO plans
• In-network features — 51% have a deductible of $400 or more (upfrom 31% in 2009)
>Highest for insurance, manufacturing, services, and technology industries
— 50% have out-of-pocket maximums (excluding
deductibles) greater than $2,000 — 37% have coinsurance of 20% or more for most services
— 45% have a copay between $20 – $29 for primary care office visits
— 45% have a copay over $30 for specialist office visits
— 28% have an emergency room copay of $125 or more (up from 9% in 2008)
• Out-of-network features — 49% have a deductible between $500 and$2,000
— 41% have out-of-pocket maximums (excluding deductibles) of $4,000 or greater and 14% unlimited
— 37% have a coinsurance of 40% or more
44%of survey participants have gross costs greater than $10,000 per employee per year (up from 35% last year and 25% in 2010)

High Deductible Health Plans (HDHPs)
• 40% offer HDHP with HSA (up from 38%), 17%offer an HDHP with HRA (down from 19%)
• For those that offer an HDHP with an HSA: — Reported average enrollment remainedrelatively constant from last year
— 30% of employers do not fund the HSA while 54% fund by less than $1,000 a year
— Most common deductible was between $2,000 – $2,999 for both in-network (35%) and out-of-network (26%)
— Most common in-network out-of-pocket maximum (excluding deductible) was between $2,000 – $2,999 (29%), and an out-of-network of $10,000 or greater (24%)
• For those that offer an HDHP with an HRA: — Reported average enrollment has steadilyincreased from 34.2% in 2010 to 43.2% in 2012
— 69% of employers establish an allowance of less than $1,000 a year
— Most indicated a deductible between $1,000 – $1,999 for in-network (57%) and out-of-network (35%)
— Most indicated an in-network out-of-pocket maximum (excluding deductible) between $2,000 – $2,999 (26%), and an out-of-network between $5,000 – $7,499 (22%)
Prescription drug benefits • Rx benefits typically do not have a deductible
— 77% indicated that a deductible was notapplicable
— When a deductible was applied, 68% apply the deductible to all drugs including generics and preventive
• Copays remained the most common cost sharingmethod (fewer using coinsurance)
— Retail Generics: 82% use copays, 16% havecoinsurance (vs. 79%/19% in 2011)
— Retail Brand: 72% use copays, 26% have coinsurance (vs. 68%/29% in 2011)
— Retail Brand Non-Formulary: 68% use copays, 28% have coinsurance (vs. 63%/31% in 2011)
• The average copays for retail prescription drugbenefits are $10/$30/$50
— 53% have the same copay for specialty drugsas retail brand
• Most common management programs were priorauthorization (44%), step therapy (41%), andmandatory generic substitution (31%)
Wellness and disease management • 72% offer wellness programs
— Most common elements were EAP (84%),health risk assessments (80%), biometric screening (71%), tobacco cessation (67%), and weight management (56%)
• 58% offer disease management programs (downfrom 68% in 2010)
— Most common programs were related todiabetes (63%), cardiac (56%), asthma (54%), and cancer (39%)
• 88% either do not have sufficient data to calculateor do not measure a return on investment for bothwellness and disease management programs
• About seven in ten employers offer wellnessincentives for completion of health riskquestionnaires and biometric screening while lessthan 20% use incentives for disease managementprograms
— Annual premium incentives are most commonfor wellness programs, while cash and gift cards are the most common incentives for disease management programs
— Participation in certain wellness programs was much greater when incentives were offered:
> Health Risk Questionnaire: 48% participation with incentives, 34% participation without
> Biometric: 51% participation with incentives, 29% participation without
> Onsite Health Clinic: 62% participation with incentives, 36% participation without
Overview Section 2: Summary of findings (continued)

Self-insurance and stop loss • Self-insurance is most prevalent for largeremployers
— 49% of employers with 500 – 1,000 employeesare self-insured
— 22% of employers with less than 500 employees are self-insured
• 66% of those self-insured survey participants donot have aggregate stop loss coverage while only30% do not have specific stop loss
— The smaller the employer, the more likely theemployer is to purchase aggregate or specific stop loss
— The most common specific/individual stop loss coverage is between $250,000 – $499,999 (27%) for self-insured survey participants who elect to have coverage
Retiree medical programs • 46% of employers provide Pre-65 retiree medicalprograms, while 42% provide Post-65
• 69% do not provide Pre-65 retiree medical to newhires, compared to 77% for Post-65 coverage
• 42% have implemented/are considering movingPre-65 retirees to a private exchange, and amongthem, 85% have implemented/are consideringsubsidizing
• 47% have implemented/are considering movingPost-65 retirees to a private exchange, and amongthem, 84% have implemented/are consideringsubsidizing
Overview Section 2: Summary of findings (continued)
401(k) plans are the most prevalent form of retirement program
• 95% of employers offer 401(k) plans — 41% vest 401(k) contributions immediately,down from 47% in 2011
— 52% provide a default 401(k) employee contribution percentage – typically 3%
• 33% of employers offer a defined benefit planwith 47% of those plans closed to new accrualsor closed to new employees
Traditional paid time off (PTO) systems are most common
• 56% of employers offer a traditional PTO system,which averages to be 11 sick days and 17 vacationdays annually for full-time employees with 5 ormore years of tenure
— 86% offer new hires the same amount ofsick days and 24% offer the same amount of vacation days
— Of those who do implement a PTO bank benefit, on average, full-time employees with 5 or more years of tenure are given 23 days and new hires receive 17 days
— PTO policies typically vary by tenure (85%) and hours worked (74%)
Work/Life programs remain common for many survey participants
• The most common work life programs includedtelecommuting (55%), flexible schedules (46%),parental leave (36%), reduced hours (31%), andcommunity service time (26%)
Future solutions • 88% have already implemented/are consideringexpanding or improving wellness programs insidethe US (27% outside the US)
• 88% have already implemented/are consideringimplementing an increase in employeecontributions
95%of employers offer 401(k) plans

Detailed findings Section 3: Medical plan costs
Gross spend per active employee
2012 2011 2010 2009
< $4,000 7% 7% 6% 6%
$4,000 – $4,999 4% 5% 5% 8%
$5,000 – $5,999 5% 7% 7% 7%
$6,000 – $6,999 7% 11% 12% 13%
$7,000 – $7,999 10% 12% 16% 15%
$8,000 – $8,999 12% 13% 16% 15%
$9,000 – $9,999 11% 10% 13% 10%
$10,000 – $10,999 13% 13%
25% 26%
$11,000 – $11,999 8% 5%
$12,000 – $12,999 7%
17% $13,000 – $13,999 4%
$14,000 – $14,999 3%
$15,000 + 9%
Average gross spend $9,500 $8,700
Net spend per active employee
2012 2011 2010 2009
< $2,000 6% 8%
14% 18%$2,000 – $2,999 4% 3%
$3,000 – $3,999 4% 4%
$4,000 – $4,999 8% 10% 11% 13%
$5,000 – $5,999 7% 11% 15% 13%
$6,000 – $6,999 13% 15% 16% 13%
$7,000 – $7,999 13% 11% 16% 15%
$8,000 – $8,999 14% 15% 11% 10%
$9,000 – $9,999 9% 7% 5% 6%
$10,000 – $10,999 8% 6%
12% 12% $11,000 – $11,999 3% 2%
$12,000 + 11% 8%
Average net spend $7,550 $7,150
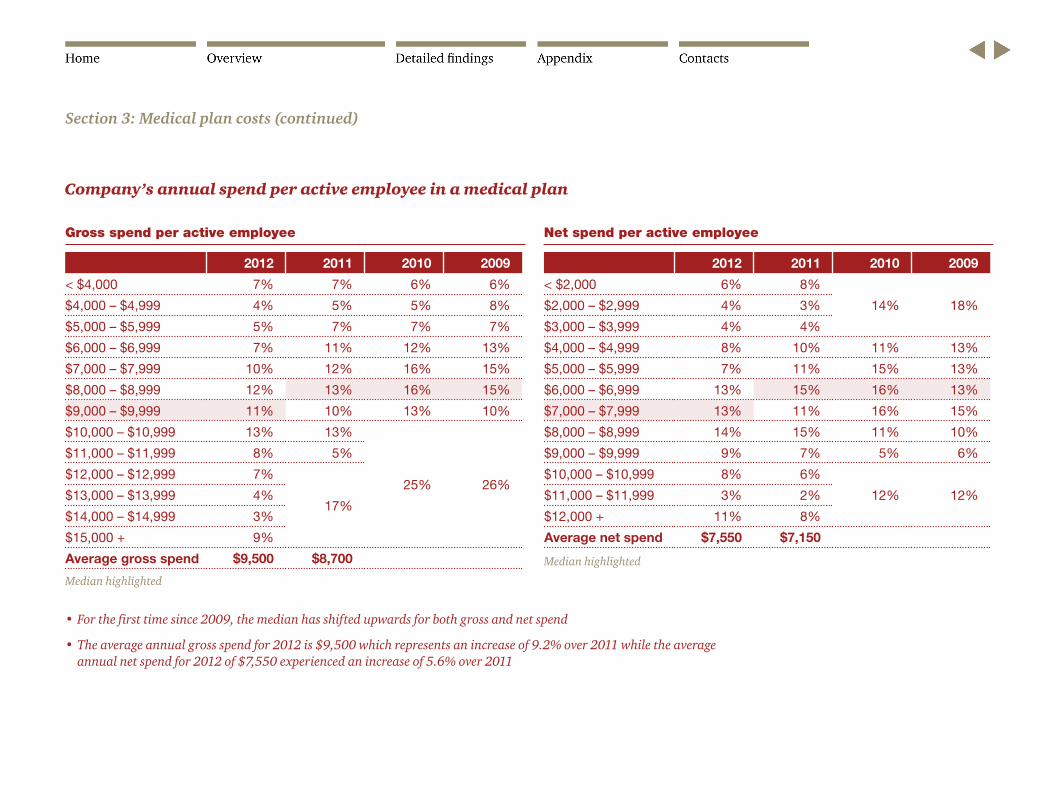
• For the first time since 2009, the median has shifted upwards for both gross and net spend
• The average annual gross spend for 2012 is $9,500 which represents an increase of 9.2% over 2011 while the averageannual net spend for 2012 of $7,550 experienced an increase of 5.6% over 2011
Median highlighted
Median highlighted
Company’s annual spend per active employee in a medical plan
Section 3: Medical plan costs (continued)

Before plan changes
Expected calendar year
2012 over 2011 Calendar year
2011 over 2010
Decrease 6% 10%
Unchanged 7% 4%
1% – 4% increase 17% 11%
5% – 9% increase 42% 38%
10% – 14% increase 21% 23%
15% or greater increase 7% 14%
Average 7.0% increase 8.1% increase
After plan changes
Expected calendar year
2012 over 2011 Calendar year
2011 over 2010
Decrease 8% 12%
Unchanged 10% 6%
1% – 4% increase 24% 19%
5% – 9% increase 40% 39%
10% – 14% increase 13% 16%
15% or greater increase 5% 8%
Average 5.1% increase 5.9% increase
Medical plan cost increases/decreases before/after plan change
Median highlighted Median highlighted
Section 3: Medical plan costs (continued)
Medical plan 2012 COBRA rates
Monthly dollars by percentile
Tier/plan n 25th 50th 75th
2-tier rates
Employee 62 393 494 620
Family 62 1,052 1,254 1,582
3-tier rates
Employee 128 441 498 589
Employee + 1 128 897 1,017 1,156
Employee + 2 or more 128 1,287 1,453 1,701
4-tier rates
Employee 294 416 480 548
Employee + Spouse 294 874 1,024 1,136
Employee + Children 294 774 886 1,031
Family 294 1,247 1,432 1,628
5-tier rates
Employee 39 444 517 564
Employee + Spouse 39 893 1,085 1,213
Employee + Child 39 707 840 1,039
Employee + Children 39 882 1,144 1,265
Family 39 1,228 1,428 1,633
Most common medical plan COBRA rates—2012 vs. 2011
Monthly dollars
Tier/plan 2012 n2012
median 2011
median% change from
2011 median
2-tier rates
Employee 62 494 472 4.7%
Family 62 1,254 1,327 -5.5%
3-tier rates
Employee 128 498 473 5.3%
Employee + 1 128 1,017 957 6.3%
Employee + 2 or more 128 1,453 1,360 6.8%
4-tier rates
Employee 294 480 468 2.6%
Employee + Spouse 294 1,024 1,005 1.9%
Employee + Children 294 886 864 2.5%
Family 294 1,432 1,418 1.0%
5-tier rates
Employee 39 517 462 11.9%
Employee + Spouse 39 1,085 978 10.9%
Employee + Child 39 840 816 2.9%
Employee + Children 39 1,144 1,007 13.6%
Family 39 1,428 1,373 4.0%
Overall employee only 523 497 468 6.1%
More employers are moving towards the 4-tier and 5-tier structures as exemplified by the 64% offering by survey participants in 2012 compared to 57% in 2011
Section 3: Medical plan costs (continued)

Detailed findings Section 4: Medical plan design highlights

Most common medical plan features by plan type
PPO POS High deductible HMO EPO
% selected as highest enrolled plan 57% 8% 17% 13% 4%
EE contributions
Employees 20% – 24% 20% – 24% 20% – 24% 20% – 24% 20% – 24%
Dependents 20% – 24% 25% – 29% 20% – 24% 20% – 24% 20% – 24%
In-network
Deductible $500 – $749 Not Applicable $1,000 – $1,999 Not applicable Not applicable
Out-of-pocket max (exc. deductible) $2,000 – $2,999 $1,000 – $2,999 $2,000 – $2,999 $1,000 – $1,999 $1,000 – $1,999
Coinsurance 20% – 24% Not Applicable 20% – 24% Not Applicable 10% – 14%
Primary care office visit $20 – $24 copay $20 – $24 copay Coinsurance $20 – $24 copay $25 – $29 copay
Specialist care office visit Coinsurance $40 – $49 copay Coinsurance $20 – $24 copay $40 – $49 copay
Max hospital copay (per admit) Coinsurance only $0 Coinsurance only $0 $200 – $399
Emergency room visit $100 – $124 $100 – $124 Coinsurance only $100 – $124 $100 – $124
Out-of-network
Deductible $1,000 – $1,999 $1,000 – $1,999 $1,000 – $1,999 Not applicable Not applicable
Out-of-pocket max (exc. deductible) $5,000 – $7,499 $5,000 – $7,499 $5,000 – $7,499 Not applicable Not applicable
Coinsurance 40% – 49% 30% – 39% 40% – 49% Not applicable Not applicable
Section 4: Medical plan design highlights (continued)

Most common medical plan features by plan type
PPO POS High Deductible HMO EPO
Deductible Not applicable Not applicable Applies to medical deductible
Not applicable Not applicable
Retail (30-day supply)
Generic $10 – $14 copay $10 – $14 copay $10 – $14 copay $10 – $14 copay $10 – $14 copay
Brand “formulary” $30 – $34 copay $30 – $34 copay 20% – 24% coinsurance
$30 – $34 copay $30 – $34 copay; or, 30% – 34%
coinsurance
Brand “non-formulary” $50 – $54 copay $50 – $54 copay 50% + coinsurance $50 – $54 copay $50 – $54 copay
Specialty $50 – $59 copay $50 – $59 copay Not Covered $40 – $49 copay $50 – $59 copay
Mail (90-day supply)
2x's retail copays 2x's retail copays 2x's retail copays 2x's retail copays 2x's retail copays
• Generally prescription drug deductible applies to all drugs, except for EPO plan types where it excludes either preventive or generic drugs
• Most prescription drug plans are copay-based rather than coinsurance based
Section 4: Medical plan design highlights (continued)

Number of medical plan options Contribution percentages
Employee-only coverage 2012 2011 2010 2009 2008
Less than 10% contribution 16% 17% 14% 18% 17%
10% – 14% 11% 12% 11% 11% 12%
15% – 19% 15% 19% 18% 16% 19%
20% – 24% 27% 27% 24% 27% 28%
25% – 29% 13% 14% 16% 16% 12%
30% – 34% 8% 6% 8% 8% 7%
Greater than 34% contribution 10% 5% 9% 4% 5%
Dependent coverage 2012 2011 2010 2009 2008
Less than 10% contribution 7% 8% 7% 9% 11%
10% – 14% 7% 8% 7% 7% 9%
15% – 19% 11% 15% 16% 14% 15%
20% – 24% 27% 23% 24% 27% 29%
25% – 29% 17% 18% 19% 18% 14%
30% – 34% 11% 12% 13% 11% 12%
Greater than 34% contribution 20% 16% 14% 14% 10%
Cost shifting to employees is evident as survey participants who choose “greater than 34% contribution” for employee-only coverage has increased from 5% in 2011 to 10% in 2012 and dependent coverage has increased 10% from 2008 to 20% in 2012
76%
of employers offer more than one medical plan option to their employees, and approximately half of employers offer three or more medical plan options
0%
5%
10%
15%
20%
25%
30%
0 1 2 3 4 5 6 7 8 9 10 +
Median highlighted
Section 4: Medical plan design highlights (continued)

Employee-only coverage
Contribution < 1,000 employees
1,000 – 5,000 employees
5,000 + employees
< 10% 27% 9% 11%
10% – 14% 12% 14% 8%
15% – 19% 11% 17% 17%
20% – 24% 21% 32% 30%
25% – 29% 12% 10% 18%
30% – 34% 5% 8% 9%
34% + 12% 10% 7%
Contribution percentages vary by company size
Dependent coverage
Contribution < 1,000 employees
1,000 – 5,000 employees
5,000 + employees
< 10% 13% 4% 6%
10% – 14% 8% 6% 6%
15% – 19% 8% 12% 13%
20% – 24% 19% 33% 29%
25% – 29% 15% 15% 22%
30% – 34% 9% 13% 11%
35% – 39% 2% 3% 6%
40% – 49% 6% 4% 1%
50% – 74% 10% 7% 3%
75% + 10% 3% 3%
Median highlighted
Median highlighted
Compared to 2011, the employee only contribution for companies with less than 1,000 employees has increased from 15% – 19% to 20% – 24% in 2012 and the dependent contribution for the same size has increased from 20% – 24% to 25% – 29%
Section 4: Medical plan design highlights (continued)

Section 4: Medical plan design highlights (continued)
Medical plans with highest enrollment
2012 2011 2010 2009 2008
PPO plan 57% 57% 63% 60% 58%
HMO plan 13% 12% 9% 14% 13%
POS plan 8% 7% 10% 9% 10%
High deductible plan 17% 17% 13% 8% 6%
Indemnity 1% 1% 1%
9% 13% EPO 4% 6% 4%
All other plans 0% 0% 0%
Survey participants selected the following plans as those with the highest enrollment:
58%
For the medical plan selected by survey participants as having the highest enrollment for 2012,
stated that 70% or greater are enrolled in that plan

Section 4: Medical plan design highlights (continued)
Medical plan in-network features (deductible) For the medical plan selected as having the highest enrollment, the following is the historical and industry breakdown, respectively, of the deductible medical feature:
2012 2011 2010 2009 2008
Not applicable 21% 22% 24% 31% 32%
< $200 8% 8% 8% 11% 13%
$200 – $399 20% 23% 25% 27% 30%
$400 – $999 29% 25% 27% 20% 17%
$1,000 + 22% 22% 16% 11% 8%
Education & Other Nonprofit
Energy, Utilities, &
Mining Financial Services
Health Industries Insurance Manufacturing Services Technology
Not applicable 39% 15% 32% 26% 20% 15% 24% 18%
< $200 16% 4% 7% 8% 4% 5% 9% 5%
$200 – $299 8% 27% 8% 7% 9% 13% 3% 9%
$300 – $399 5% 15% 7% 7% 9% 7% 9% 11%
$400 – $499 0% 4% 8% 6% 4% 6% 0% 3%
$500 – $749 13% 9% 15% 17% 22% 28% 16% 24%
$750 – $999 5% 13% 3% 5% 0% 5% 6% 2%
$1,000 – $1,999 8% 4% 5% 17% 18% 14% 24% 17%
$2,000 – $2,999 3% 7% 10% 5% 5% 5% 6% 9%
$3,000 – $3,999 0% 2% 3% 2% 9% 1% 3% 2%
$4,000 + 3% 0% 2% 0% 0% 1% 0% 0%

Section 4: Medical plan design highlights (continued)
Medical plan in-network features (out-of-pocket maximum) For the medical plan selected as having the highest enrollment, the following is the historical and industry breakdown, respectively, of the out-of-pocket maximum (excluding deductible) medical feature:
2012 2011 2010 2009 2008
Unlimited 10% 9% 11% 13% 18%
< $1,000 13% 10% 10% 11% 11%
$1,000 – $1,999 27% 27% 28% 34% 30%
$2,000 – $2,999 27% 27% 29% 22% 24%
$3,000 + 23% 27% 22% 20% 17%
Education & Other Nonprofit
Energy, Utilities, &
Mining Financial Services
Health Industries Insurance Manufacturing Services Technology
Unlimited 21% 7% 12% 11% 11% 11% 3% 3%
< $1,000 13% 17% 20% 9% 9% 8% 12% 11%
$1,000 – $1,999 24% 26% 26% 31% 34% 30% 27% 31%
$2,000 – $2,999 26% 31% 22% 28% 22% 26% 31% 24%
$3,000 – $3,999 5% 13% 5% 12% 15% 17% 15% 14%
$4,000 – $4,999 3% 0% 8% 3% 2% 3% 0% 11%
$5,000 – $7,499 5% 4% 7% 6% 7% 3% 12% 6%
$7,500 – $9,999 0% 2% 0% 0% 0% 0% 0% 0%
$10,000 + 3% 0% 0% 0% 0% 2% 0% 0%
Section 4: Medical plan design highlights (continued)
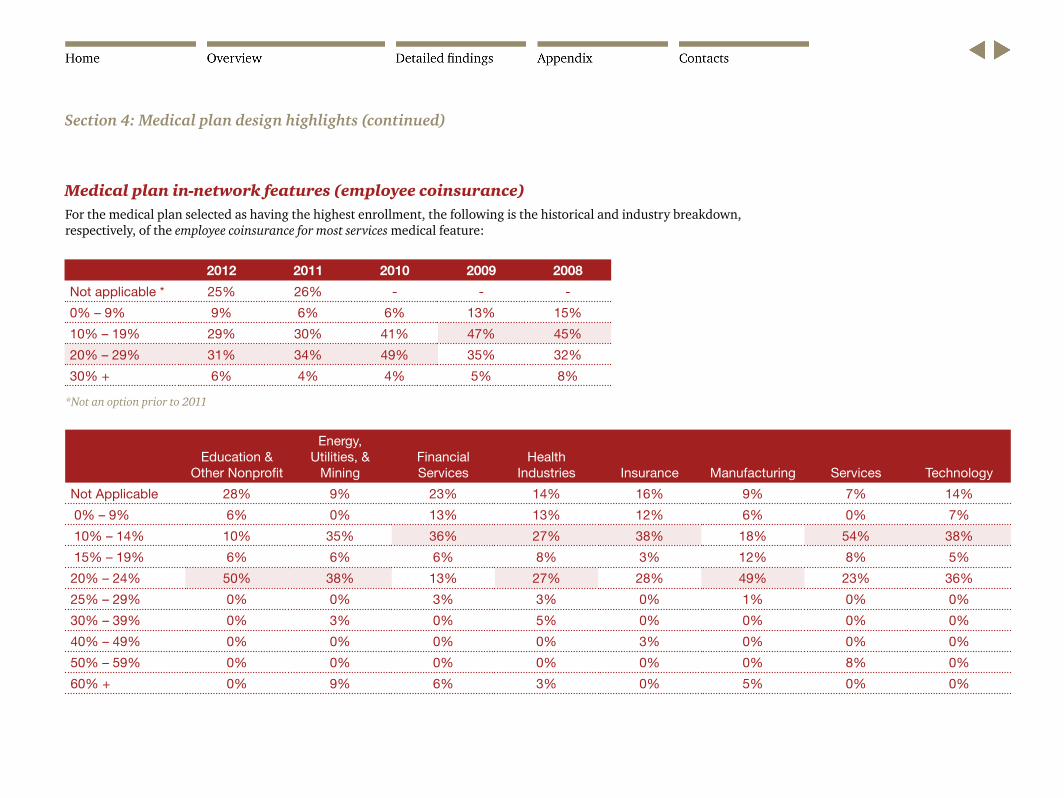
Medical plan in-network features (employee coinsurance) For the medical plan selected as having the highest enrollment, the following is the historical and industry breakdown, respectively, of the employee coinsurance for most services medical feature:
2012 2011 2010 2009 2008
Not applicable * 25% 26% - - -
0% – 9% 9% 6% 6% 13% 15%
10% – 19% 29% 30% 41% 47% 45%
20% – 29% 31% 34% 49% 35% 32%
30% + 6% 4% 4% 5% 8%
Education & Other Nonprofit
Energy, Utilities, &
Mining Financial Services
Health Industries Insurance Manufacturing Services Technology
Not Applicable 28% 9% 23% 14% 16% 9% 7% 14%
0% – 9% 6% 0% 13% 13% 12% 6% 0% 7%
10% – 14% 10% 35% 36% 27% 38% 18% 54% 38%
15% – 19% 6% 6% 6% 8% 3% 12% 8% 5%
20% – 24% 50% 38% 13% 27% 28% 49% 23% 36%
25% – 29% 0% 0% 3% 3% 0% 1% 0% 0%
30% – 39% 0% 3% 0% 5% 0% 0% 0% 0%
40% – 49% 0% 0% 0% 0% 3% 0% 0% 0%
50% – 59% 0% 0% 0% 0% 0% 0% 8% 0%
60% + 0% 9% 6% 3% 0% 5% 0% 0%
*Not an option prior to 2011

Section 4: Medical plan design highlights (continued)
Medical plan in-network features (office visits) For the medical plan selected as having the highest enrollment, the following is the breakdown of the medical features:
2012 2011 2010 2009
Not applicable (free visit) 6% 7% 6% 8%
< $10 copay 1% 1% 1% 2%
$10 – $19 copay 16% 17% 20% 26%
$20 – $29 copay 45% 45% 47% 46%
$30 or greater copay 13% 12% 8% 6%
Coinsurance applies 19% 18% 18% 12%
Primary care office visit
2012 2011 2010 2009
Not applicable (free visit) 4% 5% 3% 9%
< $19 copay 7% 10% 10% 14%
$20 – $29 copay 22% 20% 26% 31%
$30 or greater copay 45% 43% 38% 31%
Coinsurance applies 22% 22% 23% 15%
Specialist office visit
47%
of survey participants have the same specialist office financing feature as primary care
Medical plan in-network features (hospital and ER)For the medical plan selected as having the highest enrollment, the following is the breakdown of the medical features:
2012 2011 2010 2009
$0 copay * 20% 16% - -
< $200 copay 11% 13% 12% 32%
$200 – $399 copay 16% 17% 24% 21%
$400 or greater copay 12% 12% 11% 10%
Coinsurance only 41% 42% 53% 37%
Maximum hospital copay per admission
2012 2011 2010 2009
$0 copay * 5% 5% - -
< $50 copay 2% 3% 2% 12%
$50 – $100 copay 17% 21% 26% 29%
$100 – $124 copay 27% 26% 30% 30%
$125 or greater copay 28% 23% 19% 12%
Coinsurance only 21% 22% 23% 17%
Emergency room copay
*Not an option prior to 2011

Section 4: Medical plan design highlights (continued)
Medical plan out-of-network featuresFor the medical plan selected as having the highest enrollment, the following is the breakdown of the medical features:
2012 2011 2010 2009 2008
Not applicable 17% 18% 17% 22% 17%
< $200 3% 2% 7% 7% 5%
$200 – $499 12% 13% 19% 21% 25%
$500 – $999 25% 23% 28% 30% 32%
$1,000 – $1,999 24% 23% 17% 20% 21%
$2,000 + 19% 21% 12%
Deductible
2012 2011 2010 2009 2008
Unlimited 14% 12% 11% 13% 14%
< $1,000 4% 5% 5% 19% 7%
$1,000 – $2,999 26% 21% 25% 31% 25%
$3,000 – $4,999 27% 29% 26% 27% 32%
$5,000 – $7,499 17% 20% 21%10% 22%
$7,500 + 12% 13% 12%
Out-of-pocket maximum (excluding deductible)
2012 2011 2010 2009 2008
Not applicable * 18% 20% - - -
0% – 19% 6% 7% 6% 12% 6%
20% – 29% 17% 16% 19% 23% 23%
30% – 39% 22% 23% 28% 30% 31%
40% – 49% 23% 23% 29% 35% 40%
50% + 14% 11% 18%
Employee coinsurance for most services
*Not an option prior to 2011

Section 4: Medical plan design highlights (continued)
77%
of participating employers do not have a prescription drug deductible
In-network prescription drug deductible
77%
12%
5%
4% 2%
N/A
Applies to medical deductible
< $100
$100 - $149
$150 +
2012
Applies to all drugs 68%
Applies to all drugs except preventive 13%
Applies to all drugs except generics 19%
If offered, what is the application of the prescription drug deductible?
In-network prescription drug plan features
For the medical plan selected as having the highest enrollment, the following is the breakdown of the medical features:
2012 2011 2010 2009 2008
Not covered * 2% 2% 1% 2% -
< $5 copay 4% 6% 3% 3% 3%
$5 – $9 copay 17% 15% 19% 18% 18%
$10 – $14 copay 42% 43% 43% 43% 53%
$15 or greater copay 19% 15% 15% 15% 11%
Coinsurance 16% 19% 19% 19% 12%
Generic 30-day supply
2012 2011 2010 2009 2008
Not covered * 2% 3% 1% 3% -
< $19 copay 6% 6% 5% 8% 9%
$20 – $29 copay 28% 32% 36% 37% 46%
$30 or greater copay 38% 30% 25% 24% 17%
< 15% coinsurance 2% 2% 2% 2% 3%
15% – 34% coinsurance 21% 22% 27% 24% 20%
35% or greater coinsurance 3% 5% 4% 2% 3%
Brand “formulary” 30-day supply
*Not an option in 2008
The brand “formulary” 30-day supply has increased for the first time since 2008

Section 4: Medical plan design highlights (continued)
In-network prescription drug plan features For the medical plan selected as having the highest enrollment, the following is the breakdown of the prescription drug plan features:
2012 2011 2010 2009 2008
Not covered * 4% 6% 4% 6% -
< $30 copay 8% 9% 4% 7% 10%
$30 – $49 copay 24% 26% 32% 50% 55%
$50 – $59 copay 23% 18% 20%
$60 or greater copay 13% 10% 8% 9% 5%
< 19% coinsurance 2% 3% 2% 3% 2%
20 – 29% coinsurance 6% 6% 9% 7% 6%
30 – 39% coinsurance 7% 8% 5% 7% 5%
40% or greater coinsurance 13% 14% 16% 11% 12%
Brand “non-formulary” 30-day supply
2012 2011 2010 2009 2008
Not covered 9% 9% 6% 10% 21%
< $30 copay 8% 23% 22% 26% 10%
$30 – $59 copay 39% 28% 33% 27% 39%
$60 or greater copay 16% 10% 7% 8% 8%
< 19% coinsurance 3% 3% 3% 4% 3%
20% – 24% coinsurance 7% 10% 10% 9% 6%
25% – 39% coinsurance 8% 11% 10% 11% 7%
40% or greater coinsurance 10% 6% 9% 5% 7%
Specialty drug tier 30-day supply
*Not an option in 2008
53%
of survey participants have the same specialty drug financing as retail brand
Commonly, survey participants indicate they offer the following “other” prescription drug management programs:
• Quantity limits
• Specialty pharmacy program
• Employee pays the difference between what the plan would have paid for the generic and the cost of the brand
2012 2011
Prior authorization 44% 39%
Step therapy 41% 35%
Mandatory generic substitution 31% 26%
Exclude certain lifestyle drugs * 21% -
Mandatory mail order 16% 14%
Coverage of certain over-the-counter drugs *
9% -
Other 9% 9%
Prescription drug management programs
2012 2011
Not covered 3% 3%
2 x’s retail copays 49% 47%
2 ½ x’s retail copays 17% 16%
3 x’s retail copays 6% 6%
Same as retail 14% 13%
Not offered 1% 2%
Other 10% 13%
Mail order 90-day supply
*Not an option in 2011. More than one option was allowed to be chosen

Section 4: Medical plan design highlights (continued)
High-deductible plansEmployee enrollment in high-deductible plans, if such plans are offered:
Enrollment
HSA HRA
2012 2011 2010 2012 2011 2010
< 20% 56% 53% 67% 32% 43% 46%
20% – 39% 17% 20% 17% 21% 18% 18%
40% – 59% 10% 8% 4% 18% 10% 9%
60% – 79% 7% 10% 6% 13% 13% 13%
80% – 100% 10% 9% 6% 16% 16% 14%
Average enrollment 28.2% 29.5% 20.5% 43.2% 37.9% 34.2%
High-deductible plans with an HSA
• Average enrollment has remained fairly constant from 2011
• About half of employers (51%) have 50% or more of their employees funding
• 30% do not fund their employees’ HSA accounts, while 54% fund by less than $1,000 a year with the most common deductible being $2,000 – $2,999 (35%)
40%
of survey participants are offering high deductible plans with an HSA (up from 38% last year), while 17% offer with an HRA (down from 19% last year)
High-deductible plans with an HRA
• Average enrollment has increased 9% since 2010 to 43.2% in 2012
• 55% establish their amount allowance to be $500 – $999 a year with the most common deductible being $1,000 – $1,999 (57%)

Section 4: Medical plan design highlights (continued)
Financing of medical plans with highest enrollment
2012 2011 2010 2009
Self-insured 22% 20% 29% 21%
Fully-insured 65% 67% 68% 70%
Minimum premium arrangement 13% 13% 3% 9%
< 500 employees
2012 2011 2010 2009
Self-insured 49% 54% 69% 50%
Fully-insured 47% 39% 26% 46%
Minimum premium arrangement 4% 7% 5% 4%
500 – 1,000 employees
2012 2011 2010 2009
Self-insured 86% 87% 87% 84%
Fully-insured 12% 12% 11% 14%
Minimum premium arrangement 2% 1% 2% 2%
1,000 + employees

Section 4: Medical plan design highlights (continued)
Stop loss coverageFor the medical plan(s) selected as self-insured, the following is the breakdown of stop loss coverage:
Aggregate coverage
N/A
< 115%
115% - 124%
125%
126% +
66%
5%
7%
17%
5%
Specific/individual coverage ($ in 000’s)
0% 5% 10% 15% 20% 25% 30% 35%
< $50
$50 – $99.9
$100 – $149.9
$150 – $199.9
$200 – $249.9
$250 – $499.9
$500 – $999.9
$1,000 +
N/A
Specific/Individual Coverage ($ in 000’s)
Stop loss coverage by company size
< 500 Employees
500 – 1,000 Employees
1,000 + Employees
< 115% 12% 5% 5%
115% – 124% 19% 9% 5%
125% 30% 31% 15%
126% + 5% 2% 5%
N/A 34% 53% 70%
Aggregate coverage
< 500 Employees
500 – 1,000 Employees
1,000 + Employees
< $50,000 9% 0% 1%
$50,000 – $99,999 26% 9% 1%
$100,000 – $149,999 31% 21% 4%
$150,000 – $199,999 21% 28% 8%
$200,000 – $249,999 2% 12% 7%
$250,000 – $499,999 2% 14% 32%
$500,000 – $999,999 0% 5% 7%
$1,000,000 + 2% 2% 6%
N/A 7% 9% 34%
Specific/individual coverage
Smaller employers are more likely to offer aggregate coverage
As company size increases, the need for specific/individual coverage decreases

Section 4: Medical plan design highlights (continued)
Vendor satisfaction
2012 2011
Very satisfied Satisfied
Not satisfied
Very satisfied Satisfied
Not satisfied
Claim Administration 44% 52% 4% 73% 25% 2%
Network Discounts 44% 53% 3% 73% 24% 3%
Member Services 34% 59% 7% 63% 34% 3%
Medical Management 27% 66% 7% 56% 40% 4%
Wellness 23% 62% 15% 45% 45% 10%
Consumer/Decision Support 22% 66% 12% 58% 37% 5%
Overall, employers are satisfied with the services provided by their vendors, but there is a decrease in those very satisfied compared to 2011
• 44% indicated they were very satisfied with claim administration in 2012 versus 73% in 2011
• 44% indicated they were very satisfied with network discounts in 2012 versus 73% in 2011
• 22% indicated they were very satisfied with consumer/decision support in 2012 versus 58% in 2011
< 1,000 Employees
1,000 – 5,000 Employees
5,000 + Employees Aggregate
Insourced 33% 28% 21% 27%
Outsourced 44% 41% 55% 47%
Co-sourced 23% 31% 24% 26%
The benefit administration of medical plans by company size
As size increases, the percentage of participating employers insourcing their medical plans decreases

Detailed findings Section 5: Wellness and disease management

Wellness and disease management programs
Employers offering wellness and disease management programs
Wellness programs Disease management programs
2012 2011 2010 2012 2011 2010
Overall 72% 73% 76% 58% 66% 68%
< 1,000 Employees 56% 52% 65% 28% 40% 41%
1,000 – 5,000 Employees 76% 81% 73% 65% 74% 68%
5,000 + Employees 85% 88% 85% 81% 86% 83%
Overall, the percentage of participating employers offering disease management programs has been decreasing annually since 2010
As company size increases, so does the percentage of companies offering wellness and disease management programs
Section 5: Wellness and disease management (continued)

Section 5: Wellness and disease management (continued)
Wellness program highlights• 72% of all survey participants and 85% of large employers (5,000 +
employees) offer wellness programs to eligible individuals
• 62% of large employers (20,000 + employees) and 43% of small employers (< 500 employees) spend more than 1% of total medical costs on wellness programs
• The most prevalent use of incentives in 2012 was for Biometric Testing (70%) and Health Risk Questionnaire (68%), up from 56% and 62%, respectively, in 2011
• Participation in wellness programs is higher in programs using incentives:
— Health Risk Questionnaire: 48% participation with incentives, 34% participation without
> 50% use annual premium incentives, compared to 38% using cash or gift cards
— Biometric Screening: 51% participation with incentives, 29% participation without
> 58% use annual premium incentives, compared to 26% using cash or gift cards
— Onsite Health Clinic: 62% participation with incentives, 36% participation without
> 50% use annual premium incentives, compared to 25% using cash or gift cards
• 40% of employers use their medical vendors for their wellness program, 28% manage the program in-house, and 32% utilize an external vendor
Disease management program highlights• 58% of all survey participants and 81% of large employers (5,000 +
employees) offer disease management programs to eligible individuals although participation rates are typically low
• Less than 20% of respondents used incentives to increase participation in their disease management programs
— When incentives were offered, participation increased very slightly
— In most instances when an incentive was provided, it was generally provided in the form of a cash reward or gift card
> Asthma Program: 56% using cash or gift cards, 37% using an annual premium incentive
> Cancer Program: 69% using cash or gift cards, 23% using an annual premium incentive
> Diabetes Program: 57% using cash or gift cards, 37% using an annual premium incentive
> Lower Back Pain Program: 63% using cash or gift cards, 31% using an annual premium incentive
• 81% of employers use their medical vendor for their disease management program, 5% manage the program in-house, and 14% utilize an external vendor
81%
of employers use their medical vendor for their disease management program

Section 5: Wellness and disease management (continued)
Impact of incentives on participation
Wellness programs with and without incentive programs
Biometric screening
Health risk questionnaire
Nutritional training
Stress management
Tobacco cessation
Weight management
2012 70% 68% 28% 25% 36% 44%
2011 56% 62% 25% 22% 31% 29%
2010 53% 63% 27% 23% 36% 39%
2009 48% 64% 22% 12% - 36%
2008 46% 57% 17% 15% - 29%
Percentage of employers who offer incentives
0%
10%
20%
30%
40%
50%
60%
70%
Biometric Ergonomics Health Risk Questionnaire
Nutrition Onsite Health Clinic Stress Management Tobacco Cessation Weight Management
No Incentive Incentive

Section 5: Wellness and disease management (continued)
Disease management program participationParticipation in disease management programs is typically low
2012 2011 2010 2009 2008
< 15% 85% 81% 76% 78% 80%
15% – 29% 5% 7% 9% 9% 5%
30% – 44% 1% 2% 5% 3% 3%
45% – 59% 5% 4% 5% 2% 4%
60% – 74% 2% 3% 2% 2% 3%
75% + 2% 3% 3% 6% 5%
Asthma program
2012 2011 2010 2009 2008
< 15% 74% 72% 69% 69% 71%
15% – 29% 12% 12% 13% 12% 12%
30% – 44% 3% 5% 6% 5% 5%
45% – 59% 3% 5% 7% 5% 2%
60% – 74% 3% 2% 2% 2% 5%
75% + 5% 4% 3% 7% 5%
Diabetes program
2012 2011 2010 2009 2008
< 15% 86% 79% 77% 83% 82%
15% – 29% 6% 6% 8% 9% 1%
30% – 44% 0% 4% 7% 1% 3%
45% – 59% 2% 4% 2% 2% 5%
60% – 74% 2% 2% 2% 1% 3%
75% + 4% 5% 4% 4% 6%
Cancer program
2012 2011 2010 2009 2008
< 15% 87% 79% 77% 84% 72%
15% – 29% 9% 10% 10% 5% 10%
30% – 44% 1% 3% 5% 4% 8%
45% – 59% 2% 4% 4% 2% 4%
60% – 74% 0% 1% 2% 0% 2%
75% + 1% 3% 2% 5% 4%
Lower back pain program

Section 5: Wellness and disease management (continued)
Wellness and disease management programs
Very effective Somewhat effective Not effective
Mitigating healthcare costs 11% 65% 24%
Improving performance and productivity 7% 68% 25%
Enhancing employee engagement, attraction and loyalty 15% 66% 19%
Reinforcing corporate responsibility and image 20% 64% 16%
Effectiveness of wellness program
Very effective Somewhat effective Not effective
Mitigating healthcare costs 12% 71% 17%
Improving performance and productivity 5% 65% 30%
Enhancing employee engagement, attraction and loyalty 5% 56% 39%
Reinforcing corporate responsibility and image 9% 57% 34%
Effectiveness of disease management program

Section 5: Wellness and disease management (continued)
Return on investment (ROI) from wellness and disease management programs
ROI of wellness program
Wellness Disease Management
Do not measure 39% 43%
Insufficient information provided to calculate ROI 49% 45%
Below 1 to 1 2% 3%
1 to 1 2% 4%
2 to 1 3% 4%
3 to 1 3% 1%
4 to 1 0% 0%
5 to 1 or more 2% 0%
Companies measuring ROI by company size
88%
of employers reported that they do not measure ROI for wellness and disease management programs
As company size increases, employers are more likely to measure ROI for wellness and disease management programs
8%
11%
16%
4%
10%
16%
0%2%4%6%8%
10%12%14%16%18%
< 1,000 1,000 – 4,999 5,000 +
Companies Measuring ROI by Company Size
Wellness Disease Management

Section 5: Wellness and disease management (continued)
Work-life programs
2012 2011 2010 2009
Telecommuting 55% 51% 47% 51%
Flexible work schedule (i.e., 40 hours spread over seven days)
46% 46% 41% 48%
Parental leave 36% 35% 34% 38%
Reduced hours 31% 30% 30% 30%
Community service time 26% 25% 20% 19%
Adult leave/care * 16% - - -
Job share 14% 14% 16% 20%
Emergency childcare 14% 11% 10% 15%
Concierge service 8% 9% 8% 10%
On-site day care 7% 8% 8% 11%
Travel-related dependent care
4% 3% 2%2%
Other 4% 4% 3% 3%
Work-life programs
< 1,000 Employees
1,000 – 5,000
Employees 5,000 +
Employees
Telecommuting 49% 54% 62%
Flexible work schedule (i.e., 40 hours spread over seven days)
36% 47% 53%
Parental leave 30% 45% 35%
Reduced hours 26% 34% 34%
Community service time 18% 30% 29%
Adult leave/care * 12% 19% 16%
Job share 7% 13% 21%
Emergency childcare 5% 16% 20%
Concierge service 5% 10% 11%
On-site day care 0% 6% 16%
Travel-related dependent care 3% 4% 5%
Other 3% 5% 5%
Work-life programs by company size
* Not an option in prior years More than one option was allowed to be chosen
Availability of work-life programs increases as company size increases
More than one option was allowed to be chosen

Detailed findings Section 6: Welfare benefits
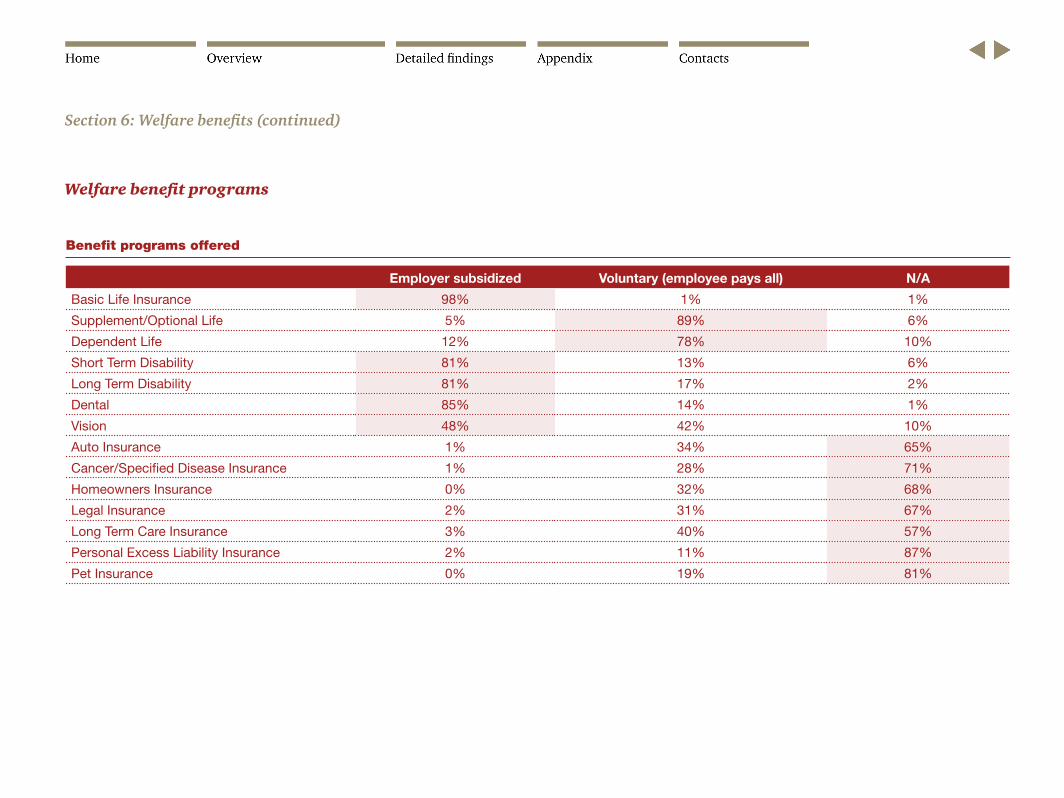
Welfare benefit programs
Employer subsidized Voluntary (employee pays all) N/A
Basic Life Insurance 98% 1% 1%
Supplement/Optional Life 5% 89% 6%
Dependent Life 12% 78% 10%
Short Term Disability 81% 13% 6%
Long Term Disability 81% 17% 2%
Dental 85% 14% 1%
Vision 48% 42% 10%
Auto Insurance 1% 34% 65%
Cancer/Specified Disease Insurance 1% 28% 71%
Homeowners Insurance 0% 32% 68%
Legal Insurance 2% 31% 67%
Long Term Care Insurance 3% 40% 57%
Personal Excess Liability Insurance 2% 11% 87%
Pet Insurance 0% 19% 81%
Benefit programs offered
Section 6: Welfare benefits (continued)

Section 6: Welfare benefits (continued)
Paid time off policies
57%
15%
10%
7%
7%
2% 2%
10+
9
8
7
6
5
< 5
Paid holidays Number of vacation days Number of sick days
0%
10%
20%
30%
40%
50%
60%
70%
Number of Sick Days
0%
10%
20%
30%
40%
50%
60%
70%
Number of Vacation Days
Full-Time New HireFull-Time New Hire
86% of respondents provide the same sick days and 24% of respondents provide the same vacation days for a new hire as they do for a full-time employee with five or more years tenure
Sick/vacation policies vary by: 2012
Tenure 85%
Level 42%
Hours worked (full-time vs. part-time) 74%
More than one option was allowed to be chosen

Section 6: Welfare benefits (continued)
Paid time off policies
0%
5%
10%
15%
20%
25%
30%
35%
40%
45%
< 10 10 – 14 15 – 19 20 – 24 25 – 29 30 +
Full-Time New Hire
< 1,000 Employees
1,000 – 5,000
Employees 5,000 +
Employees Aggregate
Maternity leave (birth of a child)
42% 43% 49% 45%
Paternity leave (birth of a child)
31% 34% 31% 32%
Adoption leave (placement of a child)
27% 33% 37% 32%
Family Illness, including care of extended family
25% 23% 31% 27%
Other 9% 13% 9% 10%
N/A 48% 45% 39% 44%
Integrated sick/vacation days
18%
of respondents provide new hires with the same number of sick/vacation days as a full-time employee with five or more years tenure
Less than half of survey participants (44%) implement an integrated sick/vacation day benefit structure
Paid time off by company size Do you offer paid time off that employees can use to address family needs in addition to family medical leave of absence?
• As employer size increases, maternity leave, adoption leave, and leave for family illness become more common
• Employer size does not appear to have an impact on paternity leave
• Smaller employers tend to offer less paid time off than larger employers
• Commonly, survey participants indicate they offer the following “Other” paid time off:
— Bereavement
— Military Leave
— Personal Days/Leave
More than one option was allowed to be chosen

Detailed findings Section 7: Retiree medical

Retiree medical programs
Pre-65 Current retirees
New hires
Do not offer pre-65 54% 69%
Pre-65 access only 19% 18%
Pre-65 company subsidized 16% 14%
Pre-65 company subsidized, grandfathered groups only 14% -
Post-65
Do not offer post-65 58% 77%
Post-65 access only 14% 14%
Post-65 company subsidized 13% 9%
Post-65 company subsidized, grandfathered groups only 14% -
More than one option was allowed to be chosen
0%
5%
10%
15%
20%
25%
Pre-65 Post-65
Percent subsidy, for retiree medical that is subsidized
On average, companies subsidize more than half for pre-65 (57%) and post-65 (58%) coverages
Section 7: Retiree medical (continued)
Section 7: Retiree medical (continued)
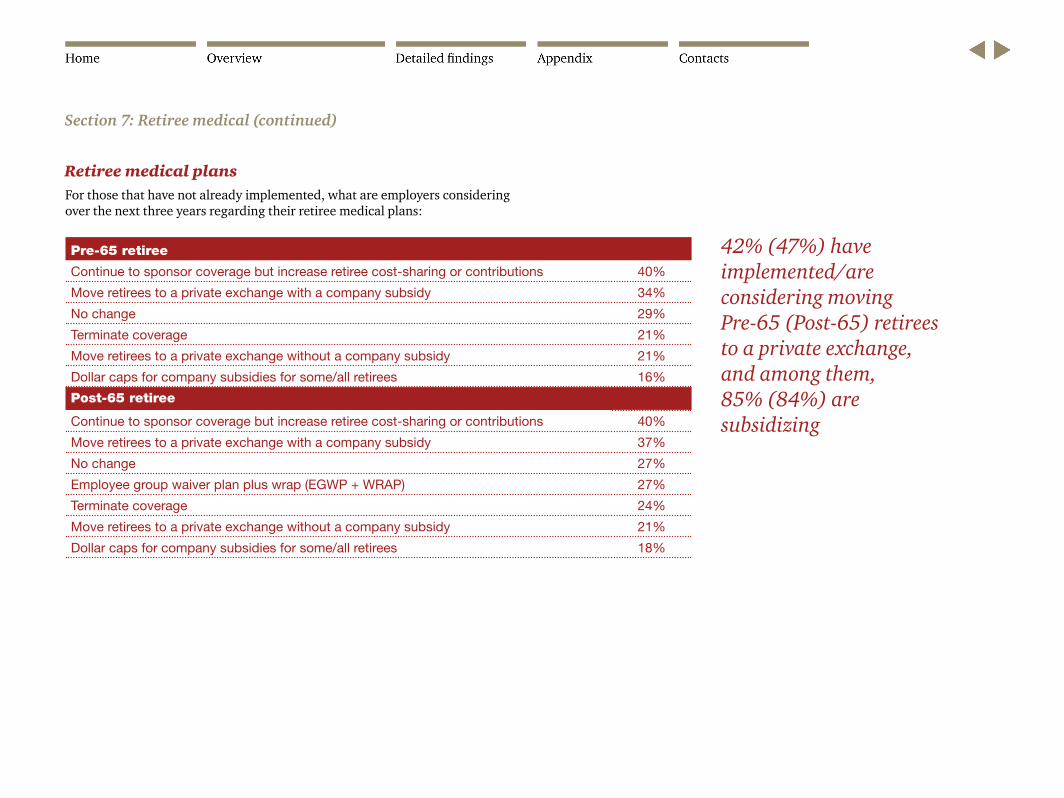
Retiree medical plans
Pre-65 retiree
Continue to sponsor coverage but increase retiree cost-sharing or contributions 40%
Move retirees to a private exchange with a company subsidy 34%
No change 29%
Terminate coverage 21%
Move retirees to a private exchange without a company subsidy 21%
Dollar caps for company subsidies for some/all retirees 16%
Post-65 retiree
Continue to sponsor coverage but increase retiree cost-sharing or contributions 40%
Move retirees to a private exchange with a company subsidy 37%
No change 27%
Employee group waiver plan plus wrap (EGWP + WRAP) 27%
Terminate coverage 24%
Move retirees to a private exchange without a company subsidy 21%
Dollar caps for company subsidies for some/all retirees 18%
For those that have not already implemented, what are employers considering over the next three years regarding their retiree medical plans:
42% (47%) have implemented/are considering moving Pre-65 (Post-65) retirees to a private exchange, and among them, 85% (84%) are subsidizing

Detailed findings Section 8: Retirement plans

Employer-provided retirement programs
2012 2011 2010
401(k) (or 403(b)) defined contribution plan 95% 86% 76%
Defined benefit 33% 32% 9%
Other 12% 11% 5%
Type of employer-provided retirement programs sponsored
More than one option was allowed to be chosen
Defined benefits plan
2012 2011 2010
Open to all employees 53% 55% 62%
Open to employees hired before a certain date 30% 31% 20%
Frozen to all accruals 17% 14% 18%
If offered, defined benefit plan currently
2012
< 60% 4%
60% – 69.9% 6%
70% – 79.9% 9%
80% – 89.9% 39%
90% – 99.9% 18%
100% + 24%
If offered, defined benefit plan’s funded status percentage
Survey participants indicated that they participate in the following “other” retirement programs
• 401(a) Plans
• 457 Plans
• Cash Balance
• Employee Stock Ownership Plan (ESOP)
• Profit Sharing
Section 8: Retirement plans (continued)
401(k) and 403(b) plans are typically the most common retirement programs sponsored by employers
• Defined benefit plans are frozen for accruals in 17% of participant’s plans
— The 11% increase in trend for employers who offer defined benefit plans closed to new entrants from 2010 to 2011 has stabilized in 2012 with 30% offering plans closed to new entrants
• The majority of survey participants (81%) maintain a funded status percentage at 80% or above

Section 8: Retirement plans (continued)
Employer-provided retirement programs by industry
Education & Other
Nonprofit
Energy, Utilities, &
MiningFinancial Services
Health Industries Insurance Manufacturing Services Technology
401(k) 100% 95% 93% 96% 98% 94% 96% 96%
Defined Benefit 26% 57% 20% 37% 57% 37% 15% 13%
Other 16% 14% 13% 13% 9% 10% 15% 7%
Type of employer-provided retirement programs sponsored
More than one option was allowed to be chosen
The percentage of employers offering 401(k) plans does not vary significantly by industry, whereas the percentage offering defined benefit plan does vary noticeably. 57% of Energy, Utilities, & Mining and Insurance employers having defined benefit plans versus only 13% of Technology employers.

Section 8: Retirement plans (continued)
401(k) plans
Percentage of employee contribution 2012 2011 2010 2009
No match 12% 14% 15% 17%
1% – 25% 39% 37% 34% 41%
26% – 50% 15% 18% 18% 16%
51% – 100% 20% 23% 25% 17%
Other 14% 8% 8% 9%
Current 401(k) company contribution match
For employers offering 401(k) plans, employees are fully vested within:
Many employers who may have rescinded their company matching contribution after the 2008 equity markets decline have restored the match. Only 12% offer no matching contribution in 2012, down from 17% in 2009.
41%
59%
0% 10% 20% 30% 40% 50% 60%
Immediately
1-3 Years
Section 8: Retirement plans (continued)
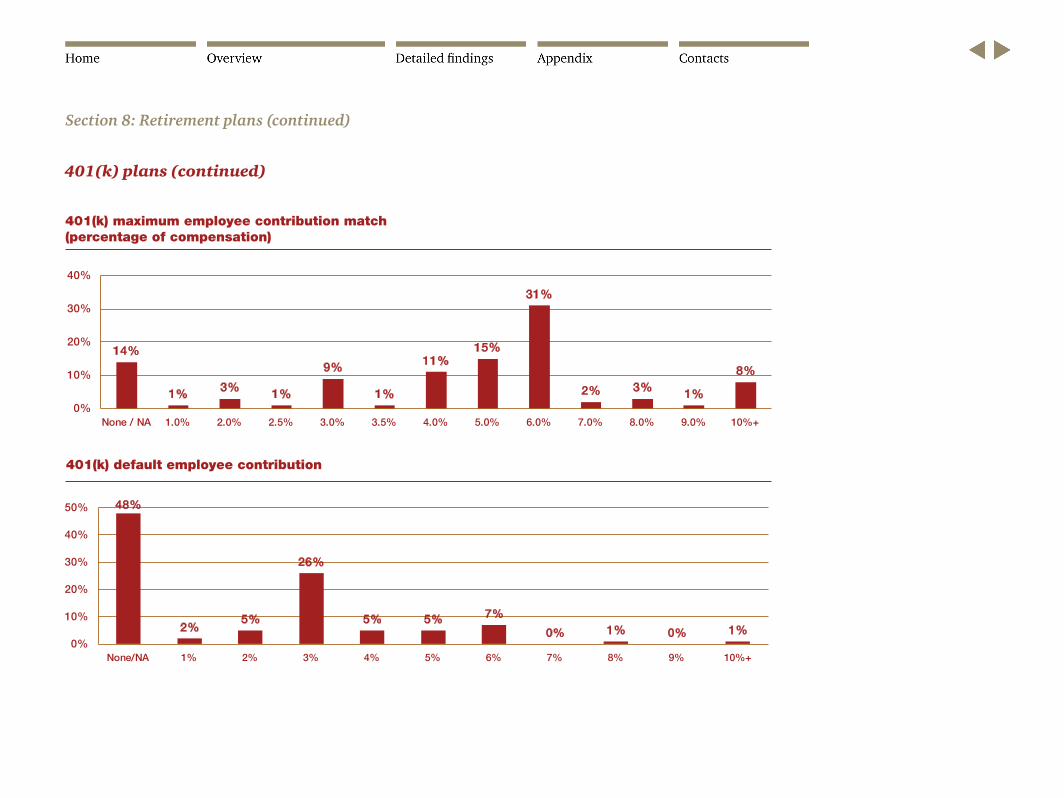
401(k) plans (continued)
401(k) maximum employee contribution match(percentage of compensation)
401(k) default employee contribution
14%
1% 3% 1%
9%
1%
11%15%
31%
2% 3% 1%
8%
0%
10%
20%
30%
40%
None / NA 1.0% 2.0% 2.5% 3.0% 3.5% 4.0% 5.0% 6.0% 7.0% 8.0% 9.0% 10%+
401(k) Maximum Employee Contribution Match(Percentage of Compensation)
48%
2%5%
26%
5% 5% 7%
0% 1% 0% 1%0%
10%
20%
30%
40%
50%
None/NA 1% 2% 3% 4% 5% 6% 7% 8% 9% 10%+
401(k) Default Employee Contribution

Section 8: Retirement plans (continued)
401(k) plans (continued)
401(k) non-elective employer contribution
401(k) estimated administrative fee charged per participant
75%
2% 4% 7%2%
10%
0%
10%
20%
30%
40%
50%
60%
70%
80%
None 1.0% – 1.9% 2.0% – 2.9% 3.0% – 3.9% 4.0% – 4.9% 5.0% +
401(k) Non-Elective Employer Contribution
37%
19% 17%12%
3% 4% 4%1% 1% 2%
0%
10%
20%
30%
40%
None < 0.10% 0.10% –0.19%
0.20% –0.29%
0.30% –0.39%
0.40% –0.49%
0.50% –0.59%
0.60% –0.69%
0.70% –0.79%
0.80% +
401(k) Estimated Administrative Fee Charged per Participant

Section 8: Retirement plans (continued)
Defined benefit plansOf those employers participating in defined benefit plans, the following types are offered with their respective accrual rate:
Hybrid/cash balance (% comp)
2012 2011
< 1.0% 0% 2%
1.0% – 1.9% 0% 5%
2.0% – 2.9% 10% 7%
3.0% – 3.9% 18% 16%
4.0% – 4.9% 16% 16%
5.0% – 5.9% 20% 19%
6.0% + 36% 35%
Final average earning (% per year of service)
2012 2011
< 1.0% 7% 1%
1.0% – 1.9% 44% 56%
2.0% – 2.9% 19% 20%
3.0% – 3.9% 11% 9%
4.0% – 4.9% 3% 2%
5.0% – 5.9% 8% 2%
6.0% + 8% 10%
Dollar times service
2012 2011
$0 – $19 6% 8%
$20 – $39 69% 67%
$40 – $59 19% 25%
$60 + 6% 0%
Career average earning (% per year of service)
2012 2011
< 1.0% 8% 0%
1.0% – 1.9% 42% 52%
2.0% – 2.9% 23% 16%
3.0% – 3.9% 11% 8%
4.0% – 4.9% 0% 8%
5.0% – 5.9% 11% 4%
6.0% + 5% 12%

Detailed findings Section 9: Health reform – PPACA
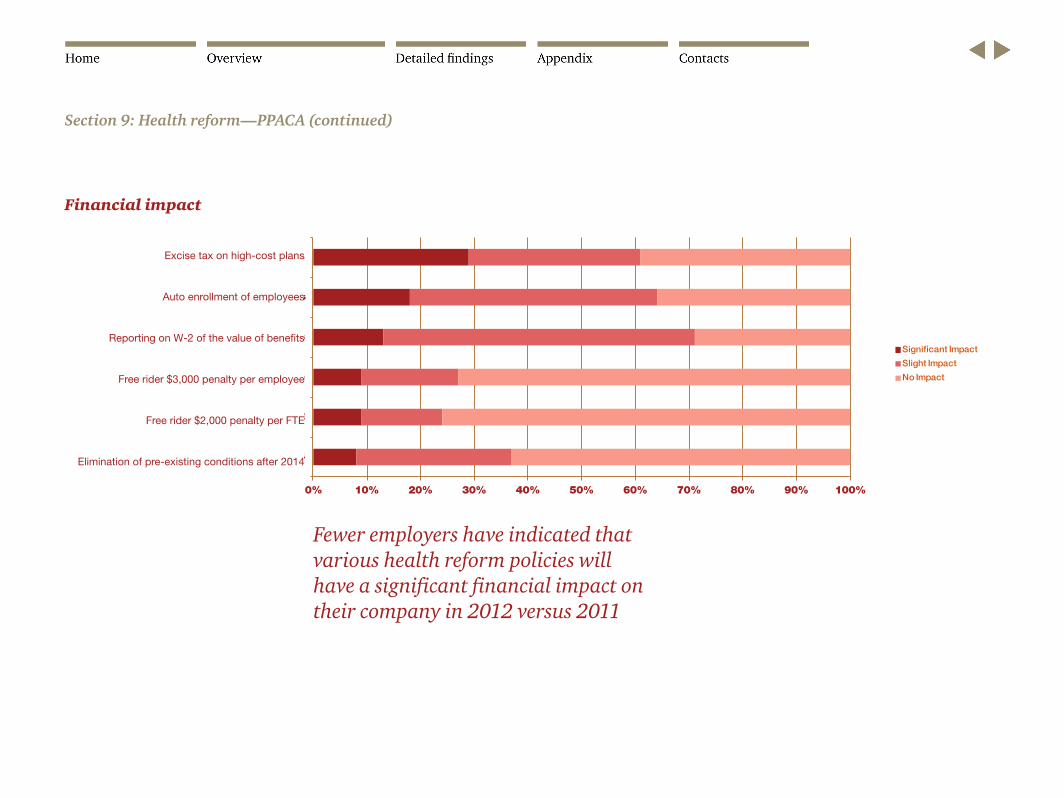
Financial impact
Fewer employers have indicated that various health reform policies will have a significant financial impact on their company in 2012 versus 2011
0% 10% 20% 30% 40% 50% 60% 70% 80% 90% 100%
Elimination of Pre-Existing Conditions after 2014
Free Rider $2,000 Penalty per FTE
Free Rider $3,000 Penalty per Employee
Reporting on W-2 the Value of Benefits
Auto Enrollment of Employees
Excise Tax on High Cost Plans
Significant Impact
Slight Impact
No Impact
Excise tax on high-cost plans
Auto enrollment of employees
Reporting on W-2 of the value of benefits
Free rider $3,000 penalty per employee
Free rider $2,000 penalty per FTE
Elimination of pre-existing conditions after 2014
Section 9: Health reform—PPACA (continued)

Section 9: Health reform—PPACA (continued)
Compliance/administrative impactTo what degree has health reform created or is expected to create additional compliance/administrative burdens for the HR/Benefits function at your company?
0%
10%
20%
30%
40%
50%
60%
70%
Significant Increase
Moderate Increase
No Effect Moderate Decrease
Significant Decrease
Do not know
2012 2011
89%
of employers indicated an increase, which is up from 80% in 2011
Grandfathered status and applications
Grandfathered under PPCA
Yes 31%
No 61%
Varies by plan 8%
Of the survey participants offering retiree medical, 55% are receiving the Early Retiree Reinsurance Program Subsidy
2% have Annual Limit Waiver (Minimeds)

Part-time emplyoyeesOn average, participating employers have 8% part-time employees with 60% of those being defined by the number of hours scheduled
Part-time employee definition
60%
35%
5%
Average hours worked
Hours scheduled
Other
0%
5%
10%
15%
20%
25%
30%
35%
40%
45%
Work Force That is Part-TimeWorkforce that is part time
Are part-time employees eligible for medical benefits?
2012
No 40%
Yes, at a lower contribution percentage than full-time 7%
Yes, at the same contribution percentage as full-time 29%
Yes, at a higher contribution percentage than full-time 24%
Section 9: Health reform—PPACA (continued)

Top strategies
Increase company’s efforts related to wellness & health management
Re-evaluate overall benefits strategy
Make other changes to offset costs associated with PPACA
Cover employees through the use of private exchange
Cover employees through state-run health insurance exchange pools
Move to a defined contribution approach to healthcare
Direct contracting with providers of ACOs
0% 10% 20% 30% 40% 50% 60% 70% 80% 90% 100%
Direct Contracting with Providers of ACOs
Move to a Defined Contribution Approach to Healthcare
Cover Employees Through State-Run Health Insurance Exchange Pools
Cover Employees Through the Use of Private Exchange
Make Other Changes to Offset Costs Associated with PPACA
Re-evaluate Overall Benefits Strategy
Increase Company's Efforts Related to Wellness & Health Management
Very Likely
Somewhat Likely
Unlikely
Section 9: Health reform—PPACA (continued)

Annual maximumFor employees and their dependents currently offered coverage with an annual maximum, which of the following are you considering for 2014 when the annual maximum waiver expires:
Offer affordable minimum essential coverage to employees and families
Actively manage percentage of part-time and full-time workers
Offer affordable minimum essential coverage to employees only
Offer access only to minimum essential coverage to employees and families
Offer subsidized coverage to employees and families that do not meet the affordable standard
Offer a fixed indemnity plan to employees and families
No longer offer health benefits to these employees
0% 10% 20% 30% 40% 50% 60% 70% 80% 90% 100%
No longer offer health benefits to these employees
Offer a fixed indemnity plan to employees and families
Offer subsidized coverage to employees and families that do not meet the affordable standard
Offer access only to minimum essential coverage to employees and families
Offer affordable minimum essential coverage to employees only
Actively manage percentage of part-time and full-time workers
Offer affordable minimum essential coverage to employees and families
Likely to Implement
Under Consideration
Not Under Consideration
Section 9: Health reform—PPACA (continued)

Health reformLikelihood that your company will consider changing or eliminating retiree medical benefits, if applicable:
0%
10%
20%
30%
40%
50%
60%
70%
80%
90%
100%
Pre-65 Post-65
Unlikely
Somewhat Likely
Very Likely
Section 9: Health reform—PPACA (continued)

Detailed findings Section 10: Future solutions

Already implemented
Under consideration
Not under consideration
Increase employee contributions 31% 57% 12%
Increase prescription drug plan cost sharing through plan design changes 21% 52% 27%
Expand and improve wellness inside the United States 38% 50% 12%
Increase medical plan cost sharing through plan design changes 34% 50% 16%
Implement a value-based design 6% 45% 49%
Implement a high-deductible plan as a full replacement option for medical benefits 13% 42% 45%
Implement a performance-based network 4% 41% 55%
Offer a health savings account 33% 40% 27%
Implement a high-deductible plan as an additional medical plan option 32% 40% 28%
Consolidate vendors 15% 36% 49%
Expand/offer flexible work arrangement 26% 32% 42%
Offer a health reimbursement account 21% 32% 47%
Medical homes 4% 23% 73%
On-site clinics 12% 21% 67%
Expand and improve wellness outside of the United States 7% 20% 73%
Implement a defined contribution plan for retiree health 4% 19% 77%
Direct contracting 3% 19% 78%
Reduce/consolidate wellness programs 4% 16% 80%
Decrease medical plan cost sharing through plan design changes 4% 14% 82%
Decrease prescription drug plan cost sharing through plan design changes 3% 14% 83%
Transit reimbursement program 38% 12% 50%
Tuition assistance 69% 10% 21%
Decrease employee contributions 2% 10% 88%
Section 10: Future solutions (continued)
Future solutions
More than one option was allowed to be chosen

0 20 40 60 80 100
Category 1
Category 2
Category 3
Category 4
Section 10: Future solutions (continued)
Non-cost shiftingBreakdown of planned non-cost shifting options only as being already implemented or under consideration
More than one option was allowed to be chosen
Expand wellness in the US
Health Savings Account
Health Reimbursement Account
Value-based design
Performance-based network
Expand wellness outside the US 27%
45%
52%
53%
73%
88%

Appendix Section 11: Summary of survey participants
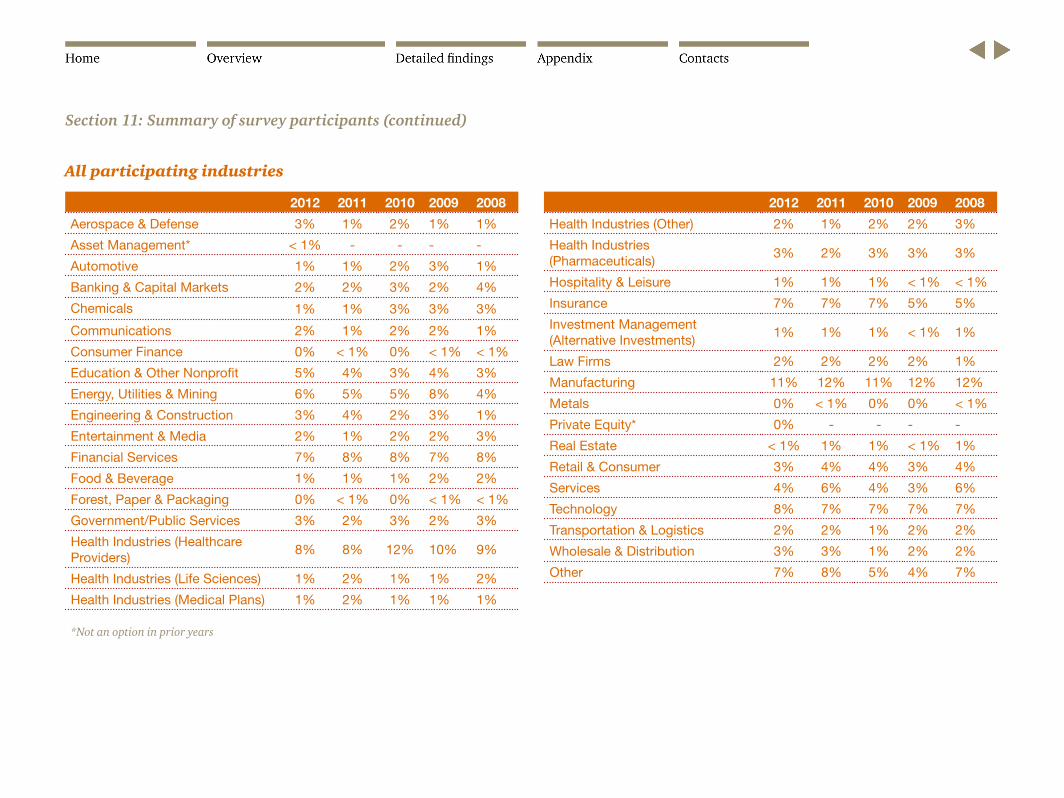
Section 11: Summary of survey participants (continued)
2012 2011 2010 2009 2008
Aerospace & Defense 3% 1% 2% 1% 1%
Asset Management* < 1% - - - -
Automotive 1% 1% 2% 3% 1%
Banking & Capital Markets 2% 2% 3% 2% 4%
Chemicals 1% 1% 3% 3% 3%
Communications 2% 1% 2% 2% 1%
Consumer Finance 0% < 1% 0% < 1% < 1%
Education & Other Nonprofit 5% 4% 3% 4% 3%
Energy, Utilities & Mining 6% 5% 5% 8% 4%
Engineering & Construction 3% 4% 2% 3% 1%
Entertainment & Media 2% 1% 2% 2% 3%
Financial Services 7% 8% 8% 7% 8%
Food & Beverage 1% 1% 1% 2% 2%
Forest, Paper & Packaging 0% < 1% 0% < 1% < 1%
Government/Public Services 3% 2% 3% 2% 3%
Health Industries (Healthcare Providers)
8% 8% 12% 10% 9%
Health Industries (Life Sciences) 1% 2% 1% 1% 2%
Health Industries (Medical Plans) 1% 2% 1% 1% 1%
2012 2011 2010 2009 2008
Health Industries (Other) 2% 1% 2% 2% 3%
Health Industries (Pharmaceuticals)
3% 2% 3% 3% 3%
Hospitality & Leisure 1% 1% 1% < 1% < 1%
Insurance 7% 7% 7% 5% 5%
Investment Management (Alternative Investments)
1% 1% 1% < 1% 1%
Law Firms 2% 2% 2% 2% 1%
Manufacturing 11% 12% 11% 12% 12%
Metals 0% < 1% 0% 0% < 1%
Private Equity* 0% - - - -
Real Estate < 1% 1% 1% < 1% 1%
Retail & Consumer 3% 4% 4% 3% 4%
Services 4% 6% 4% 3% 6%
Technology 8% 7% 7% 7% 7%
Transportation & Logistics 2% 2% 1% 2% 2%
Wholesale & Distribution 3% 3% 1% 2% 2%
Other 7% 8% 5% 4% 7%
All participating industries
*Not an option in prior years

Section 11: Summary of survey participants (continued)
Survey participant location & company size
2012 2011 2010 2009 2008
National 42% 38% 52% 51% 48%
NE 18% 16% 14% 16% 17%
NW 6% 6% 4% 5% 5%
North Central 12% 16% 13% 9% 11%
South Central 6% 8% 6% 6% 6%
SE 9% 9% 8% 9% 8%
SW 7% 7% 3% 4% 5%
Survey participants by location
2012 2011 2010 2009 2008
< 500 25% 24% 14% 16% 16%
501 – 999 11% 11% 13% 10% 11%
1,000 – 1,999 12% 14% 14% 14% 14%
2,000 – 2,999 8% 8% 9% 8% 8%
3,000 – 3,999 4% 5% 5% 6% 7%
4,000 – 4,999 6% 5% 6% 6% 6%
5,000 – 9,999 11% 11% 13% 13% 14%
10,000 – 19,999 10% 10% 11% 13% 10%
20,000 + 13% 12% 15% 14% 16%
Survey participants by company size (i.e., active employees)
2012 2012 2012
Alabama 2% Louisiana 2% Ohio 3%
Alaska 1% Maine 1% Oklahoma 2%
Arizona 2% Maryland 2% Oregon 2%
Arkansas 1% Massachusetts 3% Pennsylvania 3%
California 4% Michigan 2% Rhode Island 1%
Colorado 2% Minnesota 2% South Carolina 2%
Connecticut 2% Mississippi 2% South Dakota 1%
Delaware 2% Missouri 2% Tennessee 2%
Florida 3% Montana 1% Texas 4%
Georgia 3% Nebraska 2% Utah 2%
Hawaii 1% Nevada 2% Vermont 1%
Idaho 1% New Hampshire 2% Virginia 3%
Illinois 3% New Jersey 3% Washington 2%
Indiana 2% New Mexico 1% West Virginia 1%
Iowa 2% New York 3% Wisconsin 2%
Kansas 2% North Carolina 2% Wyoming 1%
Kentucky 2% North Dakota 1%
Survey participants by state

©2012 PwC. All rights reserved. “PricewaterhouseCoopers” refers to PricewaterhouseCoopers LLP, a Delaware limited liability partnership, or, as the context requires, the PricewaterhouseCoopers global network or other member firms of the network, each of which is a separate legal entity. This document is for general information purposes only, and should not be used as a substitute for consultation with professional advisors. MW-12-0360
Thank you for participating in PwC’s Health and Well-Being Touchstone Survey
We are currently in the process of analyzing the results in more detail in order to provide customized results. If you are interested in learning more, please contact:
Michael Thompson [email protected] (646) 471 0720
Hollie Bialek [email protected] (646) 471 0618
Ernest Chan [email protected] (646) 471 7087
Kimberly Small [email protected] (646) 471 4273