Headgroup Conformations of Phospholipids from Molecular Dynamics Simulation: Sampling Challenges and...
6
Headgroup Conformations of Phospholipids from Molecular Dynamics Simulation: Sampling Challenges and Comparison to Experiment Alexander Vogel • Scott E. Feller Received: 14 October 2011 / Accepted: 19 November 2011 / Published online: 9 December 2011 Ó Springer Science+Business Media, LLC 2011 Abstract The preferred conformations of the glycerol region of a phospholipid have been explored using replica exchange molecular dynamics (MD) simulations and compared with the results of standard MD approaches and with experiment. We found that due to isomerization rates in key torsions that are slow on the timescale of atomistic MD simulations, standard MD is not able to produce accurate equilibrium conformer distributions from reason- able trajectory lengths (e.g., on the 100 ns) timescale. Replica exchange MD, however, results in quite efficient sampling due to the rapid increase in isomerization rate with temperature. The equilibrium distributions obtained from replica exchange MD have been compared with the results of experimental nuclear magnetic resonance observations. This comparison suggests that the sampling approach demonstrated here is a valuable tool that can be used in evaluating force fields for molecular simulation of lipids. Keywords Molecular dynamics Á Model membrane Á Replica exchange Á NMR study Á Artificial bilayer membrane Introduction Phospholipids constitute an important class of biomole- cules, providing the basis for cellular membranes and creating nanoscopic interfaces with extreme variations in polarity over a length scale of angstroms. The backbone of the phospholipid is a substituted glycerol with the hydrophilic phosphate headgroup connected to carbon atom C1 via a phosphate ester bond and two hydrophobic fatty acid chains connected at C2 and C3 via ester bonds (see Fig. 1). Situated in a unique region of astounding chemical heterogeneity (Wiener and White 1992), the conformational preferences of the glycerol region of the phospholipid determine important details of headgroup and tail orientations, influencing properties such as the dipole orientation and dipole potential (Gawrisch et al. 1992) and the packing of the aliphatic chains that are critical determinants of membrane structure and function (Israelachvili 1977). Hauser et al. (1980, 1988) have described how the values of the h 3 /h 4 torsion angles (see Fig. 1 for definitions of these angles) determine the rela- tive orientation of the acyl chains and compared the tor- sional states of a variety of phospholipids as crystalline solids, as fluid phase (L a ) bilayers and as individual monomers dissolved in a range of solvents. While the crystal structure indicates a single conformation (h 3 = trans, h 4 = gauche?), under physiological temperature, in both the monomeric and bilayer forms, several confor- mations are observed by nuclear magnetic resonance (NMR). Hauser et al. labeled the global free energy minimum conformer observed in the crystal structures ‘‘A’’ and identified by NMR analysis the ‘‘B’’ conformer (h 3 = gauche?, h 4 = gauche–) and the ‘‘C’’ conformer (h 3 = gauche-, h 4 = trans). The relative population of these rotational isomers depends somewhat on acyl chain composition, aggregation state and solvent polarity; but for glycerophosphatidylcholines the A conformer always predominates (50–60%) and the C conformer constitutes only a small fraction (1–10%). A. Vogel Institute of Medical Physics and Biophysics, University of Leipzig, Leipzig, Germany S. E. Feller (&) Department of Chemistry, Wabash College, 301 W. Wabash Avenue, Crawfordsville, IN 47933, USA e-mail: [email protected] 123 J Membrane Biol (2012) 245:23–28 DOI 10.1007/s00232-011-9411-5
-
Upload
alexander-vogel -
Category
Documents
-
view
212 -
download
0
Transcript of Headgroup Conformations of Phospholipids from Molecular Dynamics Simulation: Sampling Challenges and...

Headgroup Conformations of Phospholipids from MolecularDynamics Simulation: Sampling Challenges and Comparisonto Experiment
Alexander Vogel • Scott E. Feller
Received: 14 October 2011 / Accepted: 19 November 2011 / Published online: 9 December 2011
� Springer Science+Business Media, LLC 2011
Abstract The preferred conformations of the glycerol
region of a phospholipid have been explored using replica
exchange molecular dynamics (MD) simulations and
compared with the results of standard MD approaches and
with experiment. We found that due to isomerization rates
in key torsions that are slow on the timescale of atomistic
MD simulations, standard MD is not able to produce
accurate equilibrium conformer distributions from reason-
able trajectory lengths (e.g., on the 100 ns) timescale.
Replica exchange MD, however, results in quite efficient
sampling due to the rapid increase in isomerization rate with
temperature. The equilibrium distributions obtained from
replica exchange MD have been compared with the results
of experimental nuclear magnetic resonance observations.
This comparison suggests that the sampling approach
demonstrated here is a valuable tool that can be used in
evaluating force fields for molecular simulation of lipids.
Keywords Molecular dynamics � Model membrane �Replica exchange � NMR study � Artificial bilayer
membrane
Introduction
Phospholipids constitute an important class of biomole-
cules, providing the basis for cellular membranes and
creating nanoscopic interfaces with extreme variations in
polarity over a length scale of angstroms. The backbone of
the phospholipid is a substituted glycerol with the
hydrophilic phosphate headgroup connected to carbon
atom C1 via a phosphate ester bond and two hydrophobic
fatty acid chains connected at C2 and C3 via ester bonds
(see Fig. 1). Situated in a unique region of astounding
chemical heterogeneity (Wiener and White 1992), the
conformational preferences of the glycerol region of the
phospholipid determine important details of headgroup
and tail orientations, influencing properties such as the
dipole orientation and dipole potential (Gawrisch et al.
1992) and the packing of the aliphatic chains that are
critical determinants of membrane structure and function
(Israelachvili 1977). Hauser et al. (1980, 1988) have
described how the values of the h3/h4 torsion angles (see
Fig. 1 for definitions of these angles) determine the rela-
tive orientation of the acyl chains and compared the tor-
sional states of a variety of phospholipids as crystalline
solids, as fluid phase (La) bilayers and as individual
monomers dissolved in a range of solvents. While the
crystal structure indicates a single conformation (h3 =
trans, h4 = gauche?), under physiological temperature, in
both the monomeric and bilayer forms, several confor-
mations are observed by nuclear magnetic resonance
(NMR). Hauser et al. labeled the global free energy
minimum conformer observed in the crystal structures
‘‘A’’ and identified by NMR analysis the ‘‘B’’ conformer
(h3 = gauche?, h4 = gauche–) and the ‘‘C’’ conformer
(h3 = gauche-, h4 = trans). The relative population of
these rotational isomers depends somewhat on acyl chain
composition, aggregation state and solvent polarity; but
for glycerophosphatidylcholines the A conformer always
predominates (50–60%) and the C conformer constitutes
only a small fraction (1–10%).
A. Vogel
Institute of Medical Physics and Biophysics,
University of Leipzig, Leipzig, Germany
S. E. Feller (&)
Department of Chemistry, Wabash College,
301 W. Wabash Avenue, Crawfordsville, IN 47933, USA
e-mail: [email protected]
123
J Membrane Biol (2012) 245:23–28
DOI 10.1007/s00232-011-9411-5

In the recent past molecular dynamics (MD) computer
simulations have emerged as a powerful tool for providing
structural, dynamic and thermodynamic descriptions of
lipid bilayer membranes at the atomic level (Brandt and
Edholm 2009; Lyubartsev and Rabinovich 2011; Marrink
et al. 2009). These calculations have been found to com-
plement experimental techniques such as X-ray scattering
and NMR and are finding widespread use in membrane
biophysics research programs. There are, however, many
details that must be considered in carrying out such com-
puter simulations, such as the time and length scales of the
processes under study, the statistical mechanical ensemble
to be employed, the algorithm used to integrate the equa-
tions of motion and the form of the energy function and its
parameterization. A key quantity that must be assessed in
evaluating such simulations is the degree to which the
results can be said to be converged; i.e., the observed
conformations correspond to the equilibrium distribution
and the number of transitions between states is sufficiently
large that reliable statistics on the dynamics of fluctuations
are obtained (Grossfield and Zuckerman 2009). For degrees
of freedom with long correlation times, it may be difficult to
determine accurate equilibrium distributions and it may be
unclear whether discrepancies with experiment arise from a
systematic error, e.g., deficiencies in the potential energy
function, or from statistical error. A powerful algorithm for
accelerating the sampling in MD simulations is the replica
exchange (REX) technique. In its most frequent imple-
mentation, a series of MD simulations (system replicas) are
run in parallel at different temperatures. The temperature
range typically begins at or near the temperature of primary
interest and increases to a significantly higher temperature,
where rates for crossing energetic barriers are significantly
higher. A Monte Carlo procedure is applied periodically to
swap configurations among the various temperatures; thus,
each replica spends time at higher temperatures, accelerat-
ing processes that have long correlation times at the tem-
perature of interest. For a detailed description of REX MD,
the reader is referred to Sugita and Okamoto (1999).
Here, we describe the application of REX MD to a
dipalmitoylphosphatidylcholine (DPPC) monomer in
aqueous solution. While many simulations of DPPC as a
bilayer or monolayer have been reported in the literature,
few have examined the monomeric form. We chose this
system composition because it more closely matches the
conditions of the NMR experiments we seek to connect to
and because it allows extremely efficient sampling using
the REX MD technique. Our results, however, have
important implications for simulations of the phospholipid
bilayers that are our ultimate goal.
Procedure
The program CHARMM (Brooks et al. 1983) was employed
for all simulations, using the CHARMM c32b2 all-atom
force field (Feller and MacKerell 2000; Schlenkrich et al.
1996). A single DPPC molecule was built with all bond
lengths, angles and dihedrals generated from internal coor-
dinates. In that process the dihedral angles h3 and h4 were
generated as 180� and 60�, respectively. After hydration with
898 TIP3P water molecules, the system consisted of 2,725
atoms in cubic periodic boundary conditions with a side
length that fluctuated about a value of 30.1 A during the
conventional simulation. Constant pressure (1 atm) was
maintained using the Langevin piston (Feller et al. 1995)
algorithm, while constant temperature (300 K) was main-
tained via a Hoover (1985) thermostat. All bonds to hydro-
gen atoms were fixed at their equilibrium lengths using the
SHAKE (Ryckaert et al. 1977) procedure.
The conventional MD simulation was equilibrated for
1.2 ns and subsequently run for 110 ns with a 1-fs time step
in the NPT ensemble. The coordinates produced after 3.9 ns
of this simulation were used as a starting configuration of a
REX MD simulation that ran for 35.7 ns with a 1-fs time
step. In this simulation, 20 replicas of the system were
simulated at constant volume at the following temperatures:
300, 306, 312, 320, 328, 336, 346, 356, 366, 378, 390, 402,
416, 430, 444, 460, 476, 492, 510, and 528 K. Systems at
neighboring temperature baths were allowed to swap in
250-fs intervals of MD simulation. With this temperature
spacing the swap probability was approximately 10%.
Fig. 1 Structure of DPPC using the torsion angle notation of Sundaralingam (1972)
24 A. Vogel, S. E. Feller: Headgroup Conformations of Phospholipids
123
Results
Figure 2 shows the time evolution of the h4 torsion angle
over more than 100 ns of standard MD simulation. The
majority of the simulation time is spent in conformation A.
The number of isomerizations is small (*0.8/ns), with
many producing only short periods in conformations B and
C. The B conformation in particular is rarely observed in
the simulation, making up only *1% of the states, much
less than observed experimentally. The single transition to
the B state observed in over 100 ns of simulation power-
fully demonstrates the challenge in sampling lipid head-
group conformations. While the lifetimes of rotational
isomers along the acyl chain are in the range of tens to
hundreds of picoseconds (Venable et al. 1993), the dra-
matically longer lifetimes observed in the headgroup lead
to a situation where lipid simulations begun from arbitrary
initial conditions may not achieve an equilibrium distri-
bution on the timescale of current MD simulations. While
it might be argued that in a typical lipid bilayer simulation
with *100 lipid molecules taken from preequilibrated
libraries the equilibrium distribution may still be obtained
when averaging over all molecules, this will not be the case
for an inhomogenous membrane such as one containing a
transmembrane protein or membrane-bound peptide where
the distribution of glycerol backbone dihedrals might be
shifted.
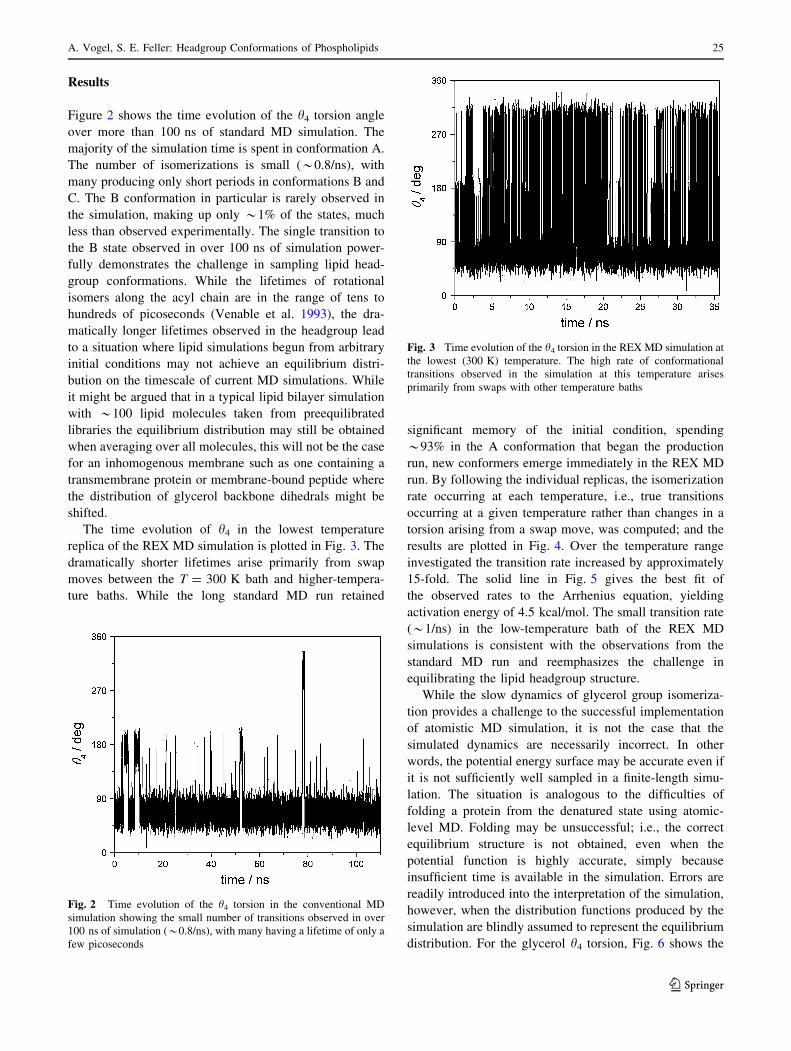
The time evolution of h4 in the lowest temperature
replica of the REX MD simulation is plotted in Fig. 3. The
dramatically shorter lifetimes arise primarily from swap
moves between the T = 300 K bath and higher-tempera-
ture baths. While the long standard MD run retained
significant memory of the initial condition, spending
*93% in the A conformation that began the production
run, new conformers emerge immediately in the REX MD
run. By following the individual replicas, the isomerization
rate occurring at each temperature, i.e., true transitions
occurring at a given temperature rather than changes in a
torsion arising from a swap move, was computed; and the
results are plotted in Fig. 4. Over the temperature range
investigated the transition rate increased by approximately
15-fold. The solid line in Fig. 5 gives the best fit of
the observed rates to the Arrhenius equation, yielding
activation energy of 4.5 kcal/mol. The small transition rate
(*1/ns) in the low-temperature bath of the REX MD
simulations is consistent with the observations from the
standard MD run and reemphasizes the challenge in
equilibrating the lipid headgroup structure.
While the slow dynamics of glycerol group isomeriza-
tion provides a challenge to the successful implementation
of atomistic MD simulation, it is not the case that the
simulated dynamics are necessarily incorrect. In other
words, the potential energy surface may be accurate even if
it is not sufficiently well sampled in a finite-length simu-
lation. The situation is analogous to the difficulties of
folding a protein from the denatured state using atomic-
level MD. Folding may be unsuccessful; i.e., the correct
equilibrium structure is not obtained, even when the
potential function is highly accurate, simply because
insufficient time is available in the simulation. Errors are
readily introduced into the interpretation of the simulation,
however, when the distribution functions produced by the
simulation are blindly assumed to represent the equilibrium
distribution. For the glycerol h4 torsion, Fig. 6 shows the
Fig. 2 Time evolution of the h4 torsion in the conventional MD
simulation showing the small number of transitions observed in over
100 ns of simulation (*0.8/ns), with many having a lifetime of only a
few picoseconds
Fig. 3 Time evolution of the h4 torsion in the REX MD simulation at
the lowest (300 K) temperature. The high rate of conformational
transitions observed in the simulation at this temperature arises
primarily from swaps with other temperature baths
A. Vogel, S. E. Feller: Headgroup Conformations of Phospholipids 25
123

distribution of conformers observed in the REX MD and
standard MD simulations. The plot shows that the calcu-
lated histograms differ significantly from one another with
the relative populations in different orders, even though
both simulations employed the identical potential energy
function. Especially poorly sampled is the B conformation
in the standard MD run, where it makes up only *1%,
while the REX MD spends *18.5% in this state.
The results in Fig. 6 clearly show that a conventional
simulation of 100 ns is insufficient to generate an equi-
librium distribution of conformers, but it must also be
noted that the REX MD simulations are more computa-
tionally expensive per unit of simulation time because they
involve integrating the equations of motion of many sys-
tems. Thus, one must compare the computational cost of
running an ensemble of, e.g., 20 exchanging replicas for a
short period with the cost of running a single system for a
long period. Figure 7 demonstrates the timescale required
for convergence in the REX MD simulation. While the
simulation time needed is relatively short, e.g., at approx-
imately 25 ns reasonable convergence is obtained, this
required 500 ns of total simulation time for the present case
Fig. 4 Transition rates for the h4 torsion in the REX MD simulation
as a function of temperature showing greater than order of magnitude
acceleration in conformational transitions. The transition rates
reported here are actual conformational changes, i.e., not changes
arising from swaps between baths
Fig. 5 Arrhenius plot of natural log of transition rates versus inverse
Kelvin temperature (using data from Fig. 4), showing activation
energy of *4.5 kcal/mol
Fig. 6 Probability distribution for the h4 torsion observed in the
REX MD and conventional MD simulations at 300 K, showing
significant differences in the conformer distributions, particularly the
frequency of observing the B conformation
Fig. 7 Cumulative probability distribution of the h4 torsion in the
REX MD simulation at the lowest (300 K) temperature. Compared to
experiment, the A conformation is overrepresented in the simulation,
while the B conformation is underrepresented (though much closer to
experiment than was observed in the conventional MD calculation)
26 A. Vogel, S. E. Feller: Headgroup Conformations of Phospholipids
123

of 20 replicas. The time series for the conventional simu-
lation shown in Fig. 2 suggests that even after 500 ns of
conventional MD the equilibrium distribution would not
have converged. Another telling comparison is between the
cumulative probability distribution from the REX MD
simulation at 5 ns and the conventional result based on
100 ns. Even though every replica was started in the lowest
probability conformation (C), in just a few nanoseconds a
very reasonable distribution function is obtained. It also
should be noted that scaling on a parallel computer is
excellent with a REX simulation; thus, this approach can
make good use of multiple processor systems. A potential
downside for REX when simulating membrane systems is
that the number of replicas must increase with system size
in order to obtain reasonable swap probabilities; and given
that membrane systems typically contain many atoms, this
is a considerable challenge.
Conclusions
We have focused here on a single degree of freedom, namely,
the h4 torsion angle found in the glycerol backbone region of
a phospholipid, to illustrate the enormous challenge in
determining the equilibrium conformer distribution in a
molecule that possesses multiple rotational isomers having
lifetimes that are long on the timescale of atomistic MD
simulations. When compared to the other major classes of
biomolecules, phospholipids are generally considered small
and flexible because they consist of just a few monomeric
units, e.g., a headgroup and two acyl chains, while proteins
and DNA are orders of magnitude larger in terms of the
number of monomers they contain. It has been shown that not
only large proteins (Grossfield and Zuckerman 2009) but
even small peptides (Vogel et al. 2010) pose considerable
challenges for conformational sampling. Less appreciated is
a property that the much smaller phospholipids nonetheless
share with proteins and DNA, namely, that sampling their
backbone conformations is a huge challenge for conven-
tional MD simulations. One outcome of the present study is
to demonstrate clearly and to quantify the difficulty in
sampling lipid backbone conformations. This is important in
particular for the setup of membrane simulations that most
often rely on libraries of preequilibrated lipid structures (Jo
et al. 2007). Our results demonstrate that equilibration sim-
ulations of tens of nanoseconds that were typical in the past
are not sufficient for complete sampling of lipid backbone
conformations. A membrane consisting of lipid structures
from such relatively short preequilibrated lipid structures
will at the beginning still lack a good distribution of these
backbone conformations. Therefore, such libraries should be
equilibrated either by very long classical simulations (pos-
sibly at high temperatures) or by approaches that improve
sampling speed such as REX (Sugita and Okamoto 1999) or
accelerated MD (Hamelberg et al. 2004) simulations. A
second result is to show that simulations of monomeric
phospholipids are potentially valuable in the refinement of
potential energy parameters, i.e., force fields, for molecular
simulations of lipid bilayer membranes. For example, it
appears that the B conformation is less prevalent in our
simulations than the NMR experiments (Hauser et al. 1988)
indicate. This is indicative of inaccuracies in the torsional
potential employed in this force field, and the most recent
refinement of the CHARMM lipid force field (Klauda et al.
2010) alters the h4 torsional potential to make the B con-
formation more favorable. While their approach was to
analyze NMR deuterium order parameters (and to carry out
high-level quantum chemical computations on the relative
gas-phase energies of model compounds containing this
torsion), it is interesting to note that the analysis of mono-
meric lipids may have been a more efficient approach for this
important element of the force field.
Acknowledgments S. E. F. thanks the National Science Foundation
for support under award MCB0950258. The authors thank Richard
Venable for providing the scripts for implementing REX MD using
CHARMM.
References
Brandt EG, Edholm O (2009) Dynamic structure factors from lipid
membrane molecular dynamics simulations. Biophys J 96:
1828–1838
Brooks BR, Bruccoleri RE, Olafson BD, States DJ, Swaminathan S,
Karplus M (1983) CHARMM—a program for macromolecular
energy, minimization, and dynamics calculations. J Comput
Chem 4:187–217
Feller SE, MacKerell AD (2000) An improved empirical potential
energy function for molecular simulations of phospholipids.
J Phys Chem B 104:7510–7515
Feller SE, Zhang YH, Pastor RW, Brooks BR (1995) Constant-
pressure molecular-dynamics simulation—the Langevin piston
method. J Chem Phys 103:4613–4621
Gawrisch K, Ruston D, Zimmerberg J, Parsegian VA, Rand RP,
Fuller N (1992) Membrane dipole potentials, hydration forces,
and the ordering of water at membrane surfaces. Biophys J
61:1213–1223
Grossfield A, Zuckerman DM (2009) Quantifying uncertainty and
sampling quality in biomolecular simulations. In: Wheeler R,
Spellmeyer D (eds) Annual reports in computational chemistry.
Elsevier, Amsterdam, pp 23–48
Hamelberg D, Mongan J, McCammon JA (2004) Accelerated
molecular dynamics: a promising and efficient simulation
method for biomolecules. J Chem Phys 120:11919–11929
Hauser H, Guyer W, Pascher I, Skrabal P, Sundell S (1980) Polar
group conformation of phosphatidylcholine. Effect of solvent
and aggregation. Biochemistry 19:366–373
Hauser H, Pascher I, Sundell S (1988) Preferred conformation and
dynamics of the glycerol backbone in phospholipids. An NMR
and X-ray single-crystal analysis. Biochemistry 27:9166–9174
Hoover WG (1985) Canonical dynamics—equilibrium phase-space
distributions. Phys Rev A 31:1695–1697
A. Vogel, S. E. Feller: Headgroup Conformations of Phospholipids 27
123

Israelachvili JN (1977) Refinement of fluid-mosaic model of mem-
brane structure. Biochim Biophys Acta 469:221–225
Jo S, Kim T, Im W (2007) Automated builder and database of protein/
membrane complexes for molecular dynamics simulations. PloS
One 2:e880
Klauda JB, Venable RM, Freites JA, O’Connor JW, Tobias DJ,
Mondragon-Ramirez C, Vorobyov I, MacKerell AD, Pastor RW
(2010) Update of the CHARMM all-atom additive force field for
lipids: validation on six lipid types. J Phys Chem B 114:7830–7843
Lyubartsev AP, Rabinovich AL (2011) Recent development in
computer simulations of lipid bilayers. Soft Matter 7:25–39
Marrink SJ, de Vries AH, Tieleman D (2009) Lipids on the move:
simulations of membrane pores, domains, stalks and curves.
Biochim Biophys Acta 1788:149–168
Ryckaert JP, Ciccotti G, Berendsen HJC (1977) Numerical integration
of Cartesian equations of motion of a system with constraints—
molecular-dynamics of n-alkanes. J Comput Phys 23:327–341
Schlenkrich M, Brickmann J, MacKerell AD, Karplus M (1996) An
empirical potential energy function for phospholipids: criteria
for parameter optimization and applications. In: Merz KM, Roux
B (eds) Biological membranes: a molecular perspective from
computation and experiment. Birkhauser, Boston, pp 31–81
Sugita Y, Okamoto Y (1999) Replica-exchange molecular dynamics
method for protein folding. Chem Phys Lett 314:141–151
Sundaralingam M (1972) Molecular structures and conformations of
the phospholipids and sphingomyelins. Ann N Y Acad Sci 195:
324–355
Venable RM, Zhang YH, Hardy BJ, Pastor RW (1993) Molecular-
dynamics simulations of a lipid bilayer and of hexadecane—an
investigation of membrane fluidity. Science 262:223–226
Vogel A, Reuther G, Roark MB, Tan KT, Waldmann H, Feller SE,
Huster D (2010) Backbone conformational flexibility of the lipid
modified membrane anchor of the human N-Ras protein
investigated by solid-state NMR and molecular dynamics
simulation. Biochim Biophys Acta 1798:275–285
Wiener MC, White SH (1992) Structure of a fluid dioleoylpho-
sphatidylcholine bilayer determined by joint refinement of X-ray
and neutron-diffraction data. 3. Complete structure. Biophys J
61:434–447
28 A. Vogel, S. E. Feller: Headgroup Conformations of Phospholipids
123