HCD_2013_Akron Perception
49
-
Upload
upali-nanda -
Category
Design
-
view
56 -
download
0
Transcript of HCD_2013_Akron Perception

#HCDCon

Perception is Real;Perception is Reality
Understanding perceptual realities to resolve human factors/change
management issues
Jennie Evans, RN, BS, LEED AP, EDAC, Vice President, HKS ArchitectsMeredith Slosberg, EMBA, Deployment Leader, Akron Children's Hospital
Upali Nanda, PhD, EDAC, Vice President, Director of Research. Executive Director, CADRE

Agenda
• Setting the Stage
• Perception: What is it? Why it matters…
• Staff Perception of Design
• Tools to Use

Objectives
Establish an understanding of:
– The importance of perception and the need to address it in the design approach
– How nurses’ perception to certain design attributes can affect operational efficiency and team work
– How to recognize resistant behaviors and how to address them on your project
– Tools that can be applied to a design project, your team, or within your firm

Akron Children’s Hospital
275,000 sf patient care tower• 30-room emergency department
• 72-bed neonatal intensive care
• 6-OR outpatient surgery center
• Shell space: maternal/ fetal

Guiding Principles
• Patient-centered healing environment
• Multi-disciplinary approach to care
• Ability to recruit and retain the highest quality physicians
• Facility design with life cycle and operational costs in mind
• Facility that is a beacon to the community
• Organization that supports the future of healthcare delivery
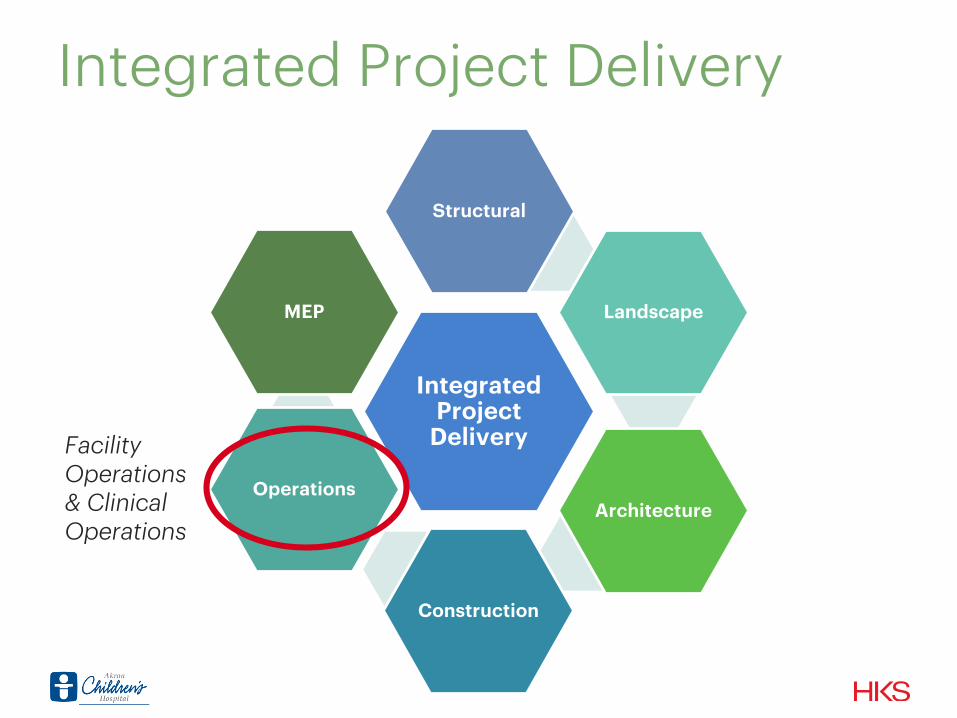
Integrated Project Delivery
Integrated Project
Delivery
Structural
Landscape
Architecture
Construction
Operations
MEP
Facility Operations & Clinical Operations

Integrated Clinical Operations
4 Workshops Per Team + Design
• 20 – 25 design team members– Physicians
– Nurses
– Ancillary
– Support
• Staff lean training
• Consultant Lean training
Integrated Operations
Rehabilitative Services
Materials Management
EVS
Pharmacy
Lab
Respiratory

Step 1 – Value Stream Mapping
Value Stream Mapping Extraordinaire
• Done in advance of the workshops
• Dedicated operationalimprovement staff(Center of Operational Excellence)

Step 2: 3P Event – Paper Dolls
Integrating Process into Design
• Draft space program
• Stacking
• Translated the value stream map into design
• 7 revisions
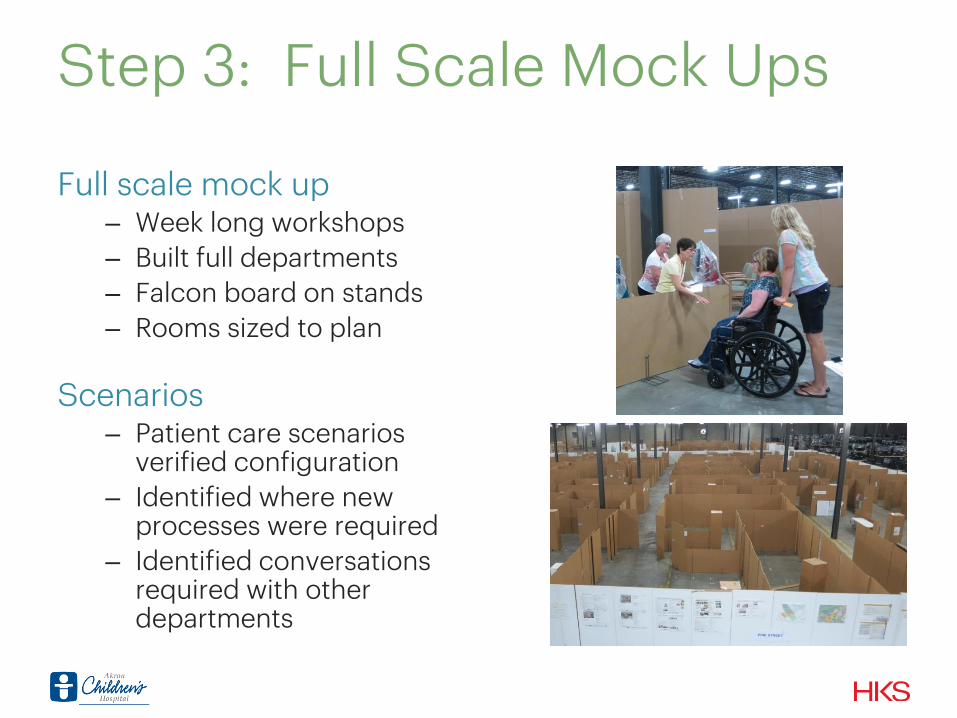
Step 3: Full Scale Mock Ups
Full scale mock up– Week long workshops
– Built full departments
– Falcon board on stands
– Rooms sized to plan
Scenarios– Patient care scenarios
verified configuration
– Identified where new processes were required
– Identified conversations required with other departments

Process Value Add
1. Understand consequences, design choices and competing priorities
2. Understand space and choice in design outcome
3. Understand processes and initiate change management
4. Several people understand and communicate the future state
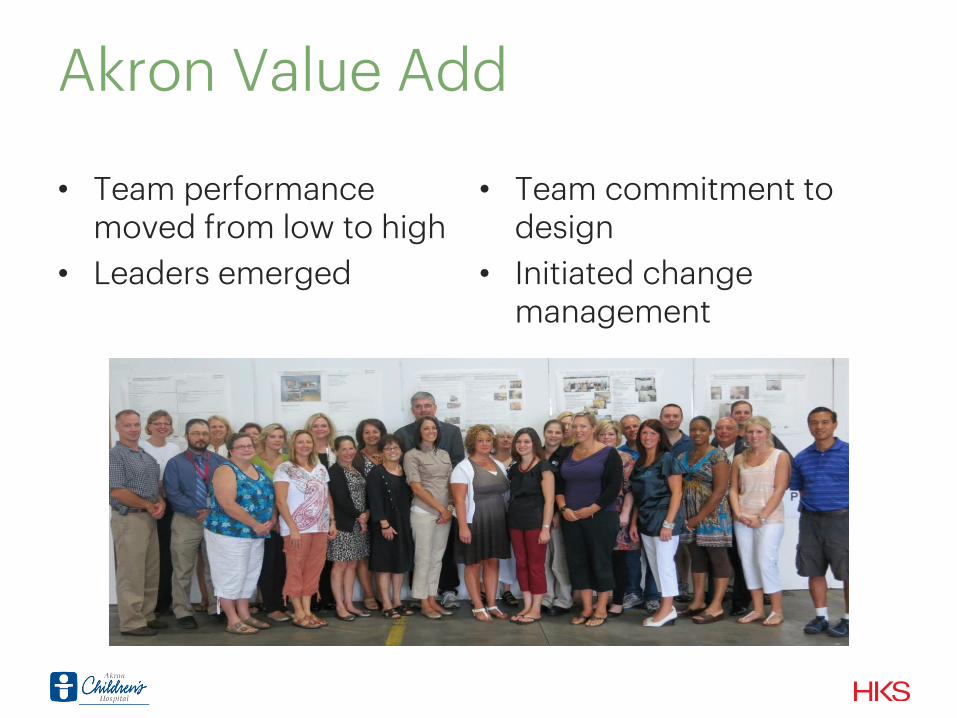
Akron Value Add
• Team performance moved from low to high
• Leaders emerged
• Team commitment to design
• Initiated change management

With the best intentions in design…Why is operationalizing still a challenge?
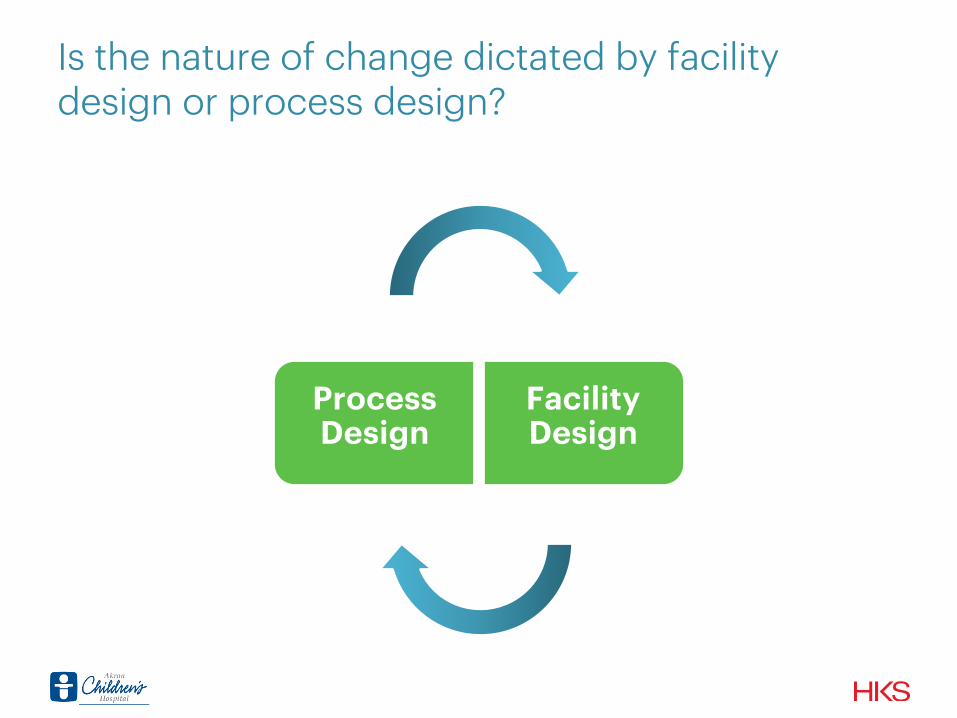
Is the nature of change dictated by facility design or process design?
Process Design
Facility Design

PROCESS DESIGN
NEED FOR PATIENT and family privacy and increased individual MONITORING
DE-CENTRALIZED NURSING STATION and single rooms versus arena rooms
DESIGN PROCESS
DE-CENTRALIZED NURSING STATION and single patient rooms
CHANGE IN SOCIAL INTERACTION and dailycommunication BETWEEN NURSES
PROCESS DESIGN
CHANGE IN SOCIAL INTERACTION and dailycommunication BETWEEN NURSES
SOCIAL HUBS / BREAK ROOMS ON THE UNIT/reliable, easy to use technology

Perception
Facility
Design
Process
Design

Perception (from the Latin perceptio, percipio) is the organization, identification, and interpretation of sensory information in order to represent and understand the environment. (wiki)
Perception is the lens throughwhich we see the world


Change starts with a perception of its need, so a wrong initial perception is the first barrier to change
http://www.uv.es/~pardoman/resistencias.PDF
Change and Perception

• Changes in the workplace naturally create uncertainty and can be emotionally challenging
• Nurses often feel that change is imposed on them and their views are not taken into consideration. This perception does little to empower them to own changes occurring and adapt behaviors to sustain improvements
(Bowers, 2011)
Source: Press Ganey comparison of customer satisfaction and employee satisfaction scores of 18 hospitals in their database
Change and Perception

1. Myopia or inability of the company to look into the future with clarity
2. Denial or Refusal to accept any information not expected / desired
3. Perpetuation of ideas- the tendency to go with the present thoughts though the situation has changed
4. Implicit assumptions
5. Communication barriers
6. Organizational silence
http://www.uv.es/~pardoman/resistencias.PDF
Resistance to Change
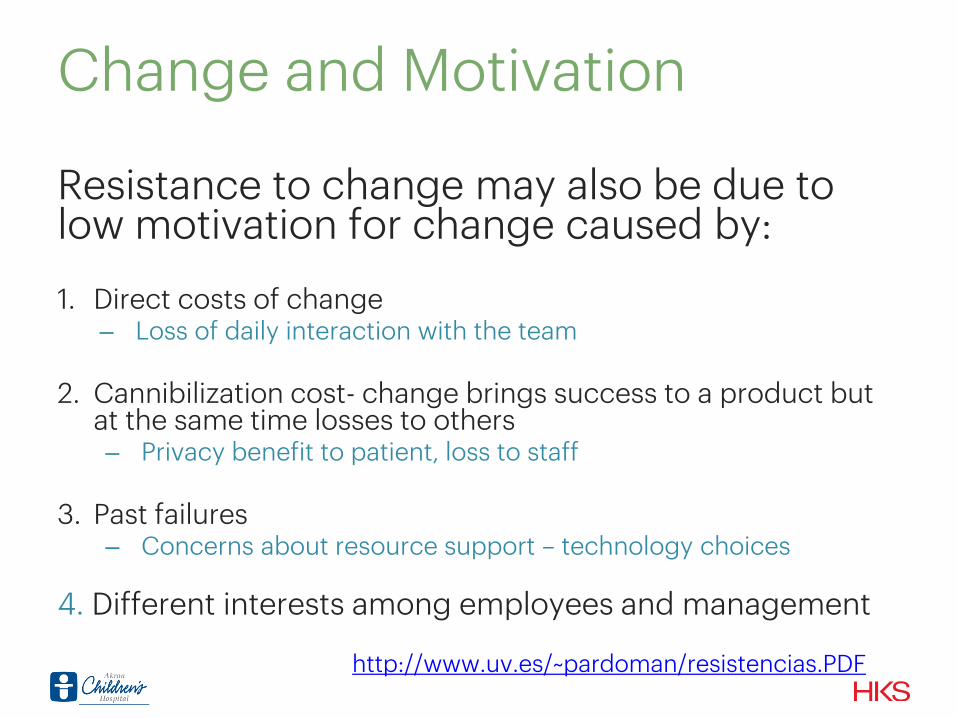
Change and Motivation
Resistance to change may also be due to low motivation for change caused by:
1. Direct costs of change– Loss of daily interaction with the team
2. Cannibilization cost- change brings success to a product but at the same time losses to others– Privacy benefit to patient, loss to staff
3. Past failures– Concerns about resource support – technology choices
4. Different interests among employees and management
http://www.uv.es/~pardoman/resistencias.PDF

Driving and Resisting ForcesA Force Field Analysis of IT change
1. Participation2. Communication3. Competency
1. Fear2. Lack of skill
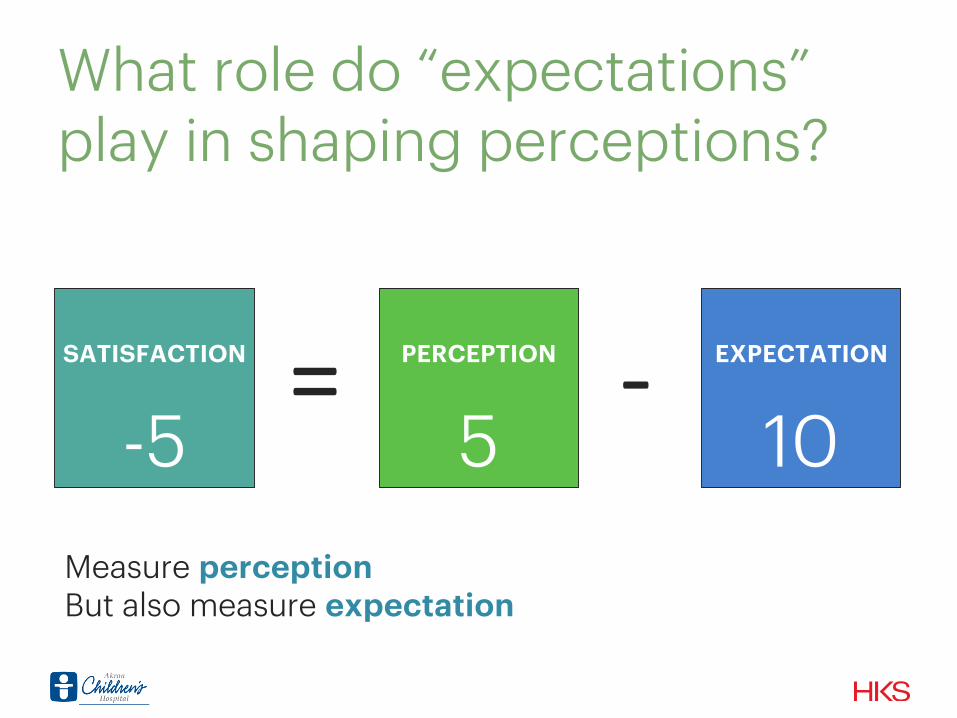
What role do “expectations” play in shaping perceptions?
Measure perceptionBut also measure expectation
SATISFACTION
-5
PERCEPTION
5
EXPECTATION
10= -

Expectation SurveyPulse-point surveys at every 4 months – till 6 months post-occupancy
Involvement Expectation Perception

Akron Expectation Survey
30%
50%
19%
1%
How prepared do you feel to work in the new environment
Not at all Little bit Moderately Very much so

Expectation SurveyKnowledge of New Environment
None Low Medium High Very highRatingCount
Level of involvement in the new design
27.0% (10)32.4% (12)
13.5% (5)16.2% (6)
10.8% (4) 37
Level of knowledge about the new environment
2.7% (1) 21.6% (8) 48.6% (18)21.6% (8)
5.4% (2) 37
Level of knowledge about the new processes regarding patient care, support and ancillary services?
11.1% (4)58.3% (21)
19.4% (7) 8.3% (3)2.8% (1) 36

Expectation SurveyKey Expectations
N IC U
RA
TIN
G
INV
OL
VE
ME
NT
KN
OW
LE
DG
E-E
NV
IRO
NM
EN
T
KN
OW
LE
DG
E-P
RO
CE
SS
ES
PR
EP
AR
ED
INV
OL
VE
-AD
AP
T
EX
PE
CT
-EF
FIC
IEN
CY
EX
PE
CT
-MA
INT
EN
AN
CE
&am
p;C
LE
AN
ING
EX
PE
CT
-CO
MM
UN
ICA
TIO
N
EX
PE
CT
-PA
TIE
NT
EX
PE
RIE
NC
E
EX
PE
CT
-PA
TIE
NT
SA
FE
TY
EX
PE
CT
-FA
MIL
Y E
XP
ER
IEN
CE
EX
PE
CT
-ST
AF
F E
XP
ER
IEN
CE
EX
PE
CT
-DIA
GN
OS
TIC
-CO
NN
EC
TIO
N
EX
PE
CT
-AC
CE
SS
-SU
PP
LIE
S
EX
PE
CT
-ST
OR
AG
E-S
UP
PL
IES
EX
PE
CT
-PA
TIE
NT
HA
ND
LIN
G
EX
PE
CT
-CO
LL
AB
OR
AT
ION
EX
PE
CT
-RE
DU
CE
D-N
OIS
E
EX
PE
CT
-RE
DU
CE
D-S
TR
ES
S
0
2
4
6

Expectation SurveyThe relationship between involvement and expectation
Involvement
Expectation
Perception
INVOLVEMENT IN DESIGN PROCESS SIGNIFICANTLY CORRELATED TO KNOWLEDGE OF ENVIRONMENT AND KNOWLEDGE OF PROCESSES. NOT CORRELATED TO HOW PREPARED NURSES FEEL.
LOWER EXPECTATIONS FOR STAFF CONCERNS COMPARED TO PATIENT CONCERNS
INVOLVEMENT IN DESIGN HIGHLY CORRELATED TO THE FOLLOWING:
EXPECTATION OF EFFICIENCYEXPECTATION OF ACESS TO SUPPLIESEXPECTATION OF PATIENT HANDLINGEXPECTATION OF IMPROVED COLLABORATIONEXPECTATION OF PATIENT SAFETY
INVOLVMENT IN DESIGN NOT CORELATED TO PATIENT EXPERIENCE AND FAMILY EXPERIENCE RATINGS

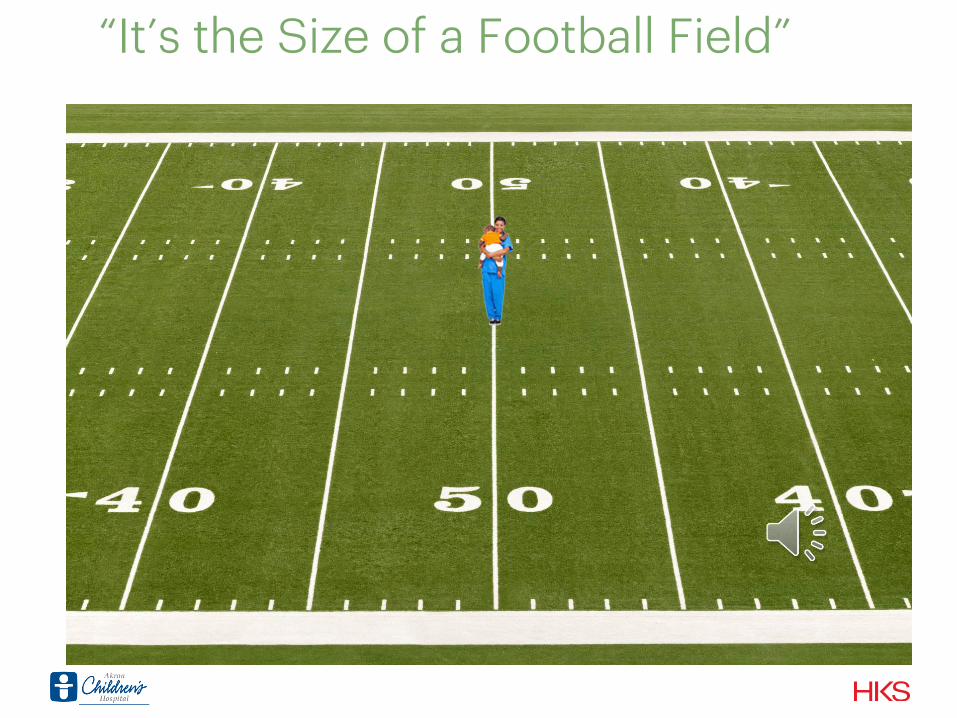
“It’s the Size of a Football Field”

Leading Transition During Change
Impact on people

Transition During ChangeImpact on People
progress
productivity(effort)
project management timeline
human response to change
GOAL
change management area of impact
endings exploration
new beginnings

Transition During Change Three Themes
1. Actively solicit staff and provider voices beyond the leadership level throughout process design
2. Manage expectations
3. Close gap between perception and reality

All 3 ThemesLeadership Training
Emergency Services
Outpatient Surgery
NICU

Actively Solicit Staff and Provider Voices

THEMES – Emergency Medicine
Leaders Should
• Get more involvement of staff
Hope We Can
• See floor plan
• Have mock trials
• Trial, trial, trial
• Orient
• Spend time in new space
THEMES - NICU
Leaders Should
• Address staffing concerns
• Get more nursing voice
Hope We Can
• Get familiar with new space
• Work on processes
• Investigate new unit
• Spend time in new unit
• Trial equipment
• Trial mock assignments
Expectation SurveyPulse Point Surveys- Every 4 months till 6 months after occupancy

Focused Group, Focused Voice
Fears• Loneliness
• Lack of ready help from fellow nurses
• Increased dependence on technology
• Looking incompetent for asking for help
Leadership Advocacy• Communication technology
• Simulation time
• Parent/family expectations

Manage Expectations

Manage Expectations
Dependability Family Teamwork Respect Flexibility
• Productivity
• Strength
• Happiness
• Passionate
• Health
• Faith
• Passionate
• Courage
• Positive Perseverance
• UnexpectedDelights
• Strong Work Ethic
• Honest
• Trust
• Truth
• Manners
• Authenticity
• Transparent
• True to yourself
• Compassionate
• Loyalty
• Integrity
• Courage
• Passionate
• Creativity
• Open-minded
• Seeking new learning opportunities
We Love Children! Pediatric Environment is Very Satisfying
Friendly Culture @ ACH
• Love of children
• Positive outcomes for children
• Seeing children melts your heart
• Help kids
• Support families so they don’t feel alone
• Voice for children
• Get to be a “big kid”
• Save a kid’s life
• Culture vs. Adult – more teamwork here
• We get to fix things for others
• Problem-solvers
• Feel connected to bottom line –helping families and children
• Engaging families
• MDs actually talk to you
• Someone will always help you
• Impressed by friendly staff/surgeons
• Warm, welcoming team
• Try to do the right thing all of the time
Welcoming Clean Efficient
• “Can I help you with this patient?”
• Friendly
• People smiling
• Kids laughing
• Nervous parents feel like only their child is there today
• Teamwork
• Upbeat, positive, friendly, welcoming, smiling, laughing
• Cooperative, calm parents
• Happy to be in a good facility
• Clean
• Smells clean
• Bright
• Uncluttered
• Efficient, but unrushed
• Nice pace
• Organized
• Quiet with a bit of crying
• Awesome huddle board
• Busy – controlled
Key Behavioral Indicators
1. Make eye contact, smile and acknowledge all team members, patients and families.
2. Give and accept constructive feedback from all team members.
3. Actively engage each other in creating a positive patient experience through continuous process improvement.
3 Promises Master Plan Guiding Principles

Manage Expectations
Lean Six SigmaEducation

Manage ExpectationsCommunication: Timeline, Huddles, Ambassadors, Interactive Boards

Close The Gap Between Perception and Reality

Trialing

Close the Gap Between Perception and Reality
Creative reality checks,orientation, simulation

Closing The Gap early…..
• Facility mock-ups MANDATORY for a much larger group of staff and providers– Not voluntary – address clinical culture changes
• Make future CARE DELIVERY model much more widely disseminated earlier to all staff and providers impacted by the design
• Have designers ADVOCATE for a design that blends a little more employee satisfaction with patient experience as the two are intertwined in a successful patient experience

Perception
Facility
Design
Process
Design
Listen to Voices Manage Expectations Close Gap between Perception & Reality
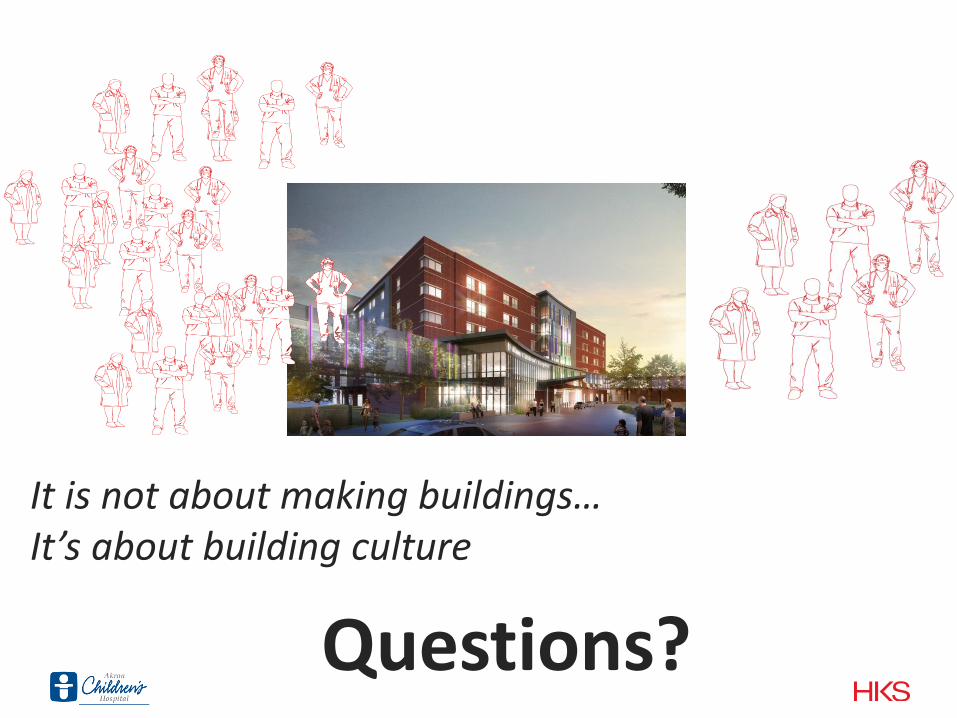
It is not about making buildings… It’s about building culture
Questions?