Hazards in Anchorage - Muni
67
Anchorage All-Hazard Mitigation Plan October 2004 4-1 CHAPTER 4 HAZARDS IN ANCHORAGE One of the requirements of a hazard mitigation plan is that is describes the hazards that affect a jurisdiction. This chapter profiles the hazards that occur in Anchorage by identifying each hazard’s location, extent, previous occurrences, and the probability of future events. Hazard mitigation plans are also required to summarize the vulnerability to the hazards. The vulnerability information was calculated by identifying the parcels that intersect each of the hazard zones. Some notes about this method are: • Not all the hazard GIS layers used to perform this analysis cover the entire MOA. Most only include a portion of the Municipality. (Parcels could be at risk but the risk area has not been mapped and included in the GIS yet.) • The taxable value is based on 2003 MOA tax assessor data • Using the taxable Value underestimates the vulnerability because: - Some parcels, such as schools, are not taxed and therefore do not have a taxable value. - Some parcels are treated as economic units (separate parcels that are treated as 1 for tax purposes) and do not have taxable values listed. - Taxable value does not consider the value of the contents. - The taxable value is the sum on the land and building taxable values. This is different from the total taxable value listed in the tax assessor’s file because tax exemptions have been applied to those totals. • If a parcel was in multiple risk areas, the entire parcel was considered to be in the highest risk area (i.e., no partial parcels). However, depending on how much of the parcel is in the hazard zone and site specific factors, existing or future structures may not be at risk. • The number unidentified parcels could be wrong due to data issues (i.e., extra polygons in the GIS file). It is important to remember that the information listed in this chapter is meant to provide an overview of each hazard. While based on best available information, the information is for planning purpose and should not be used for purposes which it was not intended.
Transcript of Hazards in Anchorage - Muni

Anchorage All-Hazard Mitigation Plan October 2004
4-1
C H A P T E R 4
H A Z A R D S I N A N C H O R A G E One of the requirements of a hazard mitigation plan is that is describes the hazards that affect a jurisdiction. This chapter profiles the hazards that occur in Anchorage by identifying each hazard’s location, extent, previous occurrences, and the probability of future events. Hazard mitigation plans are also required to summarize the vulnerability to the hazards. The vulnerability information was calculated by identifying the parcels that intersect each of the hazard zones. Some notes about this method are:
• Not all the hazard GIS layers used to perform this analysis cover the entire MOA. Most only include a portion of the Municipality. (Parcels could be at risk but the risk area has not been mapped and included in the GIS yet.)
• The taxable value is based on 2003 MOA tax assessor data • Using the taxable Value underestimates the vulnerability because:
- Some parcels, such as schools, are not taxed and therefore do not have a taxable value.
- Some parcels are treated as economic units (separate parcels that are treated as 1 for tax purposes) and do not have taxable values listed.
- Taxable value does not consider the value of the contents. - The taxable value is the sum on the land and building taxable
values. This is different from the total taxable value listed in the tax assessor’s file because tax exemptions have been applied to those totals.
• If a parcel was in multiple risk areas, the entire parcel was considered to be in the highest risk area (i.e., no partial parcels). However, depending on how much of the parcel is in the hazard zone and site specific factors, existing or future structures may not be at risk.
• The number unidentified parcels could be wrong due to data issues (i.e., extra polygons in the GIS file).
It is important to remember that the information listed in this chapter is meant to provide an overview of each hazard. While based on best available information, the information is for planning purpose and should not be used for purposes which it was not intended.

Anchorage All-Hazard Mitigation Plan October 2004
4-2
4 . 1 N A T U R A L H A Z A R D S Natural hazards are unexpected or uncontrollable natural events caused by nature, such as earthquakes, floods, and volcanic eruptions. In some cases, although rare, they can be human triggered, such as a human-triggered avalanche. The majority of the following information describing these hazards is from the State Hazard Mitigation Plan and is used by permission from the ADHS&EM. 4 . 1 . 1 E A R T H Q U A K E S An earthquake is the shaking of the earth’s surface. Most large earthquakes are caused by the sudden release of accumulated stresses as the earth’s crustal plates move against each other. Other earthquakes occur along faults that lie within these plates. The dangers associated with earthquakes include ground shaking and surface faulting as well as secondary hazards, such as avalanches or landslides. Ground shaking is responsible for most of the damage. Ground shaking is the result of the three classes of seismic waves generated by an earthquake. Primary waves (P waves) are the first waves, often felt as a sharp jolt. Secondary, or shear, waves (S waves) are slower and usually have a side to side movement. They can be very damaging because structures are more vulnerable to horizontal than vertical motion. Surface waves are the slowest waves, but they can carry the bulk of the energy in a large earthquake. The intensity of the shaking is dependent on many factors including the magnitude of the quake, the geology of the area, distance from the epicenter, building design, and local construction practices. The amount of damage to buildings depends on how the specific characteristics of each incoming wave interact with the buildings’ height, shape, and construction materials. Surface faulting is the differential movement of the two sides of a fault. There are three general types of faulting – strike-slip, normal, and thrust (reverse). Strike-slip faults are where each side of the fault moves horizontally. Normal faults have one side dropping down relative to the other side. Thrust (or reverse) faults have one side
Three types of faults. Image courtesy of USGS.

Anchorage All-Hazard Mitigation Plan October 2004
4-3
moving up and over the fault relative to the other side. Secondary hazards Secondary effects from an earthquake include seismically-induced ground failure, snow avalanches, tsunamis, landslides, and infrastructure failure. These will be discussed in greater detail in other sections of the plan. Magnitude and Intensity Earthquakes are usually measured in terms of their magnitude and intensity. Magnitude is related to the amount of energy released during an event while
intensity refers to the effects on people and structures at a particular place. Earthquake magnitude is usually reported according to the standard Richter scale (ML) for small to moderate earthquakes. Large earthquakes, are reported according to the moment-magnitude scale (MW) because the standard Richter scale does not adequately represent the energy released by these large events.
Intensity is usually reported using the Modified Mercalli Intensity Scale (MMI). This scale has 12 categories ranging from not felt to total destruction. Table 4.1 relates the MMI value to the Richter scale. Different MMI values can be recorded at different locations for the same event depending on local circumstances such as distance from the epicenter or building construction practices. Soil conditions are a major factor in determining an earthquake’s intensity, as areas with unconsolidated fill will have more damage than areas with shallow bedrock.
Richter Scale On the Richter scale, magnitude is expressed in whole numbers and decimals. A 5.0 earthquake is a moderate event; a 6.0 characterizes a strong event; a 7.0 is a major earthquake; and a great earthquake exceeds 8.0. The scale is logarithmic and open-ended.

Anchorage All-Hazard Mitigation Plan October 2004
4-4
Table 4.1 Relationship of the Mercalli Scale to the Richter Scale Scale
Mercalli Richter Description
I Not felt.
II Felt by persons at rest, on upper floors, or favorably placed.
III 0-4.3
Felt indoors. Hanging objects swing. Vibration like passing of light trucks. Duration estimated. May not be recognized as an earthquake.
IV
Hanging objects swing. Vibration like passing of heavy trucks; or sensation of a jolt like a heavy ball striking the walls. Standing cars rock. Windows, dishes, doors rattle. Glasses clink. Crockery clashes. In the upper range of IV, wooden walls and frames creak.
V
4.3-4.8 Felt outdoors; direction estimated. Sleepers awakened. Liquids disturbed, some spilled. Small unstable objects displaced or upset. Doors swing, close, open. Shutters, pictures move. Pendulum clocks stop, start, change rate.
VI
Felt by all. Many frightened and run outdoors. Persons walk unsteadily. Windows, dishes, glassware broken. Knickknacks, books, etc., off shelves. Pictures off walls. Furniture moved or overturned. Weak plaster and masonry D cracked. Small bells ring (church, school). Trees, bushes shaken visibly, or heard to rustle.
VII
4.8-6.2 Difficult to stand. Noticed by drivers. Hanging objects quiver. Furniture broken. Damage to masonry D, including cracks. Weak chimneys broken at roof line. Fall of plaster, loose bricks, stones, tiles, cornices, also unbraced parapets and architectural ornaments. Some cracks in masonry C. Waves on ponds, water turbid with mud. Small slides and caving in along sand or gravel banks. Large bells ring. Concrete irrigation ditches damaged.
VIII
Steering of cars affected. Damage to masonry C; partial collapse. Some damage to masonry B; none to masonry A. Fall of stucco and some masonry walls. Twisting, fall of chimneys, factory stacks, monuments, towers, elevated tanks. Frame houses moved on foundations if not bolted down; loose panel walls thrown out. Decayed piling broken off. Branches broken from trees. Changes in flow or temperature of springs and wells. Cracks in wet ground and on steep slopes.
IX General panic. Masonry D destroyed; masonry C heavily damage, sometimes with complete collapse; masonry B seriously damaged. General damage to foundations. Frame structures, if not bolted, shifted off foundations. Frames racked. Serious damage to reservoirs. Underground pipes broken. Conspicuous cracks in ground. In alluviated areas, sand and mud ejected, earthquake fountains, sand craters.
X
6.2-7.3
Most masonry and frame structures destroyed with their foundations. Some well-built wooden structures and bridges destroyed. Serious damage to dams, dikes, embankments. Large landslides. Water thrown on banks of canals, rivers, lakes, etc. Sand and mud shifted horizontally on beaches and flat land. Rails bent slightly.
XI Rails bent greatly. Underground pipelines completely out of service.
XII 7.3-8.9 Damage nearly total. Large rock masses displaced. Lines of sight and level distorted. Objects thrown into the air.
Masonry A: Good workmanship, mortar, and design; reinforced, especially laterally, and bound together by using steel, concrete, etc.; designed to resist lateral forces. Masonry B: Good workmanship and mortar; reinforced, but not designed in detail to resist lateral forces. Masonry C: Ordinary workmanship and mortar; no extreme weaknesses like failing to tie in at corners, but neither reinforced nor designed against horizontal forces. Masonry D: Weak materials, such as adobe; poor mortar; low standards of workmanship; weak horizontally. Source: State of Alaska Hazard Mitigation Plan

Anchorage All-Hazard Mitigation Plan October 2004
4-5
Location The entire Municipality faces a significant threat from earthquakes, as there are at least three suspected active faults within 25 miles of Anchorage that have the potential to generate magnitude 7.5 earthquakes. One of these, the Castle Mountain Fault, produced a magnitude 5.7 earthquake near Sutton in 1984 and may have generated a magnitude 6.9 earthquake that shook Anchorage in 1933. The other two active faults are Bruin Bay Fault and Border Ranges Fault. Currently, the Alaska Division of Geologic and Geophysical Surveys (ADGGS) and University of Alaska Fairbanks-Geophysical Institute (UAF-GI) are working together on a seismic microzonation project for Anchorage. This project will combine geophysical and geological data to develop a better understanding of how the ground will react in an earthquake. Likelihood of Occurrence While it is impossible to know when the next earthquake will affect MOA, given the MOA’s seismic history, it is safe to assume that earthquakes will continue to occur. Map 4-1 shows the peak ground acceleration with a 10% probability of exceedance in 50 years; that represents events that are reasonably expected to occur. Peak ground acceleration (PGA) is one method to measure the strength of ground movements. Most of Anchorage has a peak ground acceleration of 30%g, while the southeast portion of the MOA has a value of 40%g. This means that Girdwood and Bird Creek could experience more ground movement. Map 4-2 shows the PGA with a 2% probability of exceedance in 50 years. For these rarer events, the entire MOA is considered to have a PGA of 60%g.
Peak Ground Acceleration
Peak ground acceleration (PGA) in percent of g with 10% probability of exceedance in 50 years represents the ground motions that can be reasonably expected in a 50 year period.
The acceleration values are the peak or maximum values expected during the earthquake. The "10% probability of exceedance in 50 years" refers to the fact that earthquakes are somewhat random in occurrence. One can not predict exactly whether an earthquake of a given size will or will not occur in the next 50 years.
PGA maps with a 10% probability of exceedance in 50 years means there is a 10% chance (1 chance in 10) that the the ground acceleration values shown on the map will be exceeded in a 50 year time period.

Anchorage All-Hazard Mitigation Plan October 2004
4-6
Historic Events 1964 Good Friday Earthquake The best known earthquake in Anchorage’s history is the March 27, 1964 Good Friday earthquake. This 9.2 MW earthquake is the largest ever recorded in North America and the second largest in the world. The shaking lasted between 4 and 5 minutes and was felt over a 7 million square mile area. This earthquake occurred at approximately 5:36 pm. The timing of the event may have saved many lives as several structures with the most damage, such as the Government Hill School, were unoccupied at this time. In 1973, the National Research Council observed that this event could have had 50 times the number of deaths and 60 times as much property damage if it had affected a more densely populated area during work/school hours (Combellick, 1985:6). The ground shaking caused a significant amount of ground deformation as well as triggering landslides and tsunamis. The Turnagain Heights landslide was the most damaging with over 100 homes being destroyed. Most of the fatalities associated with this event were actually caused by the resulting tsunamis, not the actual earthquake. Other events Small earthquakes occur frequently in the Anchorage area. The UAF-GI’s Alaska Earthquake Information Center (AEIC) keeps records about earthquakes in Alaska. A search of the AEIC database revealed that since 1900, there have been 12 events having a magnitude greater than 4.0 that have had an epicenter within the MOA boundary, including 2 earthquakes registering Richter magnitude 5 that occurred on Feb. 6, 2002. Map 4-3 shows the epicenters of earthquakes near MOA since 1900. Events with an epicenter outside MOA could impact MOA, depending on their location and the amount of energy released. Vulnerability As an earthquake could affect the entire Municipality, the entire MOA is represented in Table 4.2.
The Government Hill School after the 1964 Good Friday earthquake.

Anchorage All-Hazard Mitigation Plan October 2004
4-7
Table 4.2 Earthquake Vulnerability
Land Use # of
Parcels Taxable Value
(Land) Taxable Value
(Buildings) Total Residential 59,426 $3,066,038,500 $8,334,412,600 $11,398,571,591Commercial 3,419 $605,885,600 $1,579,095,500 $2,132,773,711Industrial 1,610 $180,641,800 $290,159,100 $469,225,809Institutional 702 $26,876,800 $188,839,300 $90,308,164Parks, Open Space & Recreation Areas 1,319 $107,600 $203,400 $311,000Transportation Related 419 $236,100 $165,900 $402,000Other 300 $352,000 $44,400 $307,600Vacant 10,326 $570,157,400 $450,103,500 $1,015,367,523Unidentified 4,325 $419,913,000 $924,182,300 $1,341,953,131Total 81,846 $4,870,208,800 $11,767,206,000 $16,449,220,529 4 . 1 . 2 W I L D F I R E In Alaska, the natural fire regime is characterized by a return interval of 50 to 200 years, depending on the vegetation type, topography, and location. The role of wildland fire as an important ecological process and natural change agent has been incorporated into the fire management planning process. The full range of fire management activities is exercised in Alaska to help achieve ecosystem sustainability, including its interrelated ecological, economic, and social consequences on firefighter and public safety and welfare, natural and cultural resources threatened, and the other values to be protected dictate the appropriate management response to the fire. Firefighter and public safety is always the first and overriding priority for all fire management activities. Fires are divided into the following categories for the purposes of this plan: • Structure fires – These originate in and burn a building, shelter or other
structure.
• Prescribed fires – These fires are ignited under predetermined conditions to meet specific objectives, to mitigate risks to people and their communities, and/or to restore and maintain healthy, diverse ecological systems.
• Wildland fires – These fires are any non-structure fires, other than
prescribed fires, that occur in the wildland. • Wildland Fire Use - A wildland fire functioning in its natural ecological role
and fulfilling land management objectives.

Anchorage All-Hazard Mitigation Plan October 2004
4-8
• Wildland-Urban Interface Fires – These are fires that burn within the line, area, or zone where structures and other human development meet or intermingle with undeveloped wildland or vegetative fuels. The potential exists in areas of wildland-urban interface for extremely dangerous and complex fire burning conditions which pose a tremendous threat to public and firefighter safety. The potential for wildland-urban interfaces fires is of primary concern in Anchorage.
The Fire Triangle The interaction of the heat, fuel, and oxygen is required for the creation and maintenance of any fire. Fire Behavior Fuel, weather, and topography influence wildland fire behavior. Wildland fire behavior can be erratic and extreme causing fire whirls and firestorms that can endanger the lives of the firefighters trying to suppress the blaze. Fuel1 Fuel determines how much energy the fire releases, how quickly the fire spreads, and how much effort is needed to contain the fire. The primary fuels in wildland fires are living and dead vegetation. Fuels differ in how readily they ignite and how hot or long they burn. This depends on the following characteristics: Moisture Content • the amount of water in a fuel
Size and Shape • Light fuels include grasses, shrubs, and tree leaves or needles (any fuel
having a diameter of approximately ½" or less). They burn rapidly and are quickly ignited because they are surrounded by oxygen.. Fires in light fuels spread quickly but burn out quickly and are easy to put out with the correct equipment. They are the primary fuels that carry fires and ignite homes in many wildfire situations.
• Heavy fuels, such as large tree branches, downed logs, and buildings, require more heat energy to ignite, but they burn longer and produce more heat once ignited. They are harder to extinguish.
Fuel Loading • the quantity of fuel in an area
Horizontal Continuity
1 adapted from Eli, 2003 and wildlandfire.com
The Fire Triangle. Image from Northern & Intermoununtain Regions of the US Forest Service

Anchorage All-Hazard Mitigation Plan October 2004
4-9
• The distribution of fuel particles or extent of the fuel bed, thus affecting a fire’s ability to sustain combustion and spread. It may be described as uniform (have a uniform pattern and distributed continuously across the ground, allowing a wildland fire to travel uninterrupted Include all fuels distributed continuously over the area. Areas containing a network of fuels which connect with each other to provide a continuous path for a fire to spread are also included in this category) or patchy (the fuel may be distributed unevenly in a patchy network, forcing the fire to travel over rocks and other barriers by wind-borne embers)
Vertical Arrangement • The relative heights of fuels above the ground and their vertical
continuity, which influences fire reaching various levels or strata. • Ground fuels- lie beneath the surface… roots, rotten buried logs etc.
All combustible materials lying beneath the surface • Surface fuels- lie on or immediately above the ground including
leaves, logs, low shrubs • Aerial fuels- located in the upper canopy such as standing trees. All
green and dead materials including tree branches, Weather Weather is the most variable and uncontrollable factor in wildland fire fighting. Weather includes temperature, relative humidity, wind, and precipitation. High temperatures and low humidity encourage fire activity while low temperatures and high humidity help retard fire behavior.
Warm temperature heats and dries the fuel and reduces the fuel’s moisture content.
Relatively Humidity is the ratio of the amount of moisture in the air to the amount which the air could hold at the same temp and pressure if it were saturated. High humidity is preferred while fighting a fire because it makes the fuels moist. Low humidity dries it out quicker. As relative humidity increases, fuel moisture increases.
Wind increases the supply of oxygen, influences the direction of the fire, dries fuels, carries sparks ahead of the main fire causing spot fires, moves heated air from convection heat transfer to downwind fuels. Wind also drives convective heat into adjacent fuels, influences spread direction and spotting, carriers moist air away replacing it with drier air, dries fuels, raises fuel moisture if the air contains moisture.
Precipitation increases the moisture content in light fuels making them harder to burn. It does not affect heavy fuels as much because the water isn’t absorbed as quickly.

Anchorage All-Hazard Mitigation Plan October 2004
4-10
Topography Topography directs the movement of air, which can also affect fire behavior. When the terrain funnels air, like what happens in a canyon, it can lead to faster spreading. Fire can also travel up slope quicker than it goes down. Burning material can roll down the slope and ignite fires below you. Slope orientation also influences fire behavior. Forests on southern or southwestern slopes (those hit by the sun) generally have lower humidity and higher temperatures than those on north or northeast slopes. Consequently, fire hazard is often higher on south and southwest facing hills. Location In 2001, Anchorage was declared a community-at-risk for wildfire by the US Department of Agriculture (USDA) Forest Service. According to the AFD, the factors contributing to Anchorage’s wildfire risk include:
• Mixed hardwood and conifer forests that burn readily in high fire danger conditions. White spruce trees have persistent branches that contribute to ladder fuels. Black spruce trees have a very low moisture content that allows them to burn easily when ambient weather conditions provide for low relative humidity, high temperatures, and dry duff layers in the soil.
• Residential and rural neighborhoods exist throughout forested stands that have been affected by the spruce bark beetle. In the MOA, this area extends over 85,000 acres. The dead trees resulting from beetle attacks contribute to forest fuel accumulations that create high risk for wildfire in your backyard.
• In a wildfire event, mutual aid resources to help the AFD may take an hour or more to arrive on site. Suppression resources from the Division of Forestry must travel to Anchorage from Palmer and other locations outside of the MOA.
• On the south Anchorage Hillside, Eagle River Valley, South Fork, and other sites around the MOA, there are limited water resources to help fight a wildland fire.
• Many neighborhoods in the MOA have limited ingress and egress routes for suppression apparatus to enter in and for residents to evacuate.
• The hilly topography throughout the wildland-urban interface areas contributes to increased rate of fire spread. Where the Miller’s Reach Fire of 1996 spread across mostly flat terrain and still burned over 400 structures, a wildfire in South Anchorage would spread even faster because fire spread rates increase with slope.
• The spring fire season is a dry time in Southcentral Alaska. Dry foliage on the trees and dead bluejoint grass burns readily soon after snow melts.

Anchorage All-Hazard Mitigation Plan October 2004
4-11
Neighborhood wildfire assessments have been performed in multiple areas. These assessments are considered works in progress and are re-evaluated throughout the fire season. The assessments contain an evaluation of the hazard; potential hazards/complications, such as power lines; potential staging areas for equipment; potential safety zones (to wait out passing flames); and potential evacuation sites. They exist for the following areas:
- Tudor Road to Abbott Road Including Far North Bicentennial Park
- Eagle River - Hiland Road, South Fork - DeArmoun Road to Potter Creek Heights - Chugiak
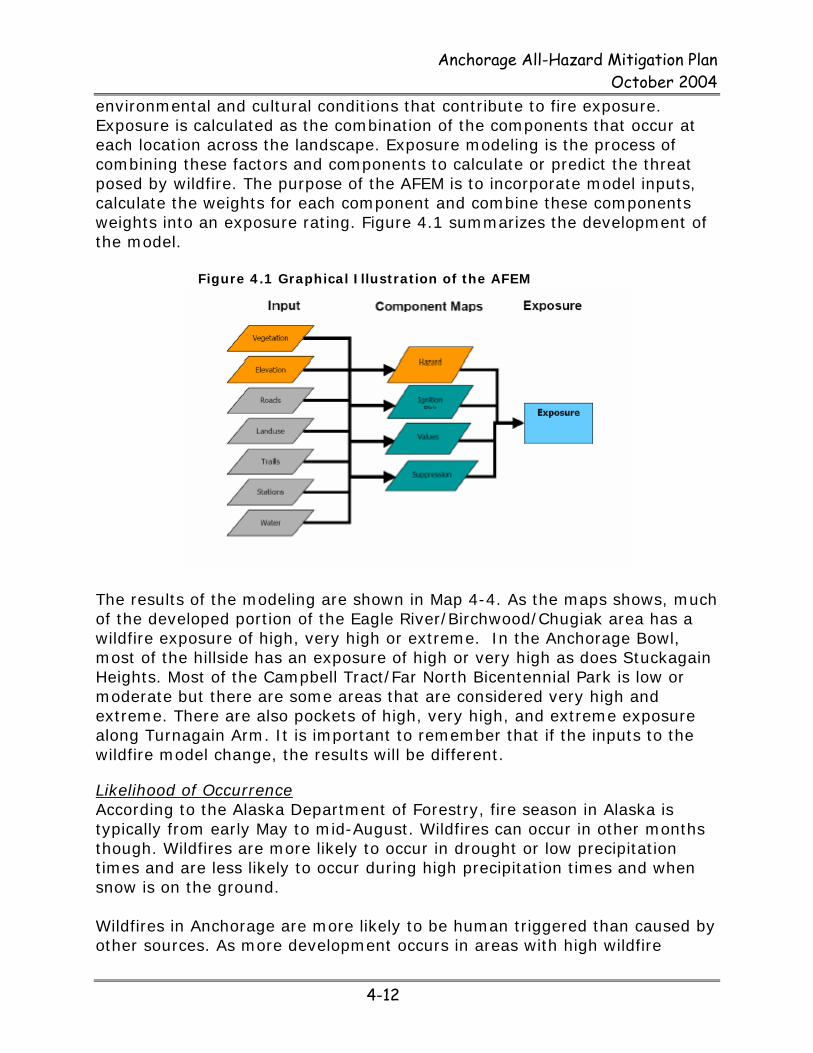
Individual neighborhood assessments are available through the AFD. To better define the wildfire risk in Anchorage, the AFD in conjunction with Geographic Resource Solutions, has undertaken a risk mapping project. The project is using satellite imagery to develop a vegetation/fuels map for Anchorage. This information will then by combined with information about suppression capabilities, ignition potential, accessibility and many other factors to develop a fire-exposure model, which will allow AFD to better identify the wildfire risk areas. Anchorage Fire Exposure Model (AFEM) allows uses to determine the fire exposure in the Anchorage study area. The exposure is based on the cumulative weight of four components: the potential intensity of fire caused by natural fuels (fuels hazard); the susceptibility and risk of a location to ignition (ignition risk); the effort required to access and suppress a fire (suppression) and the existence of improvements that have cultural value (values at risk). Users can adjust the model to evaluate different scenarios caused by such influences as development, fuel mitigation, vegetation successions, changes in fire fighting resources, and availability of water sources. Each of the four components are calculated from the environmental factors and cultural conditions that contribute to each. Vegetation, habitation, building, land-use, terrain, weather, and fire history are among the
Spruce Bark Beetle Wildland fire risk is growing in Alaska due to the spruce bark beetle infestation. The beetles lay eggs under the bark of a tree. When the larvae emerge, they eat the tree’s phloem, which is what the tree uses to transport nutrients from its roots to its needles. If enough phloem is lost, the tree dies. The dead trees dry out and become highly flammable. Large areas, including the Anchorage Hillside, have significant quantities of spruce bark beetle kill trees.
Anchorage All-Hazard Mitigation Plan October 2004
4-12
environmental and cultural conditions that contribute to fire exposure. Exposure is calculated as the combination of the components that occur at each location across the landscape. Exposure modeling is the process of combining these factors and components to calculate or predict the threat posed by wildfire. The purpose of the AFEM is to incorporate model inputs, calculate the weights for each component and combine these components weights into an exposure rating. Figure 4.1 summarizes the development of the model.
Figure 4.1 Graphical Illustration of the AFEM
The results of the modeling are shown in Map 4-4. As the maps shows, much of the developed portion of the Eagle River/Birchwood/Chugiak area has a wildfire exposure of high, very high or extreme. In the Anchorage Bowl, most of the hillside has an exposure of high or very high as does Stuckagain Heights. Most of the Campbell Tract/Far North Bicentennial Park is low or moderate but there are some areas that are considered very high and extreme. There are also pockets of high, very high, and extreme exposure along Turnagain Arm. It is important to remember that if the inputs to the wildfire model change, the results will be different. Likelihood of Occurrence According to the Alaska Department of Forestry, fire season in Alaska is typically from early May to mid-August. Wildfires can occur in other months though. Wildfires are more likely to occur in drought or low precipitation times and are less likely to occur during high precipitation times and when snow is on the ground. Wildfires in Anchorage are more likely to be human triggered than caused by other sources. As more development occurs in areas with high wildfire

Anchorage All-Hazard Mitigation Plan October 2004
4-13
potential, the chances of a wildfire increase. The AFD is taking measures to reduce the risk of fires by controlling the amount of fuel available. The AFD does this through the use of controlled burns, homeowner education, and the development of firebreaks. Historic Events No declared wildfire disasters have been identified to date. However, the potential is there. Every year, the AFD puts out dozens of fires that could be disastrous if they are not contained early. Table 4.3 shows the non-structural fires responded to by the AFD in 2001. Table 4.3 Wildfire Events in 2001
Date Description Acres
Burned Location 1/5/2001 Authorized controlled burning 0.1 2300 Oak Dr
1/5/2001 Brush, or brush and grass mixture fire 0.1 1671 Elcadore Dr
1/26/2001 Forest, woods or wildland fire 0.1 9101 Brayton Dr 2/25/2001 Natural vegetation fire, other 0.1 5411 Mockingbird Dr
3/18/2001 Brush, or brush and grass mixture fire 0.5 11725 Inspiration Dr
3/26/2001 Brush, or brush and grass mixture fire 0.5
Adjacent to Kincaid Motor Cross
4/4/2001 Prescribed fire 0.2 south of ER Visitors Ctr 4/9/2001 Forest, woods or wildland fire 1 Spruce St N & 64th Ave
4/12/2001 Authorized controlled burning 0.1 Shandy Ct & Elmore Rd 4/13/2001 Forest, woods or wildland fire 0.5 Maintree Dr & Lonetree Dr 4/16/2001 Authorized controlled burning 0.1 Hillside Dr & OMalley Rd
4/17/2001 Grass fire 0.1 Reeve Blvd. South of Ship Creek
4/17/2001 Brush, or brush and grass mixture fire 0.1 26126 Wildflower Cir
4/18/2001 Grass fire 0.1 2852 Telequana Dr 4/20/2001 Forest, woods or wildland fire 0.1 41st Ave & Minnesota Blvd 4/21/2001 Natural vegetation fire, other 0.1 3625 Loc Sault Ave
4/22/2001 Brush, or brush and grass mixture fire 1 11500 Trails End Rd
4/22/2001 Grass fire 1 East end of Pago Pago
4/22/2001 Brush, or brush and grass mixture fire 0.2 7500 Jewel Lake Rd
4/23/2001 Natural vegetation fire, other 0.1 10709 Chatanika Loop 4/23/2001 Natural vegetation fire, other 0.1 20536 Raven Dr
4/24/2001 Brush, or brush and grass mixture fire 0.1 6820 E 11th Ave
4/19/2001 Authorized controlled burning 0.1 11061 Snowline Dr 4/25/2001 Forest, woods or wildland fire 0.1 Boniface & DeBarr Rd
4/24/2001 Brush, or brush and grass mixture fire 0.1 Huffman Rd & Elmore Rd
4/25/2001 Brush, or brush and grass mixture 0.1 11312 Fireball St

Anchorage All-Hazard Mitigation Plan October 2004
4-14
Date Description Acres
Burned Location fire
4/26/2001 Forest, woods or wildland fire 0.1 Mulcahy Park
4/26/2001 Brush, or brush and grass mixture fire 1 20th Ave & Bragaw St
4/27/2001 Brush, or brush and grass mixture fire 0.1 20610 David Ave
4/27/2001 Brush, or brush and grass mixture fire 0.1 19611 Cicutta Way
4/28/2001 Natural vegetation fire, other 0.1 17244 Prince of Peace Dr 4/28/2001 Natural vegetation fire, other 0.1 17610 Kantishna Dr
4/29/2001 Brush, or brush and grass mixture fire 0.1 1741 W Northern Lights Blvd
4/29/2001 Grass fire 0.1 3913 Boniface Blvd
4/29/2001 Brush, or brush and grass mixture fire 0.2 Adjacent to E 31st Ave
5/1/2001 Brush, or brush and grass mixture fire 0.1 20130 David St
4/30/2001 Grass fire 0.1 Woodway Dr & Alderwood Loop
4/29/2001 Brush, or brush and grass mixture fire 0.1 1326 Nichols St
5/7/2001 Natural vegetation fire, other 0.1 River Park Dr & Wildwater Cir 5/8/2001 Forest, woods or wildland fire 0.1 16222 Ursa Minor Cir
5/9/2001 Brush, or brush and grass mixture fire 0.3 Dimond Blvd & Victor Rd
5/10/2001 Grass fire 0.1 3608 Lois Dr
5/13/2001 Brush, or brush and grass mixture fire 0.1 Gambell St & Benson Blvd
5/12/2001 Brush, or brush and grass mixture fire 2
Northway Dr & San Jeronimo Dr
5/13/2001 Forest, woods or wildland fire 0.3 New Glenn Hwy & N Eagle River Access Rd
5/15/2001 Grass fire 1 9020 Andy Cir
5/17/2001 Brush, or brush and grass mixture fire 0.1 12322 Woodward Dr
5/17/2001 Natural vegetation fire, other 0.1 12720 Hace St
5/17/2001 Brush, or brush and grass mixture fire 0.1 Brayton Dr & Thuja Ave
5/18/2001 Brush, or brush and grass mixture fire 0.2
West of Fairbanks Street in the greenbelt.
5/20/2001 Grass fire 0.2 1440 Muldoon Rd
5/20/2001 Brush, or brush and grass mixture fire 1 Northway Dr & Debarr Rd
5/20/2001 Brush, or brush and grass mixture fire 0.1 2906 W 35th Ave
5/20/2001 Grass fire 0.1 Minnesota Dr & Westchester Lagoon
5/21/2001 Brush, or brush and grass mixture fire 0.1 3910 Resurrection Dr

Anchorage All-Hazard Mitigation Plan October 2004
4-15
Date Description Acres
Burned Location 5/21/2001 Grass fire 0.2 Glenn Hwy & Boniface
5/21/2001 Brush, or brush and grass mixture fire 0.1 Boniface & Debarr Rd
5/22/2001 Natural vegetation fire, other 0.1 1/4 mile past Earthquake Park on Pt Woronzof
5/23/2001 Brush, or brush and grass mixture fire 0.1 36th Ave & Muldoon Rd
5/23/2001 Brush, or brush and grass mixture fire 0.1 Arctic & Lancaster Drive
5/24/2001 Grass fire 0.1 Heritage Dr btwn Muldoon Rd / Native Heritage Cent
5/24/2001 Grass fire 0.1 Heritage Dr btwn Muldoon Rd / Native Heritage Cent
5/25/2001 Brush, or brush and grass mixture fire 0.1 Northwood St & Dimond Blvd
5/25/2001 Grass fire 0.1 Northwood St & 45th Ave
5/25/2001 Brush, or brush and grass mixture fire 0.1 32nd Ave & Wisconsin St
5/26/2001 Natural vegetation fire, other 0.1 Fireweed Lane & Juneau St 5/26/2001 Natural vegetation fire, other 0.1 New Seward & Tudor
5/27/2001 Brush, or brush and grass mixture fire 0.1
Barbara Falls Dr & Waterfall Dr
5/27/2001 Forest, woods or wildland fire 1 Lake Otis & OMalley
5/27/2001 Brush, or brush and grass mixture fire 0.1 W 36th Ave & Bruce Lane
5/28/2001 Brush, or brush and grass mixture fire 0.1 8021 E 36th Ave
5/28/2001 Forest, woods or wildland fire 1 Ridgemont Dr & Lake Otis 5/28/2001 Forest, woods or wildland fire 0.1 1700 E Tudor Rd 5/26/2001 Grass fire 0.1 9499 Brayton Dr
5/28/2001 Brush, or brush and grass mixture fire 2 6820 Sky Cir
5/30/2001 Forest, woods or wildland fire 1.5 Russian Jack Park so of 6th Ave
5/31/2001 Brush, or brush and grass mixture fire 0.2 OMalley & C
5/31/2001 Forest, woods or wildland fire 0.1 Mile 98 & Seward Hwy 6/1/2001 Grass fire 0.2 8800 Heritage Dr
6/1/2001 Brush, or brush and grass mixture fire 0.1 Spruce Rd & Fergy Cir
6/2/2001 Grass fire 0.1 413 E 16th Terr
6/2/2001 Brush, or brush and grass mixture fire 0.1 7800 Debarr Rd
6/2/2001 Brush, or brush and grass mixture fire 0.1 7001 Lake O the Hills Cir
6/2/2001 Forest, woods or wildland fire 1 Minnesota & W 100th Ave 6/3/2001 Forest, woods or wildland fire 1 Minnesota & W 100th Ave
6/3/2001 Brush, or brush and grass mixture fire 0.1
E Northern Lights Blvd & Goose Lake Dr

Anchorage All-Hazard Mitigation Plan October 2004
4-16
Date Description Acres
Burned Location 6/3/2001 Grass fire 0.1 84th Ave & Lake Otis 6/4/2001 Natural vegetation fire, other 0.1 Victor & Old Klatt 6/4/2001 Grass fire 0.1 Heritage Dr & Muldoon Rd
6/5/2001 Brush, or brush and grass mixture fire 0.1 1900 Congress Cir
6/6/2001 Brush, or brush and grass mixture fire 0.1 8800 Heritage Dr
6/8/2001 Brush, or brush and grass mixture fire 0.1 8800 Heritage Dr
6/8/2001 Grass fire 0.1 2303 D St 6/9/2001 Forest, woods or wildland fire 0.2 Debarr Rd & Creekside St 6/9/2001 Forest, woods or wildland fire 0.1 Mile 108.5 Seward Hwy
6/10/2001 Brush, or brush and grass mixture fire 0.2
east side of Glenn Hwy NB prior to the Hiland exit
6/13/2001 Brush, or brush and grass mixture fire 0.1 7301 Old Rabbit Creek Rd
6/13/2001 Natural vegetation fire, other 0.1 Northfleet & Seagate Cir 6/15/2001 Natural vegetation fire, other 0.1 1910 Congress Cir 6/15/2001 Natural vegetation fire, other 0.1 1741 W Northern Lights Blvd
6/17/2001 Brush, or brush and grass mixture fire 0.1 3701 Eureka St
6/16/2001 Grass fire 0.1 Lake Otis & Mona Loop 6/17/2001 Forest, woods or wildland fire 0.1 Tudor & Arctic 6/18/2001 Forest, woods or wildland fire 0.1 Balto Seppala Park 6/18/2001 Natural vegetation fire, other 0.1 1840 Minerva Way
6/18/2001 Brush, or brush and grass mixture fire 0.1 801 E 82 Ave
6/18/2001 Brush, or brush and grass mixture fire 0.2 E 20 Ave & Karluk St
6/20/2001 Brush, or brush and grass mixture fire 0.1
On Muldoon Rd at E Northern Lights
6/21/2001 Grass fire 0.2 On E Klatt Rd at Johns Rd
6/22/2001 Brush, or brush and grass mixture fire 0.1 On W Dimond Blvd at C St
6/23/2001 Grass fire 0.1 On Muldoon Rd at Pioneer Dr
6/23/2001 Grass fire 0.1 On E 34TH Ave at OLD SEWARD Hwy
6/23/2001 Grass fire 0.1 13650 Lake Otis Pky 6/23/2001 Natural vegetation fire, other 0.1 651 W 92nd Ave
6/25/2001 Natural vegetation fire, other 0.1 On W Klatt Rd at Spyglass Cir
6/25/2001 Natural vegetation fire, other 0.1 On E 120th Ave at Division St
6/25/2001 Grass fire 0.1 On West Lake Ave at Moorland St
6/25/2001 Grass fire 0.1 8033 Sand Lake Rd
6/25/2001 Brush, or brush and grass mixture fire 0.1 4245 Debarr Rd

Anchorage All-Hazard Mitigation Plan October 2004
4-17
Date Description Acres
Burned Location
6/26/2001 Grass fire 0.1 100' SW of intersection S Hoyt St & San Ernesto Av
6/27/2001 Brush, or brush and grass mixture fire 0.1 5311 E 26th Ave
6/27/2001 Forest, woods or wildland fire 0.1 579 E Dowling Rd
6/28/2001 Grass fire 0.1 On New Glenn Hwy at Boniface Pky
6/28/2001 Grass fire 0.1 3751 Challenger Cir
6/28/2001 Forest, woods or wildland fire 0.1 E 16th Ave & A St south of Mulcahy Park in green
6/28/2001 Grass fire 0.1 9220 Old Seward Hwy
6/28/2001 Natural vegetation fire, other 0.1 On W 88th Ave at Jewel Lake Rd
6/29/2001 Forest, woods or wildland fire 0.1 23020 New Seward Hwy 6/30/2001 Forest, woods or wildland fire 0.2 23020 New Seward Hwy 7/1/2001 Grass fire 0.1 6865 All Star Cir 7/1/2001 Natural vegetation fire, other 0.1 1000 E Northern Lights Blvd 7/2/2001 Forest, woods or wildland fire 0.1 23020 New Seward Hwy 7/2/2001 Grass fire 1 6301 Jewel Lake Rd 7/2/2001 Natural vegetation fire, other 0.1 On E 15th Ave at Sitka St 7/3/2001 Grass fire 0.1 1741 W Northern Lights Blvd
7/20/2001 Forest, woods or wildland fire 0.1 Adjacent to C St
7/26/2001 Brush, or brush and grass mixture fire 0.1 On W 40th Ave at Wilson St
7/26/2001 Brush, or brush and grass mixture fire 1 8300 Jodhpur St
7/26/2001 Grass fire 0.1 On Old Klatt Rd at Victor Rd
7/28/2001 Grass fire 0.1 Adjacent to 2400 E Northern Lights Blvd
8/2/2001 Authorized controlled burning 0.1 7541 Upper Omalley Rd 8/8/2001 Authorized controlled burning 0.5 2864 Commercial Dr
8/11/2001 Forest, woods or wildland fire 0.1 3408 Tarwater Ave 8/12/2001 Natural vegetation fire, other 0.1 5700 E 4th Ave 8/16/2001 Forest, woods or wildland fire 0.1 2025 TERREBONNE Loop
8/23/2001 Grass fire 0.1 24935 Mile 109 New Seward Hwy
8/28/2001 Natural vegetation fire, other 0.1 In front of 5700 E 4th Ave 9/17/2001 Natural vegetation fire, other 0.1 On Minnesota Dr at C St 9/18/2001 Natural vegetation fire, other 0.1 On W OMALLEY Rd at C St
9/22/2001 Brush, or brush and grass mixture fire 0.1 400 Rodeo Cir
9/24/2001 Authorized controlled burning 0.1 7015 Abbott Rd
9/30/2001 Brush, or brush and grass mixture fire 0.1 1705 W 32ND Ave
1/25/2002 Authorized controlled burning 0.1 2000 W Dimond Blvd
1/26/2002 Authorized controlled burning 0.1 On DOMAIN LN at MAUSEL St
Source: AFD, 2004

Anchorage All-Hazard Mitigation Plan October 2004
4-18
Appendix F lists wildfire events from 1999 and 2000. Other Wildfire events O'Malley/Hillside Fire, 1973 In May 1973, a small brush fire at a private home, fanned by 40 mph winds, burned out of control in the foothills of the Chugach range. The fire threatened 25 homes, and forced several families to evacuate. By the time firefighters contained the blaze, 300 acres of brush and timber were destroyed. Vulnerability There are many factors that determine the number of parcels that are vulnerable to wildfires. As a result, the number of vulnerable parcels has not been calculated because the information will be out-dated quite quickly. For the latest vulnerability information, please contact the Wildfire Mitigation division of the Anchorage Fire Department. 4 . 1 . 3 E X T R E M E W E A T H E R Extreme weather is a broad category that includes winter storms, heavy snow, extreme cold, ice storms, high wind, thunder & lightning, hail, coastal storms, and storm surge. Winter Storms Winter storms originate as mid-latitude depressions or cyclonic weather systems and are usually accompanied by high winds, heavy snow, and cold temperatures. To develop, they require: • Cold air - Subfreezing temperatures (below 32ºF) in the clouds and/or
near the ground to make snow and/or ice. • Moisture - The air must contain moisture in order to form clouds and
precipitation. • Lift - A mechanism to raise the moist air to form the clouds and cause
precipitation. Lift may be provided by any or all of the following: • The flow of air up a mountainside. • Fronts, where warm air collides with cold air and rises over the dome
of cold air. • Upper-level low pressure troughs.
Location The entire MOA can experience a winter storm. Different areas will have varying impacts depending on where the storm originates.

Anchorage All-Hazard Mitigation Plan October 2004
4-19
Likelihood of Occurrence Anchorage has the potential for a winter storm every winter. The development on a winter storm depends on the weather conditions and their occurrence is random in nature. Historic Events 2003 Winter Storm – Federal Disaster 1461 In March 2003, a winter storm brought high winds and freezing temperatures to Anchorage and surrounding communities for several days. This event involved a Bora wind, which is a very cold northerly wind (sometimes called the Matanuska wind). Bora winds are rare in Anchorage, and usually only occur every 10 to 15 years (Vonderheide, 2003). Prior to this event, the last one occurred in 1989. Within the Municipality, the worst effects occurred in the west Anchorage area. Ted Stevens Anchorage International Airport had record high winds, sustained winds around 92-94 mph and a peak gust of 109 mph (Scott, Baines & Papineau, 2003). Damage for the event in MOA alone exceeded $3.5 Million. MOA conducted a voluntary on-line survey about the damage caused by storm. The survey results are displayed in Map 4.5. 2000 Central Gulf Coast Storm - Federal Disaster 1316 In December 1999 and January 2000, a series of severe winter storms triggered avalanches and flooding throughout Southcentral Alaska. Anchorage was one of many jurisdictions included in a Federal Disaster Declaration. In Anchorage, damage from this event included one fatality, property damage, disruption of electrical service, and interruption of rail and road access south of the Potter Weigh Station. Vulnerability As a winter storm could affect the entire Municipality, the entire MOA is represented in Table 4.4.
Table 4.4 Winter Storm Vulnerability
Land Use # of
Parcels Taxable Value
(Land) Taxable Value
(Buildings) Total Residential 59,426 $3,066,038,500 $8,334,412,600 $11,398,571,591Commercial 3,419 $605,885,600 $1,579,095,500 $2,132,773,711Industrial 1,610 $180,641,800 $290,159,100 $469,225,809Institutional 702 $26,876,800 $188,839,300 $90,308,164Parks, Open Space & Recreation Areas 1,319 $107,600 $203,400 $311,000Transportation Related 419 $236,100 $165,900 $402,000Other 300 $352,000 $44,400 $307,600Vacant 10,326 $570,157,400 $450,103,500 $1,015,367,523

Anchorage All-Hazard Mitigation Plan October 2004
4-20
Unidentified 4,325 $419,913,000 $924,182,300 $1,341,953,131Total 81,846 $4,870,208,800 $11,767,206,000 $16,449,220,529 Heavy Snow Heavy snow is generally considered to be more than 6 inches of accumulation in less than 24 hours. Heavy snow can have a significant impact on an area. Until the snow can be removed, airports and roadways experience delay, or are closed completely, stopping the flow of traffic, supplies and disrupting emergency and medical services. Heavy snow loads can damage light aircraft and sink small boats. It can also cause roofs to collapse and knock down trees and power lines. Heavy snowfalls can cause secondary hazards. In the mountains, heavy snow can lead to avalanches. A quick thaw can cause flooding, especially along small streams and in urban areas. The cost of snow removal, repairing damages, and the loss of business can have severe economic impacts. Location The entire Municipality can get heavy snows but Girdwood tends to receive more snow than other areas. In general, the location of heavy snowfall depends on the weather system involved. The typical storm is a low pressure system originating in Prince William Sound that moves in from the East. This results in heavier snow on the hillside, and less as you get further from the mountains. When the storm is out of the south, the snowfall is heavier in West Anchorage (Vonderheide, 2003). Occasionally, air comes up Cook Inlet and hits the mountains. This may lead to heavy snow on the upper hillside and less in the bowl area (Vonderheide, 2003). See Map 4.6 for the average annual snowfall pattern in MOA.
Snow Terminology Snow is defined as a steady fall of snow for several hours or more. Heavy Snow generally means: • Snowfall accumulating to 4 inches or more in depth in 12
hours or less • Snowfall accumulating to 6 inches or more in depth in 24
hours or less Snow Squalls are periods of moderate to heavy snowfall, intense, but of limited duration, accompanied by strong, gusty surface winds, and possibly lightning. A Snow Shower is a short duration of moderate snowfall. Snow Flurries are an intermittent light snowfall of short duration with no measurable accumulation. Blowing Snow is wind-driven snow that reduces surface visibility. Blowing snow can be falling snow or snow that already has accumulated but is picked up and blown by strong winds. Drifting Snow is an uneven distribution of snowfall and snow depth caused by strong surface winds. Drifting snow may occur during or after a snowfall. A Blizzard means that the following conditions are expected to prevail for a period of 3 hours or longer: • Sustained wind or frequent gusts to 35 miles/hour or greater • Considerable falling and/or blowing snow reducing visibility
to less than 1/4 mile • Freezing Rain or Drizzle occurs when rain or drizzle freezes
on surfaces such as the ground, trees, power lines, motor vehicles, streets, highways, etc.

Anchorage All-Hazard Mitigation Plan October 2004
4-21
Snowfall tends to be highest in December and at higher elevations such as those on the Hillside. Tables 4.5, 4.6, and 4.7 show the average total snowfall at selected weather stations in the Anchorage Bowl, Eagle River/Chugiak, and Girdwood respectively. Tables 4.8 and 4.9 show the snow depth at selected weather stations in the Anchorage Bowl and Eagle River/Chugiak. Data for Girdwood was unavailable. Table 4.5 Anchorage Bowl Average Total Snowfall (inches)
Station January February March April May June July August September October November December AnnualANCHORAGE INTERNATIONALAIRPORT 11.25 7.54 7.3 2.8 0.64 0.02 0 0 0.02 5.35 9.86 12 57.63
ELMENDORF AIR FORCE BASE 10.46 12.94 8.98 4.81 0.16 0 0 0 0.2 9.57 13.38 16.54 80.88
GLEN ALPS 23.48 24.6 24.14 11.96 3.32 0 0 0 1.2 17.93 24.56 35.15 171.07Source: Western Regional Climate Center, 2003
Table 4.6 Eagle River/Chugiak Average Total Snowfall (inches)
Station January February March April May June July August September October November December Annual
EKLUTNA LAKE 6.16 2.34 5.44 0.19 0.05 0 0 0 0 1.41 2.09 14.75 47.43
EKLUTNA PROJECT 7.76 9.36 7.8 2.35 0.05 0 0 0 0.01 5.36 10.37 13.05 55.09Source: Western Regional Climate Center, 2003
Table 4.7 Girdwood Average Total Snowfall (inches)
Station January February March April May June July August September October November December Annual
ALYESKA 29.1 32.27 32.27 11.72 1.09 0 0 0 0 13.07 26.8 48.82 216.66Source: Western Regional Climate Center, 2003
Table 4.8 Anchorage Bowl Average Snow Depth (inches)
Station January FebruaryMarchAprilMayJune July AugustSeptemberOctoberNovemberDecemberAnnualANCHORAGE INTERNATIONAL AIRPORT 10 10 7 1 0 0 0 0 0 0 2 6 3ELMENDORF AIR FORCE BASE 12 13 11 3 0 0 0 0 0 1 4 9 4
GLEN ALPS 40 48 51 43 6 0 0 0 0 3 11 29 19
Source: Western Regional Climate Center, 2003
Table 4.9 Eagle River/Chugiak Average Snow Depth (inches)
Station January FebruaryMarchAprilMayJune July AugustSeptemberOctoberNovemberDecemberAnnual
EKLUTNA LAKE 9 12 10 2 0 0 0 0 0 0 1 6 3
EKLUTNA PROJECT 10 12 13 8 0 0 0 0 0 1 4 8 5
Source: Western Regional Climate Center, 2003
Likeliness of Occurrence While snow falls frequently in Anchorage during the winter, most snowfalls are not usually heavy. However, heavy snowfalls are possible every winter. Their occurrence depends on the weather conditions.

Anchorage All-Hazard Mitigation Plan October 2004
4-22
Historic Events 2002 Heavy Snow Fall Record heavy snow occurred in MOA on March 17, 2002 when 2 to 3 feet of snow fell in less than 24 hours. Ted Stevens Anchorage International Airport recorded a total of 28.7 inches while an observer near Lake Hood measured over 33 inches. The Municipality was essentially shut down because of the accumulating snow. Fortunately, the storm occurred on a Sunday morning when fewer businesses are open. The following day, both military bases, both universities, and many businesses remained closed, while Anchorage schools remained closed for 2 days. It took 4 days for snowplows to reach all areas of the city. Other Snow Events On March 20, 2001, 8-12 inches of snow fell in the Anchorage Bowl-Eagle River area. Vulnerability As a heavy snowfall could affect the entire Municipality, the entire MOA is represented in Table 4.10.
Table 4.10 Heavy Snow Vulnerability
Land Use # of
Parcels Taxable Value
(Land) Taxable Value
(Buildings) Total Residential 59,426 $3,066,038,500 $8,334,412,600 $11,398,571,591Commercial 3,419 $605,885,600 $1,579,095,500 $2,132,773,711Industrial 1,610 $180,641,800 $290,159,100 $469,225,809Institutional 702 $26,876,800 $188,839,300 $90,308,164Parks, Open Space & Recreation Areas 1,319 $107,600 $203,400 $311,000Transportation Related 419 $236,100 $165,900 $402,000Other 300 $352,000 $44,400 $307,600Vacant 10,326 $570,157,400 $450,103,500 $1,015,367,523Unidentified 4,325 $419,913,000 $924,182,300 $1,341,953,131Total 81,846 $4,870,208,800 $11,767,206,000 $16,449,220,529
Snowfall records Normal snowfall – 69.5’ Top 5 Highest Winter Snowfall 171.8 inches...........1955-1956 123.1 inches...........1949-1950 121.1 inches...........1994-1995 119.1 inches...........1996-1997 105.0 inches...........1959-1960 Top 5 Lowest Winter Snowfall 30.4 inches............1957-1958 32.6 inches............1941-1942 32.9 inches............1980-1981 38.5 inches............1960-1961 38.7 inches............1986-1987 Top 5 Highest Daily Snowfall 25.7 inches............March 17, 2002 15.6 inches............December 29, 1955 15.1 inches............December 4, 1998 14.3 inches............March 18, 1976 13.4 inches............December 28, 1955 Maximum Snow Depth 47 inches..............December 31, 1955 and January 1, 1956 Source: National Weather Service Anchorage Forecast Office’s Climate Records List, (1917 – 2002)

Anchorage All-Hazard Mitigation Plan October 2004
4-23
Heavy Rain There is no universal definition of heavy rain. Generally, when rainfall is sufficient to cause localized or widespread flooding, it is considered heavy. One definition for heavy rain, from Environment Canada, is 50 millimeters (mm) (1.97 inches) of rain over a 12-hour period or less, or 80 mm (3.15 inches) of rain in less than 24 hours (50 mm [1.97 inches] of rain over 24 hours or less in areas north of 60°, such as Alaska). Location The Girdwood area receives the most railfall. See Map 4.7 for the average annual rainfall pattern. Rainfall also varies with time of year with most precipitation occurring in late summer and fall. Tables 4.11-4.13 show the average monthly precipitation at selected weather stations in the Anchorage Bowl, Eagle River/Chugiak, and Girdwood. The data for the three tables is from http://www.wrcc.dri.edu/summary/climsmak.html Table 4.11 Anchorage Bowl Average Monthly Precipitation (inches)
Station January FebruaryMarchAprilMayJune July AugustSeptemberOctoberNovemberDecemberAnnualANCHORAGE INTERNATIONAL AIRPORT 0.82 0.58 0.54 0.380.56 1.01 1.6 2.62 2.58 1.99 1.03 0.93 14.62ELMENDORF AIR FORCE BASE 0.86 0.94 0.74 0.570.61 1.07 2.1 2.58 2.42 1.78 1.19 1.3 16.15GLEN ALPS 2.05 1.91 1.68 1.281.12 1.46 2.4 3.3 4.2 3.12 2.2 2.7 27.4
Source: Western Regional Climate Center, 2003
Table 4.12 Eagle River/Chugiak Average Monthly Precipitation (inches)
Station January FebruaryMarchAprilMayJune July AugustSeptemberOctoberNovemberDecemberAnnualEKLUTNA LAKE 0.69 0.46 0.5 0.50.52 1.04 1.6 1.64 1.64 1.27 0.86 1.22 11.89EKLUTNA PROJECT 1.04 0.93 0.75 0.610.79 1.75 2.8 2.56 2.48 1.73 1.27 1.32 18.08
Source: Western Regional Climate Center, 2003
Table 4.13 Girdwood Average Monthly Precipitation (inches)
Station January FebruaryMarchAprilMayJune July AugustSeptemberOctoberNovemberDecemberAnnualALYESKA 8.75 5.13 4.82 4.973.78 2.45 2.6 4.57 7.73 7.86 6.35 8.69 67.71
Source: Western Regional Climate Center, 2003
Likelihood of Occurrence The occurrence of heavy rain depends on the weather conditions. Historic Events No significant historic heavy rainfalls have been identified
Precipitation Records Normal Precipitation: 16.08” Highest Annual Precipitation: 27.75” (1989) Lowest Annual Precipitation: 8.08” (1969) Longest Consecutive Days with Measurable Precipitation: 17 days (September 12 – 28, 1979) Consecutive Days Without Precipitation: 47 (January 6 – February 21, 1939) Source: National Weather Service Anchorage Forecast Office’s Climate Records List, (1917 – 2002)

Anchorage All-Hazard Mitigation Plan October 2004
4-24
Vulnerability As a heavy rain could affect the entire Municipality, the entire MOA is represented in Table 4.14.
Table 4.14 Heavy Rain Vulnerability
Land Use # of
Parcels Taxable Value
(Land) Taxable Value
(Buildings) Total Residential 59,426 $3,066,038,500 $8,334,412,600 $11,398,571,591Commercial 3,419 $605,885,600 $1,579,095,500 $2,132,773,711Industrial 1,610 $180,641,800 $290,159,100 $469,225,809Institutional 702 $26,876,800 $188,839,300 $90,308,164Parks, Open Space & Recreation Areas 1,319 $107,600 $203,400 $311,000Transportation Related 419 $236,100 $165,900 $402,000Other 300 $352,000 $44,400 $307,600Vacant 10,326 $570,157,400 $450,103,500 $1,015,367,523Unidentified 4,325 $419,913,000 $924,182,300 $1,341,953,131Total 81,846 $4,870,208,800 $11,767,206,000 $16,449,220,529 Extreme Cold What is considered an excessively cold temperature varies according to the normal climate of a region. In areas unaccustomed to winter weather, near freezing temperatures are considered "extreme cold." In Alaska, extreme cold usually involves temperatures below –40 degrees Fahrenheit. Excessive cold may accompany winter storms, be left in their wake, or can occur without storm activity.
Extreme cold can also bring transportation to a halt for days or weeks at a time. Aircraft may be grounded due to extreme cold and ice fog conditions. Long cold spells can cause rivers to freeze which increases the likelihood of ice jams and ice jam related flooding. If extreme cold conditions are combined with low or no snow cover, the ground’s frost depth can increase, and disturb buried utility pipes. The greatest danger from extreme cold is to
people. Prolonged exposure to the cold can cause frostbite or hypothermia and become life threatening, especially for infants and the elderly. Carbon monoxide poisonings also increase as people use supplemental heating devices.
Frostbite is damage to body tissue caused by that tissue being frozen. Frostbite causes a loss of feeling and a white or pale appearance in the extremities. Hypothermia is low body temperature. Normal body temperature is 98.6ºFahrenheit (F). When body temperature drops to 95ºF, however, immediate medical help is needed. Hypothermia also can occur with prolonged exposure to temperatures above freezing.

Anchorage All-Hazard Mitigation Plan October 2004
4-25
Location In MOA, the official temperature is recorded at the Ted Stevens Anchorage International Airport. Due to its close proximity to open water, the airport tends to be warmer than the rest of Anchorage. For example, east Anchorage is generally 10 to 15 degrees cooler than at the airport (Vonderheide, 2003). The Eagle River/Chugiak area tends to get the coolest temperatures in the winter. See Map 4.8 for the extreme minimum temperatures. The coldest months in Anchorage are generally December, January, and February. The temperature tends to decrease, the further inland you are. Tables 4.15-4.20 show monthly average mean and minimum temperatures for selected weather stations in the Anchorage Bowl, Eagle River/Chugiak, and Girdwood. Table 4.15 Anchorage Bowl Monthly Average Mean Temperatures
Station January February March April May June July August September October November December AnnualANCHORAGE INTERNATIONAL AIRPORT 15.8 18.7 25.9 36.3 46.9 54.7 58.4 56.4 48.2 34.1 21.8 17.5 36.2ELMENDORF AIR FORCE BASE 14 16.9 24.6 36.1 47 54.8 58.7 56.7 48.2 33.5 20.4 15.9 35.6
FT RICHARDSON WTP 14.4 17.5 25.1 35 45.8 53.5 57.1 55.3 46.8 32.6 20.4 16.2 35
GLEN ALPS 17.8 18.9 22.9 30.5 40 48.1 52 50.5 42.7 30.7 22.6 19.7 33
Source: Alaska Climate Research Center, 2003 Table 4.16 Anchorage Bowl Monthly Average Minimum Temperatures
Station January February March April May June July August September October November December Annual ANCHORAGE INTERNATIONAL AIRPORT 9.3 11.7 18.2 28.738.9 4751.5 49.4 41.4 28.3 15.9 11.4 29.3ELMENDORF AIR FORCE BASE 7.1 9.1 16.4 28.539.1 47.652.3 49.9 41.6 27.6 14.2 9.5 28.6
FT RICHARDSON WTP 7.3 9.6 15.8 2636.7 44.648.9 46.7 38.9 25.6 13.6 9.4 26.9
GLEN ALPS 11 11.4 15.1 23.433.3 40.745.1 43.7 36.4 24.3 15.9 13.2 26.1
Source: Alaska Climate Research Center, 2003
Table 4.17 Eagle River/Chugiak Monthly Average Mean Temperatures
Station January February March April May June July August September October November December Annual
EAGLE RIVER 5 SE 12.8 17.3 25.6 36.6 46.9 54.6 58.2 56 47.3 32.7 18.2 14 35
EKLUTNA PROJECT 10.2 14.8 23.5 37.1 47.6 55.5 58.6 55.3 46.3 32.3 17.9 13.2 34.4
Source: Alaska Climate Research Center, 2003
Table 4.18 Eagle River/Chugiak Monthly Average Minimum Temperatures
Station JanuaryFebruaryMarchAprilMayJune July August SeptemberOctober NovemberDecemberAnnual
EAGLE RIVER 5 SE 4.9 8 14.4 25.134.7 42.947.7 45.5 37.4 25 11 6.6 25.3
EKLUTNA PROJECT 2 5.3 12.2 25.735.2 43.547.5 44.2 36.8 24.5 10.1 5 24.3
Source: Alaska Climate Research Center, 2003

Anchorage All-Hazard Mitigation Plan October 2004
4-26
Table 4.19 Girdwood Monthly Average Mean Temperatures
Station JanuaryFebruaryMarchAprilMayJune July August SeptemberOctober NovemberDecemberAnnual
ALYESKA 20.4 22.2 27.7 35.844.3 52.256.7 54.8 47.4 35.8 26.3 22.5 37.2
Source: Alaska Climate Research Center, 2003
Table 4.20 Girdwood Monthly Average Minimum Temperatures
Station January February March April May June July August September October November December Annual
ALYESKA 14.2 15.2 19.4 27.4 35.5 42.9 47.8 46.2 39.5 29.2 20.2 16.4 29.5
Source: Alaska Climate Research Center, 2003
Likelihood of Occurrence Extreme cold temperatures could happen every winter, depending on weather conditions. Historic Events Extreme cold temperatures can be especially problematic if they are associated with low snow levels as happened in the winter of 1995-1996. The combination of these two factors resulted in the ground freezing to a greater depth than usual (more than 10 feet compared to the usual 3 or 4 feet). As utility pipes, including water and wastewater, are buried to a depth of 10 feet, some pipes froze and subsequently broke. Repairing the broken pipes was a massive undertaking as the ground had to be thawed before work could commence (Vonderheide, 2003). Vulnerability As extreme cold could affect the entire Municipality, the entire MOA is represented in Table 4.21.
Table 4.21 Extreme Cold Vulnerability
Land Use # of
Parcels Taxable Value
(Land) Taxable Value
(Buildings) Total Residential 59,426 $3,066,038,500 $8,334,412,600 $11,398,571,591Commercial 3,419 $605,885,600 $1,579,095,500 $2,132,773,711Industrial 1,610 $180,641,800 $290,159,100 $469,225,809Institutional 702 $26,876,800 $188,839,300 $90,308,164Parks, Open Space & Recreation Areas 1,319 $107,600 $203,400 $311,000Transportation Related 419 $236,100 $165,900 $402,000Other 300 $352,000 $44,400 $307,600Vacant 10,326 $570,157,400 $450,103,500 $1,015,367,523Unidentified 4,325 $419,913,000 $924,182,300 $1,341,953,131Total 81,846 $4,870,208,800 $11,767,206,000 $16,449,220,529 Ice Storms Ice storm is the term used to describe occasions when damaging accumulations of ice are expected during freezing rain situations. Ice storms

Anchorage All-Hazard Mitigation Plan October 2004
4-27
result from the accumulation of freezing rain (rain that becomes super cooled and freezes upon impact with cold surfaces). Freezing rain most commonly occurs in a narrow band within a winter storm that is also producing heavy amounts of snow and sleet in other locations. Ice storms can be devastating and are often the cause of automobile accidents, power outages and personal injuries. Glace ice, also known as black ice, which occurs when rains hits the cold ground and turns into ice, is possible in the MOA. It is responsible for multiple traffic accidents every winter. Location Ice storms can occur anywhere but the atmospheric conditions that can lead to ice storms occur most frequently around Cook Inlet. Likelihood of Occurrence The future occurrence of ice storms in Anchorage depends on the weather conditions. Historic Events No significant historic ice storms have been identified. Vulnerability As an ice storm could affect the entire Municipality, the entire MOA is represented in Table 4.22.
Table 4.22 Ice Storm Vulnerability
Land Use # of
Parcels Taxable Value
(Land) Taxable Value
(Buildings) Total Residential 59,426 $3,066,038,500 $8,334,412,600 $11,398,571,591Commercial 3,419 $605,885,600 $1,579,095,500 $2,132,773,711Industrial 1,610 $180,641,800 $290,159,100 $469,225,809Institutional 702 $26,876,800 $188,839,300 $90,308,164Parks, Open Space & Recreation Areas 1,319 $107,600 $203,400 $311,000Transportation Related 419 $236,100 $165,900 $402,000Other 300 $352,000 $44,400 $307,600Vacant 10,326 $570,157,400 $450,103,500 $1,015,367,523Unidentified 4,325 $419,913,000 $924,182,300 $1,341,953,131Total 81,846 $4,870,208,800 $11,767,206,000 $16,449,220,529 High Winds High winds are generally considered to be winds in excess of 60 miles per hour (mph). They can lead to dangerous wind chill temperatures or combine with loose snow to produce blinding blizzard conditions. High winds have the

Anchorage All-Hazard Mitigation Plan October 2004
4-28
potential to cause serious damage to a community’s infrastructure, especially above ground utility lines. In mountainous areas, down slope windstorms created by temperature and pressure differences across the terrain can produce winds in excess of 100 mph. These windstorms can be particularly damaging as they are gusty in character and may seem to come from several directions. Location The Anchorage Area-Wide Wind Speed Study developed a wind zone map for the Anchorage Building Service Area (RWDI, 1998a). The resulting map represents the 50-year mile wind speed (see Map 4.11). This report noted that Anchorage gets strong winds from the southerly direction in the summer and northerly directions during the winter (RWDI, 1998). Localized high winds can also occur. The most well known local wind is the Chugach wind which blows off the Chugach Mountains. These Chugach winds are really Chinook winds (a strong warm wind) and mostly affect the eastern side of the Anchorage Bowl. There can be winds just in the Turnagain Arm area, which affects traffic on the New Seward Highway (Vonderheide, 2003). Winds near McHugh Creek can get in the 80-90 mph range (Vonderheide, 2003). There is a Knik Valley wind, which brings warm air from Prince William Sound. The hillside area can experience a Chinook/Chugach wind. Eagle River can get winds from the Southeast. Localized winds in Bear Valley can reach 125 mph. Likelihood of Occurrence High wind advisories, watches, and warnings are frequently issued by the National Weather Service (NWS) for different parts of Anchorage. Historic Events April 1980 Windstorm On April 1, 1980, a Chinook wind with maximum gust speeds estimated at 134 miles per hour caused approximately $25 million in damages. Other Wind Events (From RWDI 1998a and b)
• December 3, 1994 - southeasterly downslope wind storm • Feburary 20, 1994 – northeasterly wind storm • November 22, 1993 - southeasterly downslope wind storm • February 3, 1993 – northeasterly wind storm • December 1, 1992 windstorm - southeasterly downslope wind storm
o Had maximum gust speeds estimated at 112mph • December 26, 1991 - southeasterly downslope wind storm • March 4, 1989 – northeasterly wind storm

Anchorage All-Hazard Mitigation Plan October 2004
4-29
• November 9, 1986 – southeasterly downslope wind storm • February 14, 1979 – northeasterly windstorm
Vulnerability The entire MOA was not included in the Anchorage Area-Wide Wind Speed Study. The area included in the study is shown on Map 4.9. The size of each wind speed zone is shown in table 4.23. The vulnerability tables for each wind speed zone (tables 4.24 – 4.27) only reflect the area included in the study. Table 4.23 Area of Wind Speed Zones
Wind Speed Zone (mph) Acres 90 21,566 80 31,637 100 12,179 105 22,424 Table 4.24 80 mph wind speed Vulnerability in the Anchorage Building Service Area
Land Use # of
Parcels Taxable Value
(Land) Taxable Value
(Buildings) Total Residential 18,276 $936,597,800 $2,496,505,400 $3,432,540,030Commercial 2,176 $345,494,400 $1,116,758,400 $1,415,560,023Industrial 763 $66,722,500 $123,800,000 $189,888,047Institutional 302 $53,987,934 $302 $0Parks, Open Space & Recreation Areas 452 $40,800 $33,700 $74,500Transportation Related 409 $27,900 $0 $27,900Other 74 $72,000 $44,400 $116,400Vacant 1,864 $135,764,500 $89,349,200 $224,899,818Unidentified 969 $104,561,600 $298,227,300 $401,339,047Total 25,285 $1,643,269,434 $4,124,718,702 $5,664,445,765 Table 4.25 90 mph wind speed Vulnerability in the Anchorage Building Service Area
Land Use # of Parcels Taxable Value
(Land) Taxable Value
(Buildings) Total Residential 10,394 $495,963,800 $1,335,784,300 $1,831,593,452Commercial 806 $167,427,700 $314,512,100 $480,179,007Industrial 633 $100,189,800 $146,761,300 $246,278,001Institutional 136 $9,361,900 $141,872,900 $29,601,030
Parks, Open Space & Recreation Areas 169 $12,300 $0 $12,300

Anchorage All-Hazard Mitigation Plan October 2004
4-30
Transportation Related 1 $0 $0 $0Other 12 $0 $0 $0Vacant 2,142 $139,633,600 $114,182,800 $252,670,861Unidentified 590 $152,471,600 $312,639,300 $464,453,728Total 14,883$1,065,060,700$2,365,752,700$3,304,788,379 Table 4.26 100 mph wind speed Vulnerability in the Anchorage Building Service Area
Land Use # of ParcelsTaxable Value
(Land) Taxable Value
(Buildings) Total Residential 12,079 $628,334,900 $1,644,410,600 $2,272,035,678Commercial 193 $53,205,100 $84,940,300 $137,622,919Industrial 74 $7,120,500 $10,208,900 $17,285,097Institutional 87 $2,986,200 $3,420,200 $3,693,072Parks, Open Space & Recreation Areas 209 $0 $0 $0Transportation Related 0 $0 $0 $0Other 30 $188,100 $0 $175,400Vacant 992 $74,884,700 $66,841,200 $141,725,900Unidentified 858 $72,238,600 $153,740,300 $225,943,756Total 14,522 $838,958,100 $1,963,561,500 $2,798,481,822 Table 4.27 105 mph wind speed Vulnerability in the Anchorage Building Service Area
Land Use # of
Parcels Taxable Value
(Land) Taxable Value
(Buildings) Total Residential 8,634 $499,830,500 $1,463,837,100 $1,963,533,200Commercial 24 $10,828,000 $12,115,400 $22,836,124Industrial 16 $2,513,100 $918,900 $3,208,764Institutional 42 $171,600 $372,400 $203,771Parks, Open Space & Recreation Areas 182 $0 $0 $0
Transportation Related 0 $0 $0 $0Other 19 $0 $0 $0Vacant 1,493 $82,675,500 $77,908,800 $160,524,600Unidentified 623 $38,535,700 $61,512,400 $100,048,100Total 11,033 $634,554,400$1,616,665,000$2,250,354,559 Fog Fog is basically a cloud on the ground. When the air is saturated with water vapor, a drop in temperature will cause the excess water vapor to condense into water droplets. These droplets, if thick enough, will turn into fog.

Anchorage All-Hazard Mitigation Plan October 2004
4-31
When it is foggy, ice can be deposited on the roadways causing black ice conditions (Vonderheide, 2003). Location Fog is more frequent in West Anchorage. In the fall and early winter, a northerly wind comes from the north and reduces visibility. In East Anchorage, the drainage winds from the mountains mix the air to help keep the area relatively fog free. Fog can also occur in the lower parts of Eagle River, but it is rare in the higher elevations. Likelihood of Occurrence Fog is likely to occur when the climatic conditions are right. Fog events are usually short-term with no lasting effects. Historic Events No significant historic fog events have been identified to date. Vulnerability As fog could affect the entire Municipality, the entire MOA is represented in Table 4.28. Table 4.28 Fog Vulnerability
Land Use # of
Parcels Taxable Value
(Land) Taxable Value
(Buildings) Total Residential 59,426 $3,066,038,500 $8,334,412,600 $11,398,571,591Commercial 3,419 $605,885,600 $1,579,095,500 $2,132,773,711Industrial 1,610 $180,641,800 $290,159,100 $469,225,809Institutional 702 $26,876,800 $188,839,300 $90,308,164Parks, Open Space & Recreation Areas 1,319 $107,600 $203,400 $311,000Transportation Related 419 $236,100 $165,900 $402,000Other 300 $352,000 $44,400 $307,600Vacant 10,326 $570,157,400 $450,103,500 $1,015,367,523Unidentified 4,325 $419,913,000 $924,182,300 $1,341,953,131Total 81,846 $4,870,208,800 $11,767,206,000 $16,449,220,529 Other Weather Events Other extreme weather events that are possible, but rare, in the MOA include: • Tornados • Coastal Storms • Storm Surges • Thunder and Lightning

Anchorage All-Hazard Mitigation Plan October 2004
4-32
• Hail 4 . 1 . 4 F L O O D I N G Types of Flooding Flooding can be broken into a number of categories including rainfall-runoff floods, snowmelt floods, ground-water floods, ice jam floods, flash floods, fluctuating lake levels, alluvial fan floods and glacial outburst floods. Coastal flooding from storm surge is not a concern in Anchorage because much of the coastal areas are elevated on bluffs. These are not exclusive categories as a flood event could have elements of more than one type. The types of floods in detail are:
Rainfall-Runoff Floods Typically, rainfall-runoff floods occur in mid to late summer. The rainfall intensity, duration, distribution and geomorphic characteristics of the watershed all play a role in determining the magnitude of the flood. This is the most common type of flood. Snowmelt Floods Snowmelt floods usually occur in the spring or early summer. The depth of the snowpack and spring weather patterns influences the magnitude of flooding. Snowmelt floods can also be caused by glacial melt. Ground-water Floods Ground-water flooding occurs when water accumulates and saturates the soil. The water-table rises and floods low-lying areas, including homes, septic tanks, and other facilities. Ice Jam Floods Ice jams can form during fall freeze up, in midwinter when stream channels freeze forming anchor ice and during spring breakup when the existing ice cover gets broken into pieces and the pieces get stuck at bridges or other constrictions. When the ice jam fails, it releases the collected water. Water collects upstream from a jam, flooding an area by creating a lake-like effect that has a large areal extent. The effect is analogous to a dam. Little damage typically occurs from the current upstream of the jam but significant damage can result from flooding. The downstream effect is very different. Once the jam is breached there is usually a rapid draining of the water dammed behind the jam. Not only does the downstream stage rise substantially once the jam is breached, but there is substantial current, which can cause erosion and significant damage. Additionally, the rising water causes the ice to float and the increased velocities move the ice further downstream. The motion of large solid blocks of ice is often very destructive.

Anchorage All-Hazard Mitigation Plan October 2004
4-33
Flash Floods These floods are characterized by a rapid rise in water level. They are often caused by heavy rain on small stream basins, ice jam formation, or by dam failure. Flash floods are usually swift moving and debris filled, which cause them to be very powerful and destructive. Steep coastal areas in general are subject to flash floods. Fluctuating Lake Level Floods Generally, lakes buffer downstream flooding due to the storage capacity of the lake. But when lake inflow is excessive, flooding of the lake shore area can occur. Alluvial Fan Floods Alluvial fans are areas of eroded rock and soil deposited by rivers. When various forms of debris fills the existing river channels on the alluvial fan, the water overflows and is forced to cut a new channel. Fast, debris filled water causes erosion and flooding problems over large areas. The Girdwood area is prone to this type of flooding. Glacial Outburst Floods A glacial outburst flood, also known as a jökulhlaup, is a sudden release of water from a glacier or a glacier-dammed lake. They can fail by overtopping, earthquake activity, melting from volcanic activity, or draining through conduits in the glacier dam. Subglacial releases occur when enough hydrostatic pressure occurs from accumulated water to “float” the glacial ice. Water then drains rapidly from the bottom of the lake.
Other problems related to flooding are deposition and stream bank erosion. Deposition is the accumulation of soil, silt, and other particles on a river bottom or delta. Deposition leads to the destruction of fish habitat and presents a challenge for navigational purposes. Deposition also reduces channel capacity, resulting in increased flooding or bank erosion. Stream bank erosion involves the removal of material from the stream bank. When bank erosion is excessive, it becomes a concern because it results in loss of streamside vegetation, loss of fish habitat, and loss of land and property.

Anchorage All-Hazard Mitigation Plan October 2004
4-34
According to FEMA, flooding in MOA can occur because of a variety of reasons including temperature, precipitation, snow pack levels, etc. (FEMA, 2002). Anchorage has experienced flood issues because of inadequately sized culverts, damaged culverts, blocked culverts, development encroaching and blocking floodplains, and high velocity flows (FEMA, 2002). Location The flood hazard varies by location and type of flooding. The FEMA Flood Insurance Study from 2002 identified potential areas of flooding. The study excluded Fire Island, Elmendorf Air Force Base, Fort Richardson Military Reservation and Kincaid Park (referred to in the study as the Point Campbell Military Reservation). According to this report, most of the development land in MOA is “low, swampy, and subject to inundate from flooding” (FEMA, 2002). Map 4.10 shows flood prone areas in the MOA. This map is for illustrative purposes as not all the floodplains identified on MOA’s Flood Insurance Rate Maps (FIRM) are on this map. The main flood prone areas are near Glacier and California Creeks in Girdwood, near Eagle River Road in Eagle River, Potter’s Marsh, and along Campbell and Chester Creeks in Anchorage. Please see the appropriate FIRM for more detailed flood information. Areas with low development potential or minimal flood hazard include:
• Eklutna River • Fire Creek • Eagle River • Rainbow Creek • Indian Creek • Twenty Mile River • Portage Creek • Placer River • Knik Arm • Turnagain Arm
Much of Girdwood is subject to flooding because Girdwood valley occupies a fluvial valley drained by Glacier and California Creeks. The mouth of the valley is at sea level and gains elevation inland of the Seward Highway (MOA 1996). The entire mouth of the Girdwood valley and the area adjacent to
Flooding generally occurs along the banks of a water body. The Principal Drainages in MOA include:
• Peters Creek • Meadow Creek • Ship Creek • Chester Creek • Fish Creek • Campbell Creek • Rabbit Creek • California Creek • Glacier Creek

Anchorage All-Hazard Mitigation Plan October 2004
4-35
Glacier Creek to the airport is essentially within the 100-year floodplain. Other areas susceptible to flooding are California, Alyeska, and Virgin Creeks. The primary cause of flooding is runoff during heavy rainfall or during rapid snowmelt during the spring (MOA 1995). Likelihood of Occurrence Coastal areas are more likely to flood when there is a storm that causes storm surge, high waves, or intense rainfall. Riverine flooding is more likely to occur in the spring when the snowpack is melting. There is also more chance of flooding in heavy snow seasons. Riverine flooding can also occur in response to heavy rainfall in upstream areas. Glacier outburst floods are not very predictable. Historic Events In September 1995, there was a federal disaster declaration (AK-1072-DR) due to flooding caused by heavy rainfall. Most of the damages were outside MOA but Girdwood was negative impacted. Officials in Girdwood had to shut down the wastewater treatment plant when it was overwhelmed by large volumes of mud and water. This resulted in raw sewage being washed into local creeks. Other flood events August 30, 1989 In August 1989, more than 5 inches of rain fell in the Anchorage area, causing heavy flooding along drainage systems in the MOA. The flooding was concentrated on homes and businesses along Campbell, Chester, and Ship creeks. The flooding resulted in a State Disaster Declaration. February 10, 1978 During February 1978, the south fork of Campbell Creek experienced flooding and glaciation. Glaciation is when a stream freezes to the bottom or a culvert freezes full. The water flowing on top of the ice freezes so more ice develops and spreads into the overbank areas. The flooding affected an area bounded by East 80th, Spruce Avenue, Lake Otis Parkway, and Abbott Loop Road. Many residential structures were threatened with water, ice, and contamination of surface and subsurface water. The flooding resulted in a State Disaster Declaration. June 1966 Glacial outburst flooding last occurred on Lake George in June of 1966. Between 1914 and 1966, the lake flooded almost every June or July. Prior to 1914 though, flooding occurred irregularly. These flood events were caused by the Knik Glacier blocking the valley of Lake George, trapping glacier and

Anchorage All-Hazard Mitigation Plan October 2004
4-36
snow meltwater. The lake enlarges and the water erodes the glacier until it breaks out. The released water can be flowing as fast as 150 million gallons per minute. The flooding threatened structures on the Knik River floodplain (Davis, 1980). Other flooding events are listed in Table 4.29. Table 4.29 Historic Flooding
Flooding Source and Location
Maximum Discharge
(cfs) Date
Estimated Recurrence Interval
(Years) Ship Creek Near Anchorage
1,860 June 1949 50.0
South Fork Campbell Creek at mouth
891 June 1949 100.0
Chester Creek N/A April 1963 5.0 Rabbit Creek N/A June 1964 100.0 Eagle River
6,240 September
1967 N/A
Glacier Creek at Girdwood 7,710
September 1967
20.0
Ship Creek Below Power Plant at
Elmendorf Air Force Base 1,600 August 1971 20.0
Campbell Creek Near Dimond Boulevard
421 August 1971 1.7
Chester Creek At Arctic Boulevard At Anchorage
95 August 1971 1.1
Peters Creek N/A August 1971 50.0 Meadow Creek N/A August 1971 5.0 From: Flood Insurance Study, 2002 Parcels adjacent to waterbodies are the most vulnerable to flooding. The vulnerability shown in tables 4.30 and 4.31 are based on the Municipality’s flood limit GIS file shown in Map 4.12. Table 4.30 100 year Floodplain Vulnerability
Land Use # of
Parcels Taxable Value
(Land) Taxable Value
(Buildings) Total Residential 1213 $88,033,400 $171,439,400 $259,472,800Commercial 103 $20,427,100 $29,252,100 $49,399,249Industrial 127 $10,337,900 $8,721,800 $19,059,700Institutional 31 $6,481,200 $133,160,500 $18,013,780Parks, Open Space & Recreation Areas 300 $66,800 $169,700 $236,500

Anchorage All-Hazard Mitigation Plan October 2004
4-37
Transportation Related 46 $208,200 $165,900 $374,100Other 3 $33,654,200 $12,203,000 $43,930,000Vacant 699 $33,654,200 $12,203,000 $43,930,000Unidentified 104 $17,970,300 $30,225,700 $48,196,000Total 2626 $210,833,300 $397,541,100 $482,612,129 Table 4.31 500 year floodplain Vulnerability
Land Use # of
Parcels Taxable Value
(Land) Taxable Value
(Buildings) Total Residential 461 $50,142,300 $81,725,300 $131,867,600Commercial 26 $2,663,100 $3,314,900 $5,964,954Industrial 19 $101,200 $0 $101,200Institutional 8 $97,400 $120,000 $217,400
Parks, Open Space & Recreation Areas 62 $0 $0 $0Transportation Related 1 $0 $0 $0Other 2 $0 $0 $0Vacant 84 $7,462,000 $2,058,400 $9,520,400Unidentified 44 $7,853,200 $4,770,500 $12,623,700Total 707 $68,319,200 $91,989,100 $160,295,254 For more information about potential vulnerabilities, please see the 2002 Flood Insurance Study. 4 . 1 . 5 A V A L A N C H E A snow avalanche is a swift, downhill-moving snow mass. The amount of damage is related to the type of avalanche, the composition and consistency of the material in the avalanche, the force and velocity of the flow, and the avalanche path. Avalanche Types There are two main types of snow avalanches; loose snow and slab. Other types of avalanches include: cornice collapse, ice, and slush. Loose Snow Avalanches Loose snow avalanches, sometimes called point releases, generally occur when a small amount of uncohesive snow slips and causes more uncohesive snow to go downhill. They occur frequently as small, local cold dry ‘sluffs’ which remove excess snow (involving just the upper layers of snow) keeping the slopes relatively safe. They can be large and destructive, though. For example, wet loose snow avalanches occurring in the spring are very damaging. Loose snow avalanches can also trigger slab avalanches.

Anchorage All-Hazard Mitigation Plan October 2004
4-38
Loose snow avalanches typically occur on slopes above 35 degrees, leaving behind an inverted V-shaped scar. They are often caused by snow overloading (common during or just after a snowstorm), vibration, or warming (triggered by rain, rising temperatures or solar radiation). Slab Avalanches Slab avalanches are the most dangerous types of avalanches. They happen when a mass of cohesive snow breaks away and travels down the mountainside. As it moves, the slab breaks up into smaller cohesive blocks. Slab avalanches usually require the presence of structural weaknesses within interfacing layers of the snowpack. The weakness exists when a relatively strong, cohesive snow layer overlies weaker snow or is not well bonded to the underlying layer. The weaknesses are caused by changes in the thickness and type of snow covers due to changes in temperature or multiple snowfalls. The interface fails for several reasons. It can fail naturally by earthquakes, blizzards, temperature changes or other seismic and climatic causes, or artificially by human activity. When a slab is released, it accelerates, gaining speed and mass as it travels downhill. The slab is defined by fractures. The uppermost fracture delineating the top line of the slab is termed the “crown surface”, the area above that is called the crown. The slab sides are called the flanks. The lower fracture indicating the base of the slab is called the “stauchwall”. The surface the slab slides over is called the “bed surface”. Slabs can range in thickness from less than an inch to 35 feet or greater. Cornice Collapse A cornice is an overhanging snow mass formed by wind blowing snow over a ridge crest or the sides of a gulley. The cornice can break off and trigger bigger snow avalanches when it hits the wind-loaded snow pillow. Ice Fall Avalanche Ice fall avalanches result from the sudden fall of broken glacier ice down a steep slope. They can be unpredictable as it is hard to know when ice falls are imminent. Despite what some people think, they are unrelated to temperature, time of day, or other typical avalanche factors. Slush Avalanches Slush avalanches occur mostly in high latitudes. Part of the reason they are more common in high latitudes is because of the rapid onset of snowmelt in the spring. Slush avalanches can start on slopes from 5 to 40 degrees but usually not above 25 to 30. The snowpack is totally or partially water saturated. The release is associated with a bed surface that is nearly

Anchorage All-Hazard Mitigation Plan October 2004
4-39
impermeable to water. It is also commonly associated with heavy rainfall or sudden intense snowmelt. Additionally, depth hoar is usually present at the base of the snow cover. Slush avalanches can travel slowly or reach speeds over 40 miles per hour. Their depth is variable as well, ranging from 1 foot to over 50 feet deep. Avalanche Terrain Factors There are several factors that influence avalanche conditions. The main factors are slope angle, slope aspect, and terrain roughness. Other factors include slope shape, vegetation cover, elevation, and path history. Avalanches usually occur on slopes above 25 degrees. Below 25 degrees, there usually is not enough stress on the snowpack to get it to slide. Above 60 degrees, the snow tends to ‘sluff’ off and does not have the opportunity to accumulate. Avalanches can occur outside this slope angle range, but are not as common. Slope aspect, also called orientation, describes the direction a slope faces with respect to the wind and sun. Leeward slopes loaded by wind-transported snow are problematic because the wind-deposited snow increases the stress and enhances slab formation. Intense direct sunlight, primarily during the spring months, can weaken and lubricate the bonds between the snow grains, weakening the snowpack. Shaded slopes are potentially more unstable because the weak layers are held for a longer time in an unstable state. Terrain influences snow avalanches because trees, rocks, and general roughness act as anchors, holding snow in place. However, once an anchor is buried by snow, it loses its effectiveness. Anchors make avalanches less likely but do not prevent them unless the anchors are so close together that a person could not travel between them. Avalanche Path The local terrain features determine an avalanche’s path. The path has 3 parts: the starting zone, the track, and the run-out zone. The starting zone is where the snow breaks loose and starts sliding. It is generally near the top of a canyon, bowl, ridge, etc., with steep slopes between 25 and 50 degrees. Snowfall is usually significant in this area. The track is the actual path followed by an avalanche. The track has milder slopes, between 15 and 30 degrees, but this is where the snow avalanche will reach maximum velocity and mass. Tracks can branch, creating

Anchorage All-Hazard Mitigation Plan October 2004
4-40
successive runs that increase the threat, especially when multiple releases share a run-out zone. The run-out zone is a flatter area – around 5 to 15 degrees. It is located at the path base where the avalanche slows down, resulting in snow and debris deposition. The impact pressure determines the amount of damage caused by a snow avalanche. The impact pressure is related to the density, volume (mass) and velocity of the avalanche. Location Avalanches can occur anywhere, but gullies, steep snow-covered slopes, and areas below steep ridges are particularly susceptible. To identify avalanche prone areas in Anchorage, a study called the Anchorage Snow Avalanche Zoning Analysis was conducted in 1982 by Arthur Mears. This report identified moderate (blue) and high (red) hazard areas, as shown in Map 4-11. The report describes the red zone as subject to avalanches with a 10-year average return period and the blue zone as prone to avalanches with a 100-year average return period. Like with a flood, this does not mean the avalanche will occur every 10 or 100 years respectively. Instead, a 10-year avalanche has a 10% annual probability while a 100-year event has a 1% probability. Because the average return period is used, a 10-year avalanche could have a return period of 3 to 30 years while a 100-year avalanche has a return period of approximately 30 to 300 years. Events greater than the 100-year avalanche will affect parcels outside the blue zone. The area with the potential for the largest avalanches is the Girdwood/Crow Creek area. Evidence of snow avalanches is prominent along the mountainsides above the Girdwood valley. The western mountainside has high and moderate avalanche dangers from Turnagain Arm to California Creek. Avalanche hazard is moderate to high on the eastern mountainside at head of the valley, near the day lodge and resort area, and southeast of Virgin Creek. Alyeska’s daylodge and day parking are located partially in both the moderate and high avalanche hazard areas. Part of the original base area hotel and condos are in a moderate hazard area.
Avalanche impact pressures related to damage
Impact pressures Potential Damage Kilopascals (kPa)
Pounds per square foot (Lbs/ft2)
2-4 40-80 Break windows 3-6 60-100 Push in doors, damage
walls, roofs 10 200 Severely damage wood
frame structures 20-30 400-600 Destroy wood frame
structures, break trees 50-100 1000-2000 Destroy mature forests

Anchorage All-Hazard Mitigation Plan October 2004
4-41
Other areas south of the Anchorage Bowl which may experience avalanches are Bird Creek, Indian, and Rainbow areas. North of the Anchorage Bowl, the areas near the South Fork of Eagle River, Eagle River, Peters Creek (especially near what is locally known as 4-mile), and Mirror Lake/N.W. Spur of Mt. Eklutna have avalanche potential. For more details, please refer to the Anchorage Snow Avalanche Zoning Analysis. Another avalanche prone area is the Seward Highway between the flats near Bird Point and the entrance to Girdwood’s valley (CSAC, 2004). This may be one of the most dangerous stretches of highway for avalanches because of the traffic volumes. In this area, avalanches have caused numerous accidents, killed at least 5 people directly, and caused other deaths from drowning by sweeping people into Turnagain arm (CSAC, 2004). Likelihood of Occurrence Multiple avalanches occur every year, but they usually occur in more remote areas. The number and location depends on the conditions - the formation of weak layers in the snow, wind loading, terrain, etc. On a large scale, avalanches are hard to predict because the conditions change and can vary from hour to hour in the winter. Historic Events The most remembered avalanche in recent history are those associated with the 2002 winter storms. The avalanches resulting in road and rail access to Girdwood being blocked, disruption of electrical service, property damage, and the death of a heavy equipment operator who was clearing debris from an earlier avalanche off the Seward Highway. The section of New Seward Highway from Bird Point to Girdwood is very avalanche-prone. Between 1951, when the Seward Highway opened, and 1998, avalanches have blocked the road at least 485 times and have been a factor in more than 60 accidents (Cyperspace Snow and Avalanche Center, 2004). A six mile stretch of highway was relocated in 1998 (from mountainside to a new sea level route) and was expected to reduce avalanche danger by approximately 70%. See Table 4.32 for more known historic avalanche events. Table 4.32 Known Historic Avalanche Events
Date Description November 11, 2003
A self-triggered slab avalanche occurred in the Chugach State Park on Triangle Peak near the head of the South Fork of the Eagle River Valley. One man was partially buried but his 2 companions were able to dig him out.

Anchorage All-Hazard Mitigation Plan October 2004
4-42
Date Description April 1, 2002
An avalanche occurred on the south side of Mount Magnificent killing two snowshoers. A third man was caught in the avalanche but he was able to free himself. The avalanche triggered other slides in the area.
March 28, 2002
Two backcountry skiers and two dogs triggered an avalanche in the south bowl of Three Bowl Path near Mile 6.6 of Hiland Road in Eagle River. One skier was buried under 4 feet of debris and was rescued by the other skier. The following day, while searching for the dogs, a rescuer triggered another slide that hit a house. The slide damaged the fence but not the house; however there were several feet of debris against the back wall.
November 11, 2000
On the North Gully of Flat Top Mountain, in the Chugach State Park, one person was severely injured when they were caught by a small slab avalanche.
Feb 1, 2000
Avalanche near Bird Flats on the Seward Highway. An Alaska Railroad employee who was helping clear previous slides from the highway was killed when the avalanche struck the bulldozer he was operating. Three avalanches occurred that day. This specific avalanche occurred at the Five Fingers chute, and was estimated to have crossed the highway between 100 and 125 miles per hour. Slides also occurred at Mile 5.7 on the Eklutna Lake Road, Mile 7.5 of the Old Glenn Highway, and the Glenn Highway at Mile 95.
Late 1999 and early 2000 saw avalanches in Cordova, Valdez, Anchorage, Whittier, Cooper Landing, Moose Pass, Summit, Matanuska Susitna Valley, and Eklutna from the Central Gulf Coast Storm.
January 25, 2000
An avalanche occurred in the High Traverse area of Alyeska Resort. All skiers in the area were accounted.
March 1999
An avalanche at Alyeska Resort partially buried two skiers. This was the first time in 25 years that an avalanche hit skiers at the resort.
Dec 7,1997
One woman was killed in a self-triggered soft slab avalanche while hiking on the Crow Pass Trail. Her companion was not caught by the avalanche but was unable to locate her.
April 1997
There was a series of avalanches between April 5th and 11th that involved skiers, climbers and snowmachiners. A snowmachiner was killed in one of those accidents. http://www.sarinfo.bc.ca/Library/Rescues/girwood.AK
1987-88
Several (34) avalanches reached the Seward Highway. Some of the avalanches resulted in temporary highway closures and downed power poles. One avalanche, near Super Scooper (MP 94), struck a vehicle on the highway.

Anchorage All-Hazard Mitigation Plan October 2004
4-43
Date Description January 1980
Near MP 94, in a chute called Super Scooper, an avalanche hit a vehicle and derailed 4 locomotives and 13 cars of a freight train. Later that winter, avalanches blocked the road again, closing it for 4 days.
March 1979
A series of storms near Bird Hill caused 24 avalanches over several weeks. One slide, with 33 separate tongues, buried 2 miles of highway closing it for 3 days.
1978
Seward Highway was blocked at least 17 times. One series of slides trapped 20 cars on Bird Hill. Another slide, near MP 99, hit one car and took high voltage lines off 13 poles.
1959-60
The Seward Highway was blocked by avalanches at least 81 times because of frequent blizzards in the Bird Hill area.
1952
On the Girdwood Flats near milepost 91.8, an avalanche hit several cars on the highway. One person got out of their vehicle and was hit by a second slide and subsequently died.
1920
Near MP 91, an avalanche buried an Alaska Railroad train. As the train’s occupants started to dig themselves out, the train was struck by a second slide. This slide buried 25 people and 4 killed others. It has been reported that several people were swept into Turnagain Arm and drowned.
1918
An avalanche near the present Seward Highway MP 92 killed several draft horses and knocked a telegraph pole over.
Source: the Cyperspace Snow and Avalanche Center (www.csac.org) unless otherwise noted.
Additional avalanche events are listed in Mears, 1993 and Mears, 1982. Vulnerability The avalanche vulnerability is calculated using the areas in the MOA’s avalanche GIS file (shown in Map 4-11). The number of parcels in a high risk avalanche area is shown in table 4.33 while those in a moderate risk area are shown in table 4.34. Table 4.33 High Hazard Area Vulnerability
Land Use # of ParcelsTaxable Value
(Land) Taxable Value
(Buildings) Total Residential 88 $5,560,300 $10,747,700 $16,306,331Commercial 7 $8,200 $0 $8,200Industrial 1 $0 $0 $0Institutional 1 $0 $0 $0

Anchorage All-Hazard Mitigation Plan October 2004
4-44
Parks, Open Space & Recreation Areas 58 $0 $0 $0Transportation Related 0 $0 $0 $0Other 1 $0 $0 $0Vacant 162 $7,533,800 $1,576,000 $8,998,700Unidentified 50 $584,500 $357,800 $942,300Total 368 $13,686,800 $12,681,500 $26,255,531 Table 4.34 Moderate Hazard Area Vulnerability
Land Use # of ParcelsTaxable Value
(Land) Taxable Value
(Buildings) Total Residential 161 $8,264,800 $32,891,600 $32,891,600Commercial 2 $267,800 $179,900 $447,700Industrial 0 $0 $0 $0Institutional 0 $0 $0 $0Parks, Open Space & Recreation Areas 7 $0 $0 $0Transportation Related 0 $0 $0 $0Other 1 $0 $0 $0Vacant 123 $5,452,500 $1,639,000 $6,917,300Unidentified 15 $279,300 $214,900 $494,200Total 309 $14,264,400 $34,925,400 $40,750,800 4 . 1 . 6 L A N D S L I D E / G R O U N D F A I L U R E Ground failure is a general term used to describe hazards that affect the stability of the ground. It can occur in many different ways including landslides, land subsidence, and failures related to seasonally frozen ground and permafrost. Frequently, ground failure occurs as the result of another hazard such as a earthquake or volcanic eruption. Landslides Landslide is a generic term for a variety of downslope movements of earth material under the influence of gravity. Some landslides occur rapidly, in mere seconds, while others might take weeks or longer to develop. Landslides usually occur in steep areas but not exclusively. They can occur as ground failure of river bluffs, cut-and-fill failures associated with road and building excavations, collapse of mine-waste piles, and slope failures associated with open-pit mines and quarries. Underwater landslides usually involve areas of low relief and slope gradients in lakes and reservoirs or in offshore marine setting.

Anchorage All-Hazard Mitigation Plan October 2004
4-45
Landslides can occur naturally or be triggered by human activities. They occur naturally when inherent weaknesses in the rock or soil combine with one or more triggering events such as heavy rain, snowmelt, changes in groundwater level, and seismic or volcanic activity. They can be caused by long-term climate change that results in increased precipitation, ground saturation and a rise in groundwater level, which reduces the shear strength and increases the weight of the soil. Erosion that removes material from the base of a slope can also cause naturally triggered landslides. Human activities that trigger landslides are usually associated with construction such as grading that removes material from the base, loads material at the top, or otherwise alters a slope. Changing drainage patterns, groundwater level, slope and surface water, for example, the addition of water to a slope from agricultural or landscape irrigation, roof downspouts, septic-tank effluent, or broken water or sewer lines can also cause landslides. Three main factors that influence landslides are topography, geology, and precipitation. Topography and geology are associated with each other; the steeper the slope, the greater the influence from gravity. Rock strength is important as certain bedrock formations or rock types appear to be more prone than others to landsliding. Precipitation may erode and undermine slope surfaces. If precipitation is absorbed into the ground, it increases the pore water pressure and lubricates weak zones of rock or soil. Types of Landslides Landslides are usually classified by five types of movement; falls, topples, lateral spreads, slides, and flows. A combination of two or more types is called a complex movement. Each type can be further broken down based on the type of material involved. Table 4.35 summarizes the types of landslides.
Table 4.35 Principal Landslides Types: Type of Material
Type of Movement Bedrock
Debris (Course Soil)
Earth (Fine Soil)
Falls Rock fall Debris fall Earth fall Topples Rock topple Debris topple Earth topple
Rotational Rock slump Debris slump Earth slump
Rock block slide Debris block slide Earth block slide Slides Translational
Rock slide Debris slide Earth slide
Lateral Spreads Rock spread Debris spread Earth lateral spread
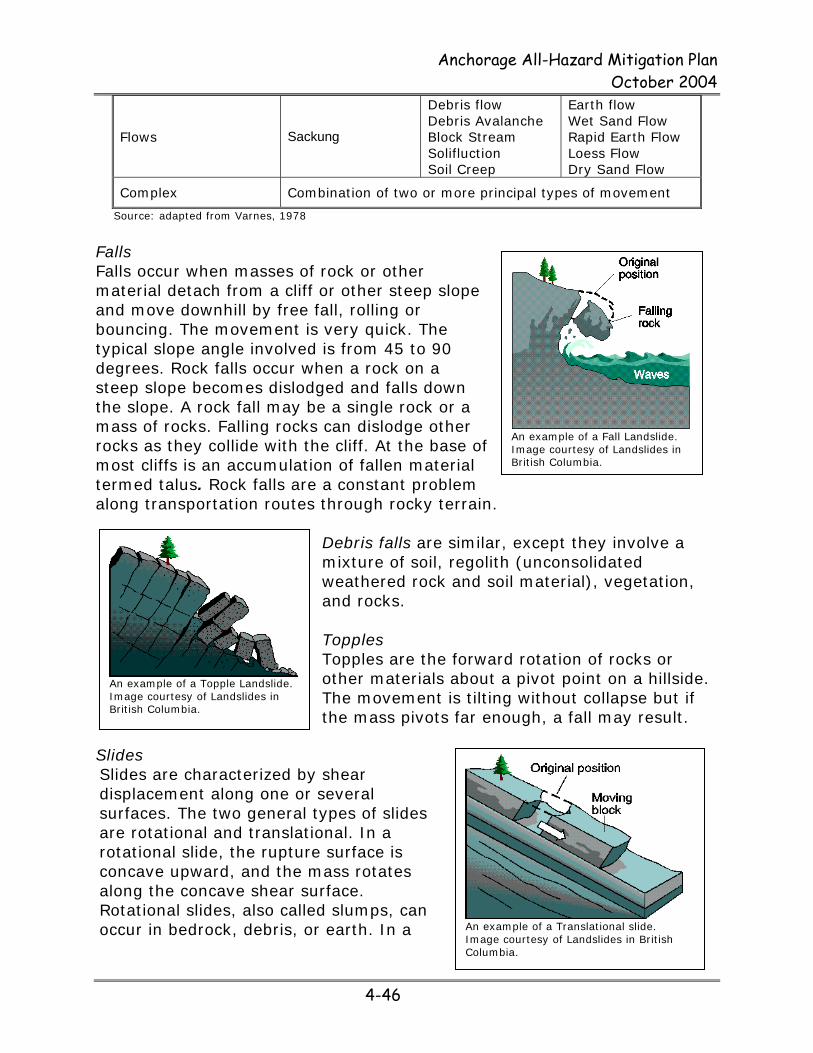
Anchorage All-Hazard Mitigation Plan October 2004
4-46
Flows Sackung
Debris flow Debris Avalanche Block Stream Solifluction Soil Creep
Earth flow Wet Sand Flow Rapid Earth Flow Loess Flow Dry Sand Flow
Complex Combination of two or more principal types of movement
Source: adapted from Varnes, 1978
Falls Falls occur when masses of rock or other material detach from a cliff or other steep slope and move downhill by free fall, rolling or bouncing. The movement is very quick. The typical slope angle involved is from 45 to 90 degrees. Rock falls occur when a rock on a steep slope becomes dislodged and falls down the slope. A rock fall may be a single rock or a mass of rocks. Falling rocks can dislodge other rocks as they collide with the cliff. At the base of most cliffs is an accumulation of fallen material termed talus. Rock falls are a constant problem along transportation routes through rocky terrain.
Debris falls are similar, except they involve a mixture of soil, regolith (unconsolidated weathered rock and soil material), vegetation, and rocks. Topples Topples are the forward rotation of rocks or other materials about a pivot point on a hillside. The movement is tilting without collapse but if the mass pivots far enough, a fall may result.
Slides Slides are characterized by shear displacement along one or several surfaces. The two general types of slides are rotational and translational. In a rotational slide, the rupture surface is concave upward, and the mass rotates along the concave shear surface. Rotational slides, also called slumps, can occur in bedrock, debris, or earth. In a
An example of a Translational slide. Image courtesy of Landslides in British Columbia.
An example of a Fall Landslide. Image courtesy of Landslides in British Columbia.
An example of a Topple Landslide. Image courtesy of Landslides in British Columbia.

Anchorage All-Hazard Mitigation Plan October 2004
4-47
translational slide, the rupture surface is a smooth or gently rolling slope. In bedrock and earth, translational slides are sometimes called block slides if an intact mass slides down the slope. If rock fragments or debris slide down a slope on a distinct shear plane, the movements are called rockslides or debris slides. It is obvious that confusion can result by referring to all types of landslides as “slides”.
Lateral Spreads Lateral spreads involve the horizontal displacement of the surface. They often occur on gentle slops that range between 0.3° and 3°. Lateral spreads can occur in rock but this process is not well documented and movement rates can be quite slow. They are more common in fine-grained soils, such as clay, especially if the soil has been remodeled or disturbed by construction, grading or similar activities.
Loose granular soils commonly produce lateral spreads through liquefaction (where saturated soils are transformed from a solid into a liquefied state). Liquefaction can occur spontaneously because of changes in pore-water pressure or in response to vibrations such as those produced by seismic activity. Lateral spreads typically damage pipelines, utilities, bridges, and other structures having shallow foundations. Flows In general, a flow is a moving mass that has differential internal movements that are distributed throughout the mass. They differ from slides by their higher water content and the distribution of velocities that resembles a viscous fluid. Flows in bedrock, also called sackung, gravitational sagging or rock flow, are not common, nor is the process very well understood. Flows in debris include soil creep, solifluction, block streams, debris flows, and debris avalanches. Soil creep is an imperceptibly slow, steady downward movement of slope-forming soil or rock due to gravity. Creep can occur due to alternate wetting and drying which expands and contracts the ground. Creep is more of a problem where the ground freezes and thaws or where clay minerals are present because many of them expand considerably when they contact water. Evidence of soil creep includes bent fences or retaining walls, curved tree trunks, and tilted poles.
An example of a flow. Image courtesy of Landslides in British Columbia.
An example of a rotational slide or slump. Image courtesy of Landslides in British Columbia.

Anchorage All-Hazard Mitigation Plan October 2004
4-48
Solifluction is a slow downward flow of water-saturated soil. It is often observed in areas with perennially or permanently frozen ground because the frozen ground traps snow and ice melt within the surface layer making it more fluid. Meltwater and rain saturate the soil in the springtime because they cannot percolate into the frozen layers below. The surface layers thaw to only a small depth
during the short summer. This creates a very unstable situation at the interface between the frozen and unfrozen layers. The whole surface layer tends to move together as a cohesive mass. Solifluction can occur on even moderate slopes, because of the ease with which a lobe slides on the frozen substratum. Solifluction does not occur abruptly, but solifluction lobes can move downhill several inches per day. Block streams are slow moving tongues of rocky debris on steep slopes, which are often fed by talus cones. A debris flow is a rapid movement of loose soil, rock, and organic matter combined with water and air to form a downward moving slurry. The slurry can travel several miles from its source, growing in size as it picks up trees, cars, and other materials along the way. Debris flows tend to occur on slopes in the 20-45 degree range. They are usually associated with unusually heavy precipitation or with rapid snowmelt. They can also occur following the bursting of a natural dam formed by landslide debris, glacial moraine, or glacier ice. The phrase “debris avalanche” describes a very fast debris flow associated with volcanic hazards, usually strato-volcanoes because of their steep slopes and large amounts of easily remobilized materials.
In fine soils (earth) include earth flows, loess flows, dry sand flows, wet sand flows, rapid earth flows, and mudflows. Earth flows are very slow to rapid flows with a characteristic hourglass shape. A bowl or depression forms at the source where the unstable material collects and flows out. The central area, the flow track, is narrow and usually becomes wider as it reaches the valley floor. Earth flows generally occur in fine-grained materials or clay-bearing rock on moderate slopes and with saturated conditions.
An example of a creep. Image courtesy of Landslides in British Columbia.
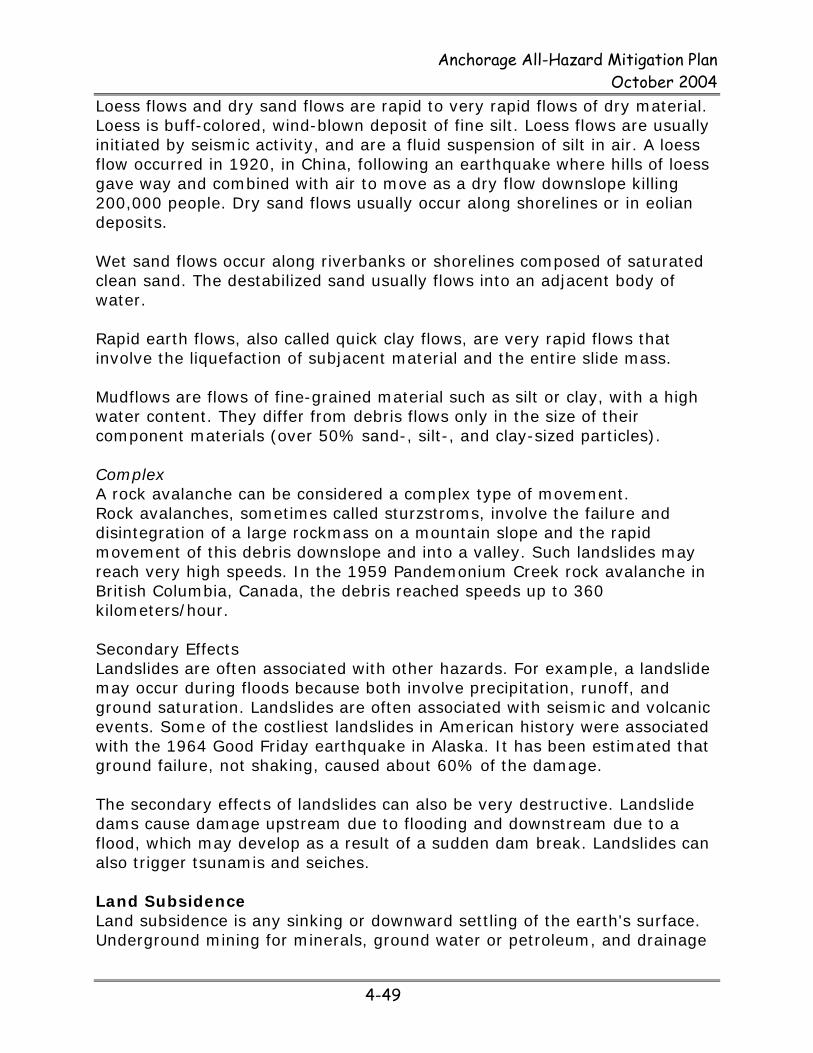
Anchorage All-Hazard Mitigation Plan October 2004
4-49
Loess flows and dry sand flows are rapid to very rapid flows of dry material. Loess is buff-colored, wind-blown deposit of fine silt. Loess flows are usually initiated by seismic activity, and are a fluid suspension of silt in air. A loess flow occurred in 1920, in China, following an earthquake where hills of loess gave way and combined with air to move as a dry flow downslope killing 200,000 people. Dry sand flows usually occur along shorelines or in eolian deposits.
Wet sand flows occur along riverbanks or shorelines composed of saturated clean sand. The destabilized sand usually flows into an adjacent body of water. Rapid earth flows, also called quick clay flows, are very rapid flows that involve the liquefaction of subjacent material and the entire slide mass. Mudflows are flows of fine-grained material such as silt or clay, with a high water content. They differ from debris flows only in the size of their component materials (over 50% sand-, silt-, and clay-sized particles). Complex A rock avalanche can be considered a complex type of movement. Rock avalanches, sometimes called sturzstroms, involve the failure and disintegration of a large rockmass on a mountain slope and the rapid movement of this debris downslope and into a valley. Such landslides may reach very high speeds. In the 1959 Pandemonium Creek rock avalanche in British Columbia, Canada, the debris reached speeds up to 360 kilometers/hour. Secondary Effects Landslides are often associated with other hazards. For example, a landslide may occur during floods because both involve precipitation, runoff, and ground saturation. Landslides are often associated with seismic and volcanic events. Some of the costliest landslides in American history were associated with the 1964 Good Friday earthquake in Alaska. It has been estimated that ground failure, not shaking, caused about 60% of the damage. The secondary effects of landslides can also be very destructive. Landslide dams cause damage upstream due to flooding and downstream due to a flood, which may develop as a result of a sudden dam break. Landslides can also trigger tsunamis and seiches. Land Subsidence Land subsidence is any sinking or downward settling of the earth's surface. Underground mining for minerals, ground water or petroleum, and drainage

Anchorage All-Hazard Mitigation Plan October 2004
4-50
of organic materials are typical causes of subsidence. However, these are rare in Alaska. More common causes of land subsidence in Alaska are sediment compaction and seismic or volcanic activity. Based on previous experience, the Portage and Girdwood areas are susceptible to subsidence. Seasonally Frozen Ground Frost action is the seasonal freezing and thawing of water in the ground and its effect on the ground and development. Frost heave is when ice formation causes an upward displacement of the ground. When the ground ice thaws, the ground loses bearing strength and its ability to support structures is weakened. This is a widespread problem in Alaska. Permafrost Ground failure related to permafrost is not a significant problem in Anchorage. Permafrost is frozen ground in which a naturally occurring temperature below 32o Fahrenheit has existed for two or more years. Approximately 85 percent of Alaska lies within the permafrost region. Permafrost is continuous in extent over most of the Arctic but becomes discontinuous and sporadic or isolated as one proceeds further south. Only the southern coastal margins are completely permafrost-free. Permafrost can form an extremely strong and stable foundation material if it is kept in the frozen state, but if it is allowed to thaw, the soil becomes extremely weak and fails. Permafrost can thaw in response to general climate changes and warming or human activity. As Map 4.12 shows, permafrost is not common in Anchorage. In fact, “Anchorage is essentially free of permafrost except at very high locations” (USACE, 2002). Seismically-Induced Ground Failure In 1979, a Geotechnical Hazards Assessment Study was developed to “inventory all geotechnical data significant with respect to geologic hazards, to analyze the data to provide an indication of the degree of hazard and to designate those areas of potential hazards upon a series of maps” (Harding-Lawson, 1979:3). This study resulted in the seismically-induced ground failure map (Map 4-15) which is used today. The map shows there is a very high risk of seismically induced ground failure in the Earthquake Park area, parts of south addition and downtown. The risk is high along the coast, Westchester Lagoon, near the Chester Creek greenbelt, around Campbell Lake, and Government Hill. The risk is moderate in the immediate area around Chester Creek greenbelt, most of Anchorage west of the New Seward Highway. The risk is moderately low on the hillside

Anchorage All-Hazard Mitigation Plan October 2004
4-51
and in East Anchorage. The area with the lowest risk of seismically induced ground failure is near the Chugach Mountains. Landslides It is hard to identify high and moderate hazard zones of hazard intensity for the different types of landslides. For example, hazard zones for rock falls can’t be identified because the risk depends a lot on the size of the rocks involved. It is known that the bluff near Points Campbell and Woronzof is a “narrow zone of very unstable material with a strong risk of landslide” (Mason, 1997: 198-199). The area near Campbell Lake has a high risk of landslides (Mason, 1997). “Debris flows occur in small, steep drainage basins throughout the” Glacier/Winner Creek area (Mears, 1993:13). Likelihood of Occurrence Ground failure events are hard to predict as many of them are triggered by other events such as an earthquake. Historic Events The 1964 earthquake triggered a wide variety of falls, slides and flows through Southcentral Alaska. The Anchorage area was heavily impacted because of Bootlegger Cove clay failures. Some of the more significant events occurred at Fourth Avenue, L Street, Government Hill, and Turnagain Heights. Several, less devastating slides occurred throughout town, including slides at Point Woronzof and the Potter Hill slides. The Government Hill slide was a complex movement. The Government Hill Elementary school was severely damaged by the translational slide. The south wing of the school dropped about 30 feet while the east wing split lengthwise and collapsed. Part of this slide became an earth flow that spread 150 feet across the flats into the Alaska Railroad yards. The Turnagain Heights landslide is also considered a complex movement. In fact, it was probably the most complex of all the Anchorage landslides associated with the Good Friday earthquake. The landslide likely began as a block slide but evolved to include lateral spreading, slumping and possibly other types of movement. This landslide caused serious damage to a housing development, in which three people died. The earthquake caused at least one rock avalanche as a slab of rock became detached from the mountain peak overlooking Sherman Glacier. The rock slab disintegrated as it moved downhill, helping it achieve great velocities and extend a great distance over the glacier. Rockslides were also triggered including “one relatively significant event in the Winner Creek drainage” (Mears, 1993:12).

Anchorage All-Hazard Mitigation Plan October 2004
4-52
Extensive subsidence also occurred as a result of the 1964 Good Friday Earthquake. The zone of subsidence covered about 110,039 square miles, including the north and west parts of Prince William Sound, the west part of the Chugach Mountains, most of Kenai Peninsula, and almost all the Kodiak Island group. Some areas saw subsidence that exceeded 7 feet but most areas subsided less. For example, part of the Seward area is about 3.5 feet lower than before the earthquake and portions of Whittier subsided more than 5 feet. The village of Portage, at the head of Turnagain Arm of Cook Inlet, experienced 6 feet of tectonic subsidence during the earthquake. Vulnerability An earthquake could cause seismically induced ground failure. The susceptibility for seismically induced ground failure has only been determined for the part of the Municipality shown in Map 4.13. Table 4.36 gives the size of each susceptibility zone. Table 4.36 Area in each Seismically Induced Ground Failure Zone
Zone Acres Lowest 26,287 Moderately Low 39,603 Moderate 20,021 High 3,740 Very High 1,085 The values in tables 4.37 to 4.41 reflect the area that has been mapped. Table 4.37 Very High Ground Failure Susceptibility Vulnerability
Land Use # of
Parcels Taxable Value
(Land) Taxable Value
(Buildings) Total Residential 1,359 $110,104,200 $214,441,000 $324,504,694Commercial 129 $15,662,900 $93,312,900 $108,621,762Industrial 35 $4,796,300 $7,631,000 $12,396,240Institutional 23 $318,500 $1,905,700 $2,224,200Parks, Open Space & Recreation Areas 59 $0 $0 $0Transportation Related 13 $0 $0 $0Other 4 $0 $0 $0Vacant 165 $10,754,400 $4,348,300 $14,940,100Unidentified 25 $2,061,400 $3,344,000 $5,405,400Total 1,812 $143,697,700 $324,982,900 $468,092,396

Anchorage All-Hazard Mitigation Plan October 2004
4-53
Table 4.38 High Ground Failure Susceptibility Vulnerability
Land Use # of
Parcels Taxable Value
(Land) Taxable Value
(Buildings) Total Residential 3,141 $235,070,600 $512,578,800 $747,347,452Commercial 478 $62,848,000 $254,915,600 $316,879,914Industrial 150 $12,129,000 $26,953,100 $39,040,474Institutional 44 $0 $0 $0Parks, Open Space & Recreation Areas 162 $0 $0 $0Transportation Related 31 $0 $0 $0Other 23 $46,400 $0 $46,400Vacant 381 $30,861,500 $22,109,000 $52,921,564Unidentified 112 $13,426,300 $29,085,600 $42,449,722Total 4,522 $354,381,800 $845,642,100 $1,198,685,526 Table 4.39 Moderate Ground Failure Susceptibility Vulnerability
Land Use # of
Parcels Taxable Value
(Land) Taxable Value
(Buildings) Total Residential 16,808 $789,993,400 $2,231,684,700 $3,021,577,100Commercial 1,049 $210,474,400 $564,456,300 $771,096,678Industrial 827 $120,562,000 $188,263,500 $307,831,147Institutional 150 $14,041,700 $151,156,900 $43,565,084Parks, Open Space & Recreation Areas 355 $53,100 $33,700 $86,800Transportation Related 337 $0 $0 $0Other 44 $0 $0 $0Vacant 3,013 $202,860,100 $158,722,900 $361,513,561Unidentified 1,106 $213,396,300 $522,872,500 $734,240,581Total 23,689 $1,551,381,000 $3,817,190,500 $5,239,910,951 Table 4.40 Moderately Low Ground Failure Susceptibility Vulnerability
Land Use # of
Parcels Taxable Value
(Land) Taxable Value
(Buildings) Total Residential 26,611 $1,312,291,600 $3,625,135,700 $4,936,308,714Commercial 1,543 $199,196,700 $496,178,100 $652,487,228Industrial 468 $38,570,000 $58,612,400 $96,716,684Institutional 349 $27,900 $0 $27,900Parks, Open Space & Recreation Areas 394 $0 $0 $0Transportation Related 29 $27,900 $0 $27,900Other 56 $213,700 $131,176,000 $284,766,254Vacant 2,485 $154,728,400 $131,176,000 $284,766,254Unidentified 1,664 $127,518,200 $259,607,100 $387,073,528Total 33,599 $1,832,574,400 $4,701,885,300 $6,642,174,462

Anchorage All-Hazard Mitigation Plan October 2004
4-54
Table 4.41 Lowest Ground Failure Susceptibility Vulnerability
Land Use # of
Parcels Taxable Value
(Land) Taxable Value
(Buildings) Total Residential 1,684 $122,906,200 $384,745,400 $507,651,600Commercial 0 $0 $0 $0Industrial 4 $357,400 $7,500 $322,564Institutional 1 $0 $0 $0Parks, Open Space & Recreation Areas 30 $0 $0 $0Transportation Related 0 $0 $0 $0Other 4 $0 $0 $0Vacant 835 $180,763,000 $438,169,700 $84,168,500Unidentified 158 $12,575,500 $14,172,200 $26,747,700Total 2,716 $316,602,100 $837,094,800 $618,890,364 4 . 1 . 7 T S U N A M I Tsunamis are traveling gravity waves in water, generated by a sudden vertical displacement of the water surface. They are typically generated by an uplift or drop in the ocean floor, seismic activity, volcanic activity, meteor impact, or landslides (above or under sea in origin). Most tsunamis are small and are only detected by instruments. Tsunami damage is a direct result of three factors: inundation (extent the water goes over the land), wave impact on structures and coastal erosion. Types of Tsunamis Tele-tsunami Tele-tsunami is the term for a tsunami observed at places 1,000 kilometers from their source. In many cases, tele-tsunamis can allow for sufficient warning time and evacuation. No part of Alaska is expected to have significant damage due to a tele-tsunami. Therefore, tele-tsunamis are not a significant threat in Anchorage. Volcanic tsunamis There has been at least one confirmed volcanically triggered tsunami in Alaska. Other volcanic events may have caused tsunamis but there is not enough evidence to report that conclusively. Many volcanoes have the potential to generate tsunamis.
Tsunami Magnitude and Height
relationships Magnitude Height (ft)
-2 to –1 <1.0 to 2.5 -1 to 0 2.5 to 4.9 0 to 1 4.9 to 9.9 1 to 2 9.9 to 19.7 2 to 3 19.7 to
34.2 3 to 4 34.2 to
79.0 4 to 5 79 to
>105.0

Anchorage All-Hazard Mitigation Plan October 2004
4-55
Seismically-generated local tsunamis Most seismically-generated local tsunamis have occurred along the Aleutian Arc. Other locations include the back arc area in the Bering Sea and the eastern boundary of the Aleutian Arc plate. They generally reach land 20 to 45 minutes after starting. Landslide-generated tsunamis Submarine and subaerial landslides can generate large tsunamis. Subaerial landslides have more kinetic energy associated with them so they trigger larger tsunamis. An earthquake usually, but not always, triggers this type of landslide and they are usually confined to the bay or lake of origin. One earthquake can trigger multiple landslides and landslide-generated tsunamis. Low tide is a factor for submarine landslides because low tide leaves part of the water-saturated sediments exposed without the support of the water. Loading on the delta from added weight such as trains or a warehouse or added fill can add to an area’s instability. These events usually occur in the heavily glaciated areas of Prince William Sound and parts of Southeast Alaska. Landslide–generated tsunamis are responsible for most of the tsunami deaths in Alaska because there is little warning. Tsunamis generated by landslides in lakes occur more in Alaska than any other part of the U.S. They are associated with the collapse of deltas in glacial lakes having great depths. They may also be associated with delta deposits from rapidly flowing streams and rivers carrying glacial debris. A seiche is a wave that oscillates in partially or totally enclosed bodies of water. They can last from a few minutes to a few hours as a result of an earthquake, underwater landslide, atmospheric disturbance or avalanche. The resulting effect is similar to bathtub water sloshing repeatedly from side to side. The reverberating water continually causes damage until the activity subsides. The factors for effective warning are similar to a local tsunami, in that the onset of the first wave can be a few minutes, giving virtually no time for warning. Location The tsunami risk in Anchorage is considered low, as tsunamis strike low lying coastal areas and most of Anchorage is protected by bluffs. The shore near Birchwood may be susceptible (Mason, 1997). The Ship Creek/Port of Anchorage area may be affected.

Anchorage All-Hazard Mitigation Plan October 2004
4-56
Likelihood of Occurrence While seismic activity frequently occurs in the Anchorage area and along the Pacific Rim, it is believed that Anchorage has a low tsunami risk. Historic Events There have been no known tsunamis in the MOA. Vulnerability Only coastal areas are vulnerable to a tsunami. The number of parcels has not been calculated because the tsunami run-up has not been determined. 4 . 1 . 8 V O L C A N O A volcano is a vent at the Earth's surface through which magma (molten rock) and associated gases erupt, and also the landform built by effusive and explosive eruptions. Volcanoes display a wide variety of shapes, sizes, and behavior, however they are commonly classified among three main types: cinder cone, composite, and shield. Types of Volcanoes Cinder cones A cinder cone is the simplest type of volcano. They are built from particles and blobs of congealed lava ejected from a single vent. As the lava is blown into the air, it breaks into small fragments that solidify and fall as cinders and bombs around the vent to form a circular or oval cone. Most cinder cones have a bowl-shaped crater or craters at the summit and are rarely more than a thousand feet above their surroundings. Cinder cones may form as flank vents on the sides of larger composite or shield volcanoes. They often occur in clusters and produce lava flows. Cinder cones are common in western North America as well as other volcanic terrain Composite volcanoes Composite volcanoes, sometimes called stratovolcanoes, are typically steep-sided, symmetrical cones of large dimension built of alternating layers of lava flows, volcanic ash, blocks, and bombs and may rise as much as 8,000
Redoubt Volcano is one of the active volcanoes of the Cook Inlet region. Here, steam and volcanic gas rise above the summit crater of the volcano following the 1989 to 1990 eruptions. Iliamna Volcano is on the skyline at left. Photograph courtesy of C. Neal, USGS.

Anchorage All-Hazard Mitigation Plan October 2004
4-57
feet above their bases. Some of the most conspicuous and beautiful mountains in the world are composite volcanoes, including Mount Shasta in California, Mount Hood in Oregon, Mount St. Helens and Mount Rainier in Washington, Mt Fuji in Japan, Mt. Vesuvius in Italy, and Shishaldin in Alaska. Composite volcanoes have a principal conduit system through which magma from a reservoir deep in the Earth's crust rises to the surface repeatedly to cause eruptions. The volcano is built up by the accumulation of material erupted through the conduit and increases in size as lava, ash, and other materials, are added to its slopes. Stratovolcanoes tend to erupt explosively because of the silica-based nature of magmas associated with these volcanoes. Some stratovolcanoes produce enormous explosive eruptions that destroy a large part of the volcano itself, leaving a wide, roughly circular depression called a caldera. Eruptions that produce calderas are among the most explosive and largest eruptions known. Most Alaskan volcanoes are stratovolcanoes, including Redoubt, Spurr and Iliamna. Shield volcanoes Shield volcanoes are formed by lava flowing in all directions from a central summit vent, or group of vents, or rift zones building a broad, gently sloping cone with a dome shape. They are built up slowly by the accretion of thousands of highly fluid lava flows that spread widely over great distances, and then cool in thin layers. Some of the largest volcanoes in the world are shield volcanoes including Mauna Loa in Hawaii. Wrangell and Sanford are examples of shield volcanoes in Alaska. Volcanoes are also categorized according to the age of their eruptive activity. Active volcanoes are those that are currently erupting or showing signs of unrest, such as unusual earthquake activity or significant new gas emissions. Dormant volcanoes are those that are not currently active, but could become restless or erupt again. Extinct volcanoes are those that are considered unlikely to erupt again. This can be difficult to determine as a volcano could go tens of thousands of years, or longer, between eruptions. There are more than 80 volcanic centers in the State but only 41 are considered active.
Mount Wrangell, the shield volcano on the right skyline, is the only volcano in the Wrangell Mountains to have had documented historical activity consisting of several minor eruptions in the early 1900's. Image courtesy B. Cella, U.S. National Park Service.

Anchorage All-Hazard Mitigation Plan October 2004
4-58
Volcanic Hazards Volcanic eruptions create the following hazards: Lava Flows Lava flows are streams of molten rock that flow from a volcano. The distance traveled by a flow is dependant on several variables including viscosity, volume, slope steepness, and obstructions in the flow path. A typical flow is between 6 and 30 miles. Lava flows cause damage by burning, crushing, or burying everything they contact. They can also melt ice and snow, causing flooding or move into a wooded area triggering wildland fires. Pyroclastic Flows Pyroclastic flows are high-density mixtures of hot gasses and dry rock that are usually released explosively from a volcano. They are hazardous because of their rapid movement and high temperatures. They travel at speeds of 30 to more than 90 mph and can destroy or sweep away objects due to the impact of debris or associated high winds, or cause burns. Pyroclastic Surges Pyroclastic surges are turbulent low-density clouds of rock debris, air, and other gases that move over the ground at speeds similar to pyroclastic flows. There are two types: hot surges consisting of dry materials over 212ºF and cold surges consisting of cooler rock debris and water or steam. Lava Domes Volcanic or lava domes are formed when viscous lava erupts slowly from a vent. This causes it to solidify near the vent forming the dome instead of flowing away from the vent. A dome grows largely by expansion from within. As it grows its outer surface cools and hardens, then shatters, spilling loose fragments down its sides. Volcanic domes commonly occur within the craters or on the flanks of large composite volcanoes. Novarupta Dome was formed during the 1912 eruption of Katmai Volcano, Alaska, measures 800 feet across and 200 feet high. Volcanic Ash and Bombs Volcanic ash, also called tephra, is fine fragments of solidified lava ejected into the air by an explosion or rising hot air. The fragments range in size, with the larger falling nearer the source. Ash is a problem near the source because of its high temperatures (may cause fires), burial (the weight can cause structural collapses), and impact of falling fragments. Further away, the primary hazard to humans are decreased visibility and inhaling the fine ash. Ash will also interfere with the operation of mechanical equipment
Volcanic hazards.

Anchorage All-Hazard Mitigation Plan October 2004
4-59
including aircraft. In Alaska, this is a major problem as many of the major flight routes are near historically active volcanoes. Volcanic Gases Volcanic gases consist mostly of steam, carbon dioxide, and sulfur and chlorine compounds, but may include other substances. The gases can damage eyes, respiratory systems and cause suffocation. They can also be very corrosive. Lateral Blasts Lateral blasts are inflated mixtures of gases, ash, and hot rock debris. They may be hundreds of feet thick and travel at speeds up to 370 miles per hour. They cause damage through abrasion, impact, burial, and heat. They may also trigger pyroclastic flows or surges. Debris Avalanches Debris avalanches are is a sudden downward movement of unconsolidated material (mostly rock and soil). They occur without warning and travel quickly. Debris avalanches can extend for miles and cover up to 300 square miles, causing damage from impact or burial. Debris Flows Debris flows, also known as lahars, are rapidly flowing mixtures of rock debris and water that originate on the slopes of a volcano. They form in a variety of ways, primarily by the rapid melting of snow and ice by pyroclastic flows, intense rainfall on loose volcanic rock deposits, breakout of a lake dammed by volcanic deposits, and as a consequence of debris avalanches. They generally have the consistency of wet cement and have the ability to destroy or bury anything in their path. Alaska is home to 41 historically active volcanoes although none are within the Municipality of Anchorage (see Map 4-14). Because of the distance between any volcano and Anchorage, Anchorage will not be affected by most elements of a volcanic eruption occurring in Alaska. Anchorage does have to be concerned about ash. Likelihood of Occurrence Volcanic activity in Alaska is rare. The Alaska Volcano Observatory (AVO) actively monitors the activity of 25 volcanoes for signs of unrest.

Anchorage All-Hazard Mitigation Plan October 2004
4-60
Historic Events Anchorage had to deal with ash from the recent eruptions of Redoubt, Spurr and Augustine Volcanoes. Mt. Spurr On September 21, 1992, eruptions on Mt. Spurr triggered a disaster declaration. The eruption caused health problems and property damage. Redoubt Redoubt Volcano erupted in 1989-1990 and debris flows caused temporary closing of the Drift River Oil Terminal. KLM’s 747 jet aircraft, flight 867, temporarily lost power in all four engines when it entered the volcanic ash plume. It would have crashed into the mountains had they not be able to restart their engines about 4,000 feet above ground. Augustine A more recent eruption occurred on Augustine Volcano in 1986. An ash plume disrupted air traffic and deposited ash in Anchorage. A dome formed in the crater, and caused some to fear it would subsequently collapse and trigger a tsunami along the east shore of Cook Inlet, as happened in 1883. Vulnerability As the ash from a volcanic eruption could affect the entire Municipality, the entire MOA is represented in Table 4.42.
Alaska’s active volcanoes and a schematic depiction of selected major air routes across Alaska. SOURCE: AVO

Anchorage All-Hazard Mitigation Plan October 2004
4-61
Table 4.42 Volcanic Ash Vulnerability
Land Use # of
Parcels Taxable Value
(Land) Taxable Value
(Buildings) Total Residential 59,426 $3,066,038,500 $8,334,412,600 $11,398,571,591Commercial 3,419 $605,885,600 $1,579,095,500 $2,132,773,711Industrial 1,610 $180,641,800 $290,159,100 $469,225,809Institutional 702 $26,876,800 $188,839,300 $90,308,164Parks, Open Space & Recreation Areas 1,319 $107,600 $203,400 $311,000Transportation Related 419 $236,100 $165,900 $402,000Other 300 $352,000 $44,400 $307,600Vacant 10,326 $570,157,400 $450,103,500 $1,015,367,523Unidentified 4,325 $419,913,000 $924,182,300 $1,341,953,131Total 81,846 $4,870,208,800 $11,767,206,000 $16,449,220,529 4 . 1 . 9 E R O S I O N Erosion is a process that involves the wearing away, transportation, and movement of land. Erosion rates can vary significantly as erosion can occur quite quickly as the result of a flash flood, coastal storm or other event. It can also occur slowly as the result of long-term environmental changes. Erosion is a natural process but its effects can be exacerbated by human activity. Erosion rarely causes death or injury. However, erosion causes the destruction of property, development and infrastructure. In Alaska, coastal erosion is the most destructive, riverine erosion a close second, and wind erosion a distant third. Classifying erosion can be confusing, as there are multiple terms used to refer to the same type of erosion. For example, riverine erosion may be called stream erosion, stream bank erosion, or riverbank erosion, among other terms. Coastal erosion is sometimes referred to as tidal erosion. Sometimes, bluff erosion is included in coastal erosion, other times they are two separate processes. The same goes for beach erosion. For this plan, coastal erosion encompasses bluff and beach erosion while riverine erosion will be considered synonymous for stream erosion, stream bank erosion and riverbank erosion.
Bluff erosion is when water runs off the land forming gullies. It is also caused by wave action at the toe of the bluff or when a bluff collapses under the weight of a heavy snow or rainfall. Beach erosion occurs when the wave action takes away the light sand.

Anchorage All-Hazard Mitigation Plan October 2004
4-62
Coastal Erosion Coastal erosion is the wearing away of land resulting in loss of beach, shoreline, or dune material from natural activity or human influences. Coastal erosion occurs over the area roughly from the top of the bluff out into the near-shore region to about the 30 foot water depth. It is measured as the rate of change in the position or horizontal displacement of a shoreline over a period of time. Bluff recession is the most visible aspect of coastal erosion because of the dramatic change it causes in the landscape. As a result, this aspect of coastal erosion usually receives the most attention.
On the coast, the forces of erosion are embodied in waves, currents, and wind. Surface and ground water flow, and freeze-thaw cycles may also play a role. Not all of these forces may be present at any particular location. Coastal erosion can occur from rapid, short-term daily, seasonal, or annual natural events such as waves, storm surge, wind, coastal storms, and flooding or from human activities including boat wakes and dredging. The most dramatic erosion often occurs during storms, particularly because the highest energy waves are generated under storm conditions. Coastal erosion also may be from multi-year impacts and long-term climatic change such as sea-level rise, lack of sediment supply, subsidence or long-term human factors such as the construction of shore protection structures and dams or aquifer depletion. Studies are underway to determine the effects generated from global warming. Ironically, attempts to control erosion through shoreline protective measures such as groins, jetties, seawalls, or revetments, can actually lead to increased erosion activity. This is because shoreline structures eliminate the natural wave run-up and sand deposition processes and can increase reflected wave action and currents at the waterline. The increased wave action can cause localized scour both in front of and behind structures and prevent the settlement of suspended sediment. Fortunately in Alaska, erosion is hindered by bottomfast ice, which is present on much of the Arctic coastline during the winter. These areas are fairly vulnerable while the ice is forming. The winds from a fall storm can push sea ice into the shorefast ice, driving it onto the beach. The ice will then gouge the beach and cause other damage.

Anchorage All-Hazard Mitigation Plan October 2004
4-63
Factors Influencing the Erosion Process There are a variety of natural and human-induced factors that influence the erosion process. For example, shoreline orientation and exposure to prevailing winds, open ocean swells, and waves all influence erosion rates. Beach composition influences erosion rates as well. For example, a beach composed of sand and silt, such as those near Shishmaref, are easily eroded whereas beaches primarily consisting of boulders or large rocks are more resistant to erosion. Other factors may include: • Shoreline type • Geomorphology of the coast • Structure types along the shoreline • Density of development • Amount of encroachment into the high hazard zone • Proximity to erosion inducing coastal structures • Nature of the coastal topography • Elevation of coastal dunes and bluffs • Shoreline exposure to wind and waves. Riverine Erosion Rivers constantly alter their course, changing shape and depth, trying to find a balance between the sediment transport capacity of the water and the sediment supply. This process, called riverine erosion, is usually seen as the wearing away of riverbanks and riverbeds over a long period of time. Riverine erosion is often initiated by failure of a riverbank causing high sediment loads or heavy rainfall. This generates high volume and velocity run-off which will concentrate in the lower drainages within the river’s catchment area. When the stress applied by these river flows exceeds the resistance of the riverbank material, erosion will occur. As the sediment load increases, fast-flowing rivers will erode their banks downstream. Eventually, the river becomes overloaded or velocity is reduced, leading to the deposition of sediment further downstream or in dams and reservoirs. The deposition
Definitions: Groin - A narrow, elongated coastal-engineering structure built on the beach perpendicular to the trend of the beach. Its purpose is to trap longshore drift to build up a section of beach. Jetty - A narrow, elongated coastal-engineering structure built perpendicular to the shoreline at inlets to stabilize the position of a navigation channel, to shield vessels from wave forces, and to control the movement of sand along adjacent beaches to minimize the movement of sand into a channel. Seawall - A vertical, wall-like coastal-engineering structure built parallel to the beach or duneline and usually located at the back of the beach or the seaward edge of the dune. They are designed to halt shoreline erosion by absorbing the impact of waves. Revetment - An apron-like, sloped, coastal-engineering structure built on a dune face or fronting a seawall. Designed to dissipate the force of storm waves and prevent undermining of a seawall, dune or placed fill.

Anchorage All-Hazard Mitigation Plan October 2004
4-64
may eventually lead to the river developing a new channel. While all rivers change in the long-term, short-term rates of change vary significantly. In less stable braided channel reaches, erosion and deposition of material are a constant issue. In more stable meandering channels, episodes of erosion may only occur occasionally. The erosion rate depends on the sediment supply and amount of run-off reaching the river. These variables are affected by many things including earthquakes, floods, climatic changes, loss of bank vegetation, urbanization, and the construction of civil works in the waterway. Riverine erosion has many consequences including the loss of land and any development on that land. It can cause increased sedimentation of harbors and river deltas. It can hinder channel navigation and affect marine transportation. Other problems include reduction in water quality due to high sediment loads, loss of native aquatic habitats, damage to public utilities (roads, bridges and dams) and maintenance costs from trying to prevent erosion sites. Location Most of Anchorage is not impacted by riverine erosion. It may occur in some localized areas. Map 4-15 shows areas with potential riverine erosion hazards. In particular, “Peters, Meadow and Rabbit Creeks experience high-velocity flows that can lead to extensive erosion of banks and washouts at inadequate stream crossings” (FEMA, 2002:11). Table 4.42 shows Anchorage’s number of parcels at risk from riverine erosion. Likelihood of Occurrence Riverine erosion will always occur in Anchorage as rivers and other flowing water bodies are constantly altering their course. Historic Events No significant riverine erosion events have been identified. Vulnerability Table 4.43 shows the parcels that may be affected by riverine erosion. Table 4.43 Parcels Vulnerable to Riverine Erosion
Land Use # of Parcels
Taxable Value (Land)
Taxable Value (Buildings) Total
Residential 37 $4,542,700 $2,782,700 $7,325,400Commercial 5 $179,900 $411,300 $591,200

Anchorage All-Hazard Mitigation Plan October 2004
4-65
Industrial 1 $0 $0 $0Institutional 1 $0 $0 $0Parks, Open Space & Recreation Areas 28 $0 $0 $0Transportation Related 1 $0 $0 $0Other 0 $0 $0 $0Vacant 6 $4,100 $80,600 $84,700Unidentified 9 $0 $313,500 $313,500Total 88 $4,726,700 $3,588,100 $8,314,800
Wind Erosion Wind erosion is when wind is responsible for the removal, movement and redeposition of land. It occurs when soils are exposed to high-velocity wind. The wind will pick up the soil and carry it away. The wind moves soil particles 0.1-0.5 mm in size in a hopping or bouncing fashion (known as saltation) and those greater than 0.5 mm by rolling (known as soil creep). The finest particles (less than 0.1 mm) are carried in suspension. Wind erosion can increase during periods of drought. Wind erosion can cause a loss of topsoil, which can hinder agricultural production. The dust can reduce visibility causing automobile accidents, hinder machinery, and have a negative effect on air and water quality creating animal and human health concerns. Wind erosion can also cause damage to public utilities and infrastructure. Location Every parcel in MOA could be affected by wind erosion. Those in higher wind areas are more likely to experience wind erosion. Likelihood of Occurrence In Anchorage, wind erosion is not a significant problem but it can occur whenever there is a weather event with strong winds. Historic Events No significant wind erosion events have been identified. Vulnerability Every parcel in MOA could be vulnerable to wind erosion. However, this is not a significant threat. Coastal Erosion Coastal erosion is the long term landward movement of the shoreline. It is generally associated with high energy events such as a coastal storm, flooding, etc, Coastal erosion can be the result of a series of short term

Anchorage All-Hazard Mitigation Plan October 2004
4-66
events such as storms. Alternatively, it could be the result of long-term processes such as a change in sea level or subsidence. Coastal erosion is a natural process but can be influenced by human activity such as dredging and boat wakes. Coastal erosion rarely causes death or injuries but it can destroy buildings and infrastructure. According to NHIRA, the degree of exposure to coastal erosion may be related to: • Shoreline type • The geomorphology of the coast • Structure type along the shoreline • Development density • Amount of encroachment into the high-hazard zone • Shoreline exposure to waves and wind • Proximity to erosion-inducing coastal structures • Nature of the coastal topography • Elevation of coastal dunes and bluffs Location Coastal erosion is occurring west of Anchorage International Airport, as “several hundred yards of bluff have eroded in this century, much of it since 1949. The bluffs erode when high-energy storms enter Cook Inlet and generate large waves at their bases. Storms arriving in the fall are the most dangerous because the bluffs are not yet frozen and their sediment can be easily eroded” (Mason, 1997: 193). Coastal erosion is also occurring near the coastal trail as “piles of construction or earthquake rubble plus a rock revetment built by the state to protect the bike path are increasing local rates of shoreline erosion by blocking lateral beach sand transport” (Mason, 1997:198). Point Woronzof has a lack of vegetation, lack of a pile of talus at the base, and the lack of a protective mudflat indicates erosion about 2 feet per year (Mason, 1997). Point Campbell is also eroding but at a slightly slower rate (Mason, 1997). Likelihood of Occurrence Coastal erosion is a natural process and continually occurs. Unlike other parts of Alaska, it would be rare to have an single event associated with a significant amount of coastal erosion. Historic Events No significant coastal erosion events have been identified.

Anchorage All-Hazard Mitigation Plan October 2004
4-67
Vulnerability Only coastal areas are vulnerable to coastal erosion.
4 . 2 T E C H N O L O G I C A L H A Z A R D S Technological hazards are generally caused by human error or omission. The following technological hazards will be addressed in a future update:
4.2.1 Air Pollution 4.2.2 Dam Failure 4.2.3 Energy Emergency: Fuel/Resource Shortage 4.2.4 Fire: Explosion/Structural 4.2.5 Hazardous Materials Accident 4.2.6 Hazardous Materials Release 4.2.7 Power Failure (Outage) 4.2.8 Radiation Release 4.2.9 Transportation Accident: Aircraft 4.2.10 Transportation Accident: Marine 4.2.11 Transportation Accident: Motor Vehicle
4 . 3 H U M A N / S O C I E T A L H A Z A R D S These events are the result of deliberate human acts. The following human/societal hazards will be addressed in a future update:
4.3.1 Attack 4.3.2 Civil Disturbance 4.3.3 Terrorism 4.3.4 WMD: Biological, Chemical, Nuclear