Harper College Compensation Study · • Harper College has a competitive total remuneration pay...
32
Harper College Compensation Study Project Briefings
Transcript of Harper College Compensation Study · • Harper College has a competitive total remuneration pay...
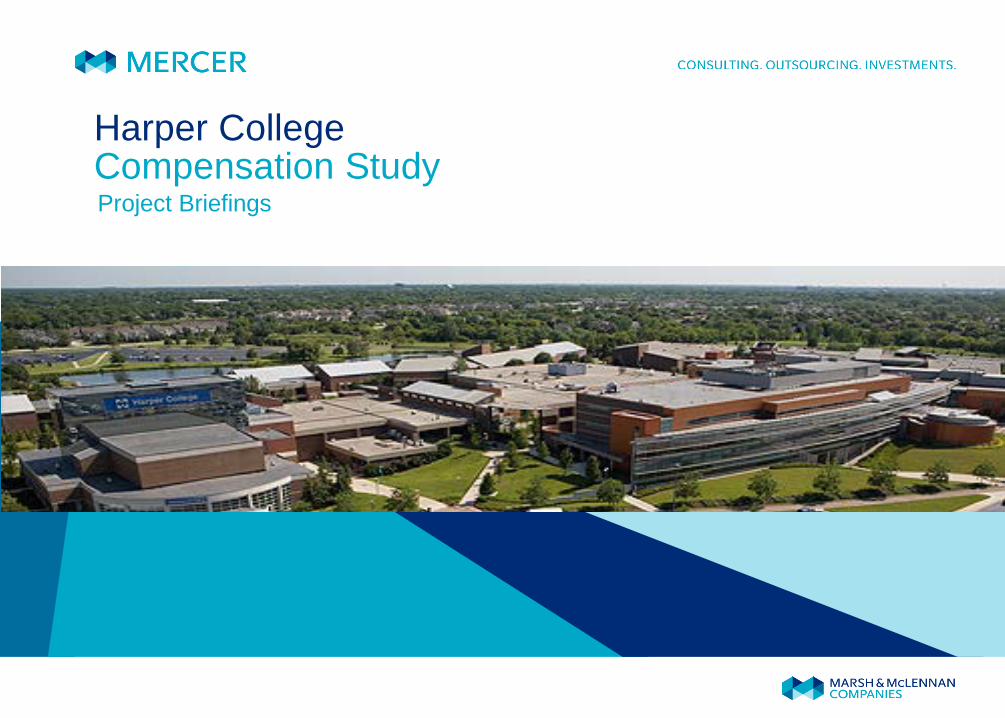
Harper College Compensation Study Project Briefings
MERCER 1 December 21, 2011
Contents
• Introduction and Background
• Competitive Analysis
• Pay Structure Review
• Summary
• Appendix – Published Survey Sources – Published Survey Participants

INTRODUCTION AND BACKGROUND
MERCER 3 December 21, 2011
Introduction and Background Market Pricing and Benchmark Jobs
• What is market pricing? – The process of determining competitive pay levels for specific jobs in a defined external
market
• Why do it? – Assess pay levels – Ensure “fair” pay – Develop salary structures
• Why is feedback important? – To ensure the best possible data is used within the analysis
• Benchmark jobs typically represent: – Multiple functions and levels within the organization – High incumbent positions and/or key positions – Static and fairly consistent responsibilities (not changing dramatically from year to year)
Benchmark positions are easily understood within the organization (internally) and the market (externally)
MERCER 4 December 21, 2011
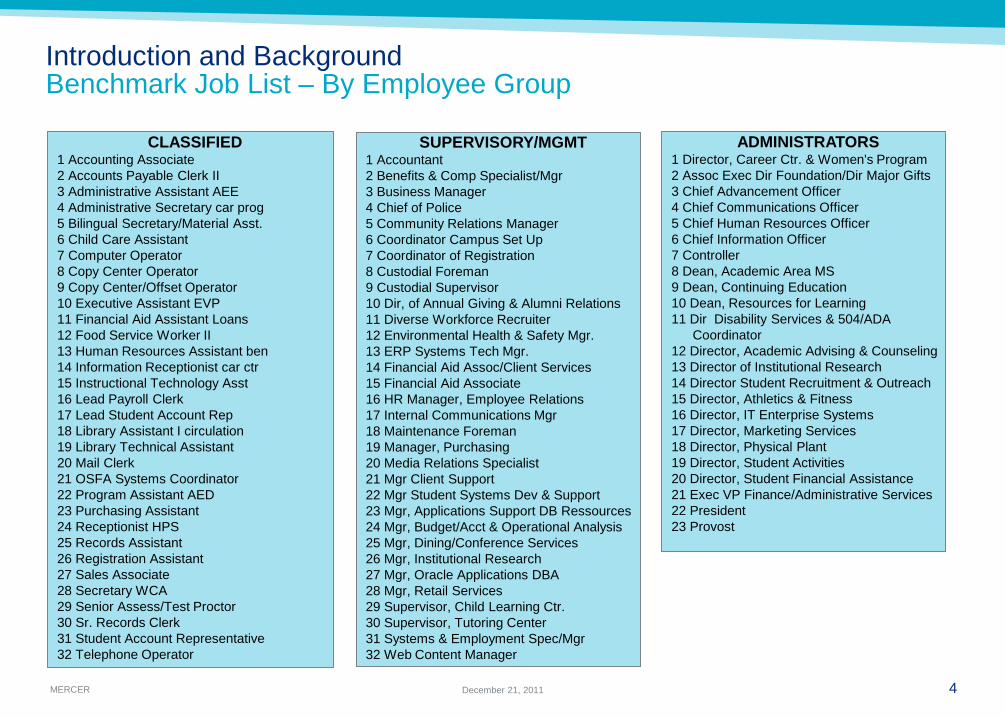
Introduction and Background Benchmark Job List – By Employee Group
CLASSIFIED 1 Accounting Associate 2 Accounts Payable Clerk II 3 Administrative Assistant AEE 4 Administrative Secretary car prog 5 Bilingual Secretary/Material Asst. 6 Child Care Assistant 7 Computer Operator 8 Copy Center Operator 9 Copy Center/Offset Operator 10 Executive Assistant EVP 11 Financial Aid Assistant Loans 12 Food Service Worker II 13 Human Resources Assistant ben 14 Information Receptionist car ctr 15 Instructional Technology Asst 16 Lead Payroll Clerk 17 Lead Student Account Rep 18 Library Assistant I circulation 19 Library Technical Assistant 20 Mail Clerk 21 OSFA Systems Coordinator 22 Program Assistant AED 23 Purchasing Assistant 24 Receptionist HPS 25 Records Assistant 26 Registration Assistant 27 Sales Associate 28 Secretary WCA 29 Senior Assess/Test Proctor 30 Sr. Records Clerk 31 Student Account Representative 32 Telephone Operator
ADMINISTRATORS 1 Director, Career Ctr. & Women's Program 2 Assoc Exec Dir Foundation/Dir Major Gifts 3 Chief Advancement Officer 4 Chief Communications Officer 5 Chief Human Resources Officer 6 Chief Information Officer 7 Controller 8 Dean, Academic Area MS 9 Dean, Continuing Education 10 Dean, Resources for Learning 11 Dir Disability Services & 504/ADA
Coordinator 12 Director, Academic Advising & Counseling 13 Director of Institutional Research 14 Director Student Recruitment & Outreach 15 Director, Athletics & Fitness 16 Director, IT Enterprise Systems 17 Director, Marketing Services 18 Director, Physical Plant 19 Director, Student Activities 20 Director, Student Financial Assistance 21 Exec VP Finance/Administrative Services 22 President 23 Provost
SUPERVISORY/MGMT 1 Accountant 2 Benefits & Comp Specialist/Mgr 3 Business Manager 4 Chief of Police 5 Community Relations Manager 6 Coordinator Campus Set Up 7 Coordinator of Registration 8 Custodial Foreman 9 Custodial Supervisor 10 Dir, of Annual Giving & Alumni Relations 11 Diverse Workforce Recruiter 12 Environmental Health & Safety Mgr. 13 ERP Systems Tech Mgr. 14 Financial Aid Assoc/Client Services 15 Financial Aid Associate 16 HR Manager, Employee Relations 17 Internal Communications Mgr 18 Maintenance Foreman 19 Manager, Purchasing 20 Media Relations Specialist 21 Mgr Client Support 22 Mgr Student Systems Dev & Support 23 Mgr, Applications Support DB Ressources 24 Mgr, Budget/Acct & Operational Analysis 25 Mgr, Dining/Conference Services 26 Mgr, Institutional Research 27 Mgr, Oracle Applications DBA 28 Mgr, Retail Services 29 Supervisor, Child Learning Ctr. 30 Supervisor, Tutoring Center 31 Systems & Employment Spec/Mgr 32 Web Content Manager
MERCER 5 December 21, 2011
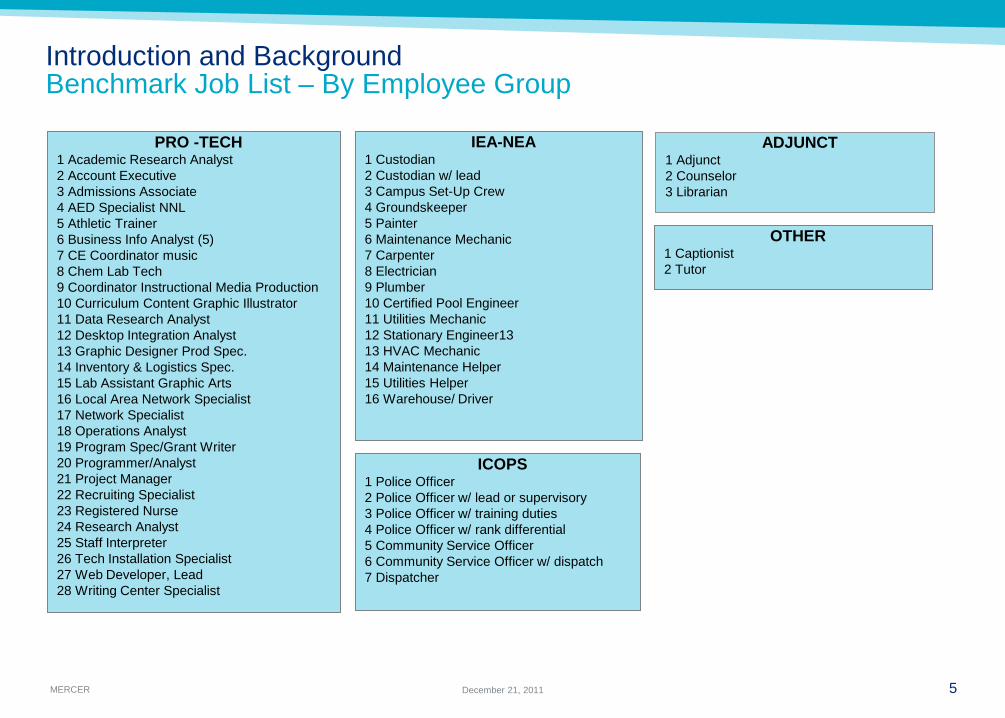
Introduction and Background Benchmark Job List – By Employee Group
ICOPS 1 Police Officer 2 Police Officer w/ lead or supervisory 3 Police Officer w/ training duties 4 Police Officer w/ rank differential 5 Community Service Officer 6 Community Service Officer w/ dispatch 7 Dispatcher
ADJUNCT 1 Adjunct 2 Counselor 3 Librarian
IEA-NEA 1 Custodian 2 Custodian w/ lead 3 Campus Set-Up Crew 4 Groundskeeper 5 Painter 6 Maintenance Mechanic 7 Carpenter 8 Electrician 9 Plumber 10 Certified Pool Engineer 11 Utilities Mechanic 12 Stationary Engineer13 13 HVAC Mechanic 14 Maintenance Helper 15 Utilities Helper 16 Warehouse/ Driver
PRO -TECH 1 Academic Research Analyst 2 Account Executive 3 Admissions Associate 4 AED Specialist NNL 5 Athletic Trainer 6 Business Info Analyst (5) 7 CE Coordinator music 8 Chem Lab Tech 9 Coordinator Instructional Media Production 10 Curriculum Content Graphic Illustrator 11 Data Research Analyst 12 Desktop Integration Analyst 13 Graphic Designer Prod Spec. 14 Inventory & Logistics Spec. 15 Lab Assistant Graphic Arts 16 Local Area Network Specialist 17 Network Specialist 18 Operations Analyst 19 Program Spec/Grant Writer 20 Programmer/Analyst 21 Project Manager 22 Recruiting Specialist 23 Registered Nurse 24 Research Analyst 25 Staff Interpreter 26 Tech Installation Specialist 27 Web Developer, Lead 28 Writing Center Specialist
OTHER 1 Captionist 2 Tutor

MERCER 6 December 21, 2011
Introduction and Background Data Sources Collected
• Three primary sources of data were used for the market pricing study: peer college disclosures, peer municipality disclosures and published surveys
Published Surveys The study incorporated data
from the following survey vendors:
Refer to the appendix for the specific surveys utilized in the
study as well as participant lists.
• College and University Personnel Associates (CUPA)
• Mercer • Towers Watson • Employer’s Group • American Library
Association
Peer Colleges Data was requested and
collected from the following participants:
• College of Dupage • Lake County Community
College • Joliet Community College • Moraine Valley
Community College • Oakton Community
College • Elgin Community College • Triton Community College
Local Municipalities Data was requested and
collected from the following municipalities:
.
• Elgin • Palatine • Village of Lake Zurich • Village of Hoffman Estates • Town of Barrington • Mount Prospect • Schaumburg
MERCER 7 December 21, 2011
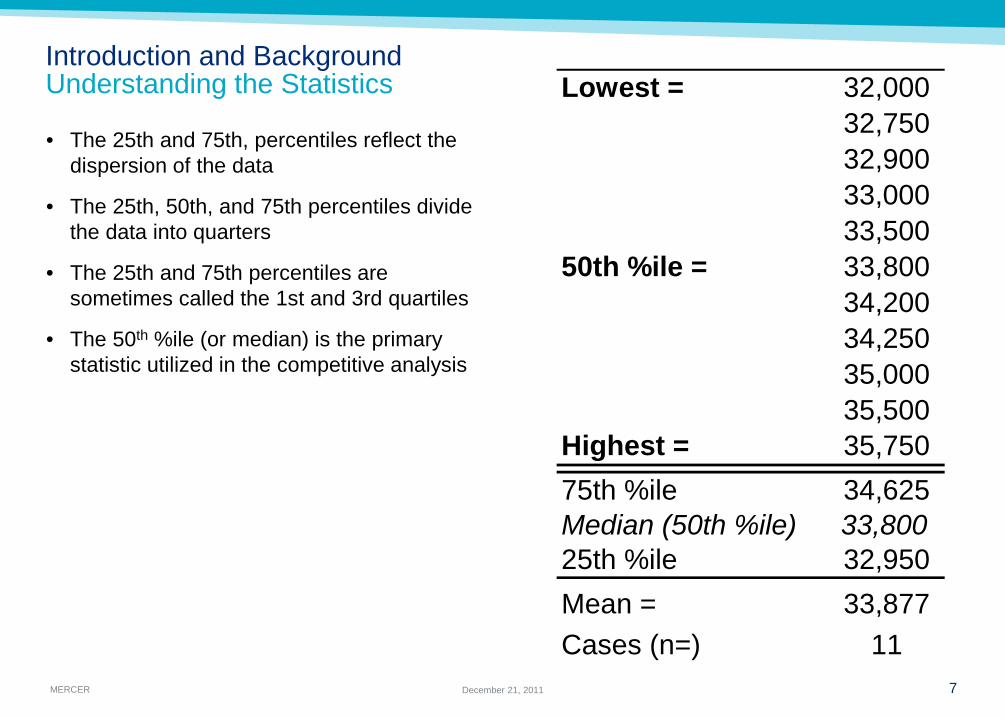
• The 25th and 75th, percentiles reflect the dispersion of the data
• The 25th, 50th, and 75th percentiles divide the data into quarters
• The 25th and 75th percentiles are sometimes called the 1st and 3rd quartiles
• The 50th %ile (or median) is the primary statistic utilized in the competitive analysis
Introduction and Background Understanding the Statistics Lowest = 32,000
32,75032,90033,00033,500
50th %ile = 33,80034,20034,25035,00035,500
Highest = 35,75075th %ile 34,625Median (50th %ile) 33,80025th %ile 32,950Mean = 33,877Cases (n=) 11

COMPETITIVE ANALYSIS
MERCER 9 December 21, 2011
Competitive Analysis Executive Summary
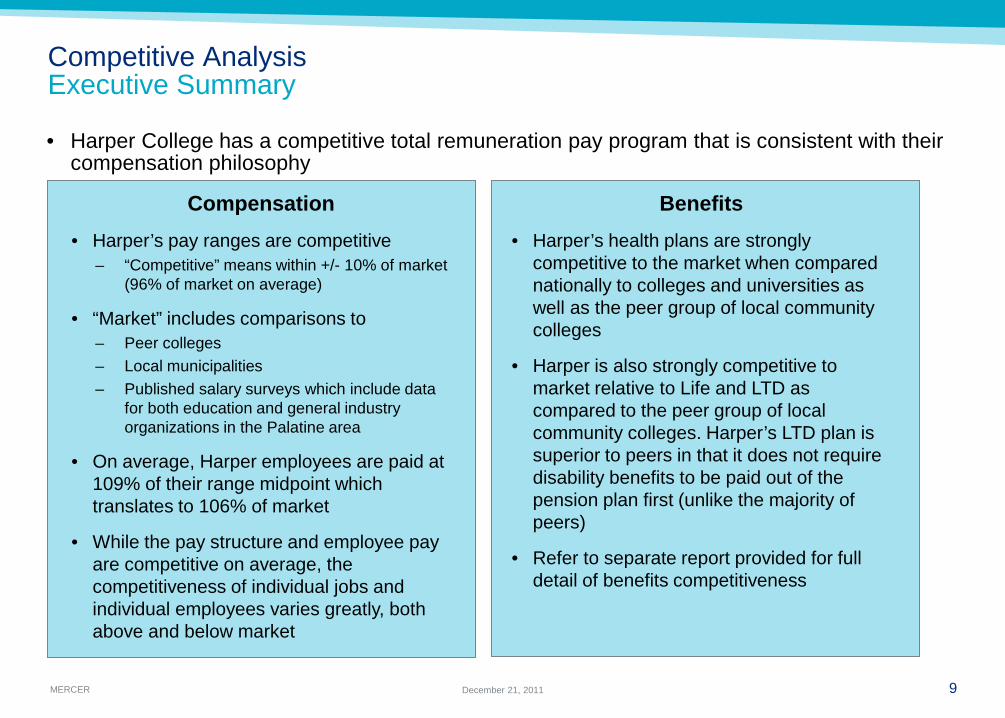
• Harper College has a competitive total remuneration pay program that is consistent with their compensation philosophy
Benefits • Harper’s health plans are strongly
competitive to the market when compared nationally to colleges and universities as well as the peer group of local community colleges
• Harper is also strongly competitive to market relative to Life and LTD as compared to the peer group of local community colleges. Harper’s LTD plan is superior to peers in that it does not require disability benefits to be paid out of the pension plan first (unlike the majority of peers)
• Refer to separate report provided for full detail of benefits competitiveness
Compensation • Harper’s pay ranges are competitive
– “Competitive” means within +/- 10% of market (96% of market on average)
• “Market” includes comparisons to – Peer colleges – Local municipalities – Published salary surveys which include data
for both education and general industry organizations in the Palatine area
• On average, Harper employees are paid at 109% of their range midpoint which translates to 106% of market
• While the pay structure and employee pay are competitive on average, the competitiveness of individual jobs and individual employees varies greatly, both above and below market
MERCER 10 December 21, 2011
0% 0% 0%1%
4%
7%
3%
22%
15%
11%
9%9% 9% 9%
3%
0%
5%
10%
15%
20%
25%
-50% orMore
-30% to-50%
-25% to-30%
-20% to-25%
-15% to-20%
-10% to-15%
-5% to -10%
Within5%
5% to10%
10% to15%
15% to20%
20% to25%
25% to30%
30% to50%
50% orMore
Variance to Market Median
% o
f Ben
chm
ark
Jobs
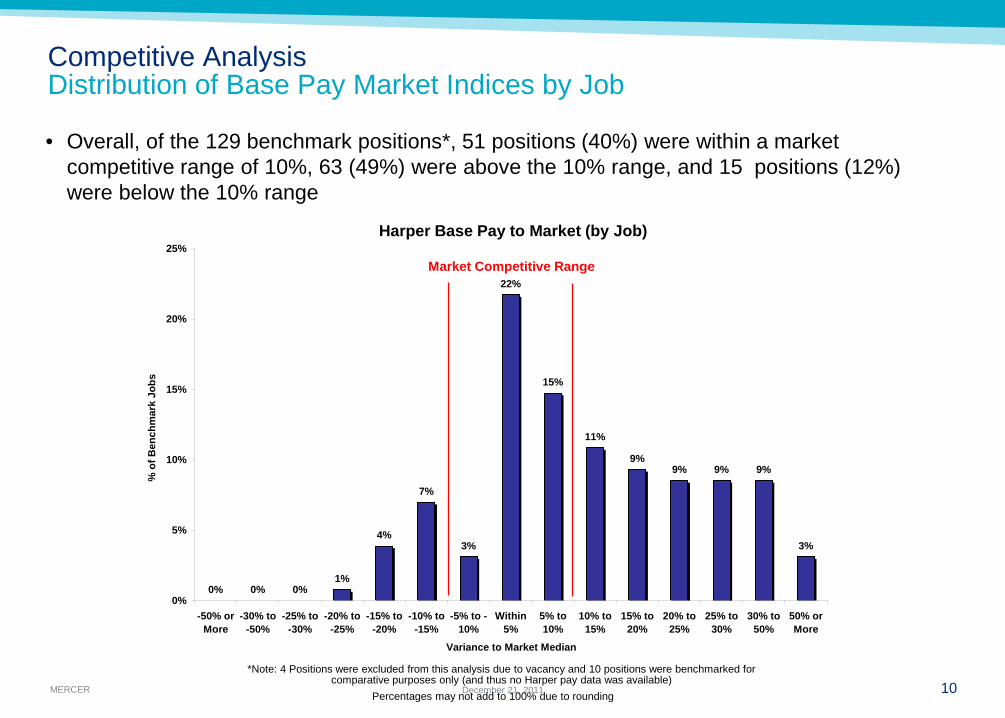
Competitive Analysis Distribution of Base Pay Market Indices by Job
• Overall, of the 129 benchmark positions*, 51 positions (40%) were within a market competitive range of 10%, 63 (49%) were above the 10% range, and 15 positions (12%) were below the 10% range
Market Competitive Range
*Note: 4 Positions were excluded from this analysis due to vacancy and 10 positions were benchmarked for comparative purposes only (and thus no Harper pay data was available)
Harper Base Pay to Market (by Job)
Percentages may not add to 100% due to rounding
MERCER 11 December 21, 2011
Employee Group Variance to Market Median
113% 112%111%
98%92%
108%109%106%
90%
104%95%96%
0%
20%
40%
60%
80%
100%
120%
Classif
ied Staf
f
Superv
isory/
Manag
emen
t
Admini
strati
on
Profes
siona
l/Tec
hnica
l
IEA/NEA
ICOPS
Employee Group
Varia
nce
to M
arke
t Mid
poin
t
Base Pay Variance Midpoint Variance
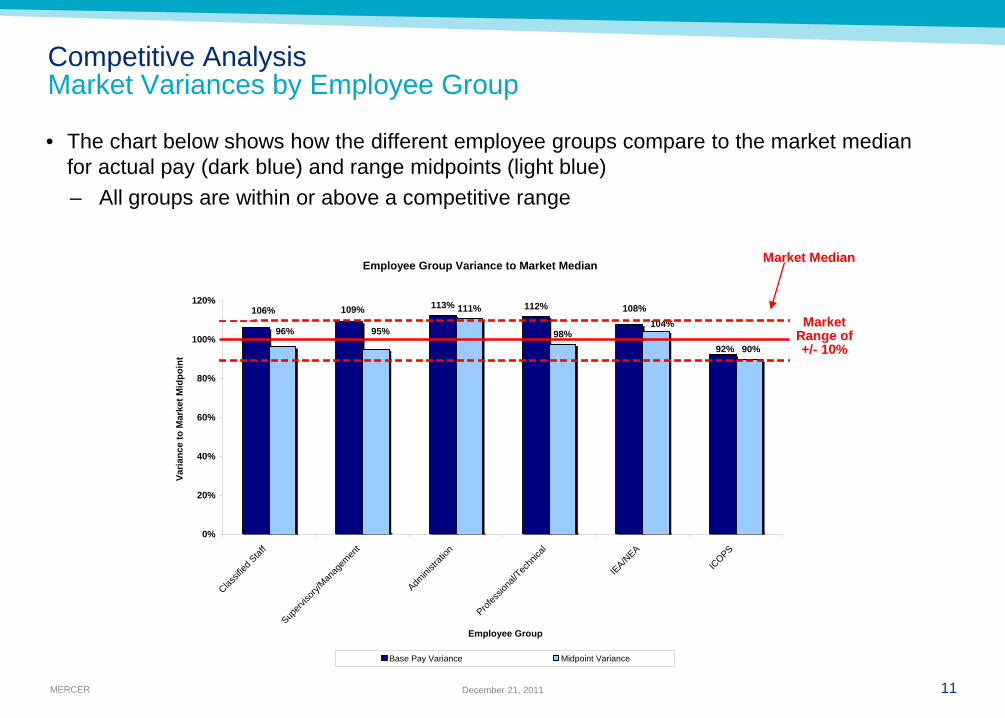
Competitive Analysis Market Variances by Employee Group
• The chart below shows how the different employee groups compare to the market median for actual pay (dark blue) and range midpoints (light blue) – All groups are within or above a competitive range
Market Median
Market Range of +/- 10%

MERCER 12 December 21, 2011
Competitive Analysis Classified Staff Employee Group
• In aggregate, actual pay is competitive relative to the market composite (106% of market median) but there is variation by job (85% to 146%) and by employee
• Pay ranges are within the + / – 10% definition of competitive at 96% of the market median
Note: The Food Service Worker was benchmarked but this job is on a separate structure for food service. This was the only job benchmarked on this structure, and as a result, Mercer does not have sufficient information available to separately assess the ranges for the entire structure.
Compa- Ratio Market Index Market Ratio
Benchmark Job Title Grade # of Ees
Avg. Base Rate (000's)
Current Midpoint (000's)
Market Median
(Education) (000's)
Market Median (Peer) (000's)
Market Median (Local) (000's)
Composite Market Data
(000's)
Base Rate / Current
Midpoint
Base Rate / Market Median
(Education)
Base Rate / Market Median
(Peer)
Avg Base Rate / Market Median
(Local)
Avg Base Rate / Market
Composite
Current Midpoint /
Market Composite
Food Service Worker II FS2 1 $28.6 $24.5 $22.8 -- $22.8 $22.8 117% 126% -- 126% 126% 107%Executive Assistant EVP 9 7 $51.9 $46.9 $60.2 $60.5 $61.6 $60.7 111% 86% 86% 84% 86% 77%Instructional Technology Asst 9 1 $52.5 $46.9 $56.6 -- $67.6 $62.1 112% 93% -- 78% 85% 75%Lead Payroll Clerk 9 1 $54.5 $46.9 $46.0 $44.7 $49.9 $46.3 116% 118% 122% 109% 118% 101%Accounting Associate 9 1 $56.8 $46.9 $40.9 $42.4 $44.8 $42.6 121% 139% 134% 127% 133% 110%Computer Operator 9 1 $51.2 $46.9 $35.6 $51.3 $42.6 $45.2 109% 144% 100% 120% 113% 104%Administrative Assistant AEE 8 15 $47.7 $43.0 $43.8 $45.3 $52.9 $46.8 111% 109% 105% 90% 102% 92%Sr. Records Clerk 8 1 $52.1 $43.0 $53.0 -- -- $53.0 121% 98% -- -- 98% 81%OSFA Systems Coordinator 8 1 $38.8 $43.0 $40.9 -- -- $40.9 90% 95% -- -- 95% 105%Lead Student Account Rep 8 1 $42.8 $43.0 $39.7 $39.2 -- $39.4 100% 108% 109% -- 109% 109%Copy Center/Offset Operator 8 1 $52.1 $43.0 $39.2 -- $32.2 $35.7 121% 133% -- 162% 146% 120%Administrative Secretary car prog 7 15 $44.9 $39.4 $40.7 $38.9 $51.8 $42.6 114% 110% 116% 87% 106% 93%Program Assistant AED 7 5 $47.6 $39.4 $44.5 $41.0 -- $41.9 121% 107% 116% -- 113% 94%Registration Assistant 7 1 $47.6 $39.4 $41.6 $40.5 -- $40.8 121% 114% 117% -- 117% 97%Financial Aid Assistant Loans 7 6 $40.1 $39.4 $40.9 $48.4 -- $46.5 102% 98% 83% -- 86% 85%Bilingual Secretary/Material Asst. 7 1 $39.7 $39.4 $44.8 -- -- $44.8 101% 89% -- -- 89% 88%Purchasing Assistant 7 1 $46.9 $39.4 $38.6 $43.3 $45.0 $42.5 119% 121% 108% 104% 110% 93%Human Resources Assistant ben 7 1 $47.5 $39.4 $38.2 $47.6 $41.0 $43.6 120% 124% 100% 116% 109% 90%Student Account Representative 7 4 $35.1 $39.4 $38.0 -- $41.2 $39.6 89% 92% -- 85% 89% 100%Accounts Payable Clerk II 7 2 $40.9 $39.4 $35.7 $42.0 $39.3 $39.8 104% 115% 97% 104% 103% 99%Senior Assess/Test Proctor 7 1 $41.6 $39.4 $35.6 $37.8 -- $37.3 105% 117% 110% -- 112% 106%Records Assistant 6 1 $36.8 $36.2 $40.3 $38.5 -- $38.9 102% 91% 96% -- 95% 93%Secretary WCA 6 10 $41.2 $36.2 $37.0 $32.4 $45.2 $36.8 114% 111% 127% 91% 112% 98%Library Technical Assistant 6 1 $38.5 $36.2 $33.3 $29.3 $44.1 $34.0 106% 115% 131% 87% 113% 106%Copy Center Operator 5 1 $34.2 $33.2 $35.6 $36.7 $29.3 $34.6 103% 96% 93% 117% 99% 96%Child Care Assistant 5 3 $41.6 $33.2 $33.9 $34.8 -- $34.6 125% 123% 119% -- 120% 96%Telephone Operator 5 2 $33.4 $33.2 $31.8 $30.7 $34.4 $31.9 101% 105% 109% 97% 105% 104%Library Assistant I circulation 5 10 $35.6 $33.2 $29.8 $28.6 -- $28.9 107% 120% 125% -- 123% 115%Receptionist HPS 5 3 $34.2 $33.2 $29.6 $26.6 $31.5 $28.6 103% 116% 129% 109% 120% 116%Information Receptionist car ctr 3 5 $30.9 $27.9 $29.6 -- $31.5 $30.6 110% 104% -- 98% 101% 91%Mail Clerk 3 2 $31.0 $27.9 $29.0 $36.8 $27.0 $32.4 111% 107% 84% 115% 95% 86%Sales Associate 3 1 $33.5 $27.9 $25.8 -- $28.5 $27.2 120% 130% -- 118% 123% 103%
Overall 110% 110% 108% 103% 106% 96%
More than 20% deviation from market median index
MERCER 13 December 21, 2011
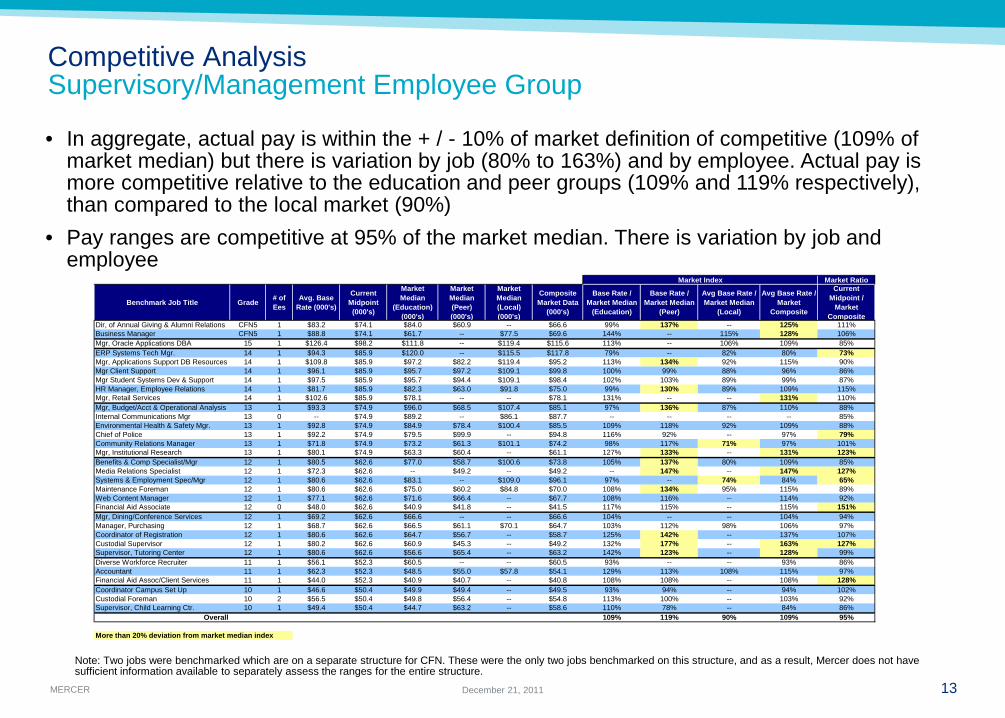
Competitive Analysis Supervisory/Management Employee Group
• In aggregate, actual pay is within the + / - 10% of market definition of competitive (109% of market median) but there is variation by job (80% to 163%) and by employee. Actual pay is more competitive relative to the education and peer groups (109% and 119% respectively), than compared to the local market (90%)
• Pay ranges are competitive at 95% of the market median. There is variation by job and employee
Note: Two jobs were benchmarked which are on a separate structure for CFN. These were the only two jobs benchmarked on this structure, and as a result, Mercer does not have sufficient information available to separately assess the ranges for the entire structure.
Market Index Market Ratio
Benchmark Job Title Grade # of Ees
Avg. Base Rate (000's)
Current Midpoint (000's)
Market Median
(Education) (000's)
Market Median (Peer) (000's)
Market Median (Local) (000's)
Composite Market Data
(000's)
Base Rate / Market Median
(Education)
Base Rate / Market Median
(Peer)
Avg Base Rate / Market Median
(Local)
Avg Base Rate / Market
Composite
Current Midpoint /
Market Composite
Dir, of Annual Giving & Alumni Relations CFN5 1 $83.2 $74.1 $84.0 $60.9 -- $66.6 99% 137% -- 125% 111%Business Manager CFN5 1 $88.8 $74.1 $61.7 -- $77.5 $69.6 144% -- 115% 128% 106%Mgr, Oracle Applications DBA 15 1 $126.4 $98.2 $111.8 -- $119.4 $115.6 113% -- 106% 109% 85%ERP Systems Tech Mgr. 14 1 $94.3 $85.9 $120.0 -- $115.5 $117.8 79% -- 82% 80% 73%Mgr, Applications Support DB Resources 14 1 $109.8 $85.9 $97.2 $82.2 $119.4 $95.2 113% 134% 92% 115% 90%Mgr Client Support 14 1 $96.1 $85.9 $95.7 $97.2 $109.1 $99.8 100% 99% 88% 96% 86%Mgr Student Systems Dev & Support 14 1 $97.5 $85.9 $95.7 $94.4 $109.1 $98.4 102% 103% 89% 99% 87%HR Manager, Employee Relations 14 1 $81.7 $85.9 $82.3 $63.0 $91.8 $75.0 99% 130% 89% 109% 115%Mgr, Retail Services 14 1 $102.6 $85.9 $78.1 -- -- $78.1 131% -- -- 131% 110%Mgr, Budget/Acct & Operational Analysis 13 1 $93.3 $74.9 $96.0 $68.5 $107.4 $85.1 97% 136% 87% 110% 88%Internal Communications Mgr 13 0 -- $74.9 $89.2 -- $86.1 $87.7 -- -- -- -- 85%Environmental Health & Safety Mgr. 13 1 $92.8 $74.9 $84.9 $78.4 $100.4 $85.5 109% 118% 92% 109% 88%Chief of Police 13 1 $92.2 $74.9 $79.5 $99.9 -- $94.8 116% 92% -- 97% 79%Community Relations Manager 13 1 $71.8 $74.9 $73.2 $61.3 $101.1 $74.2 98% 117% 71% 97% 101%Mgr, Institutional Research 13 1 $80.1 $74.9 $63.3 $60.4 -- $61.1 127% 133% -- 131% 123%Benefits & Comp Specialist/Mgr 12 1 $80.5 $62.6 $77.0 $58.7 $100.6 $73.8 105% 137% 80% 109% 85%Media Relations Specialist 12 1 $72.3 $62.6 -- $49.2 -- $49.2 -- 147% -- 147% 127%Systems & Employment Spec/Mgr 12 1 $80.6 $62.6 $83.1 -- $109.0 $96.1 97% -- 74% 84% 65%Maintenance Foreman 12 1 $80.6 $62.6 $75.0 $60.2 $84.8 $70.0 108% 134% 95% 115% 89%Web Content Manager 12 1 $77.1 $62.6 $71.6 $66.4 -- $67.7 108% 116% -- 114% 92%Financial Aid Associate 12 0 $48.0 $62.6 $40.9 $41.8 -- $41.5 117% 115% -- 115% 151%Mgr, Dining/Conference Services 12 1 $69.2 $62.6 $66.6 -- -- $66.6 104% -- -- 104% 94%Manager, Purchasing 12 1 $68.7 $62.6 $66.5 $61.1 $70.1 $64.7 103% 112% 98% 106% 97%Coordinator of Registration 12 1 $80.6 $62.6 $64.7 $56.7 -- $58.7 125% 142% -- 137% 107%Custodial Supervisor 12 1 $80.2 $62.6 $60.9 $45.3 -- $49.2 132% 177% -- 163% 127%Supervisor, Tutoring Center 12 1 $80.6 $62.6 $56.6 $65.4 -- $63.2 142% 123% -- 128% 99%Diverse Workforce Recruiter 11 1 $56.1 $52.3 $60.5 -- -- $60.5 93% -- -- 93% 86%Accountant 11 1 $62.3 $52.3 $48.5 $55.0 $57.8 $54.1 129% 113% 108% 115% 97%Financial Aid Assoc/Client Services 11 1 $44.0 $52.3 $40.9 $40.7 -- $40.8 108% 108% -- 108% 128%Coordinator Campus Set Up 10 1 $46.6 $50.4 $49.9 $49.4 -- $49.5 93% 94% -- 94% 102%Custodial Foreman 10 2 $56.5 $50.4 $49.8 $56.4 -- $54.8 113% 100% -- 103% 92%Supervisor, Child Learning Ctr. 10 1 $49.4 $50.4 $44.7 $63.2 -- $58.6 110% 78% -- 84% 86%
Overall 109% 119% 90% 109% 95%
More than 20% deviation from market median index
MERCER 14 December 21, 2011
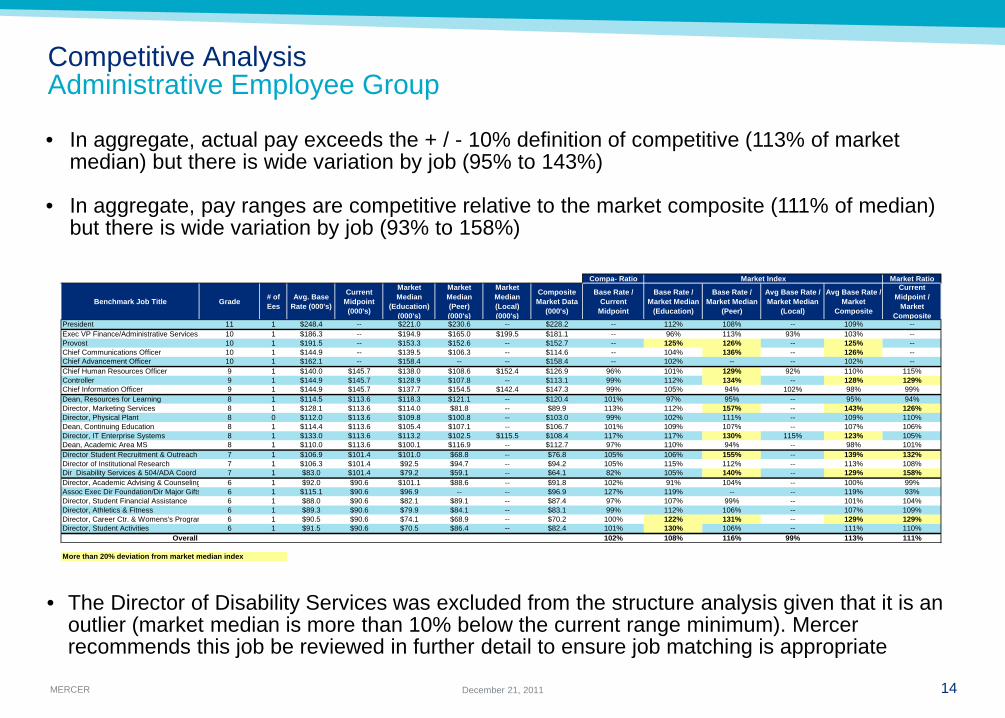
Competitive Analysis Administrative Employee Group
• In aggregate, actual pay exceeds the + / - 10% definition of competitive (113% of market median) but there is wide variation by job (95% to 143%)
• In aggregate, pay ranges are competitive relative to the market composite (111% of median) but there is wide variation by job (93% to 158%)
• The Director of Disability Services was excluded from the structure analysis given that it is an outlier (market median is more than 10% below the current range minimum). Mercer recommends this job be reviewed in further detail to ensure job matching is appropriate
Compa- Ratio Market Index Market Ratio
Benchmark Job Title Grade # of Ees
Avg. Base Rate (000's)
Current Midpoint (000's)
Market Median
(Education) (000's)
Market Median (Peer) (000's)
Market Median (Local) (000's)
Composite Market Data
(000's)
Base Rate / Current
Midpoint
Base Rate / Market Median
(Education)
Base Rate / Market Median
(Peer)
Avg Base Rate / Market Median
(Local)
Avg Base Rate / Market
Composite
Current Midpoint /
Market Composite
President 11 1 $248.4 -- $221.0 $230.6 -- $228.2 -- 112% 108% -- 109% --Exec VP Finance/Administrative Services 10 1 $186.3 -- $194.9 $165.0 $199.5 $181.1 -- 96% 113% 93% 103% --Provost 10 1 $191.5 -- $153.3 $152.6 -- $152.7 -- 125% 126% -- 125% --Chief Communications Officer 10 1 $144.9 -- $139.5 $106.3 -- $114.6 -- 104% 136% -- 126% --Chief Advancement Officer 10 1 $162.1 -- $158.4 -- -- $158.4 -- 102% -- -- 102% --Chief Human Resources Officer 9 1 $140.0 $145.7 $138.0 $108.6 $152.4 $126.9 96% 101% 129% 92% 110% 115%Controller 9 1 $144.9 $145.7 $128.9 $107.8 -- $113.1 99% 112% 134% -- 128% 129%Chief Information Officer 9 1 $144.9 $145.7 $137.7 $154.5 $142.4 $147.3 99% 105% 94% 102% 98% 99%Dean, Resources for Learning 8 1 $114.5 $113.6 $118.3 $121.1 -- $120.4 101% 97% 95% -- 95% 94%Director, Marketing Services 8 1 $128.1 $113.6 $114.0 $81.8 -- $89.9 113% 112% 157% -- 143% 126%Director, Physical Plant 8 0 $112.0 $113.6 $109.8 $100.8 -- $103.0 99% 102% 111% -- 109% 110%Dean, Continuing Education 8 1 $114.4 $113.6 $105.4 $107.1 -- $106.7 101% 109% 107% -- 107% 106%Director, IT Enterprise Systems 8 1 $133.0 $113.6 $113.2 $102.5 $115.5 $108.4 117% 117% 130% 115% 123% 105%Dean, Academic Area MS 8 1 $110.0 $113.6 $100.1 $116.9 -- $112.7 97% 110% 94% -- 98% 101%Director Student Recruitment & Outreach 7 1 $106.9 $101.4 $101.0 $68.8 -- $76.8 105% 106% 155% -- 139% 132%Director of Institutional Research 7 1 $106.3 $101.4 $92.5 $94.7 -- $94.2 105% 115% 112% -- 113% 108%Dir Disability Services & 504/ADA Coord 7 1 $83.0 $101.4 $79.2 $59.1 -- $64.1 82% 105% 140% -- 129% 158%Director, Academic Advising & Counseling 6 1 $92.0 $90.6 $101.1 $88.6 -- $91.8 102% 91% 104% -- 100% 99%Assoc Exec Dir Foundation/Dir Major Gifts 6 1 $115.1 $90.6 $96.9 -- -- $96.9 127% 119% -- -- 119% 93%Director, Student Financial Assistance 6 1 $88.0 $90.6 $82.1 $89.1 -- $87.4 97% 107% 99% -- 101% 104%Director, Athletics & Fitness 6 1 $89.3 $90.6 $79.9 $84.1 -- $83.1 99% 112% 106% -- 107% 109%Director, Career Ctr. & Womens's Program 6 1 $90.5 $90.6 $74.1 $68.9 -- $70.2 100% 122% 131% -- 129% 129%Director, Student Activities 6 1 $91.5 $90.6 $70.5 $86.4 -- $82.4 101% 130% 106% -- 111% 110%
Overall 102% 108% 116% 99% 113% 111%
More than 20% deviation from market median index
MERCER 15 December 21, 2011
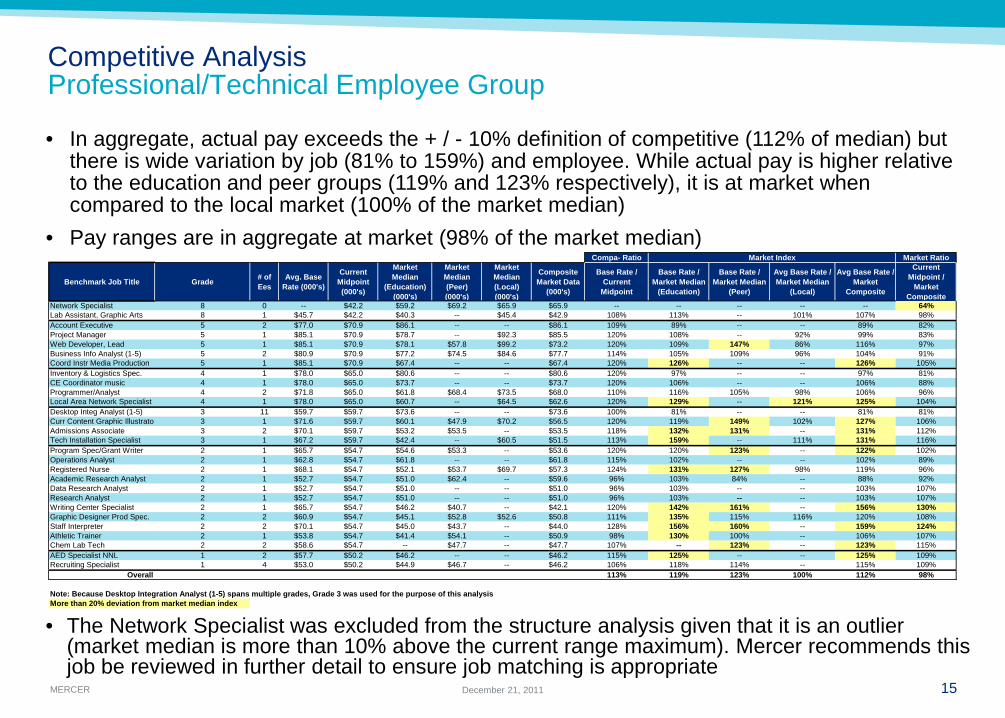
Competitive Analysis Professional/Technical Employee Group
• In aggregate, actual pay exceeds the + / - 10% definition of competitive (112% of median) but there is wide variation by job (81% to 159%) and employee. While actual pay is higher relative to the education and peer groups (119% and 123% respectively), it is at market when compared to the local market (100% of the market median)
• Pay ranges are in aggregate at market (98% of the market median) Compa- Ratio Market Index Market Ratio
Benchmark Job Title Grade # of Ees
Avg. Base Rate (000's)
Current Midpoint (000's)
Market Median
(Education) (000's)
Market Median (Peer) (000's)
Market Median (Local) (000's)
Composite Market Data
(000's)
Base Rate / Current
Midpoint
Base Rate / Market Median
(Education)
Base Rate / Market Median
(Peer)
Avg Base Rate / Market Median
(Local)
Avg Base Rate / Market
Composite
Current Midpoint /
Market Composite
Network Specialist 8 0 -- $42.2 $59.2 $69.2 $65.9 $65.9 -- -- -- -- -- 64%Lab Assistant, Graphic Arts 8 1 $45.7 $42.2 $40.3 -- $45.4 $42.9 108% 113% -- 101% 107% 98%Account Executive 5 2 $77.0 $70.9 $86.1 -- -- $86.1 109% 89% -- -- 89% 82%Project Manager 5 1 $85.1 $70.9 $78.7 -- $92.3 $85.5 120% 108% -- 92% 99% 83%Web Developer, Lead 5 1 $85.1 $70.9 $78.1 $57.8 $99.2 $73.2 120% 109% 147% 86% 116% 97%Business Info Analyst (1-5) 5 2 $80.9 $70.9 $77.2 $74.5 $84.6 $77.7 114% 105% 109% 96% 104% 91%Coord Instr Media Production 5 1 $85.1 $70.9 $67.4 -- -- $67.4 120% 126% -- -- 126% 105%Inventory & Logistics Spec. 4 1 $78.0 $65.0 $80.6 -- -- $80.6 120% 97% -- -- 97% 81%CE Coordinator music 4 1 $78.0 $65.0 $73.7 -- -- $73.7 120% 106% -- -- 106% 88%Programmer/Analyst 4 2 $71.8 $65.0 $61.8 $68.4 $73.5 $68.0 110% 116% 105% 98% 106% 96%Local Area Network Specialist 4 1 $78.0 $65.0 $60.7 -- $64.5 $62.6 120% 129% -- 121% 125% 104%Desktop Integ Analyst (1-5) 3 11 $59.7 $59.7 $73.6 -- -- $73.6 100% 81% -- -- 81% 81%Curr Content Graphic Illustrato 3 1 $71.6 $59.7 $60.1 $47.9 $70.2 $56.5 120% 119% 149% 102% 127% 106%Admissions Associate 3 2 $70.1 $59.7 $53.2 $53.5 -- $53.5 118% 132% 131% -- 131% 112%Tech Installation Specialist 3 1 $67.2 $59.7 $42.4 -- $60.5 $51.5 113% 159% -- 111% 131% 116%Program Spec/Grant Writer 2 1 $65.7 $54.7 $54.6 $53.3 -- $53.6 120% 120% 123% -- 122% 102%Operations Analyst 2 1 $62.8 $54.7 $61.8 -- -- $61.8 115% 102% -- -- 102% 89%Registered Nurse 2 1 $68.1 $54.7 $52.1 $53.7 $69.7 $57.3 124% 131% 127% 98% 119% 96%Academic Research Analyst 2 1 $52.7 $54.7 $51.0 $62.4 -- $59.6 96% 103% 84% -- 88% 92%Data Research Analyst 2 1 $52.7 $54.7 $51.0 -- -- $51.0 96% 103% -- -- 103% 107%Research Analyst 2 1 $52.7 $54.7 $51.0 -- -- $51.0 96% 103% -- -- 103% 107%Writing Center Specialist 2 1 $65.7 $54.7 $46.2 $40.7 -- $42.1 120% 142% 161% -- 156% 130%Graphic Designer Prod Spec. 2 2 $60.9 $54.7 $45.1 $52.8 $52.6 $50.8 111% 135% 115% 116% 120% 108%Staff Interpreter 2 2 $70.1 $54.7 $45.0 $43.7 -- $44.0 128% 156% 160% -- 159% 124%Athletic Trainer 2 1 $53.8 $54.7 $41.4 $54.1 -- $50.9 98% 130% 100% -- 106% 107%Chem Lab Tech 2 2 $58.6 $54.7 -- $47.7 -- $47.7 107% -- 123% -- 123% 115%AED Specialist NNL 1 2 $57.7 $50.2 $46.2 -- -- $46.2 115% 125% -- -- 125% 109%Recruiting Specialist 1 4 $53.0 $50.2 $44.9 $46.7 -- $46.2 106% 118% 114% -- 115% 109%
Overall 113% 119% 123% 100% 112% 98%
Note: Because Desktop Integration Analyst (1-5) spans multiple grades, Grade 3 was used for the purpose of this analysisMore than 20% deviation from market median index
• The Network Specialist was excluded from the structure analysis given that it is an outlier (market median is more than 10% above the current range maximum). Mercer recommends this job be reviewed in further detail to ensure job matching is appropriate
MERCER 16 December 21, 2011
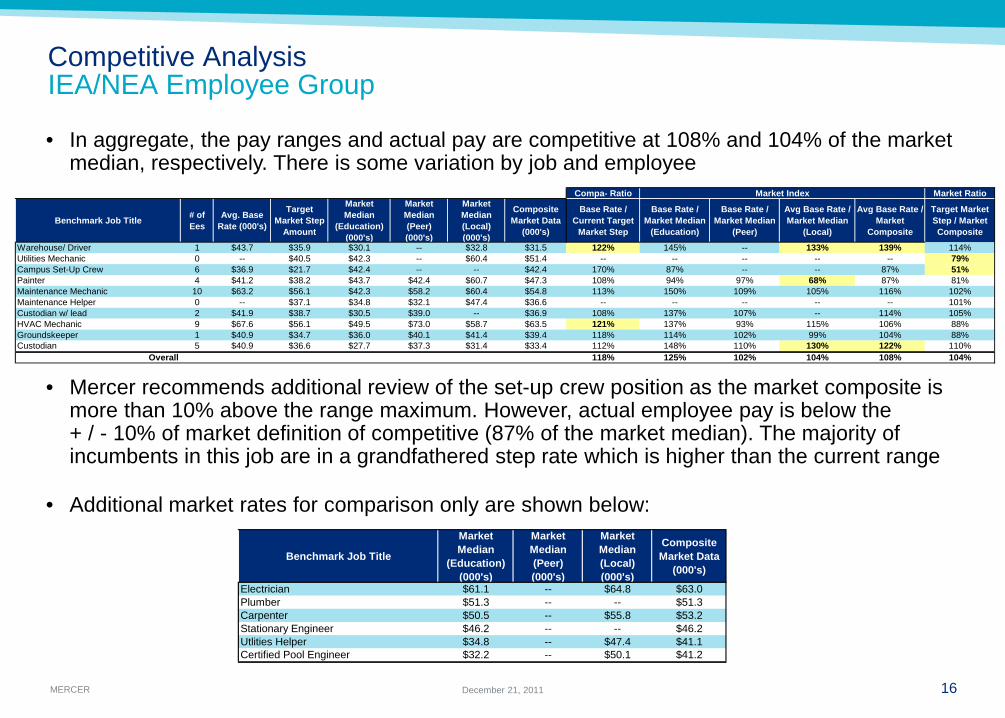
Competitive Analysis IEA/NEA Employee Group
• In aggregate, the pay ranges and actual pay are competitive at 108% and 104% of the market median, respectively. There is some variation by job and employee
• Mercer recommends additional review of the set-up crew position as the market composite is more than 10% above the range maximum. However, actual employee pay is below the + / - 10% of market definition of competitive (87% of the market median). The majority of incumbents in this job are in a grandfathered step rate which is higher than the current range
• Additional market rates for comparison only are shown below: Benchmark Job Title
Market Median
(Education) (000's)
Market Median (Peer) (000's)
Market Median (Local) (000's)
Composite Market Data
(000's)
Electrician $61.1 -- $64.8 $63.0Plumber $51.3 -- -- $51.3Carpenter $50.5 -- $55.8 $53.2Stationary Engineer $46.2 -- -- $46.2Utlities Helper $34.8 -- $47.4 $41.1Certified Pool Engineer $32.2 -- $50.1 $41.2
Compa- Ratio Market Index Market Ratio
Benchmark Job Title # of Ees
Avg. Base Rate (000's)
Target Market Step
Amount
Market Median
(Education) (000's)
Market Median (Peer) (000's)
Market Median (Local) (000's)
Composite Market Data
(000's)
Base Rate / Current Target
Market Step
Base Rate / Market Median
(Education)
Base Rate / Market Median
(Peer)
Avg Base Rate / Market Median
(Local)
Avg Base Rate / Market
Composite
Target Market Step / Market Composite
Warehouse/ Driver 1 $43.7 $35.9 $30.1 -- $32.8 $31.5 122% 145% -- 133% 139% 114%Utilities Mechanic 0 -- $40.5 $42.3 -- $60.4 $51.4 -- -- -- -- -- 79%Campus Set-Up Crew 6 $36.9 $21.7 $42.4 -- -- $42.4 170% 87% -- -- 87% 51%Painter 4 $41.2 $38.2 $43.7 $42.4 $60.7 $47.3 108% 94% 97% 68% 87% 81%Maintenance Mechanic 10 $63.2 $56.1 $42.3 $58.2 $60.4 $54.8 113% 150% 109% 105% 116% 102%Maintenance Helper 0 -- $37.1 $34.8 $32.1 $47.4 $36.6 -- -- -- -- -- 101%Custodian w/ lead 2 $41.9 $38.7 $30.5 $39.0 -- $36.9 108% 137% 107% -- 114% 105%HVAC Mechanic 9 $67.6 $56.1 $49.5 $73.0 $58.7 $63.5 121% 137% 93% 115% 106% 88%Groundskeeper 1 $40.9 $34.7 $36.0 $40.1 $41.4 $39.4 118% 114% 102% 99% 104% 88%Custodian 5 $40.9 $36.6 $27.7 $37.3 $31.4 $33.4 112% 148% 110% 130% 122% 110%
Overall 118% 125% 102% 104% 108% 104%

MERCER 17 December 21, 2011
Competitive Analysis IEA/NEA Employee Group
• The table below shows differences in market rates for the IEA/NEA jobs when comparing union versus non-union organizations
• Harper pay is competitive relative to the union organizations at 108% of the market median
• Jobs that were benchmarked for additional market comparisons are also provided below:
Benchmark Job TitleAll Institutions (Median Base -
000's)
All Union Institutions
(Median Base - 000's)
All Non-Union Institutions (Median
Base - 000's)
Union All Orgs / Non-Union All
Orgs
Union All Orgs / Non-Union All
Orgs
Carpenter $48.0 $64.6 $44.7 145% 135%Electrician $57.6 $65.3 $54.1 121% 113%Plumber $49.3 $68.2 $46.7 146% 138%Stationary Engineer -- -- -- -- --Certified Pool Engineer $28.8 $35.2 $26.7 132% 122%Utlities Helper $41.6 $53.9 $40.6 133% 130%
Harper Job Title Harper Average Pay All Institutions (Median Base -
000's)
All Union Institutions
(Median Base- 000's)
All Non-Union Institutions (Median
Base - 000's)
Union All Orgs / Non-Union All
Orgs
Union All Orgs / Non-Union All
Orgs
Harper Avg Pay / Union Edu
Market
Warehouse/ Driver $43.7 $29.4 $30.2 $29.3 103% 103% 145%Utilities Mechanic -- $51.0 $65.4 $49.7 132% 128% - Campus Set-Up Crew $36.9 -- -- -- -- -- - Painter $41.2 $39.1 $53.4 $39.4 136% 137% 77%Maintenance Mechanic $63.2 $51.0 $65.4 $49.7 132% 128% 97%Maintenance Helper -- $41.6 $53.9 $40.6 133% 130% - Custodian w/ lead $41.9 $27.5 $33.7 $25.5 132% 122% 125%HVAC Mechanic $67.6 $46.9 $65.2 $46.2 141% 139% 104%Groundskeeper $40.9 $27.8 $36.8 $27.2 135% 132% 111%Custodian $40.9 $25.0 $30.6 $23.2 132% 122% 134%
131% 128% 108%Note: Data represents Mercer survey data only (other published survey vendors utilized in
this study did not report data by union representation)
MERCER 18 December 21, 2011
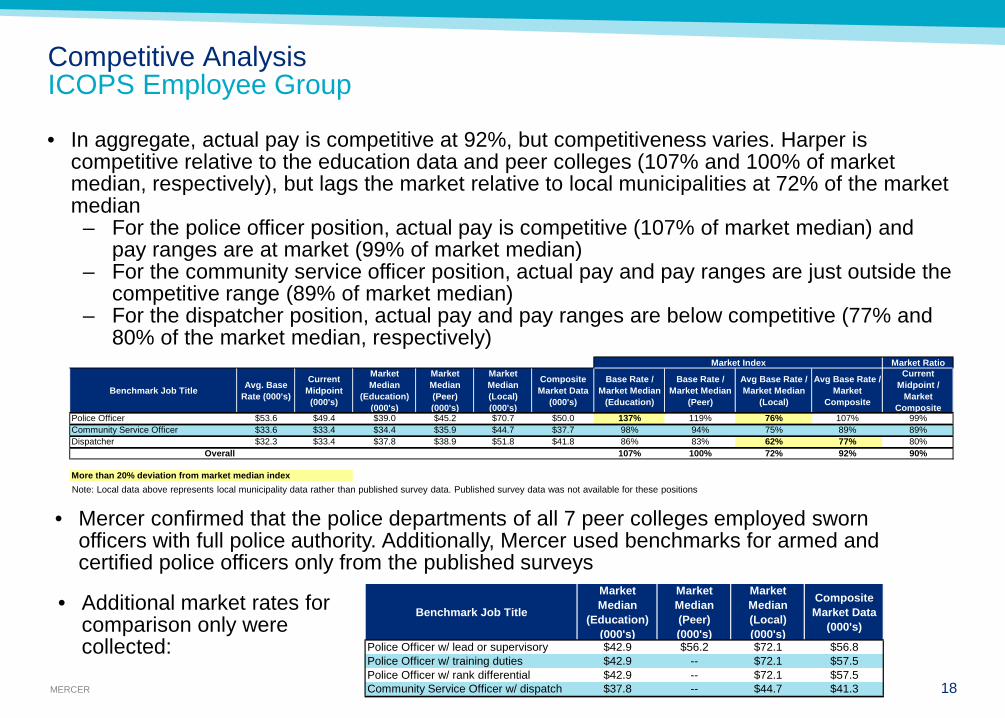
Competitive Analysis ICOPS Employee Group
• In aggregate, actual pay is competitive at 92%, but competitiveness varies. Harper is competitive relative to the education data and peer colleges (107% and 100% of market median, respectively), but lags the market relative to local municipalities at 72% of the market median
– For the police officer position, actual pay is competitive (107% of market median) and pay ranges are at market (99% of market median)
– For the community service officer position, actual pay and pay ranges are just outside the competitive range (89% of market median)
– For the dispatcher position, actual pay and pay ranges are below competitive (77% and 80% of the market median, respectively)
• Mercer confirmed that the police departments of all 7 peer colleges employed sworn officers with full police authority. Additionally, Mercer used benchmarks for armed and certified police officers only from the published surveys
Note: Local data above represents local municipality data rather than published survey data. Published survey data was not available for these positions
Benchmark Job Title
Market Median
(Education) (000's)
Market Median (Peer) (000's)
Market Median (Local) (000's)
Composite Market Data
(000's)
Police Officer w/ lead or supervisory $42.9 $56.2 $72.1 $56.8Police Officer w/ training duties $42.9 -- $72.1 $57.5Police Officer w/ rank differential $42.9 -- $72.1 $57.5Community Service Officer w/ dispatch $37.8 -- $44.7 $41.3
• Additional market rates for comparison only were collected:
Market Index Market Ratio
Benchmark Job Title Avg. Base Rate (000's)
Current Midpoint (000's)
Market Median
(Education) (000's)
Market Median (Peer) (000's)
Market Median (Local) (000's)
Composite Market Data
(000's)
Base Rate / Market Median
(Education)
Base Rate / Market Median
(Peer)
Avg Base Rate / Market Median
(Local)
Avg Base Rate / Market
Composite
Current Midpoint /
Market Composite
Police Officer $53.6 $49.4 $39.0 $45.2 $70.7 $50.0 137% 119% 76% 107% 99%Community Service Officer $33.6 $33.4 $34.4 $35.9 $44.7 $37.7 98% 94% 75% 89% 89%Dispatcher $32.3 $33.4 $37.8 $38.9 $51.8 $41.8 86% 83% 62% 77% 80%
Overall 107% 100% 72% 92% 90%
More than 20% deviation from market median index

MERCER 19 December 21, 2011
Competitive Analysis Adjunct Employee Group
• Adjunct faculty pay is very competitive relative to the peer organizations at 111% of the market median, 147% of an extended group of 2-year organizations, and 74% as compared to private 4-year colleges providing data:
• The organizations providing data for the extended samples are shown below. These
comparisons are provided for reference only and are not intended to represent a peer group. Additional data has been requested from other universities, but this represents all data received to date: – Public 2-year organizations: Parkland College, Heartland Community College, Morton
College, Waubonsee Community College, Illinois Central College, Carl Sandburg College, Lake Land College and McHenry County College
– Private 4-year organizations: Robert Morris University, Loyola University, Roosevelt University and Aurora University
• Harper adjunct rates are highly competitive relative to the range reported by the CUPA survey for adjunct faculty pay for 2-year institutions. The median minimum to maximum range reported was $569 - $778, based on approximately 130 organizations who reported data nationally. For 4-year institutions, the median range reported was $740 - $1,000 per credit hour for undergraduate instruction, based on approximately 450 organizations who reported data nationally
Note: Robert Morris University excluded from table above, as they pay based on a 10-week term (rather than per credit hour). The rate per term is $500 - $1,000.
Market Index
Harper Median
Range Rate
Peer Colleges (Median)
Extended Sample (2
Year)
Extended Sample (4-
Year)
Harper Median Rate
/ Peer
Harper Median Rate / Ext. 2 Year
Harper Median Rate / Ext. 4 Year
Pay Rate per Credit Hour $931 $839 $635 $1,253 111% 147% 74%
MERCER 20 December 21, 2011
Competitive Analysis Adjunct Employee Group
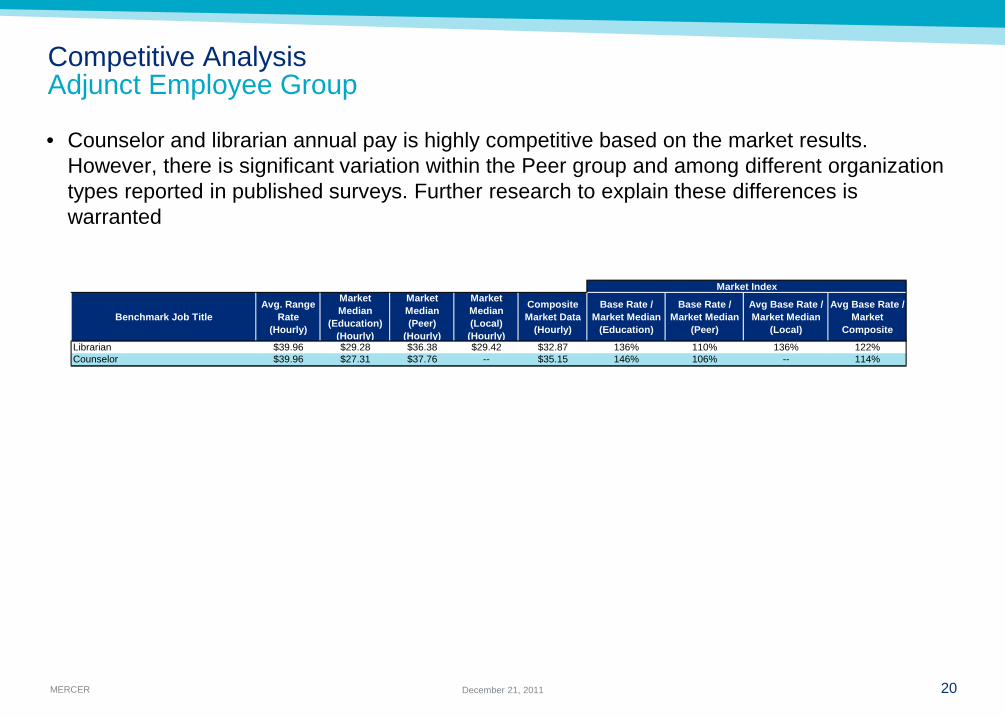
• Counselor and librarian annual pay is highly competitive based on the market results. However, there is significant variation within the Peer group and among different organization types reported in published surveys. Further research to explain these differences is warranted
Market Index
Benchmark Job TitleAvg. Range
Rate (Hourly)
Market Median
(Education) (Hourly)
Market Median (Peer)
(Hourly)
Market Median (Local) (Hourly)
Composite Market Data
(Hourly)
Base Rate / Market Median
(Education)
Base Rate / Market Median
(Peer)
Avg Base Rate / Market Median
(Local)
Avg Base Rate / Market
Composite
Librarian $39.96 $29.28 $36.38 $29.42 $32.87 136% 110% 136% 122%Counselor $39.96 $27.31 $37.76 -- $35.15 146% 106% -- 114%
MERCER 21 December 21, 2011
Competitive Analysis Other
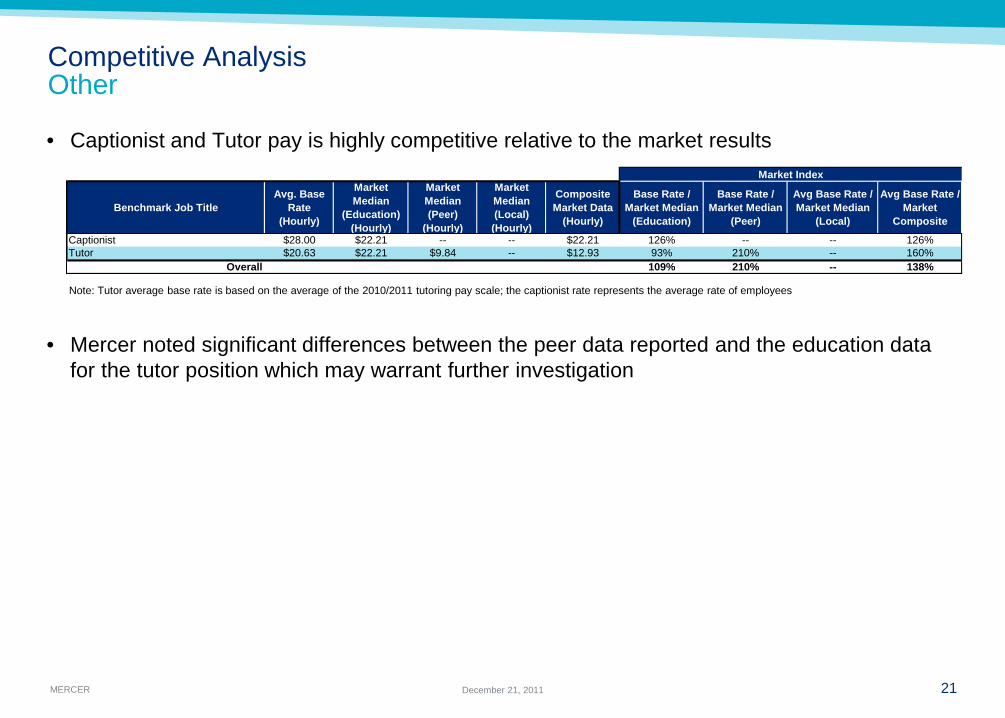
• Captionist and Tutor pay is highly competitive relative to the market results
• Mercer noted significant differences between the peer data reported and the education data for the tutor position which may warrant further investigation
Note: Tutor average base rate is based on the average of the 2010/2011 tutoring pay scale; the captionist rate represents the average rate of employees
Market Index
Benchmark Job TitleAvg. Base
Rate (Hourly)
Market Median
(Education) (Hourly)
Market Median (Peer)
(Hourly)
Market Median (Local) (Hourly)
Composite Market Data
(Hourly)
Base Rate / Market Median
(Education)
Base Rate / Market Median
(Peer)
Avg Base Rate / Market Median
(Local)
Avg Base Rate / Market
Composite
Captionist $28.00 $22.21 -- -- $22.21 126% -- -- 126%Tutor $20.63 $22.21 $9.84 -- $12.93 93% 210% -- 160%
Overall 109% 210% -- 138%

SUMMARY
MERCER 23 December 21, 2011
In Summary: Key Messages
• Harper’s benefits program is strongly competitive
• Harper’s pay ranges are competitive (96% of market)
• On average employee pay is competitive (106% of market)
• No employees are paid below their range minimum
• Pay varies by Employee group but on average all groups are within or above the + or – 10% definition of “competitive”
• While pay is competitive on average, pay for individual employees and jobs vary greatly
• Next steps include further review of: – Benchmark jobs with range midpoints significantly above or below market – Individual jobs and employees paid significantly below and above market

APPENDIX
MERCER 25 December 21, 2011
Published Survey Sources
• The following published surveys were used to collect compensation data for all positions: – College and University Personnel Associates (CUPA): 2010 Administrative Compensation Survey – College and University Personnel Associates (CUPA): 2010 Mid-Level Administrative Professional
Salary Survey – Mercer, 2011 US Global Premium Executive Remuneration Suite (GPERS) – Mercer, 2011 US Benchmark Database – American Library Association: 2010 ALA –APA Salary Survey – Employers Group: 2010 The National Information Technology and Engineering Compensation Survey – Towers Watson, 2010 Top Management Compensation Survey – Towers Watson, 2010 Top Office and Business Support Compensation Survey – Towers Watson, 2010 Survey Report on Professional Administrative Services Personnel Compensation – Towers Watson, 2010 Survey Report on Technician and Skilled Trades Personnel Compensation – Towers Watson, 2010 Survey Report on Information Technology and e-Commerce Personnel
Compensation – Towers Watson, 2010 Survey Report on Supervisory Management Compensation – Towers Watson, 2010 Survey Report on Middle Management Compensation – Towers Watson, 2010 Survey Report on Professional Specialized Services Personnel
• Participating organizations are provided on the subsequent pages for the CUPA and Mercer surveys. Other surveys have similar participant profiles and full participant listings are available upon request.
MERCER 26 December 21, 2011
CUPA Survey Participating Associate’s Institutions
Aims Community College Alamo Community College District Central Office Alexandria Technical College
Anne Arundel Community College Anoka Technical College Anoka-Ramsey Community College Arapahoe Community College Arizona Western College Asheville - Buncombe Technical Community College Austin Community College Bellevue College Bismarck State College Black River Technical College Bossier Parish Community College Brookdale Community College Brookhaven College Broward College Bucks County Community College Bunker Hill Community College Butler Country Community College Cascadia Community College Cedar Valley College Central Arizona College Central Lakes College Central New Mexico Community College Central Ohio Technical College Central Virginia Community College Central Wyoming College Century College Chattanooga State Community College Chipola College
City Colleges of Chicago Cleveland State Community College Clovis Community College Cochise College Coconino Country Community College College of DuPage College of Southern Nevada Collin County Community College District Colorado Community College System Colorado Mountain College Columbus State Community College Community College of Allegheny Country Community College of Philadelphia Community College of Rhode Island Community College System of New Hampshire Cottey College Cuyahoga Community College Dakota County Technical College Dallas County Community College District Office Davis Applied Technology College Dean College Del Mar College Delaware Tech & Com College System Summary Delgado Community College Eastfield College Edison State Community College El Centro College El Paso Community College Flathead Valley Community College Fond du Lac Tribal and Community College Georgia Perimeter College
Good Samaritan College of Nursing and Health Science Greenville Technical College Harrisburg Area Community College Heartland Community College Hennepin Technical College Hibbing Community College, Highland Community College Hillsborough Community College Holyoke Community College Houston Community College System Summary Howard College Illinois Central College Inver Hills Community College Itasca Community College James A. Rhodes State College John Wood Community College Johnson Country Community College Joilet Junior College Kalamazoo Valley Community College Kansas City Kansas Community College Kirkwood Community College Kirtland Community College L.E. Fletcher Technical Community College Lake Region Sate College Lake Superior College Lakeland Community College Lamar State College-Orange Landmark College Lane Community College Latter-Day Saints Business College

MERCER 27 December 21, 2011
CUPA Survey Participating Associate’s Institutions
Los Angeles Community College District Office Louisiana Delta Community College Louisiana State University at Eunice Lower Columbia College Marymount College Mercer County Community College Maricopa Cty Cmty Col District System Summary Mesabi Range Community and Technical College Mesalands Community College Metropolitan Community College Miami Dade College Minneapolis Community and Technical College Minnesota State College - Southeast Technical Minnesota State Community and Technical College Minnesota West Community and Technical College Missouri State University - West Plains Monroe Community College Montana State University - Great Falls College of Tech. Montgomery County Community College Moraine Park Technical College Morgan Community College Mott Community College Mount Wachusett Community College Mountain View College Mt. Hood Community College New Mexico Junior College New Mexico State University at Alamogordo New Mexico State University at Carlsbad Normandale Community College North Central Texas College North Dakota State College of Science
North Hennepin Community College North Idaho College North Lake College Northampton Country Area Community College Northeast State Technical Community College Northern Essex Community College Northern Wyoming Community College District Northland Community and Technical College Northshore Technical College Northwest Florida State College Northwest State Community College Northwest Technical College Northwestern Business College Northwestern Michigan College Nunez Community College Oakland Community College Oakton Community College Oklahoma City Community College Olympic College Ouachita Technical College Owens Community College Palm Beach State College Pellissippi State Community College Pennsylvania Highlands Community College Peralta Community Colleges District Office Pine Technical College Pittsburgh Technical Institute Portland Community College Rainy River Community College Reading Area Community College Richland College
Richland Community College Ridgewater College River Parishes Community College Riverland Community College Roane State Community College Rochester Community and Technical College Rowan-Cabarrus Community College Saint Cloud Technical College Saint Louis Community College Center Saint Paul College Salt Lake Community College San Jacinto College System Summary Santa Fe College Santa Fe Community College Schoolcraft College Seminole State College of Florida Sinclair Community College Snow College South Central College South Texas College Southern State Community College Southern West Virginia Community and Technical College Southwest Tennessee Community College Spartanburg Methodist College St. Vincent's College State College of Florida, Manatee-Sarasota Tarrant County College District Treasure Valley Community College Trocaire College Tulsa Community College University of Arkansas Community College at Morrilton

MERCER 28 December 21, 2011
CUPA Survey Participating Associate’s Institutions
University of Hawaii Community College
University of Hawaii Hawaii Community College
University of Hawaii Honolulu Community College
University of Hawaii Kapiolani Community College
University of Hawaii Kauai Community College
University of Hawaii Leeward Community College
University of Hawaii Maui College
University of Hawaii Windward Community College
Valencia Community College
Vermillion Community College
Virginia Community College System Office
Volunteer State Community College
Walters State Community College
Washtenaw Community College
Weatherford College
Wenatchee Valley College
Western Nebraska Community College
Western Nevada College
Western Technical College
Westmoreland County Community College
William Rainey Harper College
Yavapai College

MERCER 29 December 21, 2011
Mercer Benchmark Database Survey Participating Education Institutions
Knowledge Learning Corporation - Champions
Knowledge Learning Corporation - Children's Creative Learning Centers
Knowledge Learning Corporation - KinderCare Learning Centers
Laureate Education, Inc.
Laureate Education, Inc. - College of Santa Fe
Laureate Education, Inc. - Kendall College
Laureate Education, Inc. - Laureate Higher Education Group
Laureate Education, Inc. - Laureate Higher Education Group
Laureate Education, Inc. - Laureate Latin America
Laureate Education, Inc. - National Hispanic University
Laureate Education, Inc. - New School of Architecture and Design
Laureate Education, Inc. - Walden University
Learning Care Group, Inc
Los Angeles Community College District
Los Angeles Unified School District
Loyola University Chicago
Massachusetts Institute of Technology
Medical College of Wisconsin
Mount Holyoke College
National-Louis University
New York University
Northern Arizona University
Northwestern University
Randolph-Macon College
Stanford University
Texas State University-San Marcos
The Johns Hopkins University
The Ohio State University
The University of Arizona
The University of Chicago
The University of Texas System
The University of Texas System - University of Texas Health Science Center
The University of Texas System - University of Texas Southwestern Medical Center
Transylvania University
Tufts University
University at Buffalo
University of Alabama at Birmingham
University of Central Florida
University of Houston
University of Illinois at Chicago
University of Louisville
University of Michigan
University of Minnesota
University of Minnesota - Crookston
University of Minnesota - Duluth
University of Minnesota - Morris
University of Notre Dame
University of Pennsylvania
University of Southern California
Washington University
Weill Cornell Medical College
Westwood College
Wheaton College
William Marsh Rice University
Yeshiva University
Austin Community College
Babson College
Baylor College of Medicine
Bentley University
Boston College
Bridgepoint Education, Inc.
Capella Education Company
Career Education Corporation
Carleton College
Carnegie Mellon University
College of DuPage
College of William & Mary
Cornell University
Dallas County Community College District
DePaul University
DeVry, Inc.
Drexel University
Education Management Corporation Educational Testing Service (ETS)
Emory University
Georgetown University
Georgia Institute of Technology
Hampshire College
Harvard University
Houston Independent School
Indiana University
Jefferson County Public Schools
Kent State University
Knowledge Learning Corporation
MERCER 30 December 21, 2011
Mercer Benchmark Database Survey Participating Chicago Institutions
Jones Lang LaSalle - Americas Kohler Company - Interiors Group Laureate Education, Inc. - Kendall College Loyola University Chicago Lyric Opera of Chicago MillerCoors LLC National Futures Association Navigant Consulting, Inc. Northern Trust Corporation OSI Industries, LLC - Chicago Campus Facility PrivateBancorp, Inc. Quest Diagnostics - Wooddale Rush University Medical Center S&C Electric Company Sidley Austin, LLP SMART Technologies Corporation The Boeing Company The Options Clearing Corporation The University of Chicago The University of Chicago Medical Center TTX Company U.S. Foodservice - SYMPC Chicago Union Tank Car Company United States Cellular Corporation University of Illinois at Chicago Veolia Water North America William Blair & Company, LLC Wm. Wrigley Jr. Company Wm. Wrigley Jr. Company - North America Wm. Wrigley Jr. Company - US YMCA of the USA
Access Community Health Network Akzo Nobel, Inc. American Medical Association Barry Callebaut USA LLC Bovis Lend Lease - Chicago Bovis Lend Lease - MultiSite Chicago Transit Authority Classified Ventures, LLC CME Group Inc. CNA Financial Corporation DePaul University Envestnet, Inc. Equity Residential Equity Residential - Equity Corporate Housing Exelon Corporation Federal Reserve Bank of Chicago Fox Networks Group - Big Ten Network Freeman Companies - Freeman Electrical GATX Corporation GKN America Corporation Grant Thornton LLP Harris Associates L.P. Harris N.A. Health Care Service Corporation Heidrick & Struggles International, Inc. Hu-Friedy Manufacturing Company, Inc. Huron Consulting Group Hyatt Hotels Corporation James Hardie Industries, SE Jones Lang LaSalle