HARLINGEN CONSOLIDATED INDEPENDENT SCHOOL DISTRICT HARLINGEN CONSOLIDATED INDEPENDENT SCHOOL...
32
HARLINGEN HARLINGEN CONSOLIDATED CONSOLIDATED INDEPENDENT SCHOOL INDEPENDENT SCHOOL DISTRICT DISTRICT 1
-
Upload
jonathan-robinson -
Category
Documents
-
view
220 -
download
2
Transcript of HARLINGEN CONSOLIDATED INDEPENDENT SCHOOL DISTRICT HARLINGEN CONSOLIDATED INDEPENDENT SCHOOL...

HARLINGEN HARLINGEN CONSOLIDATEDCONSOLIDATED
INDEPENDENT SCHOOL INDEPENDENT SCHOOL DISTRICTDISTRICT
1

HARLINGEN HARLINGEN CONSOLIDATED CONSOLIDATED
INDEPENDENT SCHOOL INDEPENDENT SCHOOL DISTRICTDISTRICT
2013-2014
Proposed Budget
2

ESTIMATED REVENUES ESTIMATED REVENUES AND APPROPRIATIONSAND APPROPRIATIONS
Fund Description Revenue Appropriation Difference
199 Local Maintenance
$140,914,139.00 138,527,099.00 $ 2,387,040.00
162 Athletics 384,625.00 $ 2,771,665.00 (2,387,040.00)
General Funds Total
$141,298,764.00 $141,298,764.00 -
240 Food Service $ 11,075,683.00 $ 11,075,683.00 -
511 Interest and Sinking
$ 10,435,343.00 $ 10,435,343.00 ____________
Total All Funds
$162,809,790.00 $ 162,809,790.00 -
3

FACTORS IMPACTING BUDGETFACTORS IMPACTING BUDGET CERTIFIED TAX ROLL $ 3,325,202,391 INCREASE OF 0.83% COLLECTION RATE 97.5% TAX RATE $ 1.218
M&O $ 1.04 I&S $ .178 STUDENT ADA 17,150 ENROLLMENT INCREASE OF 0.00% INCREASE IN STAFF (CANO FRESHMAN
ACADEMY)$1,085,507
OTHER STAFF INCREASE$793,540
HEALTH INSURANCE INCREASE 5.0% TEACHER STARTING SALARY WILL BE
$43,000 SALARY INCREASE 2.6%/$1300 PER
TEACHER SALARY INCREASE PROFESSIONALS AND
ADMINISTRATROS 2.6% SALARY INCREASE HOURLY 3.0% INCREASET TO SECURITY BUDGET $125,000 NEW STUDENT ATTENDANCE INCENTIVE
$90,000
4

FACTORS IMPACTING FACTORS IMPACTING BUDGET CONTINUEDBUDGET CONTINUED
$865,000 FOR ANNUAL PAYMENT OF LEASE REVENUE BONDS USED TO FINANCE NEW ELEMENTARY INCLUDED IN LOCAL BUDGET
5

OTHER FACTORSOTHER FACTORS
INCREASE IN TAXABLE VALUE– .83%
STATE REVENUE INCREASES– INCREASE IN BASIC ALLOTMENT– FROM $4765.00 TO 4950.00– INCREASE IN REGULAR PROGRAM ALLOTMENT– FROM .98 TO 1.00– TOTAL GAIN OF $4,892,500
6

Estimated Revenues Estimated Revenues By FundBy Fund
Athletic Fund General Fund Food Service Fund Debt Service Fund Total
$ 384,625.00 $ 140,914,139.00 $ 11,075,683.00 $ 10,435,343.00 $ 162,809,790.00
7

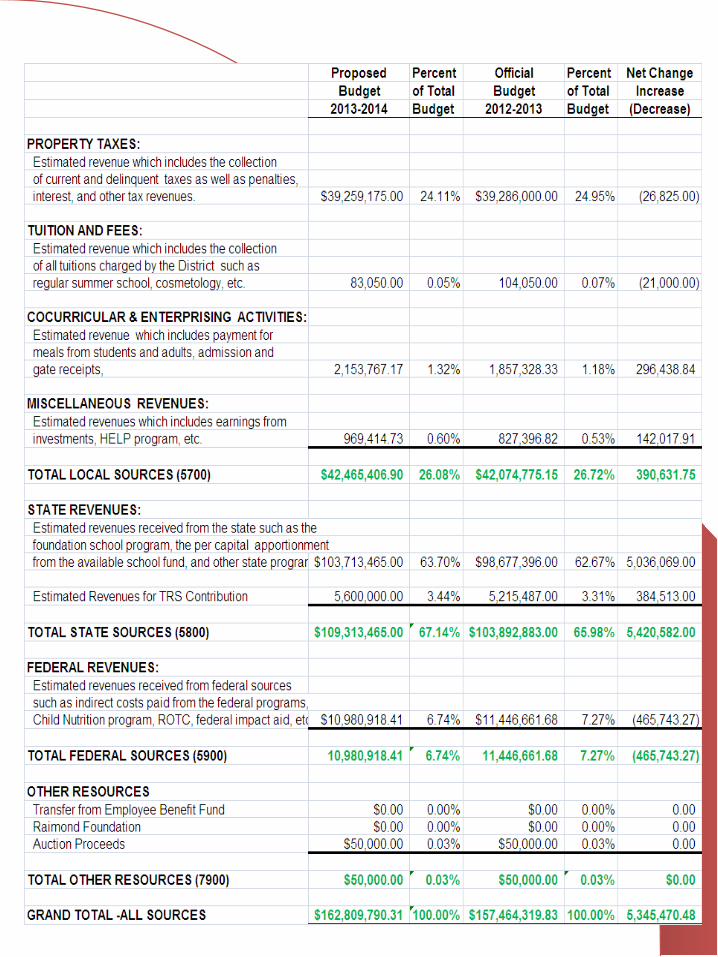
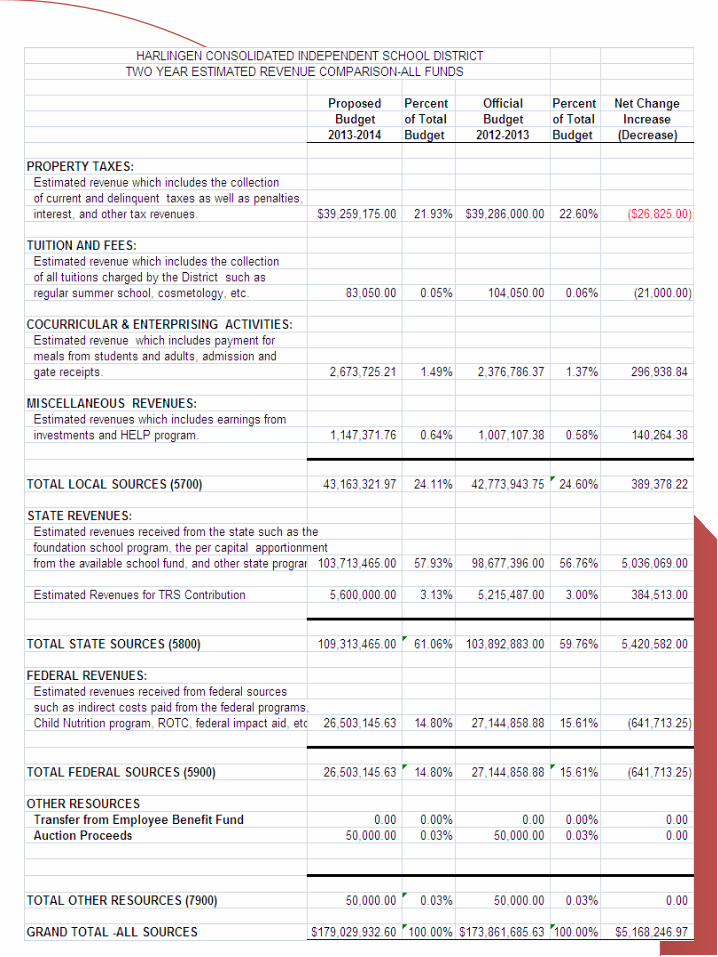
ESTIMATED ESTIMATED REVENUE BY TYPEREVENUE BY TYPE
Property Taxes
Other Local Revenue
State Revenue
Federal Revenue
Other Sources
Grand Total
$ 39,259,175.00 ( 24.11%)
3,208,231.90 ( 1.97%) 109,313,465.00
( 67.14%) 10,980,918.41 ( 6.74%) 50,000.00 ( .03%) $162,809,790.31
( 100.00%)
8
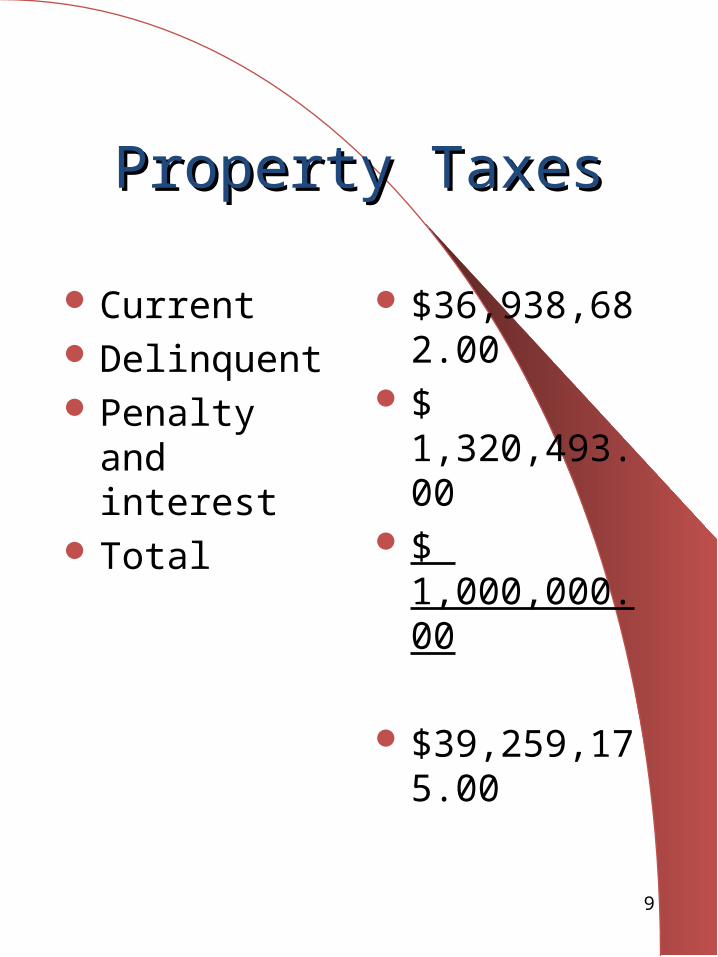
Property TaxesProperty Taxes
Current Delinquent Penalty and
interest Total
$36,938,682.00 $ 1,320,493.00 $ 1,000,000.00
$39,259,175.00
9

Misc RevenuesMisc Revenues
Athletic Rev Food Service Interest Income Other Total
$ 384,625.00 $ 1,770,142.17 $ 102,500.00 $ 948,964.73 $ 3,206,231.90
10

State RevenuesState Revenues Regular Block Grant Special Education Career and Tech Gifted and Talented State Compensatory Bilingual Transportation Tier II High School Allotmt Staff Allotment EDA IFA TRS on Behalf Other State Funds Total
$53,534,559 9,945,525 7,979,718 557,512 15,974,696 1,175,706 858,000 6,711,407 1,286,351 621,000 1,150,721 3,657,232 5,600,000 261,038 $109,313,465
11

Federal RevenuesFederal Revenues
Breakfast Lunch Indirect Costs ROTC Fed Reim Medicaid/Shars US Commodities Other Total
$ 2,383,357 6,516,264 252,000 137,561 1,000,000 90,000 601,736 $10,980,918
12

Other ResourcesOther Resources
Auction proceeds Total
$ 50,000.00
$ 50,000.00
13

RevenuesRevenues
14

Appropriations By Appropriations By FundFund
Athletics General Fund Food Service Debt Service Total
$ 2,771,665.00 $ 138,527,099.00 $ 11,075,683.00 $ 10,435,343.00 $ 162,809,790.00
15
16

Appropriations By FunctionAppropriations By Function
Instruction Instructional Res Staff Development Instr Related Services School Administration Guidance & Counseling Social Work Health Services Transportation Food Service Co/Extracurricular Gen Administration Plant Maintenance Security Services Data Processing Community Services Debt Services Facility Construction Jjaep Appraisal Dist Total
$ 82,545,754 ( 55.07%) 3,151,072 ( 2.10%) 1,359,237 ( 5.0%) 2,892,808 ( 1.93%) 9,525,011 ( 6.35%) 4,597,827 ( 3.07%) 214,419 ( .14%) 1,702,425 ( 1.14%) 3,577,375 ( 2.39%) 10,594,742 ( 7.07%) 4,981,028 ( 3.32%) 3,985,768 ( 2.66%) 17,452,706 ( 11.64%) 1,130,103 ( .75%) 1,696,104 ( 1.13%) 1,063,067 ( .71%) 11,790,343 ( 7.87%) 0 ( .00%) 150,000 ( .10%) 400,000 ( .27%) $162,809,790 (100.00%)
17

Appropriations By Appropriations By Object CodeObject Code
Payroll Contracted Services Supplies and Mat Other Operating Exp Debt Service Capital Outlay Total
$121,927,632 ( 81.34%) 11,622,138 ( 7.75%) 13,218,341 ( 8.82%) 3,527,285 ( 2.35%) 11,790,343 ( 7.87%) 724,052 ( .56%) $162,809,790 (100.00%)
18

AppropriationsAppropriationsState ProgramsState Programs
Gifted and Talented Career and Tech Special Education State Compensatory Bilingual High School
Allotment
$ 1,249,041 $ 3,862,415 $10,682,836 $ 8,533,625 $ 848,516 $ 1,206,513
19

AppropriationsAppropriations
20

Fund Comparison to Fund Comparison to Prior Year BudgetPrior Year Budget
21

PRIOR YEAR COMARISONPRIOR YEAR COMARISONGENERAL, FOOD SERVICE AND DEBT SERVICEGENERAL, FOOD SERVICE AND DEBT SERVICE
22
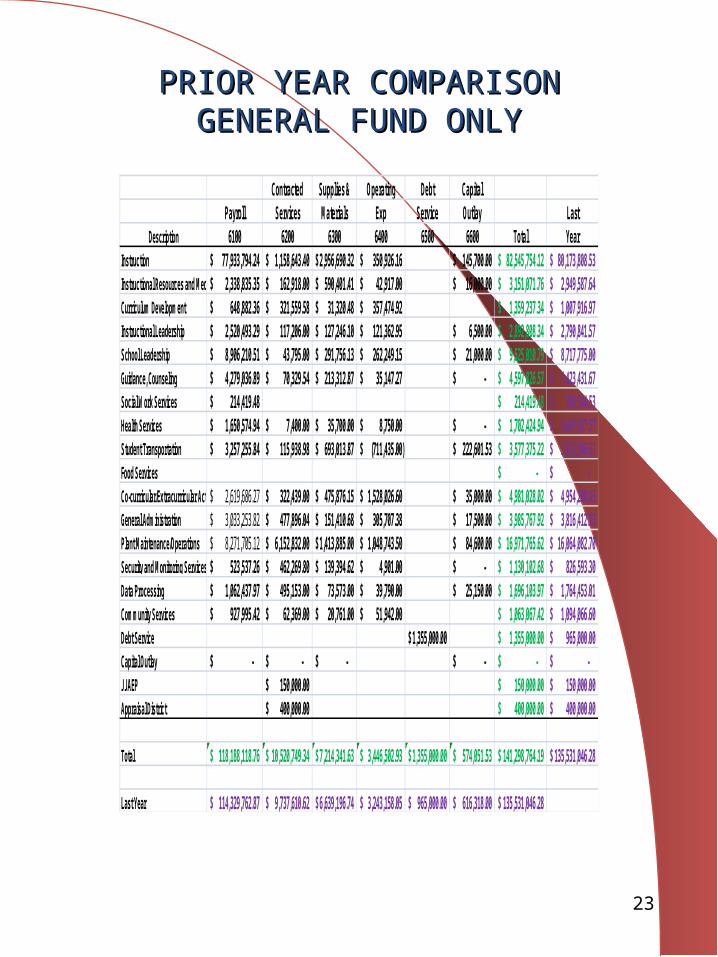
PRIOR YEAR COMPARISONPRIOR YEAR COMPARISONGENERAL FUND ONLYGENERAL FUND ONLY
23
Contracted Supplies & Operating Debt CapitalPayroll Services Materials Exp Service Outlay Last
Description 6100 6200 6300 6400 6500 6600 Total YearInstruction 77,933,794.24$ 1,158,643.40$ 2,956,690.32$ 350,926.16$ 145,700.00$ 82,545,754.12$ 80,173,808.53$ Instructional Resources and Media Services2,338,835.35$ 162,918.00$ 590,401.41$ 42,917.00$ 16,000.00$ 3,151,071.76$ 2,949,587.64$ Curriculum Development 648,882.36$ 321,559.58$ 31,320.48$ 357,474.92$ 1,359,237.34$ 1,007,916.97$ Instructional Leadership 2,520,493.29$ 117,206.00$ 127,246.10$ 121,362.95$ 6,500.00$ 2,892,808.34$ 2,790,841.57$ School Leadership 8,906,210.51$ 43,795.00$ 291,756.13$ 262,249.15$ 21,000.00$ 9,525,010.79$ 8,717,775.00$ Guidance, Counseling 4,279,036.89$ 70,329.54$ 213,312.87$ 35,147.27$ -$ 4,597,826.57$ 4,423,431.67$ Social Work Services 214,419.48$ 214,419.48$ 209,544.53$ Health Services 1,650,574.94$ 7,400.00$ 35,700.00$ 8,750.00$ -$ 1,702,424.94$ 1,647,697.57$ Student Transportation 3,257,255.84$ 115,938.98$ 693,013.87$ (711,435.00)$ 222,601.53$ 3,577,375.22$ 3,575,546.61$ Food Services -$ -$ Co-curricular/Extracurricular Activities 2,619,686.27$ 322,439.00$ 475,876.15$ 1,528,026.60$ 35,000.00$ 4,981,028.02$ 4,954,288.45$ General Administration 3,033,253.82$ 477,896.04$ 151,410.68$ 305,707.38$ 17,500.00$ 3,985,767.92$ 3,816,412.13$ Plant Maintenance/Operations 8,271,705.12$ 6,152,832.00$ 1,413,885.00$ 1,048,743.50$ 84,600.00$ 16,971,765.62$ 16,064,082.70$ Security and Monitoring Services 523,537.26$ 462,269.80$ 139,394.62$ 4,901.00$ -$ 1,130,102.68$ 826,593.30$ Data Processing 1,062,437.97$ 495,153.00$ 73,573.00$ 39,790.00$ 25,150.00$ 1,696,103.97$ 1,764,453.01$ Community Services 927,995.42$ 62,369.00$ 20,761.00$ 51,942.00$ 1,063,067.42$ 1,094,066.60$ Debt Service 1,355,000.00$ 1,355,000.00$ 965,000.00$ Capital Outlay -$ -$ -$ -$ -$ -$ JJAEP 150,000.00$ 150,000.00$ 150,000.00$ Appraisal District 400,000.00$ 400,000.00$ 400,000.00$
Total 118,188,118.76$ 10,520,749.34$ 7,214,341.63$ 3,446,502.93$ 1,355,000.00$ 574,051.53$ 141,298,764.19$ 135,531,046.28$
Last Year 114,329,762.87$ 9,737,610.62$ 6,639,196.74$ 3,243,158.05$ 965,000.00$ 616,318.00$ 135,531,046.28$
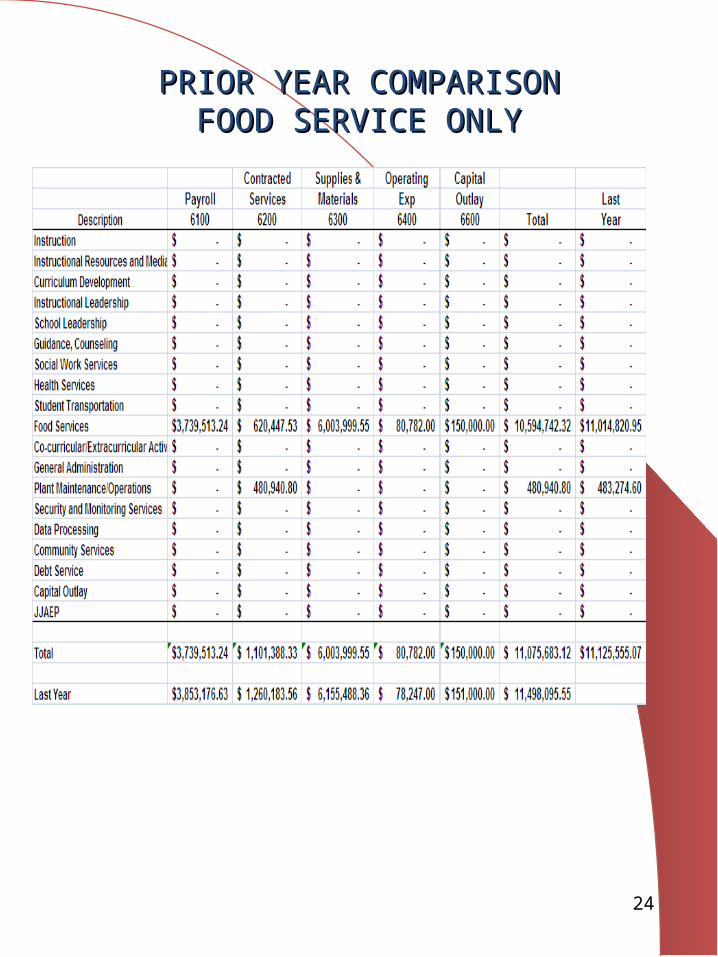
PRIOR YEAR COMPARISONPRIOR YEAR COMPARISONFOOD SERVICE ONLYFOOD SERVICE ONLY
24

Debt Service FundDebt Service Fund
25
Tax Rate Tax Rate
26
27
28
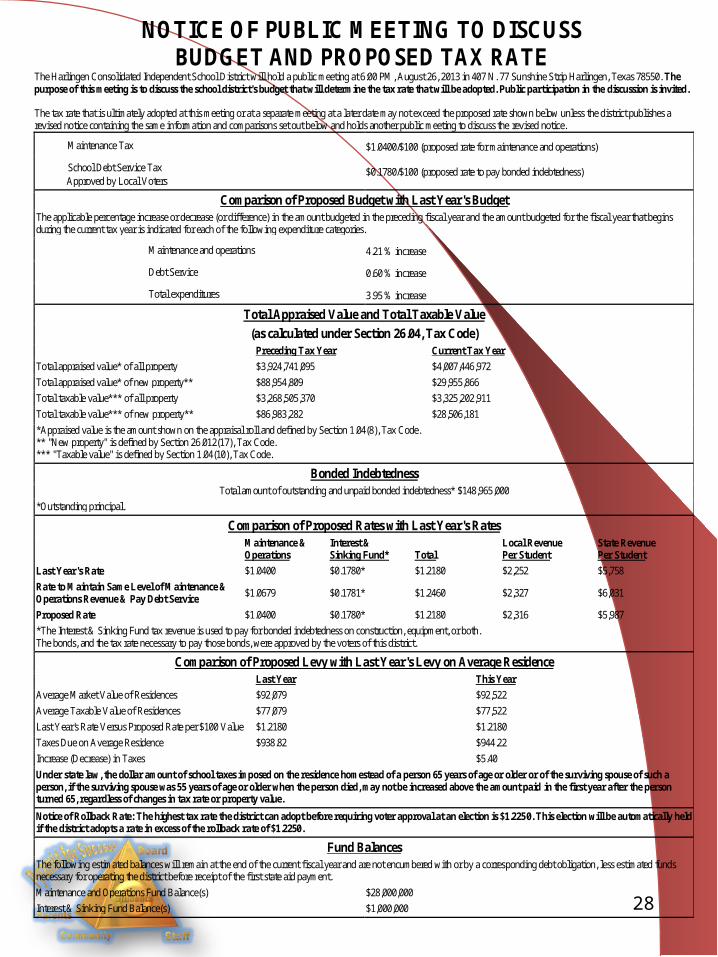
NOTICE OF PUBLIC MEETING TO DISCUSS BUDGET AND PROPOSED TAX RATE
The Harlingen Consolidated Independent School District will hold a public meeting at 6:00 PM, August 26, 2013 in 407 N. 77 Su nshine Strip Harlingen, Texas 78550. The purpose of this meeting is to discuss the school district's budget that will determine the tax rate that will be adopted. Public participation in the discussion is invited. The tax rate that is ultimately adopted at this meeting or at a separate meeting at a later date may not exceed the proposed rate shown below unless the district publishes a revised notice containing the same information and comparisons set out below and holds another public meeting to discuss the revised notice.
Maintenance Tax $1.0400/$100 (proposed rate for maintenance and operations) School Debt Service Tax Approved by Local Voters
$0.1780/$100 (proposed rate to pay bonded indebtedness)
Comparison of Proposed Budget with Last Year's Budget The applicable percentage increase or decrease (or difference) in the amount budgeted in the preceding fiscal year and the amount budgeted for the fiscal year that begins during the current tax year is indicated for each of the following expenditure categories.
Maintenance and operations 4.21 % increase
Debt Service 0.60 % increase
Total expenditures 3.95 % increase
Total Appraised Value and Total Taxable Value
(as calculated under Section 26.04, Tax Code)
Preceding Tax Year Current Tax Year
Total appraised value* of all property $3,924,741,095 $4,007,446,972
Total appraised value* of new property** $88,954,809 $29,955,866
Total taxable value*** of all property $3,268,505,370 $3,325,202,911
Total taxable value*** of new property** $86,983,282 $28,506,181
*Appraised value is the amount shown on the appraisal roll and defined by Section 1.04(8), Tax Code. ** "New property" is defined by Section 26.012(17), Tax Code. *** "Taxable value" is defined by Section 1.04(10), Tax Code.
Bonded Indebtedness Total amount of outstanding and unpaid bonded indebtedness* $148,965,000
*Outstanding principal. Comparison of Proposed Rates with Last Year's Rates
Maintenance & Operations
Interest & Sinking Fund*
Total
Local Revenue Per Student
State Revenue Per Student
Last Year's Rate $1.0400 $0.1780* $1.2180 $2,252 $5,758
Rate to Maintain Same Level of Maintenance & Operations Revenue & Pay Debt Service $1.0679 $0.1781* $1.2460 $2,327 $6,031
Proposed Rate $1.0400 $0.1780* $1.2180 $2,316 $5,987
*The Interest & Sinking Fund tax revenue is used to pay for bonded indebtedness on construction, equipment, or both. The bonds, and the tax rate necessary to pay those bonds, were approved by the voters of this district.
Comparison of Proposed Levy with Last Year's Levy on Average Residence
Last Year This Year Average Market Value of Residences $92,079 $92,522
Average Taxable Value of Residences $77,079 $77,522
Last Year's Rate Versus Proposed Rate per $100 Value $1.2180 $1.2180
Taxes Due on Average Residence $938.82 $944.22
Increase (Decrease) in Taxes
$5.40
Under state law, the dollar amount of school taxes imposed on the residence homestead of a person 65 years of age or older or of the surviving spouse of such a person, if the surviving spouse was 55 years of age or older when the person died, may not be increased above the amount paid in the first year after the person turned 65, regardless of changes in tax rate or property value.
Notice of Rollback Rate: The highest tax rate the district can adopt before requiring voter approval at an election is $1.2250. This election will be automatically held if the district adopts a rate in excess of the rollback rate of $1.2250.
Fund Balances The following estimated balances will remain at the end of the current fiscal year and are not encumbered with or by a corresponding debt obligation, less estimated funds necessary for operating the district before receipt of the first state aid payment.
Maintenance and Operations Fund Balance(s) $28,000,000 Interest & Sinking Fund Balance(s) $1,000,000

Tax Rate Comparison with other School DistrictsTax Rate Comparison with other School Districts
29

Supplementary Supplementary InformationInformation
30

31
FEDERAL AND OTHER STATE FUNDSFEDERAL AND OTHER STATE FUNDS
FUND CODE FUND DESCRIPTION REVENUE APPROPRIATION
DIFFERENCE SURPLUS (DEFICIT)
211ESEA TITLE I, PART A , IMPROVING BASIC PROGRAMS 7,732,605.13 7,732,605.13 0.00
212
ESEA, TITLE I, PART C EDUCATION OF MIGRATORY CHILDREN 1,505,861.18 1,505,861.18 0.00
215
ESEA TITLE I, PART D, PREVENTION & INTERVENTION PROGRAM 54,826.31 54,826.31 0.00
224 IDEA PART B FORMULA 3,715,564.74 3,715,564.74 0.00
225 IDEA PART B PRESCHOOL 57,336.56 57,336.56 0.00
244 CAREER & TECHNICAL-BASIC 195,105.16 195,105.16 0.00
255
ESEA, TITLE II, PART A-TEACHER PRINCIPAL TRAINING RECRUITMENT 892,554.03 892,554.03 0.00
263
ESEA, TITLE III, PART A, SUBPART I, ENGLISH LANGUAGE ACQUISITION 261,114.11 261,114.11 0.00
265TITLE IV-PART B 21ST CENTURY 1,107,260.00 1,107,260.00 0.00
461 STUDENT ACTIVITY 519,958.04 519,958.04 0.00
618 CAPITAL PROJECTS-BABS 124,569.91 124,569.91 0.00
619CAPITAL PROJECTS-TAX EXEMPT 53,387.09 53,387.09 0.00
TOTAL ALL FUNDS 16,220,142.26 16,220,142.26
32


![HARLINGEN CONSOLIDATED INDEPENDENT … of... · WHITE School Smart 086391 3-10 days ARO [ALT1] Quill Corporation 1 EA $1.64 $1.64 Quill rand 1-1/2” Round Ring inder; View, White,](https://static.fdocuments.in/doc/165x107/5aed6ab47f8b9ab24d9173c3/harlingen-consolidated-independent-ofwhite-school-smart-086391-3-10-days.jpg)