Hardwiring Flow Slides
39
Hardwiring Patient Flow in Your Emergency Department The Highlights (Extended Version) Kirk Jensen, MD, MBA, FACEP Chief Medical Officer, BestPractices Studer Group Medical Director IHI Faculty IHI (Institute for Healthcare Improvement)
Transcript of Hardwiring Flow Slides
Hardwiring Patient Flow in
Your Emergency Department The Highlights
(Extended Version)
Kirk Jensen, MD, MBA, FACEPChief Medical Officer, BestPractices
Studer Group Medical DirectorIHI Faculty IHI (Institute for Healthcare Improvement)
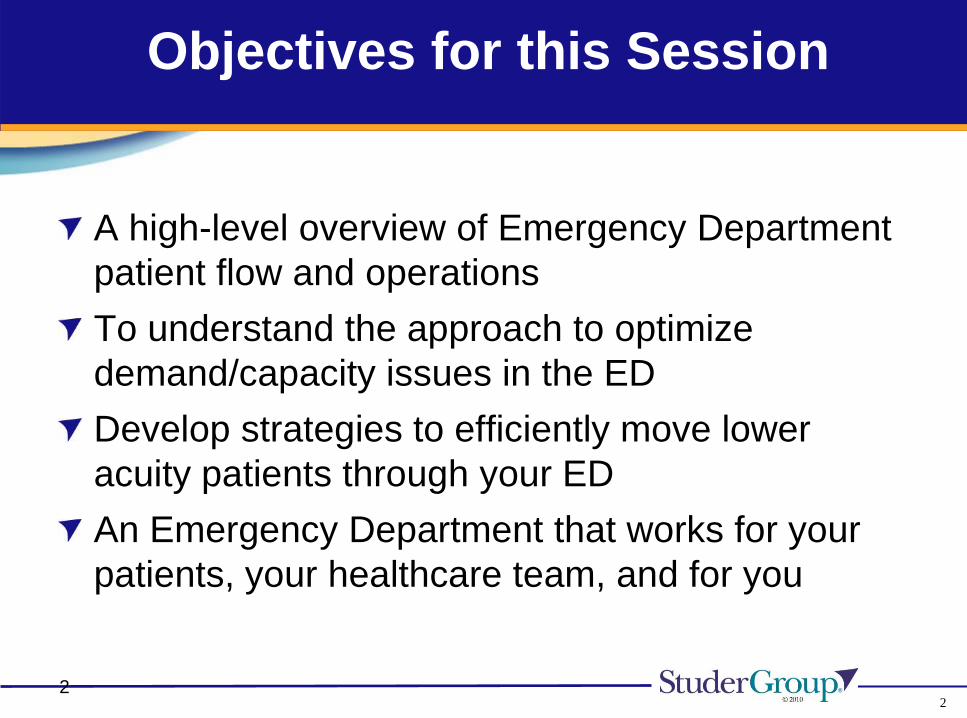
Objectives for this Session
A high-level overview of Emergency Department
patient flow and operations
To understand the approach to optimize
demand/capacity issues in the ED
Develop strategies to efficiently move lower
acuity patients through your ED
An Emergency Department that works for your
patients, your healthcare team, and for you
22
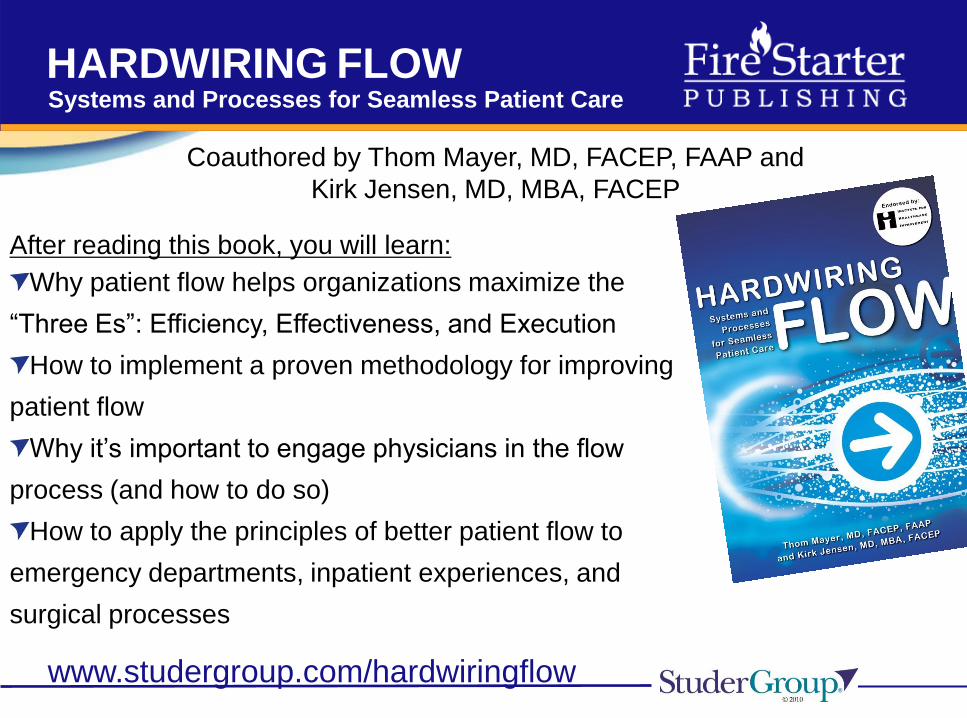
Systems and Processes for Seamless Patient Care
Why patient flow helps organizations maximize the
“Three Es”: Efficiency, Effectiveness, and Execution
How to implement a proven methodology for improving
patient flow
Why it’s important to engage physicians in the flow
process (and how to do so)
How to apply the principles of better patient flow to
emergency departments, inpatient experiences, and
surgical processes
www.studergroup.com/hardwiringflow
HARDWIRING FLOW
Coauthored by Thom Mayer, MD, FACEP, FAAP and
Kirk Jensen, MD, MBA, FACEP
After reading this book, you will learn:
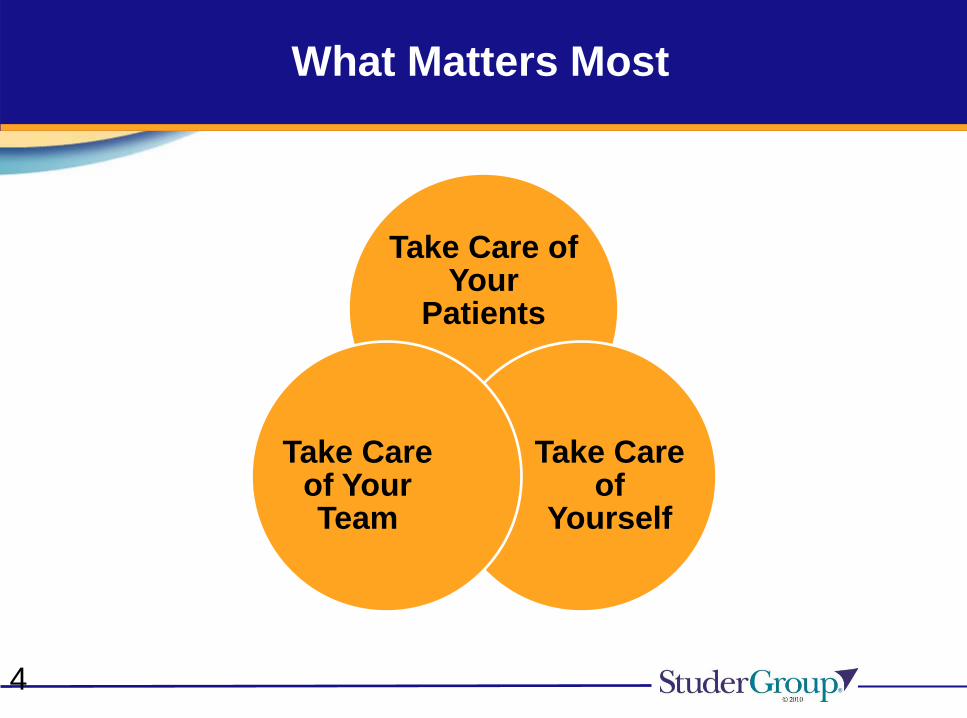
What Matters Most
Take Care of Your
Patients
Take Care of
Yourself
Take Care of Your Team
4

Optimizing Patient Intake and Throughput:
Segmenting Patient Flow Into Incoming
Patient Streams…
Thinking About ED Patient Flow
5
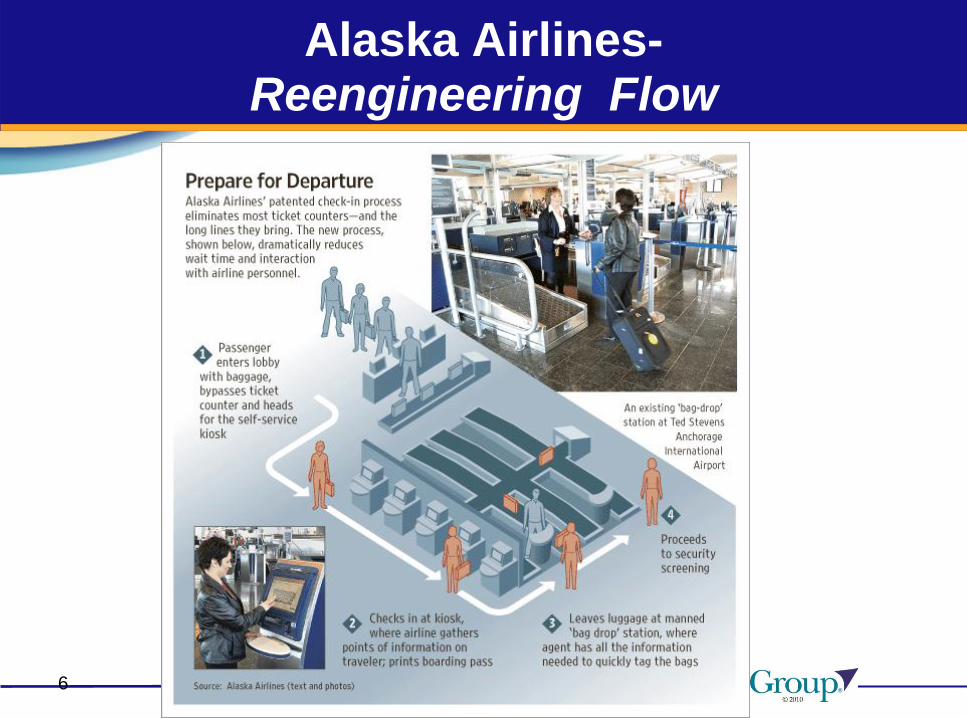
Alaska Airlines-Reengineering Flow
6
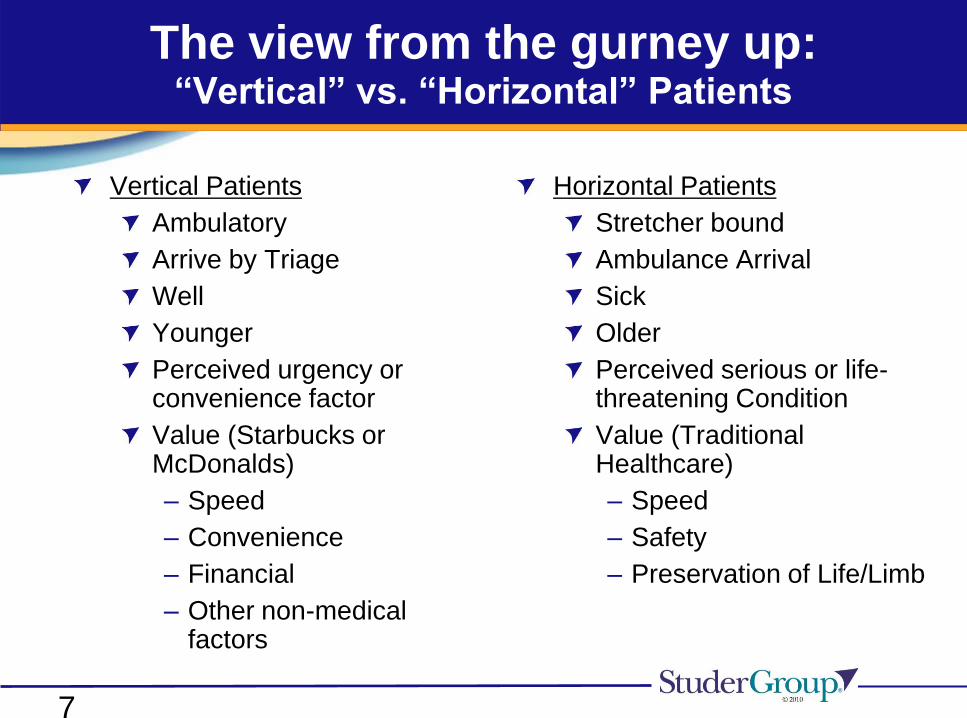
The view from the gurney up:“Vertical” vs. “Horizontal” Patients
Horizontal Patients
Stretcher bound
Ambulance Arrival
Sick
Older
Perceived serious or life-threatening Condition
Value (Traditional Healthcare)
– Speed
– Safety
– Preservation of Life/Limb
Vertical Patients
Ambulatory
Arrive by Triage
Well
Younger
Perceived urgency or convenience factor
Value (Starbucks or McDonalds)
– Speed
– Convenience
– Financial
– Other non-medical factors
7
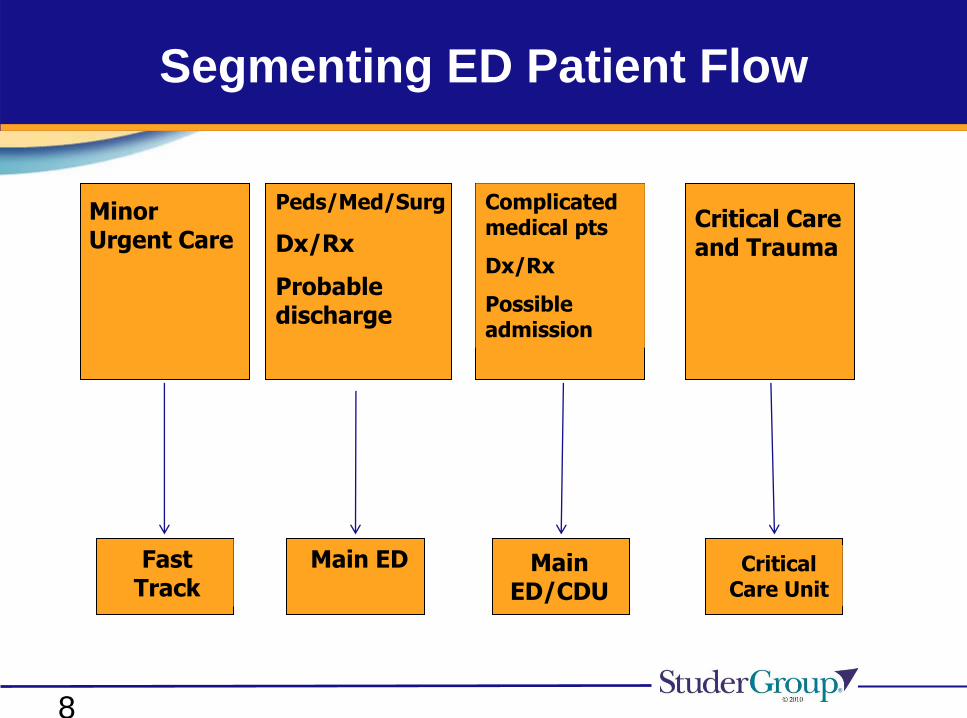
Segmenting ED Patient Flow
Minor Urgent Care
Peds/Med/Surg
Dx/Rx
Probable discharge
Complicated medical pts
Dx/Rx
Possible admission
Critical Care and Trauma
Fast Track
Main ED Main ED/CDU
Critical Care Unit
8
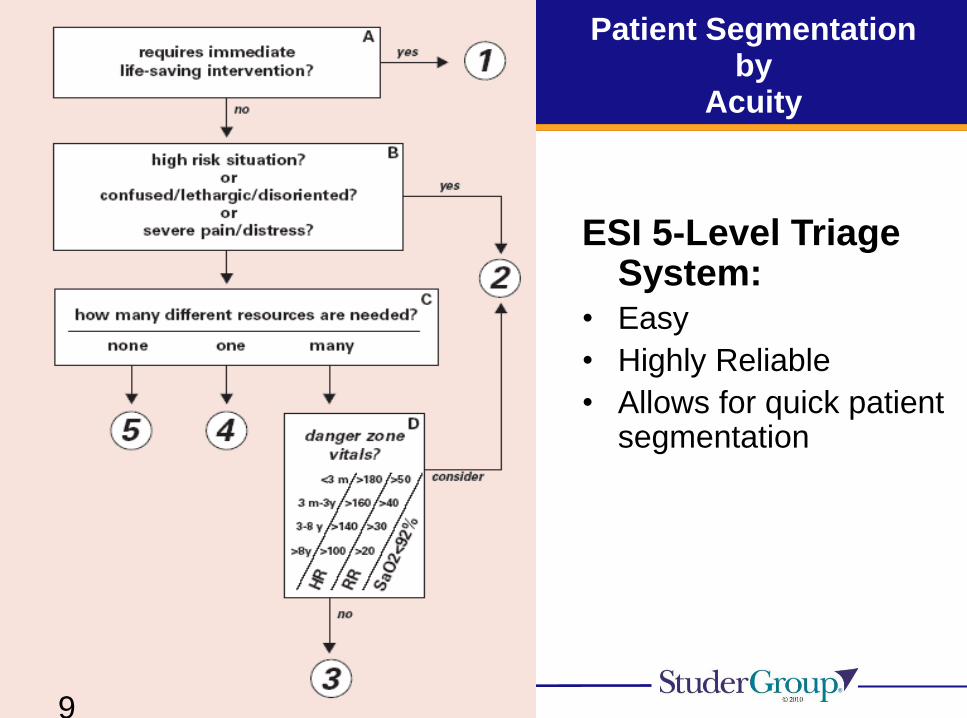
Patient Segmentation by
Acuity
ESI 5-Level Triage System:
• Easy
• Highly Reliable
• Allows for quick patient segmentation
9

Emergency Severity Index (ESI) and Patient Acuity
Degree of Acuity Level of Acuity Patient Condition/Description
High LEVEL 1 EMERGENT Patients in this category require immediate
attention with maximal utilization of resources to
prevent loss of life, limb, or eyesight.
LEVEL 2 URGENT Patients in this category should be seen by a
physician because of high risk for rapid
deterioration, loss of life, limb, or eyesight if
treatment or interventions are delayed.
Medium LEVEL 3 ACUTE Patients who develop a sudden illness or injury
within 24-48 hours. Symptoms and risk factors
for serious disease do not indicate a likelihood
of rapid deterioration in the near future.
Low LEVEL 4 ROUTINE Patients with chronic complaints, medical
maintenance, or medical conditions posing no
threat to loss of life, limb, or eyesight..
LEVEL 5 ROUTINE Patients in this category are currently stable and
require no resources such as labs or x-ray.
10
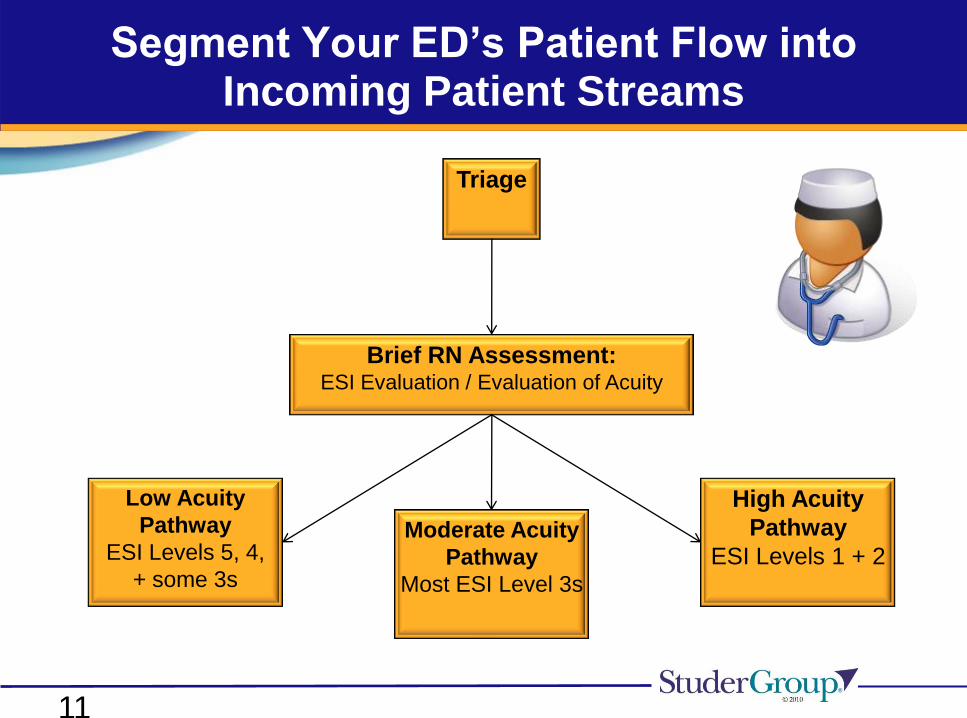
Triage
Brief RN Assessment:ESI Evaluation / Evaluation of Acuity
High Acuity
Pathway
ESI Levels 1 + 2Moderate Acuity
Pathway
Most ESI Level 3s
Low Acuity
Pathway
ESI Levels 5, 4,
+ some 3s
Segment Your ED’s Patient Flow into Incoming Patient Streams
11
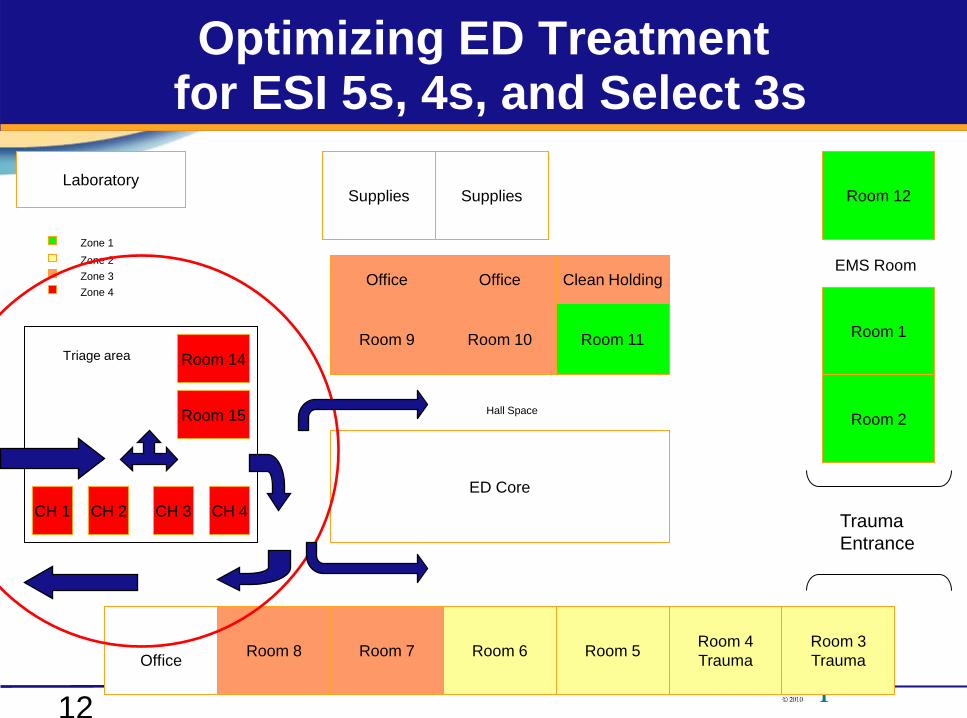
12
Optimizing ED Treatmentfor ESI 5s, 4s, and Select 3s
Room 3
Trauma
Room 4
TraumaRoom 5Room 6Room 7
Office
Trauma
Entrance
Room 2
Room 1
Room 12
EMS Room
Room 11Room 10Room 9
ED Core
SuppliesSupplies
Room 14
Room 15 Hall Space
Room 8
Laboratory
Zone 3
Zone 4
Zone 2
Zone 1
Office Office Clean Holding
CH 1 CH 2 CH 3 CH 4
Triage area
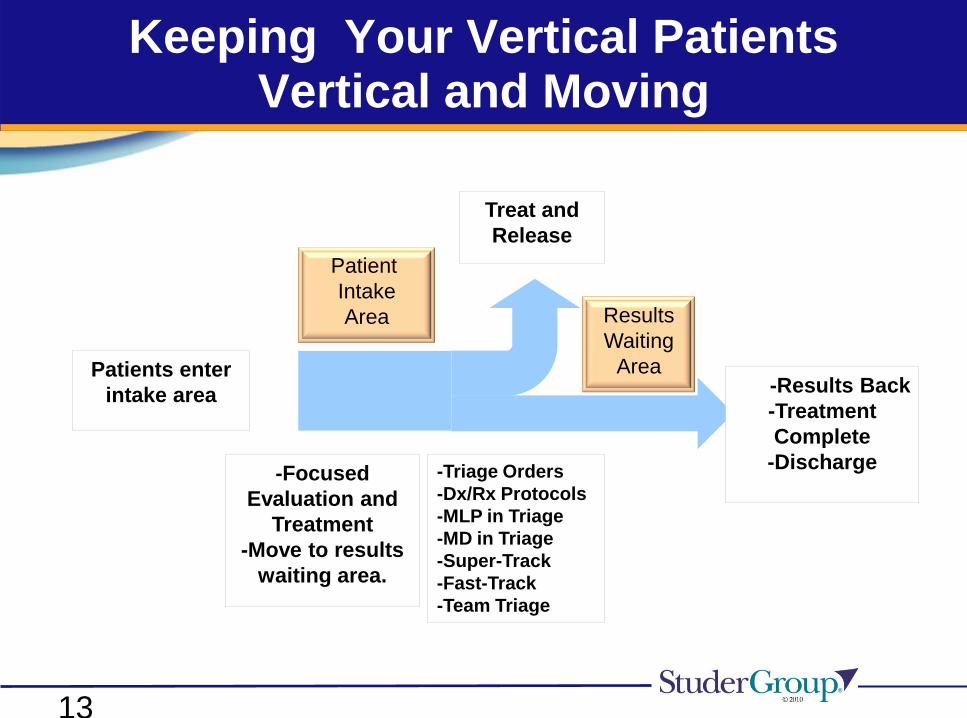
Keeping Your Vertical Patients Vertical and Moving
Patients enter
intake area
Patient
Intake
Area
Treat and
Release
Results
Waiting
Area-Results Back
-Treatment
Complete
-Discharge-Focused
Evaluation and
Treatment
-Move to results
waiting area.
-Triage Orders
-Dx/Rx Protocols
-MLP in Triage
-MD in Triage
-Super-Track
-Fast-Track
-Team Triage
13

Super Track-A Service Line
A “Super” Fast Track located in or near triage for the purpose of promptly treating patients who require very low resource utilization
Treatment
Room 1
Treatment
Room 2
Procedure
Chair
Entrance/Exit
1 MD/PA
1 Nurse
1 Tech
Results
Waiting
14
Courtesy of Jody Crane, MD, MBA

Fast Track-A Service Line
The role of the Fast Track is to segment and serve
those patients that are uncomplicated or relatively
easy to treat. The Fast Track is not a casual add-on
or an overflow unit.
15

Optimizing your Fast Track
Key tactics:
Optimize and maximize patient selection
Match hours of operation to patient demand
Optimize space and capacity
The right clinical mix of providers and productivity
A note of caution-Watch out for:
Inefficient Fast Tracks
Multiple handoffs resulting in queues
Too sick patients in FT tying up beds
16
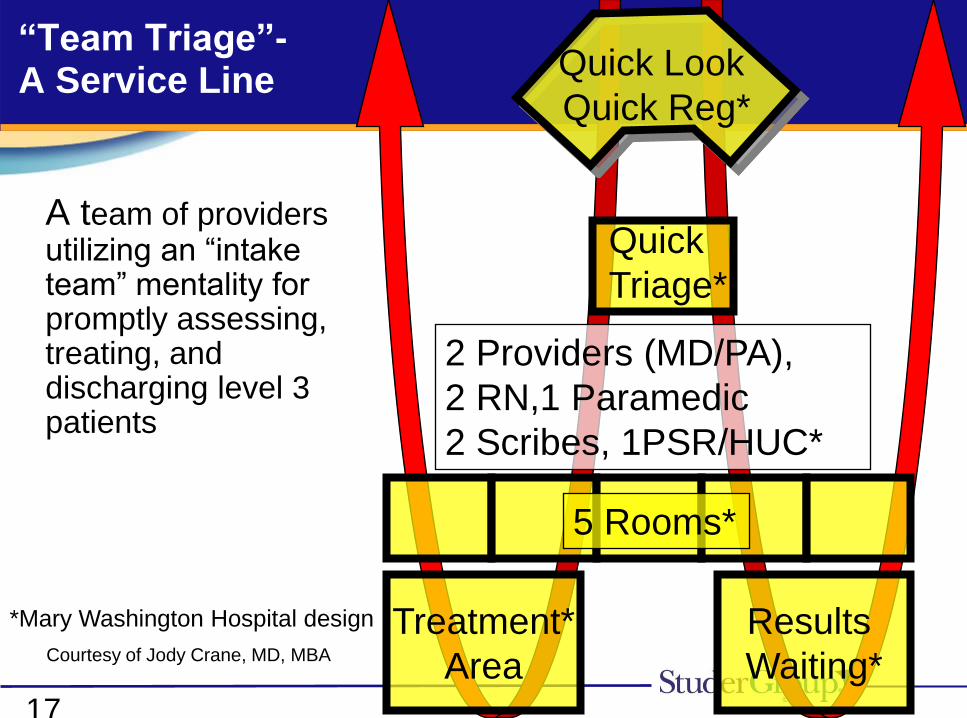
“Team Triage”-A Service Line
A team of providers utilizing an “intake team” mentality for promptly assessing, treating, and discharging level 3 patients
*Mary Washington Hospital design
2 Providers (MD/PA),
2 RN,1 Paramedic
2 Scribes, 1PSR/HUC*
Quick Look
Quick Reg*
Quick
Triage*
Treatment*
Area
5 Rooms*
Results
Waiting*17
Courtesy of Jody Crane, MD, MBA
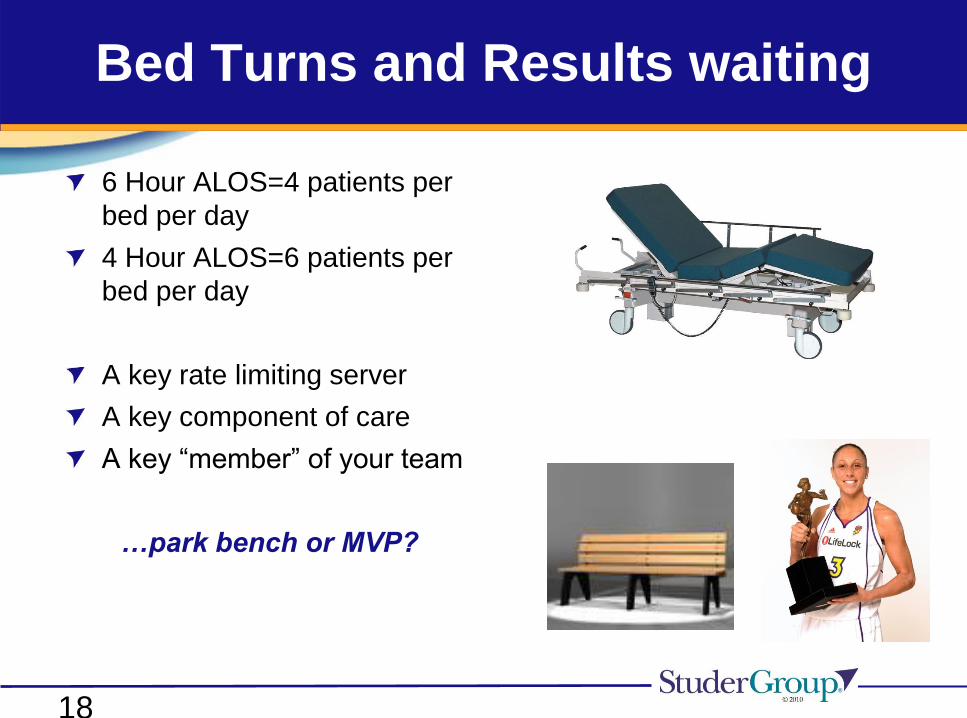
Bed Turns and Results waiting
6 Hour ALOS=4 patients per
bed per day
4 Hour ALOS=6 patients per
bed per day
A key rate limiting server
A key component of care
A key “member” of your team
…park bench or MVP?
18
Optimize ED Bed Capacity andUtilization
Patients should be in a bed only if it is medically
necessary and only for as long as it is medically
necessary…
Optimizing or maximizing bed capacity and bed turns
Does bed capacity match patient demand?
Are patients in bed for the shortest mount of time that is medically
necessary?
Are the patients in beds only those patients that actually need a bed?
Are there boarded patients or outpatients in ED Beds?
19
Focusing on Patient Intake and Segmenting Incoming Patient Flow:
Key Components in your Portfolio of Options
Matching Your Demand:
Triage Orders/Treatment Protocols
Super-Tracking
Fast-Tracking
Midlevel Provider in Triage
MD in Triage
Team Triage (Multi-disciplinary assessment and
treatment team)
20
Getting it Right at the Front End of Your ED-Thinking Operationally
Measure your patient demand by hour and design
(manage) a system to handle it.
Make sure your triage processes enhance flow, not
form a bottleneck; consider redesigning your front end
processes.
Use a simple and reliable system to segment patient
flow.
Design and fully optimize a Fast Track.
Commit to the right staffing mix—and the right staff.
Establish a results waiting area.
Devise a method to track your patients and your
results.
21

Patient Flow (Demand) is Predictable
and
Capacity (Staff, Space, Supplies, and Service…)
is Manageable…*
*i.e. …is a management responsibility

ED Patient Flow is Predictable:Classic ED Patient Flow Curves
Emergency Department Admission Times : 1 Hour Increments
0
50
100
150
200
250
300
350
400
[Trend-Star Data : Q-1 FY04 & 05
Number
Of Pts
FY2004 Q-1 154 149 120 81 83 79 99 153 166 269 253 277 235 260 274 268 294 307 332 352 345 299 278 211
FY2005 Q-1 160 119 107 83 71 76 85 106 156 208 226 230 260 243 260 260 304 286 302 333 287 270 260 198
0:00 1:00 2:00 3:00 4:00 5:00 6:00 7:00 8:00 9:00 10:00 11:00 12:00 13:00 14:00 15:00 16:00 17:00 18:00 19:00 20:00 21:00 22:00 23:00
23
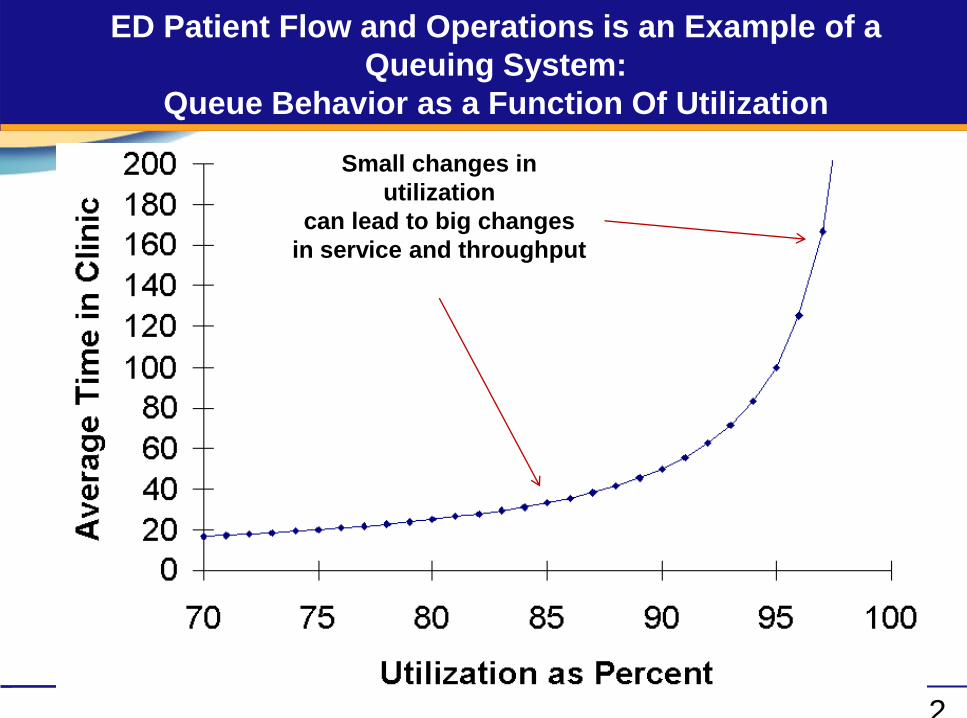
ED Patient Flow and Operations is an Example of a
Queuing System:
Queue Behavior as a Function Of Utilization
Small changes in
utilization
can lead to big changes
in service and throughput
2
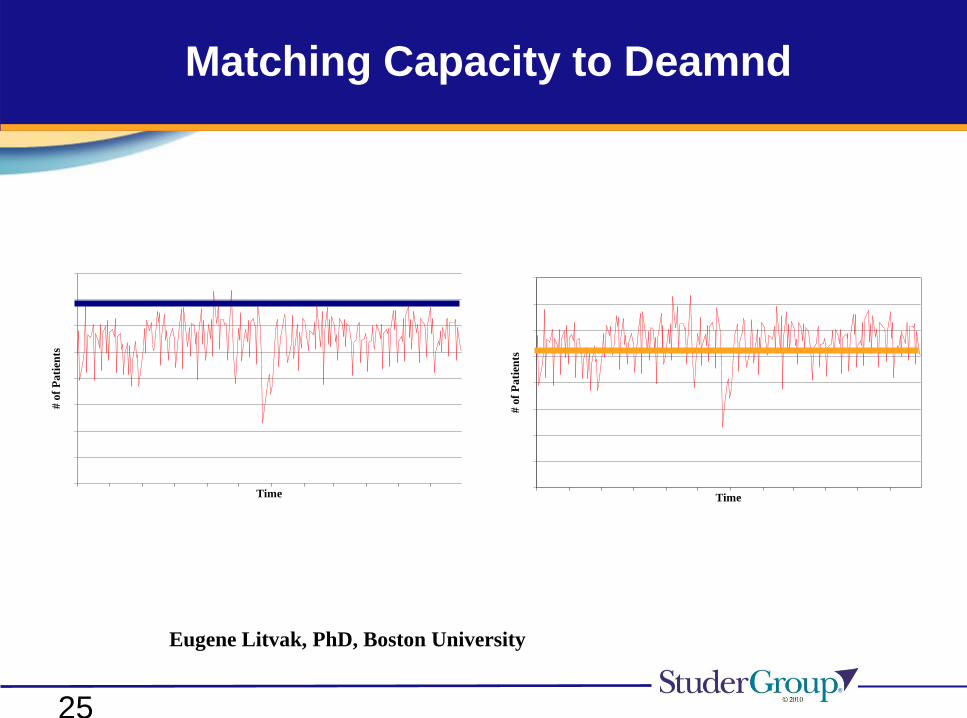
Matching Capacity to Deamnd
Time
# o
f P
ati
ents
Time
# o
f P
ati
ents
Eugene Litvak, PhD, Boston University
25
26
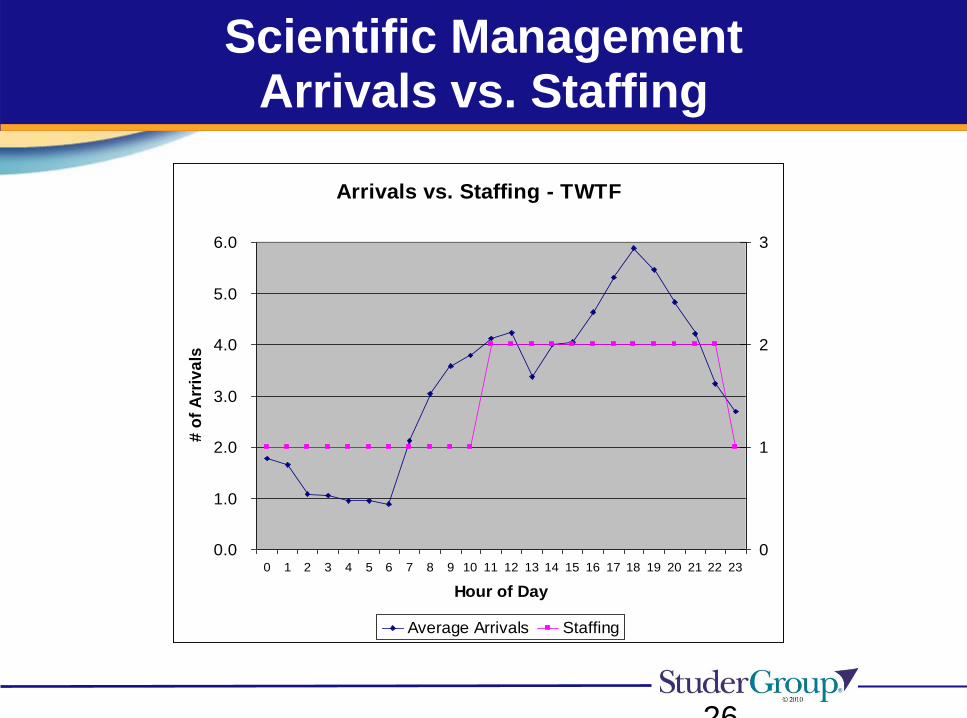
Scientific ManagementArrivals vs. Staffing
Arrivals vs. Staffing - TWTF
0.0
1.0
2.0
3.0
4.0
5.0
6.0
0 1 2 3 4 5 6 7 8 9 10 11 12 13 14 15 16 17 18 19 20 21 22 23
Hour of Day
# o
f A
rriv
als
0
1
2
3
Average Arrivals Staffing

27
Scientific ManagementPlanning for Admissions
0
1
2
3
4
5
1 2 3 4 5 6 7 8 9 10 11 12 13 14 15 16 17 18 19 20 21 22 23 24
Nu
mb
er
of
Ad
mis
sio
ns
Hour of Day
Northwest Community Hospital Admissions
Admissions
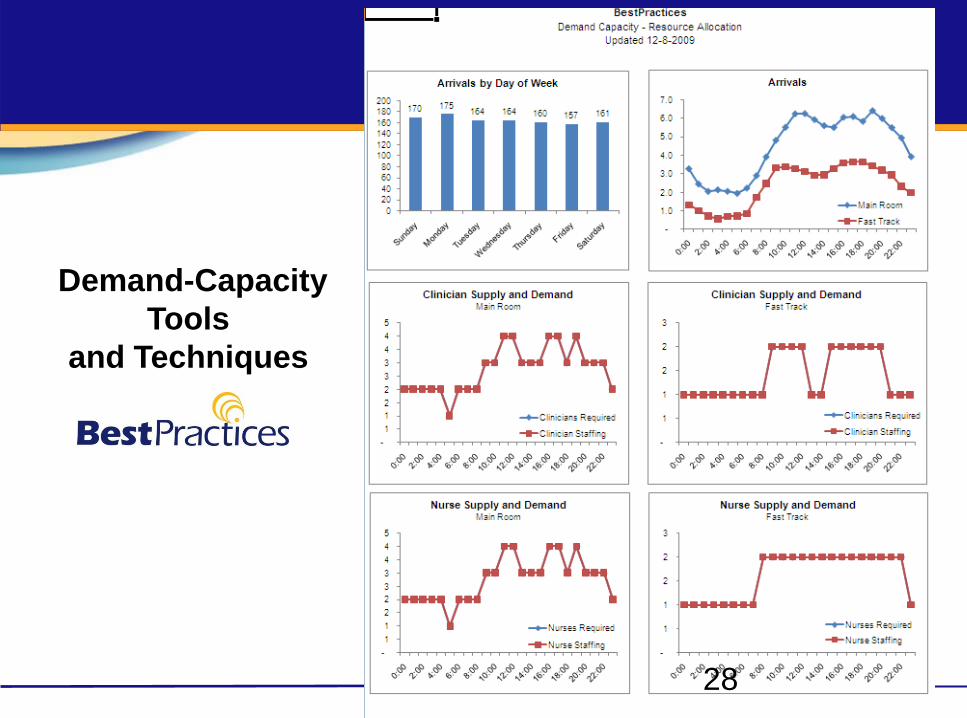
Demand-Capacity
Tools
and Techniques
28
29
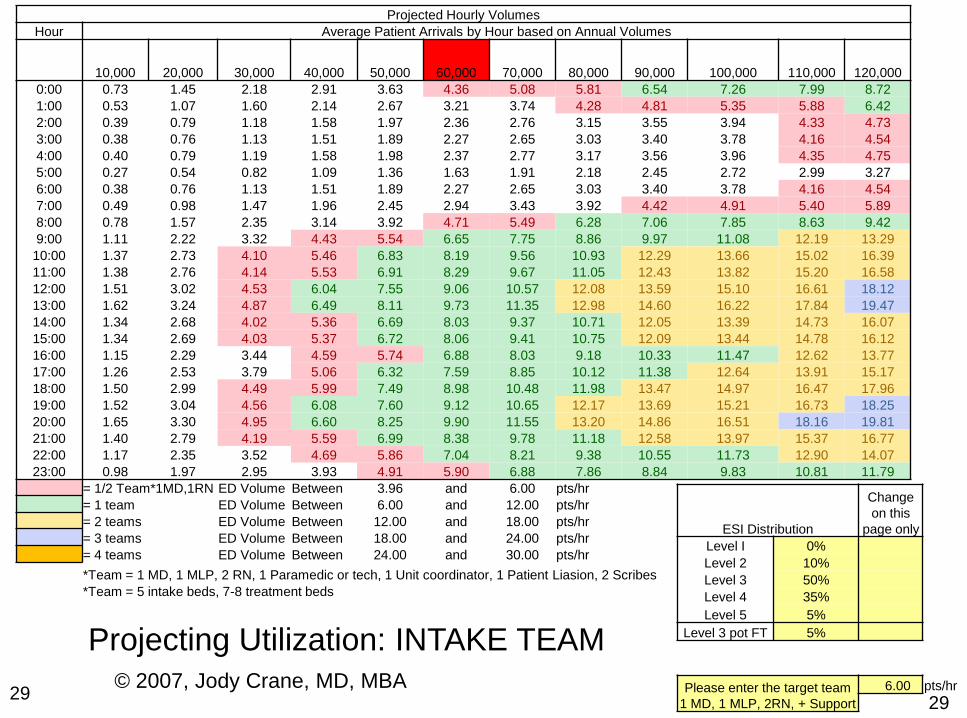
ESI Distribution
Change
on this
page only
Level I 0%
Level 2 10%
Level 3 50%
Level 4 35%
Level 5 5%
Level 3 pot FT 5%
Please enter the target team
1 MD, 1 MLP, 2RN, + Support
6.00 pts/hr
Projected Hourly Volumes
Hour Average Patient Arrivals by Hour based on Annual Volumes
10,000 20,000 30,000 40,000 50,000 60,000 70,000 80,000 90,000 100,000 110,000 120,000
0:00 0.73 1.45 2.18 2.91 3.63 4.36 5.08 5.81 6.54 7.26 7.99 8.72
1:00 0.53 1.07 1.60 2.14 2.67 3.21 3.74 4.28 4.81 5.35 5.88 6.42
2:00 0.39 0.79 1.18 1.58 1.97 2.36 2.76 3.15 3.55 3.94 4.33 4.73
3:00 0.38 0.76 1.13 1.51 1.89 2.27 2.65 3.03 3.40 3.78 4.16 4.54
4:00 0.40 0.79 1.19 1.58 1.98 2.37 2.77 3.17 3.56 3.96 4.35 4.75
5:00 0.27 0.54 0.82 1.09 1.36 1.63 1.91 2.18 2.45 2.72 2.99 3.27
6:00 0.38 0.76 1.13 1.51 1.89 2.27 2.65 3.03 3.40 3.78 4.16 4.54
7:00 0.49 0.98 1.47 1.96 2.45 2.94 3.43 3.92 4.42 4.91 5.40 5.89
8:00 0.78 1.57 2.35 3.14 3.92 4.71 5.49 6.28 7.06 7.85 8.63 9.42
9:00 1.11 2.22 3.32 4.43 5.54 6.65 7.75 8.86 9.97 11.08 12.19 13.29
10:00 1.37 2.73 4.10 5.46 6.83 8.19 9.56 10.93 12.29 13.66 15.02 16.39
11:00 1.38 2.76 4.14 5.53 6.91 8.29 9.67 11.05 12.43 13.82 15.20 16.58
12:00 1.51 3.02 4.53 6.04 7.55 9.06 10.57 12.08 13.59 15.10 16.61 18.12
13:00 1.62 3.24 4.87 6.49 8.11 9.73 11.35 12.98 14.60 16.22 17.84 19.47
14:00 1.34 2.68 4.02 5.36 6.69 8.03 9.37 10.71 12.05 13.39 14.73 16.07
15:00 1.34 2.69 4.03 5.37 6.72 8.06 9.41 10.75 12.09 13.44 14.78 16.12
16:00 1.15 2.29 3.44 4.59 5.74 6.88 8.03 9.18 10.33 11.47 12.62 13.77
17:00 1.26 2.53 3.79 5.06 6.32 7.59 8.85 10.12 11.38 12.64 13.91 15.17
18:00 1.50 2.99 4.49 5.99 7.49 8.98 10.48 11.98 13.47 14.97 16.47 17.96
19:00 1.52 3.04 4.56 6.08 7.60 9.12 10.65 12.17 13.69 15.21 16.73 18.25
20:00 1.65 3.30 4.95 6.60 8.25 9.90 11.55 13.20 14.86 16.51 18.16 19.81
21:00 1.40 2.79 4.19 5.59 6.99 8.38 9.78 11.18 12.58 13.97 15.37 16.77
22:00 1.17 2.35 3.52 4.69 5.86 7.04 8.21 9.38 10.55 11.73 12.90 14.07
23:00 0.98 1.97 2.95 3.93 4.91 5.90 6.88 7.86 8.84 9.83 10.81 11.79
= 1/2 Team*1MD,1RN ED Volume Between 3.96 and 6.00 pts/hr
= 1 team ED Volume Between 6.00 and 12.00 pts/hr
= 2 teams ED Volume Between 12.00 and 18.00 pts/hr
= 3 teams ED Volume Between 18.00 and 24.00 pts/hr
= 4 teams ED Volume Between 24.00 and 30.00 pts/hr
*Team = 1 MD, 1 MLP, 2 RN, 1 Paramedic or tech, 1 Unit coordinator, 1 Patient Liasion, 2 Scribes
*Team = 5 intake beds, 7-8 treatment beds
© 2007, Jody Crane, MD, MBA29
Projecting Utilization: INTAKE TEAM
Hardwiring ED Patient Flow
Going Deeper…
Critical ED Patient Flow Concepts
30
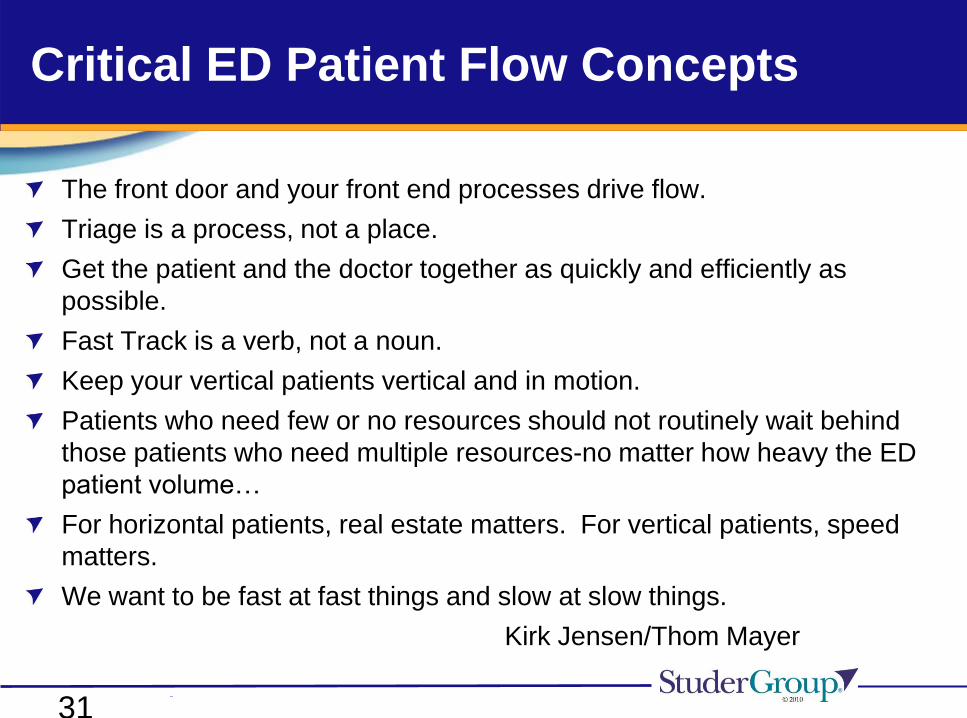
Critical ED Patient Flow Concepts
The front door and your front end processes drive flow.
Triage is a process, not a place.
Get the patient and the doctor together as quickly and efficiently as
possible.
Fast Track is a verb, not a noun.
Keep your vertical patients vertical and in motion.
Patients who need few or no resources should not routinely wait behind
those patients who need multiple resources-no matter how heavy the ED
patient volume…
For horizontal patients, real estate matters. For vertical patients, speed
matters.
We want to be fast at fast things and slow at slow things.
Kirk Jensen/Thom Mayer
–
31
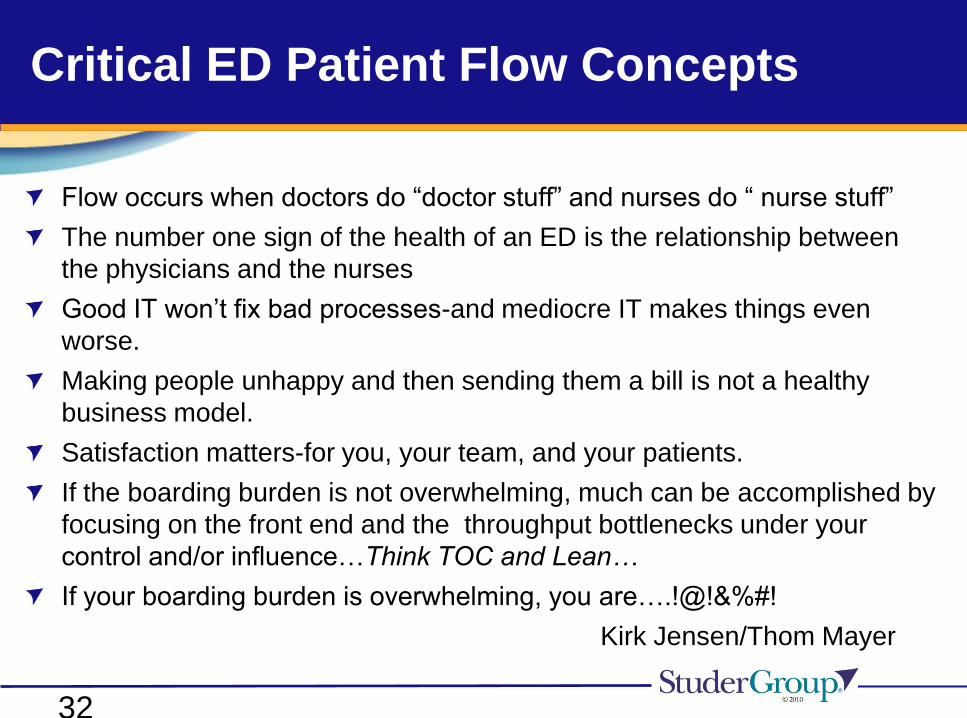
Critical ED Patient Flow Concepts
Flow occurs when doctors do “doctor stuff” and nurses do “ nurse stuff”
The number one sign of the health of an ED is the relationship between
the physicians and the nurses
Good IT won’t fix bad processes-and mediocre IT makes things even
worse.
Making people unhappy and then sending them a bill is not a healthy
business model.
Satisfaction matters-for you, your team, and your patients.
If the boarding burden is not overwhelming, much can be accomplished by
focusing on the front end and the throughput bottlenecks under your
control and/or influence…Think TOC and Lean…
If your boarding burden is overwhelming, you are….!@!&%#!
Kirk Jensen/Thom Mayer
32
Summary
A method to segment patients on intake is important for
efficient ED patient flow
Processes, people and places to care for the patient
demand in each segment need to be designed and
implemented
Processes, people and places need to work as an
integrated system to create an entire ED that works for
patients and staff
Non-urgent patients need to be kept vertical and moving

Your
Emergency Department
is the
ultimate reality show…
34

Take a look at your ED:
-Get passionate…
-Get serious…
-Get it done…
35
References
36
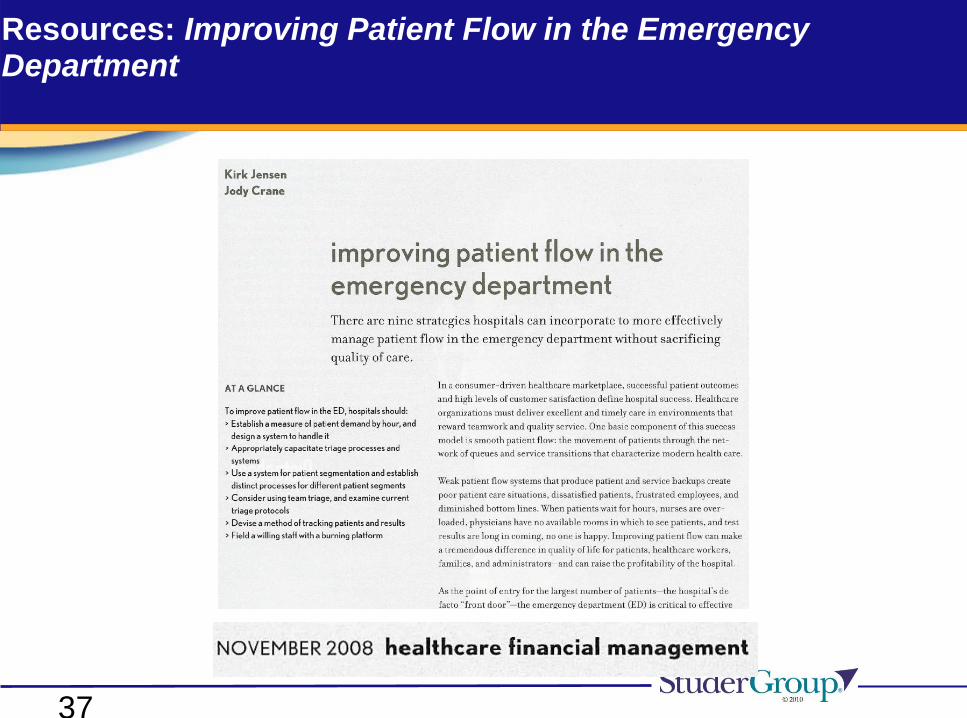
Resources: Improving Patient Flow in the Emergency Department
37
References
Fitzsimmons J., and M. Fitzsimmons. 2006. Service Management: Operations, Strategy, Information
Technology. 5th ed. Boston: McGraw-Hill.
Goldratt, E. 1986. The Goal. Great Barrington: North River Press.
Institute for Healthcare Improvement (IHI). Optimizing Patient Flow: Moving Patients Smoothly
Through Acute Care Settings. Innovation Series 2003. “Bursting at the Seams: 2004. Improving
Patient Flow to Help America’s Emergency Departments.” Urgent Matters Learning Network
Whitepaper. www.gwhealthpolicy.org accessed September 17, 2005.
Building the Clockwork ED: Best Practices for Eliminating Bottlenecks and Delays in the ED. HWorks.
An Advisory Board Company. Washington D.C. 2000.
Bazarian J. J., and S. M. Schneider, et al. Do Admitted Patients Held in the Emergency Department
Impair Throughput of Treat and Release Patients? Acad Emerg Med. 1996; 3(12): 1113-1118.
Full Capacity Protocol. www.viccellio.com/overcrowding.htm
Kelley, M.A. The Hospitalist: A New Medical Specialty. Ann Intern Med. 1999; 130:373-375.
Holland, L., L. Smith, et al. 2005. “Reducing Laboratory Turnaround Time Outliers Can Reduce
Emergency Department Patient Length of Stay.” Am J Clin Pathol 125 (5): 672-674.
Husk, G., and D. Waxman. 2004. “Using Data from Hospital Information Systems to Improve
Emergency Department Care.” SAEM 11(11): 1237-1244.
Christensen, Grossman, and Hwang,-The Innovator’s Prescription, 2009
38

References:The Psychology of Waiting
Maister, D. (1985). The Psychology of Waiting Lines. In J. A. Czepiel, M. R. Solomon
& C. F. Surprenant (Eds.), The Service encounter: managing employee/customer
interaction in service businesses. Lexington, MA: D. C. Heath and Company,
Lexington Books.
Norman, D. A. (2008) -- The Psychology of Waiting Lines The PDF version is an
excerpt from a draft chapter entitled "Sociable Design" for a new book-
www.jnd.org/dn.mss/the_psychology_of_waiting_lines
Norman, D. A. (2009). Designing waits that work. MIT Sloan Management Review,
50(4), 23-28.
Christine M. Meade, PHD, Julie Kennedy, RN, BSN, TNS, and Jay Kaplan, MD,
FACEP-The Studer Group- JEM 2008
Fitzsimmons J., and M. Fitzsimmons. 2006. Service Management: Operations,
Strategy, Information Technology. 5th ed. Boston: McGraw-Hill.
39