Harald Grethe a*, Stephan Nolte and Stefan Tangermann
25
Journal of International Agricultural Trade and Development Volume 1 Number 2, pp. 109-133 © 2005 Nova Science Publishers, Inc. EVOLUTION, CURRENT STATE AND FUTURE OF EU TRADE PREFERENCES FOR AGRICULTURAL PRODUCTS FROM NORTH-AFRICAN AND NEAR-EAST COUNTRIES Harald Grethe a * , Stephan Nolte a and Stefan Tangermann b a Institute of Agricultural Economics and Social Sciences, Humboldt-University of Berlin, Germany; b Institute of Agricultural Economics, University of Göttingen (after having contributed to this study, Tangermann joined the OECD, Paris) ABSTRACT The EU recently completed negotiating a series of Association Agreements with Mediterranean countries. Trade preferences for agricultural goods granted under these Agreements, as well as under former arrangements, are analyzed by calculating the value of preference margins at several stages in the evolution of preferences. The total value of preference margins for all countries covered was about €130 million under the agreements of the mid-1970s and increased by 48 per cent until 1995; by 2000 this value declined by about 14 per cent due to reduced EU MFN tariffs. The extended preferences under the new Agreements more than compensate for this decline and will result in a total value of preference margins of €226 million once all Agreements have entered into force. Key words: preferential trade, preference margin, Mediterranean countries, Euro- Mediterranean Agreements, preference erosion. 1. INTRODUCTION Since its foundation, the European Union (EU) has maintained special political and economic relations with the countries of the Mediterranean Basin. 16 Arrangements for
Transcript of Harald Grethe a*, Stephan Nolte and Stefan Tangermann

Journal of International Agricultural Trade and Development Volume 1 Number 2, pp. 109-133 © 2005 Nova Science Publishers, Inc.
EVOLUTION, CURRENT STATE AND FUTURE OF EU TRADE PREFERENCES FOR AGRICULTURAL
PRODUCTS FROM NORTH-AFRICAN AND NEAR-EAST COUNTRIES
Harald Grethea*, Stephan Noltea and Stefan Tangermannb
aInstitute of Agricultural Economics and Social Sciences, Humboldt-University of Berlin, Germany;
bInstitute of Agricultural Economics, University of Göttingen (after having contributed to this study, Tangermann joined the OECD, Paris)
ABSTRACT The EU recently completed negotiating a series of Association Agreements with Mediterranean countries. Trade preferences for agricultural goods granted under these Agreements, as well as under former arrangements, are analyzed by calculating the value of preference margins at several stages in the evolution of preferences. The total value of preference margins for all countries covered was about €130 million under the agreements of the mid-1970s and increased by 48 per cent until 1995; by 2000 this value declined by about 14 per cent due to reduced EU MFN tariffs. The extended preferences under the new Agreements more than compensate for this decline and will result in a total value of preference margins of €226 million once all Agreements have entered into force.
Key words: preferential trade, preference margin, Mediterranean countries, Euro- Mediterranean Agreements, preference erosion.
1. INTRODUCTION
Since its foundation, the European Union (EU) has maintained special political and
economic relations with the countries of the Mediterranean Basin.16 Arrangements for
* Department of International Agricultural Trade and Development; Institute of Agricultural Economics and
Social Sciences; Humboldt University of Berlin; Luisenstr. 56; D-10099 Berlin, Germany; Phone: (+49) 30 2093 6787, Fax. (+49) 30 2093 6301; e-mail: [email protected].
16 For simplicity, the term European Union is used throughout, even when referring to the earlier entities the European Economic Community (EEC) or European Communities (EC).

Harald Grethe, Stephan Nolte and Stefan Tangermann 110
preferential trade have been core elements of various Agreements. After an "explosion in the number of the European Community’s Mediterranean trade agreements between 1969 and 1972" (Pomfret, p. 20), the EU began to harmonize the various bilateral agreements in a framework called the "Global Mediterranean Policy". This process resulted in a series of Cooperation Agreements with the Maghreb and Mashrak countries of Morocco, Algeria, Tunisia, Egypt, Jordan, Lebanon and Syria and a Trade Agreement with Israel, all concluded in the years 1975 to 1978. Hereafter the term "Mediterranean Countries" (MCs) is used to refer to this specific group of countries.17 The EU agreements with the MCs were amended by Additional Protocols from 1987 to 1988, which included substantially extended trade preferences for agricultural products. In the 1990s, the EU began to negotiate a series of Euro-Mediterranean Agreements (EMAs), with all MCs as well as an interim agreement with the Palestinian Authority. Although not all of the agreements are yet in force, the EMAs will eventually replace all former arrangements in the area of trade. In addition, Tunisia, Morocco, Israel and the Palestinian Authority have negotiated an amendment of the agricultural protocols in the EMAs to further liberalize trade with the EU.
The establishment of EMA is part of the "Barcelona Process", which was launched in November 1995 and aims at "political stability and security" (political chapter), "shared prosperity" (economic chapter), and "understanding between cultures and exchanges between civil societies" (social chapter) (European Commission 2005). The implementation of the political and cultural dimensions of the EMA and their contribution to achieving the aims of democratization and stabilization of the MC region are widely assessed as rather weak for a variety of reasons (Jünemann, Attina). As far as economic aspects are concerned, the core element of the new agreements is the creation of bilateral free trade areas between each of the MCs and the EU. Tunisia is the first country with which an EMA was concluded in 1995, and the time schedule foresees a full opening of Tunisian markets for industrial products from the EU in 2008, although domestic pressure for a postponement is increasing (Riess et al.). Although agricultural goods are exempted from the establishment of bilateral free trade areas, they are subject to preferential trade rules, as under the former agreements. This exclusion of agriculture from future bilateral free trade areas reflects interests at both sides. The EU considers many of its typical Mediterranean products like olive oil, many fruits and vegetables, wine, and tobacco as "sensitive", and does not want to open its markets fully for competition from the MCs. The MCs, on the other hand, often extend greater protection to
* Department of International Agricultural Trade and Development; Institute of Agricultural Economics and
Social Sciences; Humboldt University of Berlin; Luisenstr. 56; D-10099 Berlin, Germany; Phone: (+49) 30 2093 6787, Fax. (+49) 30 2093 6301; e-mail: [email protected].
16 For simplicity, the term European Union is used throughout, even when referring to the earlier entities the European Economic Community (EEC) or European Communities (EC).
17 The Palestinian territories are also included in this group and the term "country" used in this article also refers to them. For simplicity, the term "Palestine" is used in some cases to refer to the Palestinian Authority or the Palestinian territories. EU linkages with various other groups of countries in the Mediterranean Basin developed in various ways. Some southern European countries became, after a period of preparatory Association Agreements, EU members in 1981 (Greece), 1986 (Portugal and Spain), and 2004 (Cyprus and Malta). The EU and Turkey currently have an Association Agreement, and accession negotiations are scheduled to start in October 2005. A Cooperation Agreement was negotiated with Yugoslavia in 1980. After its dissolution, Slovenia became a member of the EU in 2004 and Croatia has accession candidate status. Macedonia and the EU have a Stabilization and Association Agreement which was concluded in 2000, the trade related part of which entered into force in 2001. No trade arrangements were negotiated with Libya and Albania, although Libya has observer status in the process of Euro-Mediterranean integration since 1999 (European Commission, 2005).

Evolution, Current State and Future of EU Trade Preferences… 111
temperate zone products such as cereals, beef and dairy products than does the EU and would therefore experience decreasing prices for these products with a free trade area in agriculture (Radwan and Reiffers, Garcia-Alvarez-Coque).
This article reviews the evolution, structure and significance of agricultural trade preferences granted by the EU to the Mediterranean countries from the Cooperation Agreements of the 1970s up to the newly negotiated EMA. It provides an account of how these preferences have developed over time, in qualitative and quantitative terms. The quantitative account is based on estimates of how product coverage and the value of preference margins have evolved under the various arrangements. Finally, the future of EU agricultural trade preferences for the MCs is discussed.
2. AGRICULTURAL TRADE BETWEEN MEDITERRANEAN COUNTRIES AND THE EU
Before dealing with agricultural trade between the MCs and the EU, it is revealing to take
a short look at market size of the EU and the MCs as well as Croatia, Romania, Bulgaria and Turkey, which currently have the status of Accession Candidates.
Table 2.1. Market Size: EU, Accession Candidates
and MCs, Annual Average 2001-2003a
EU-25 Accession Candidates Mediterranean Countries total % of EU total % of EU
Population, million 453 104 23.0% 174 38.3% GDP, billion € 9,509 278 2.9% 375 3.9% GDP/capita, € 20,980 2,667 9.0% 2,163 7.3% GDPagriculture, billion € 204 35 17.3% 41 20.2%
a Agricultural share in GDP available only for 2001-2002 in most regions, for 2001 in Cyprus, for 2002 in Malta and Israel; GDP available only for 2001-2002 in Israel.
Sources: World Bank (2005a, 2005b), International Monetary Fund, Central Bureau of Statistics, European Central Bank (2004), own calculations
Table 2.1 shows that population of the MCs is as much as 38 per cent of that of the EU, whereas overall GDP amounts to only 3.9 per cent of the EU’s GDP. The MCs’ agricultural sector, however, is relatively large if compared to the EU, at about 20 per cent of the size of EU agriculture.
The EU and the MCs are important trading partners for each other, although for reasons of size, the EU is a more important trading partner for the MCs than the MCs are for the EU (Table 2.2). From 2001-2003 roughly half of total exports and imports of the MCs were traded with the EU. About two-thirds of total MC agricultural exports went to the EU and about one-third of total agricultural imports came from the EU.18 Overall, the MCs had a trade
18 The term "agricultural products" is defined throughout this article as all products in CN Chapters 1 to 24, plus
CN headings 29.05.45.00, 33.01, 33.02.10, 35.01-02, 35.03.00.10, 35.05.10.10, 35.07, 38.24, 40.01, 41.01-03, 41.10, 43.01, 44.01-04, 44.06-07, 44.09, 45.01-02, 50.01-03, 51.01-05, 52.01-03 and 53.01-05. The figures for agricultural trade with the world in Table 2.1, however, are taken from FAO statistics according to the SITC classification (total agricultural products and fishery products) and therefore deviate slightly from the definition given above.
Harald Grethe, Stephan Nolte and Stefan Tangermann 112
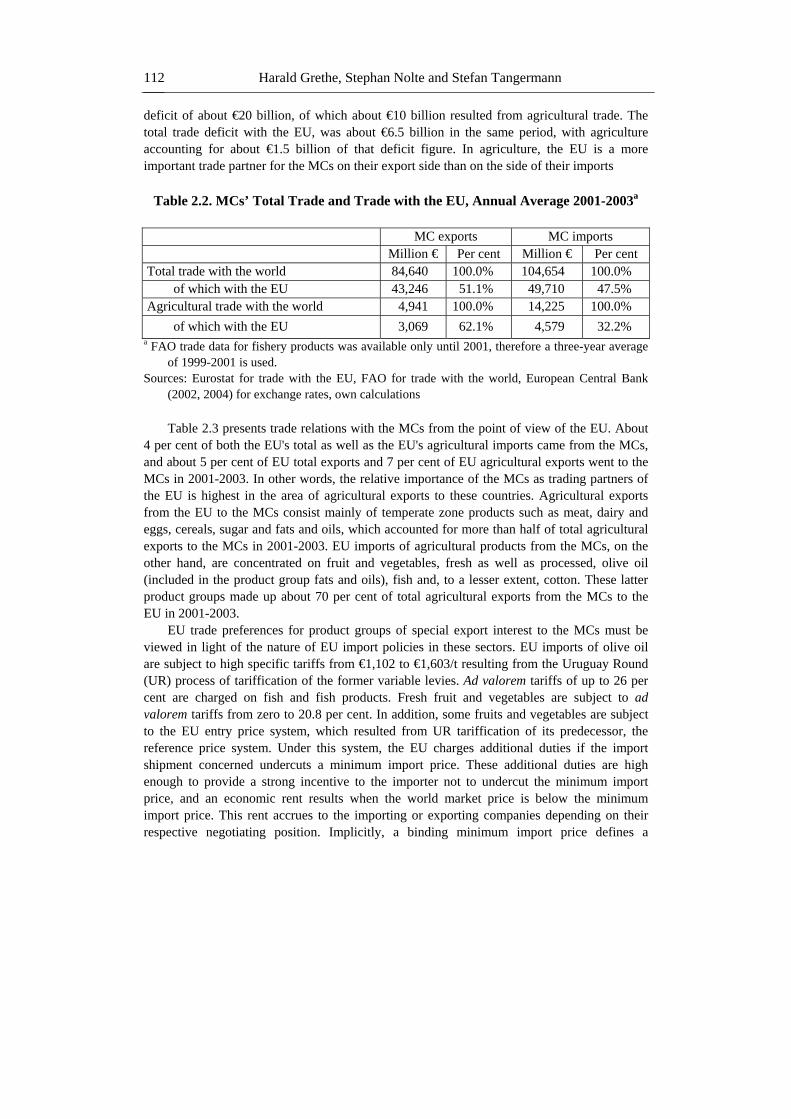
deficit of about €20 billion, of which about €10 billion resulted from agricultural trade. The total trade deficit with the EU, was about €6.5 billion in the same period, with agriculture accounting for about €1.5 billion of that deficit figure. In agriculture, the EU is a more important trade partner for the MCs on their export side than on the side of their imports
Table 2.2. MCs’ Total Trade and Trade with the EU, Annual Average 2001-2003a
MC exports MC imports Million € Per cent Million € Per cent
Total trade with the world 84,640 100.0% 104,654 100.0% of which with the EU 43,246 51.1% 49,710 47.5%
Agricultural trade with the world 4,941 100.0% 14,225 100.0% of which with the EU 3,069 62.1% 4,579 32.2%
a FAO trade data for fishery products was available only until 2001, therefore a three-year average of 1999-2001 is used.
Sources: Eurostat for trade with the EU, FAO for trade with the world, European Central Bank (2002, 2004) for exchange rates, own calculations Table 2.3 presents trade relations with the MCs from the point of view of the EU. About
4 per cent of both the EU's total as well as the EU's agricultural imports came from the MCs, and about 5 per cent of EU total exports and 7 per cent of EU agricultural exports went to the MCs in 2001-2003. In other words, the relative importance of the MCs as trading partners of the EU is highest in the area of agricultural exports to these countries. Agricultural exports from the EU to the MCs consist mainly of temperate zone products such as meat, dairy and eggs, cereals, sugar and fats and oils, which accounted for more than half of total agricultural exports to the MCs in 2001-2003. EU imports of agricultural products from the MCs, on the other hand, are concentrated on fruit and vegetables, fresh as well as processed, olive oil (included in the product group fats and oils), fish and, to a lesser extent, cotton. These latter product groups made up about 70 per cent of total agricultural exports from the MCs to the EU in 2001-2003.
EU trade preferences for product groups of special export interest to the MCs must be viewed in light of the nature of EU import policies in these sectors. EU imports of olive oil are subject to high specific tariffs from €1,102 to €1,603/t resulting from the Uruguay Round (UR) process of tariffication of the former variable levies. Ad valorem tariffs of up to 26 per cent are charged on fish and fish products. Fresh fruit and vegetables are subject to ad valorem tariffs from zero to 20.8 per cent. In addition, some fruits and vegetables are subject to the EU entry price system, which resulted from UR tariffication of its predecessor, the reference price system. Under this system, the EU charges additional duties if the import shipment concerned undercuts a minimum import price. These additional duties are high enough to provide a strong incentive to the importer not to undercut the minimum import price, and an economic rent results when the world market price is below the minimum import price. This rent accrues to the importing or exporting companies depending on their respective negotiating position. Implicitly, a binding minimum import price defines a

Evolution, Current State and Future of EU Trade Preferences… 113
maximum import quantity and therefore has an effect similar to that of a binding voluntary export restraint (Grethe and Tangermann 1999b). Any shift in export supply curves only affects the size of the economic rent which results from these policies, not the quantity of exports.
For processed fruits and vegetables, the EU applies a mixture of specific and ad valorem tariffs and the entry price system only applies in the case of grape juice. For typical temperate zone products, the EU applies high tariffs which are prohibitive in many cases. These products, however, are not of export interest to the MCs, with very few exceptions (e. g. rice from Egypt).
Table 2.3. EU Total Trade and Trade with the MCs, Annual Average 2001-2003
EU imports (mio. €) EU exports (mio. €) Total trade with the world 1,002,180 100.0% 986,545 100.0% of which with the MCs 43,246 4.3% 49,710 5.0% Agricultural trade with the world 83,526 100.0% 66,329 100.0% of which with the MCs 3,068 3.7% 4,579 6.9% Total agricultural trade with the MCs (100%) (100%)
of which: Meat and live animals 0.5% 3.2% Fish 17.8% 1.2% Dairy and eggs 0.1% 13.1% Flowers and live plants 5.6% 0.7% Vegetables 18.2% 3.7% Fruit 18.6% 1.1% Cereals and milling ind. prod. 0.6% 19.1% Oilseeds and oleaginous fruit 1.1% 0.2% Fats and oils 3.6% 4.8% Preparations of meat and fish 6.7% 0.9% Sugars 2.0% 11.3% Preparations of cereals 0.6% 4.3% Prep. of vegetables and fruits 5.4% 1.5% Tobacco 0.1% 2.8% Cotton 4.8% 0.7% Other 14.3% 31.4%
Sources: Eurostat, own calculations
3. QUANTITATIVE INDICATORS OF THE EVOLUTION OF PREFERENTIAL TREATMENT
Various indicators can provide an impression of the changing nature and significance
of the agricultural preferences which the EU has granted to the MCs under the varying arrangements that followed each other in historical sequence. None of these indicators is perfect in the sense of yielding a precise analysis of the economic implications of preferential treatment, however they can do a reasonable job of providing a quantified historical account.

Harald Grethe, Stephan Nolte and Stefan Tangermann 114
One such indicator is product coverage (PC), i.e. the share of products covered by preferences in total agricultural exports from the respective MC to the EU, defined as
PC=Exp
A,EU/ExtA,EU (1)
In this definition, A,EU
pEx is the value of exports from MC A to the EU of all agricultural
products receiving preferences granted by the EU, irrespective of the magnitude of the
preference. A,EUtEx is the value of all agricultural exports from country A to the EU, i.e.
including exports of products that do not qualify for preferential treatment.19 Product coverage will thus be between 0 and 1. It indicates the extent to which the EU was prepared to structure its preferences such that products of particular export interest to the MC concerned could (at least potentially) benefit from preferential treatment. Product coverage is a useful indicator to compare the extent of preferences granted to different countries with similar export products under similar agreements. Product coverage for one country, however, does not say much by itself. Suppose, for example, that the EU has high most favored nation (MFN) tariffs, which are prohibitive for all potential imports from exporting country A. If the EU then grants a preference to A for one unit of a single good that enables actual export of this unit, product coverage would be shown to be 100 per cent, as no trade occurs in all other products. In order to avoid this problem, a much more telling indicator would be the share of products qualifying for preferential treatment in all potential exports to the EU. However, estimating this indicator would require a model that estimates trade flows in the absence of all trade restrictions in the EU, an effort beyond the scope of this study.
Along with information on product coverage, an indicator of the depth and evolution of tariff cuts would also be needed. One method of doing so would be to simply compare preferential and MFN tariffs, and to calculate a (simple or weighted) average of the preferential reduction in tariff rates, expressed in percentage ad valorem terms. An alternative approach is to express the depth of tariff reductions in absolute money terms, taking into account the value of trade in individual products and the respective magnitudes of tariff reductions. Essentially this indicator is a variant of a weighted average tariff reduction, with trade values used as weights and the result expressed in money terms rather than as a percentage tariff rate. Such an indicator of the depth of tariff cuts is the preference margin, which also indicates the extent to which the EU was willing to forego (potential) tariff revenue by granting preferential access to its markets.
Estimation of the preference margin starts with the assumption that both MFN exporters and preferential exporters of a given product earn the same price on the domestic EU market, which implies homogeneous goods. The relationship between the export prices received by the MFN supplier (pw) and the preferential supplier (pp) is described in equation (2).
pw (1 + tMFN) = pp (1 + tp) (2)
19 Alternatively, Table 4.1 below also presents the value of exports qualifying for preferential treatment in the
EU as a share of total agricultural exports of the MCs, in order to show the overall importance of EU preferences for total agricultural exports from the MCs.

Evolution, Current State and Future of EU Trade Preferences… 115
with tMFN being the (ad valorem) tariff rate for exports to the EU market, and tp being the preferential tariff rate.20
The value of the preference margin for the product concerned is then the difference between pp and pw, multiplied by the quantity exported to the EU. In using trade statistics, it is more convenient to work with export values rather then export quantities and prices. Hence in the estimates presented below, the value of the preference margin (VPM) is calculated as a share of the export value of the product concerned (V), as defined in equation (3), which is easily derived from (2).
VPM = Vt
tt
MFN
pMFN *1+
−
(3) The value of the preference margin is estimated in this way for each product receiving
preferential treatment in the EU, and then aggregated across all products, to yield the total value of preference margins for the exporting country concerned.21 Of course the value of the preference margin can also be expressed as a percentage of the export value, in which case it will be referred to as the percentage preference margin throughout this article.
While the preference margin is estimated here primarily as an indicator of the depth of tariff cut in assessing the evolution of the preferential arrangements with the MCs, it also can indicate the way in which the value of these arrangements for the beneficiary countries has developed over time. It should be noted, though, that the value of the preference margin estimated in this way and presented in Section 4 is not necessarily equivalent to a direct economic gain to the exporting country. The preference margin essentially is equivalent to a price difference, which can take either of two forms (or some combination of them). One possibility is that the preferential tariff reduction can be used to sell at a lower price on the domestic market of the EU, in an effort to expand the quantity of exports. Alternatively, a given selling price on the domestic market of the EU can mean that the preference margin can result in an increase of the price received for a given quantity. However, even in the latter case, which is assumed in equation (3), it is not necessarily clear who captures the higher price. Depending on the distribution of negotiating power between the export and import side, which depends heavily on the institutional framework, e.g. license allocation in connection with tariff rate quotas (TRQs; Skully), or the existence of minimum import price systems, the price differential may accrue to the exporting or to the importing companies, and hence to the exporting country (MC) or the importing country (EU).
Unfortunately an analysis of the actual distribution of the preference margin can be rather complex and inconclusive, not the least as a result of the way EU market regimes for some of the products of interest to the MCs are administered. In the case of a binding TRQ, where no minimum import price system is in operation, the result strongly depends on the method chosen for allocating licenses for trade under the TRQ. This is because the "owner" of the license is likely to attract (most of) the preference margin as he is in a quasi-monopolist position. Like other countries, the EU has decided to issue all licenses under the preferential
20 An equivalent analysis can, of course, be presented for specific (rather than ad valorem) tariffs. In the
estimates presented, however, all specific tariffs were converted to ad valorem tariffs, based on unit values of EU imports.
21 Preference margins for individual products can be obtained from the authors on request.

Harald Grethe, Stephan Nolte and Stefan Tangermann 116
regimes to trading companies registered in the EU. This would suggest that in such cases most of the price advantage resulting from the preference margin accrues to importing EU companies. As far as EU preferences for the MCs are concerned, these cases are infrequent as many of the major products concerned fall under the entry price regime. Under this regime, price formation in trade differs from that under a pure tariff regime. In particular, the entry price regime acts as an invitation to the exporting countries to establish monopolistic export structures. These agencies have a much stronger negotiating position vis-à-vis EU importing companies than would a multitude of individual exporting companies. As a result they may be able to attract at least some part of the preference margin which otherwise might accrue to the EU importing company.
In the case of fruits and vegetables, preferential TRQs are administered on a first come first serve basis, i. e. no licenses are issued and the full MFN tariff is charged from that moment on when the TRQ is fully exploited. This system may also tend to let part of the preference margin end up with the importing company, as no information is published by the EU on the extent to which quotas are used at any particular time. Hence the importing companies tend to base their price negotiations with exporters on the worst-case assumption that the full MFN tariff will be charged, at least towards the end of the import period when the risk of exceeding the TRQ increases.
There are two other reasons why the economic gain accruing to the exporting country can differ from the value of the preference margin. First, the MFN tariff may be prohibitive, in which case part of the preference just reduces the redundant part of that prohibitive tariff, and the potential economic gain to the exporting country is less than the preference margin.22 Second, tariff preferences usually result in an expansion of the quantities traded (i.e. if not subject to TRQs or minimum import price systems). Therefore the potential economic gain tends to be somewhat higher than the preference margin calculated based on trade figures before the implementation of the preferences concerned.
In summary, because of the complexity of the trading regimes involved in EU agricultural trade with the MCs, it is impossible to make any general statements about where the preference margins end up, and hence about the actual economic gain for the exporting countries. Furthermore the actual economic gain resulting from trade preferences is not necessarily the same size as the preference margin, no matter to whom it accrues. Only detailed product- and country-specific empirical analyses of price formation can shed light on this issue. Such analyses were beyond the scope of this study. As a consequence, the value of the preference margin estimated here must be interpreted as an indicator of the potential loss in EU tariff revenue and potential benefits to the exporting countries.
In the calculations presented in Section 4, actual average trade flows of the years 2001 through 2003 were used as a basis for assessing both product coverage and the value of preference margins resulting from all historical trade arrangements, even though some of the preferences were applied much earlier, starting in the mid-1970s. The reason is that an attempt is made in this study to assess the historical evolution of trade preferences granted to the MCs by the EU, and to see how preferential treatment has improved (or deteriorated) over time. For analytical reasons this is possible only if the trade preferences studied are the only factor that changes, while trade flows are kept constant in the analysis. If both trade
22 As the estimates of preference margins presented below are based on actual (i.e. non-zero) trade flows, a
case in which the preference is no more than the redundant part of the prohibitive tariff is not relevant here.
Evolution, Current State and Future of EU Trade Preferences… 117
preferences and trade flows were to change from step to step of the historical analysis, then it would be impossible to say whether any apparent improvement (or deterioration) in the quantitative indicators of preferential treatment calculated here was due to changes in trade flows which may be caused by many factors other than changes in preferences, or to changes in preferences. For this reason, the trade flows used in the calculations needed to be kept constant across the whole analysis, and it was considered best to use a recent reference period. Over the same period of time, however, MFN tariffs to which the reduction rates of the trade agreements apply have undergone the process of tariffication and reduction according to the UR Agreement on Agriculture (AoA). There would be no point in applying the reduction rates of currently valid trade agreements to pre-UR MFN tariffs. On the other hand, one would underestimate preference gains considerably if post-UR tariffs were to be applied to reduction rates of agreements from the 1970s and 1980s. The pre-UR agreements have therefore been evaluated at pre-UR tariffs and the current EMAs have been evaluated at current tariffs. To provide as the closest possible comparability of the preferential conditions of the successive agreements, the preference erosion during the implementation of the AoA has been quantified by evaluating the agreements in 1995 both at pre- and post-UR applied tariffs. Product coverage and the value of preference margins resulting from the EU agreements with the MCs have been calculated for all countries covered, and for all agricultural products benefiting from preferential treatment. Because of seasonal MFN tariff variation and seasonal preferences, much of the analysis is based on monthly trade data and on EU import unit values rather than export unit values of preference-receiving countries due to the much better availability of disaggregated trade data.
4. THE EVOLUTION OF EU AGRICULTURAL TRADE PREFERENCES FOR THE MEDITERRANEAN COUNTRIES
4.1. The "Global Mediterranean Policy"
The trade arrangements under the "Global Mediterranean Policy", concluded during the
mid-1970s (in the following referred to as 1975/78 Agreements) were similar for all MCs. For industrial products, the EU granted free access to its markets except for some categories of textiles and some processed agricultural products, the so called "non-Annex I products". For agricultural products ("Annex I products"), the EU did not provide free access to its markets but granted preferences of a limited scope. For some products, tariff concessions were granted without a quantitative limit or any other conditions, but often restricted to certain calendar periods. For example, Egypt, Israel and Tunisia were granted tariff reductions that averaged between 60 and 70 per cent of the MFN tariff. For a few products, which differed per country, the tariff and levy reductions were limited to TRQs and no reduction was granted for quantities in excess of these quotas. Table 4.1 presents in its first nine rows an overview of product coverage and the value of preference margins under the 1975/78 Agreements.

Table 4.1. Product Coverage and Value of Preference Margins Resulting under the 1975/78 Agreements and Subsequent Changes
Algeria Egypt Israel Jordan Lebanon Morocco Palestine Syria Tunisia Total MCs 1975/78 Agreements
(1) Total agricultural exports (in mio. €), 2001-03 40.4 781.1 1,101.9 392.9 196.6 1,125.90 62.1 794.4 445.3 4,940.5
(2) Total agricultural exports to the EU (in mio. €), 2001-03 39.9 306.7 860.9 7.2 32.8 1,384.30 5.1 137.3 293.8 3,068.0
(3) of which preferential exports (in mio. €) 14.2 87.6 227.7 1.1 14.1 932.6 21.4 210.0 1,508.5
(4) = 3)/(1) In % of total agricultural exports 35.1% 11.2% 20.7% 0.3% 7.2% 82.8% 2.7% 47.2% 30.5% (5) = 3)/(2) In % of total agr. exp. to the EU (product coverage) 35.6% 28.6% 26.4% 15.2% 43.0% 67.4% 15.6% 71.5% 49.2%
(6) Value of preference margin (in mio. €) 1.5 5.7 14.6 0.1 0.0 90.7 0.1 17.2 129.8
(7) of which for fish 1.0 62.9 9.8 73.7
(8) = 6)/(1) In % of total agricultural exports 3.6% 0.7% 1.3% 0.0% 0.0% 8.1% 0.0% 3.9% 2.6%
(9) = (6)/(2) In % of total agricultural exports to the EU 3.7% 1.9% 1.7% 0.9% 0.0% 6.6% 0.0% 5.8% 4.2% Revisions until 1995
(10) Product coverage 1995 (in %) 36.3% 29.30% 43.1% 22.6% 43.0% 65.0% 15.6% 72.4% 53.0%
(11) % change compared to 1975/78 1.9% 2.6% 63.0% 48.3% 0.0% -3.5% 0.0% 1.3% 7.8%
(12) Value of preference margin 1995 (mio. €) 1.5 9.4 39.9 0.2 0.0 103.8 0.3 36.6 191.7
(13) % change compared to 1975/78 1.7% 65.9% 173.1% 184.2% 0.0% 14.5% 384.7% 112.7% 47.7% Effect of MFN tariff reduction 1995-2000 (14) Value of preference margin 2000 without EMA (mio. €) 1.3 6.4 26.6 0.1 0.0 94.5 0.3 34.9 164.2
(15) % change compared to 1995 -12.8% -32.1% -33.2% -18.8% -56.2% -9.0% -21.6% -4.4% -14.4% EMA (16) Product coverage under the EMA (in %) 52.7% 44.1% 55.4% 52.0% 22,0% 84.2% 79.9% 17,4% 76.0% 67.2%
(17) % change compared to 2000 before EMA 45.3% 50.6% 28.5% 130.5% -48.8% 29.5% 11,5% 5.0% 26.8%
(18) Value of preference margin under the EMA (mio. €) 1.8 11 36.6 0.3 0,9 122.3 0.4 5,7 46.6 225.5
(19) % change compared to 2000 before EMA 34.5% 71.6% 37.3% 119.1% 37,900% 29.5% 2,118% 33.3% 37.4% Sources: Eurostat, FAO, GATT, European Union, own calculations. Note that data for external trade with the EU and total trade have been extracted from different sources
and therefore may be inconsistent in some cases

Evolution, Current State and Future of EU Trade Preferences… 119
The coverage of preferences (row 5) under the 1975/78 Agreements differed markedly among the MCs. It was lowest for Syria and Jordan, where only around 15 per cent of total agricultural exports to the EU benefited from preferences. Coverage was highest for Tunisia, with around 72 per cent of its agricultural exports to the EU covered by preferential treatment. For the group of MCs on average, product coverage was 49 per cent. In relation to total agricultural exports to all destinations, the share of exports benefiting from agricultural preferences in the EU was of course smaller, 30 per cent on average for all Mediterranean countries, and for individual countries between 0.3 per cent for Jordan and almost 50 per cent for Algeria (row 4).23
The aggregate value of the preference margin for all products is presented in row 6 of Table 4.1 in million €, and expressed as a percentage of the value of agricultural exports to the EU in row 9. For the 1975/78 Agreements, the aggregate value of the preference margin for all MCs was 4.2 per cent of their agricultural exports to the EU. For Jordan, Lebanon and Syria it was 1 per cent or less of the value of their agricultural exports to the EU. For Morocco and Tunisia, on the other hand, the value of their preference margins amounted to more than 5 per cent of the value of their agricultural exports to the EU.
4.2. Revisions up to 1995 Over the years notable changes in preferences common to all Cooperation Agreements
were implemented. The first significant amendment was a series of protocols added to all of the Cooperation Agreements in 1987 and 1988.24 The stimulus for the changes in preferences laid down in the additional protocols was the accession of Portugal and Spain to the EU in 1986. Portugal and Spain were strong competitors for the MCs with regard to exports of many agricultural products to the EU, and it was felt that the abolition of EU tariffs for these two countries would weaken the competitive position of the MCs considerably. Aimed at compensating the MCs for these disadvantages in agricultural trade, the additional protocols contained lists of agricultural products for which tariffs were to be phased out over the same periods and at the same reduction rates as laid down in the Acts of Accession for Portugal and Spain. In most cases this implied phasing out tariffs for products which were already subject to preferential treatment under the original Cooperation Agreements. However, in some cases tariffs were to be phased out for products which had not previously benefited from preferential treatment. For most products the phasing out of tariffs was restricted by TRQs or reference quantities (RQs). On quantities exported in excess of RQs, the preferential tariff (and not the MFN tariff as for TRQs) was still to be applied, but the EU reserved the right to convert RQs into TRQs at the same level. For products where tariff reductions were granted without a quantitative limit, the EU reserved the right to set limits later if imports caused "difficulties" on EU markets. None of these two provisions have ever been applied by the EU. In addition, preferential reference prices (lower than MFN reference prices) were agreed upon under the 1987/88 revisions for oranges from Tunisia; oranges, some other citrus and tomatoes from Morocco; and for oranges, mandarins and lemons from Israel.
23 The percentage presented in Table 4.1 for Morocco is higher, but this is attributable to inconsistencies
between total agricultural trade data and bilateral agricultural trade data. 24 The protocols with Algeria, Egypt, Jordan and Tunisia were signed in 1987; with Morocco and Syria, in
1988. The additional protocol with Lebanon was not ratified by this country and thus did not enter into force.
Harald Grethe, Stephan Nolte and Stefan Tangermann 120
During the early 1990s, the "new Mediterranean policy" of the EU meant agricultural preferences were extended further for all individual MCs. In line with the reduction of import tariffs for products originating from Portugal and Spain, tariffs on products contained in the lists of the additional protocols were to be reduced to zero by January 1, 1993. In addition, all TRQ and reference quantities were to be increased by five per cent per year from 1992 to 1995. For “sensitive” products including flowers, potatoes, tomatoes, oranges and some other products, the annual rate of increase was three per cent.
The impact of the 1987 revisions and of the later tariff reductions and quota increases on preference margins is shown in rows 10 to 13 of Table 4.1. Little change in product coverage occurred, with the exception of Israel and Jordan, where coverage increased significantly. On average over all MCs, product coverage was 53 per cent. However, under the 1987 revisions, the value of preference margins increased significantly, due to the 100 per cent tariff reductions which were then granted for many products. The only exceptions were Algeria and Lebanon, the latter of which had an insignificant VPM under the Cooperation Agreement and did not ratify the 1987 revision. In Jordan and Syria, the value of preference margins remained small under the 1987 revision, but increased by large percentages in comparison to the arrangements of the mid-1970s.
4.3. The Uruguay Round In historical sequence, the next changes to take place in agricultural trading relations
between the EU and the MCs resulted from the Uruguay Round. With all the new provisions introduced in the EU after the UR, and in particular with the new entry price system it is difficult to make a general statement on whether access to EU markets for products in which the MCs have an export interest have improved or deteriorated as a result of the UR. However, the impact of the reductions in MFN tariffs which are made during the implementation period of the UR (i.e. between 1995 and 2000) on preference margins enjoyed by the MCs under their past arrangements with the EU can be assessed. For this purpose, the value of preference margins has again been calculated as explained above, but for the new final bound tariffs which prevail at the end of the implementation period and in the absence of any revisions of preferential treatment negotiated after the UR (i.e. the new provisions under the recently negotiated EMAs are not yet taken into account). The results, therefore, show what would have happened had the pre-UR preferential arrangements for the MCs remained unchanged, so that the value of preference margins eroded as a result of reductions in MFN tariffs. Hence, in a way this analysis shows what some of the incentives were for negotiating new post-UR arrangements between the EU and the MCs.
The results of these calculations are presented in rows 14 and 15 of Table 4.1. Due to the fact that, in absolute terms (in terms of percentage points), MFN tariffs are reduced more than preferential tariffs, the value of the margin of preferences would have decreased (in the absence of any improvements of preferential treatment) by about 14 per cent on average for all MCs (row 15). For a number of individual MCs, the decline in the value of the preference margin resulting from UR tariff cuts is a larger percentage. Remarkable in this context is Lebanon, where the value of the preference margin decreased by more than by the average reduction rate for agricultural tariffs of 36 per cent, actually by 56 per cent. This stems from

Evolution, Current State and Future of EU Trade Preferences… 121
the fact that most of the products exported by Lebanon to the EU were subject to tariffs of 3 per cent ad valorem which where completely abolished after the implementation of the AoA.
This decline in the value of the preference margins must not be interpreted as an absolute deterioration of market access. In fact, almost all preferential tariffs decrease as a consequence of the MFN tariff reductions, because they are set as given percentages of MFN tariffs. However, the decline in the value of the preference margins resulting from the UR Agreement as such indicates a diminishing relative advantage of the MCs compared to MFN suppliers.
4.4. The Euro-Mediterranean Agreements The last step in the evolution of preferential trade rules between the EU and the MCs in
the area of agriculture, at least for the time being, has come in the form of the series of EMAs which replace the former Cooperation Agreements and their amendments. In the meantime, EMAs are in force with Tunisia (1998), Israel (2000), Morocco (2000), Jordan (2002) and Egypt (2004). An Association Agreement also was concluded with Lebanon in 2002, however, only the trade and trade related measures are as yet applied. An Association Agreement was signed with Algeria in 2001, but has not yet entered into force. An interim agreement was concluded with the Palestinian Authority in 1997. Negotiations with Syria were concluded in October 2004.25
Reasons to review preferences in the area of agriculture which have sometimes been mentioned are the erosion of preferences due to the reduction of MFN tariffs under the AoA discussed above, and the establishment of a series of Association Agreements of the EU with the Central European Countries (CECs), of which most are meanwhile EU members. Under the EMAs, preferences that existed under the former agreements were usually consolidated and, in some cases, extended. In contrast to the situation before the EMA, agricultural trade preferences are mutual, i.e. for the first time, preferences are granted to the EU by the MCs. Preferences to the MCs are generally limited to typical Mediterranean products. In many cases tariff reductions are limited to certain calendar periods. Tariff reduction rates differ between 5 and 100 per cent and are 100 per cent in most cases where the tariff reduction is limited by a TRQ or a RQ. As under the additional protocols to the old Cooperation Agreements, exports in excess of reference quantities are not immediately subject to MFN tariffs instead of preferential tariffs, but the EU reserves the right to convert reference quantities to TRQs in the future. In some cases exports in excess of TRQ, or future TRQ resulting from the conversion of reference quantities, are not eligible for any tariff reductions. In other cases lower tariff reductions apply to exports exceeding the TRQ. Some of the TRQ and reference quantities are increased by four equal steps of 3 per cent annually from the conclusion of the agreement. Finally, for some products the EU reserves the right to define reference quantities at any level if the volume of imports "threatens to cause difficulties on the Community market".
25 Most of the agreements are found in European Union. The ones that have not yet been ratified by all parties
are taken from following sources: Commission of the European Communities (2002a), Commission of the European Communities (2002b), Kommission der Europäischen Gemeinschaften.

Harald Grethe, Stephan Nolte and Stefan Tangermann 122
In addition to tariff preferences, significant reductions of entry prices for limited quantities were negotiated for oranges with Israel and some other products, too, with Morocco. Reductions in entry prices of between 5 and 58 per cent enable the countries concerned to supply products to EU markets priced significantly below supplies originating from countries which have to accept the MFN entry price. As a result reduced entry prices enable the countries concerned to export products to the EU even if at high season the EU domestic price is below the MFN entry price plus tariff. If the EU domestic price is above the level of the entry price plus the relevant tariff, and countries that do not benefit from a reduced entry price are also exporting to the EU, the preferential entry price will have no direct effect except the assurance of being the last exporter to leave the market if the EU domestic price declines. Preferential entry prices could in this case also enable countries to export low quality products to the Community which would not be marketable at MFN entry price level. The welfare effects of reduced entry prices are complex to assess and are therefore not included in this analysis. For an example of the assessment of the economic rent resulting from reduced entry prices, see the case study for tomatoes from Morocco by Chemnitz and Grethe (2005).
To assess the impact of the new EMA compared to the situation under the old agreements, product coverage and the value of preference margins are calculated again based on 2001 to 2003 trade flows. Preferential reduction rates are applied to 2004 applied tariffs, which are equal to the final WTO bound tariffs in the year 2000 for all products of relevance here except rice. The scheduled increase in some TRQ and reference quantities and the subsequent extension of preferences for Israel, Morocco, the Palestinian territories, and Tunisia are fully considered. The results of these calculations are presented in rows 16 to 19 of Table 4.1.
The increase in product coverage is 27 per cent on average. This indicator again differs significantly among countries. It is highest for Jordan with 130 per cent and lowest for Tunisia with 5 per cent. Product coverage (PC) deteriorates even for Lebanon. This is mainly due to a product that used to make up a large share of Lebanon’s agricultural exports to the EU but is no longer listed in the new agreement.26 This therefore does not indicate a real loss in preferential treatment (see row 17). For Israel and Lebanon, the EMAs also grant preferences for non-Annex I products.27 Including these preferences, the product coverage would increase by roughly one percentage point for Israel to 56.5 per cent, but would almost double for Lebanon to 40.6 per cent. Preference margins for these products are hard to calculate, as the MFN levy differs with each consignment, since it depends on the amount of certain components contained in the product. Non-Annex I products have therefore been excluded from the analysis. The average PC for all MCs is 67.2 per cent.28
The value of preference margins (VPMs) increased between 30 per cent for Morocco and more than 100 per cent for Jordan, and by 37 per cent on average for the MCs. For Lebanon,
26 This product is CN-Code 0504 (Guts, bladders and stomachs of animals…), for which the MFN tariff was
reduced to zero even before 1995. 27 As pointed out above, only the trade-related part is currently in force for Lebanon. 28 This is less than the 78.6 per cent of product coverage which result under the Cotonou Agreement for the
non-LDC ACPs and the 100 per cent which will result for the LDC ACPs after full implementation of the Everything But Arms initiative. Cotonou preferences in agriculture contain a significant amount of "empty preferences" in the sense of preferences for products for which EU MFN tariffs are already zero. Excluding these empty preferences, product coverage for the non-LDC ACPs is 47.7 per cent, and 45.2 per cent for the LDC ACP (Nolte 2002).

Evolution, Current State and Future of EU Trade Preferences… 123
the VPM increased almost four hundred fold. However the absolute value has remained small with €0.9 mio. Syria is a similar case, where the VPM increased two hundred fold to €5.7 mio. Looking at the enormous increase, in percentage terms, of product coverage and VPM for Jordan, one has to consider that both were very small in absolute terms under the old agreements. Jordan's preference margin under the EMA, which amounts to about 5 per cent of the value of total agricultural exports to the EU, is now in the same order of magnitude, relative to total agricultural exports to the EU, as those of the other countries covered by an EMA. Morocco's VPM is the highest, exceeding €120 mio. and thus makes up more than half of the VPM for all MCs. In relation to the total value of agricultural exports to the EU, however, Tunisia scores higher than Morocco with the VPM at about 16 per cent of its agricultural exports to the EU. For the MCs on average this share is about 7 per cent.
One should keep in mind that the VPMs resulting from the EMAs are underestimated compared to those resulting from former agreements. This is because new trade flows induced by new preferences (e.g. cut flowers in the case of Tunisia) are not accounted for in all cases as calculations are based on 2001-2003 trade flows, whereas all induced trade flows were implicitly considered in the analysis of the former agreements. This is the case for Lebanon, where the trade part of the EMA was in force only since 2002, Egypt where the trade part entered into force only in 2004, the Palestinian territories where preferences have been extended in January 2005, and Algeria and Syria where the agreement is not yet in force.
An interesting question in the analysis of the evolution of preferential arrangements is whether preferences were trade inducing or just resulted in more favorable market access conditions for existing trade. A comprehensive analysis of this question is beyond the scope of this study, but examples support both explanations. Table 4.2 shows agricultural trade flows and TRQs before (1990-1994) and after (2000-2003) the implementation of the EMAs.
Table 4.2. Moroccan Exports, TRQs and Tariff
Reduction Rates, 1990-1994 and 2000-2003 (tons)
Product 1990-1994 2000-2003
Trade TRQ Tariff red. rates Trade TRQ
(2000) Tariff red. rates
(2000)
Average Max. in
TRQ above TRQ Average Max.
in TRQ
above TRQ
Sweet peppers 1,885 2,330 0 40% 7,498 12,535 0 100% Wine 4,649 5,420 5,600 100% 80% 7,651 9,502 9,520 100% 80% Orange juice 23,903 34,865 16,800 100% 0% 7,733 10,606 33,607 100% 70%
Sources: European Union (various issues), own calculations For sweet peppers, the tariff reduction was considerably extended under the EMA and
trade increased significantly after the new provisions were in force in 2000. Also for wine, the extension of the preference seems to have induced additional trade. In the period before the new EMA was negotiated, quantities of exports from Morocco to the EU were close to the TRQ of 5,600 tons at that time. Under the new EMA, which was concluded in 1995 and implemented in 2000, the TRQ was almost doubled and export quantities approached the new TRQ level. For orange juice, the situation is different. Morocco substantially exceeded its TRQ of 16,800 tons in the period 1990-1994. Under the EMA, the TRQ was increased and above-TRQ tariffs were reduced. In this case the preference clearly traced existing trade.

Harald Grethe, Stephan Nolte and Stefan Tangermann 124
However, Morocco was unable to maintain its orange juice exports to the EU at the pre-EMA level and they declined to about 23 per cent of the TRQ level for the period 2000-2003.
4.5. Product Coverage Revisited The significance of product coverage as an indicator for the gains from preferential trade
is very limited. Not only does it not provide any information about the depth of preferences, i.e. a 5 per cent reduction of a tariff is evaluated as equal to a full exemption, but it also may indicate a product as preferentially traded if there is no preference gain at all, which is the case when the MFN tariff is zero or is reduced to zero over time, as happened during the implementation of the UR AoA. To enhance the explanatory power of product coverage, one has to identify the share of these empty preferences and relate the value of non-empty preferential trade to the total trade volume. This is done in Table 4.3 for all MCs and for Lebanon as a special case. In the last row of the table the value of preferential trade is related to the volume of trade which actually faces an MFN barrier at the EU border.
Table 4.3 shows that the product coverages including and excluding empty preferences are very close for the MCs on aggregate. The product coverage as the share of non-empty preferences in the trade volume with MFN-tariff, however, is significantly higher in all cases. Compared to the ordinary measurement of product coverage (row 1) this means that more non-empty preferences are laid down in the agreements than empty ones, otherwise the ordinary measurement of product coverage would be greater.
Table 4.3. Different Measures of Product Coverage for all MCs and Lebanon
1975/78 Agreements
Revisions up to 1995
After MFN reduction
1995-2000
EMAs
MCs Lebanon MCs Lebanon MCs Lebanon MCs Lebanon Preferential/ total agricultural trade 49.2% 43.0% 53.0% 43.0% 53.0% 43.0% 67.2 22.0% Preferential (non-empty)/ total agricultural trade 47.2% 0.5% 51.1% 0.5% 50.6% 0.1% 65.5% 22.0% Preferential (non-empty)/total agr. trade with MFN-barrier 54.6% 1.0% 59.1% 1.0% 58.5% 0.3% 75.8% 46.4%
Sources: Eurostat (various issues), GATT (1994), European Union (various issues), own calculations The observations for the aggregate of the MCs fit very well with the observations of
individual MCs. In most cases, product coverage and the indicator of non-empty preferential trade related to trade with an MFN-tariff do not differ by more than 10 per cent. The most remarkable exemption from this rule is Lebanon, where for all Agreements the two indicators differ greatly. In the two pre-EMA agreements there is a large share of empty preferences involved, as was previously pointed out (see Table 4.1). Under the EMA, product coverage including and excluding empty preferences are very close together, which means there are very few empty preferences. The share of preferential trade in total trade subject to a MFN

Evolution, Current State and Future of EU Trade Preferences… 125
barrier, however, is about twice the ordinary product coverage.29 This stems from the fact that less than half of Lebanon’s agricultural exports to the EU are subject to an MFN tariff in the EU's import regimes.
4.6. Product Composition and Size of the Value of the Preference Margin It is also interesting to look at the product composition of the total VPM for the
individual MCs. For Morocco about half of the VPM results from fish (fresh and processed), and more than 10 per cent from oranges and mandarins. More than 70 per cent of the VPM of Tunisia results from preferential treatment of olive oil and another 20 per cent from fish. In the case of Jordan, cucumbers and gherkins are the most important product which account for about 23 per cent of the VPM, and for Palestine fresh flowers and strawberries are the only relevant products. Cut flowers make up for about 24 per cent of the VPM for Israel.
Generally, the preference margin is highly concentrated on a few products. For all MCs, four or fewer products at the 4-digit CN level account for more than half of the VPM. In some cases this concentration is even more pronounced. Syria for instance obtains 86 per cent of its VPM from only one product (CN 1509, olive oil). Table 4.4 displays the distribution of the VPM for each MC and the MCs as a group.
Table 4.4 shows that for the MCs as a group about 83 per cent of the preference margin is concentrated on the product groups of fresh and processed fruit and vegetables as well as fish and fats and oils (mainly olive oil). The composition, however, varies strongly among countries.
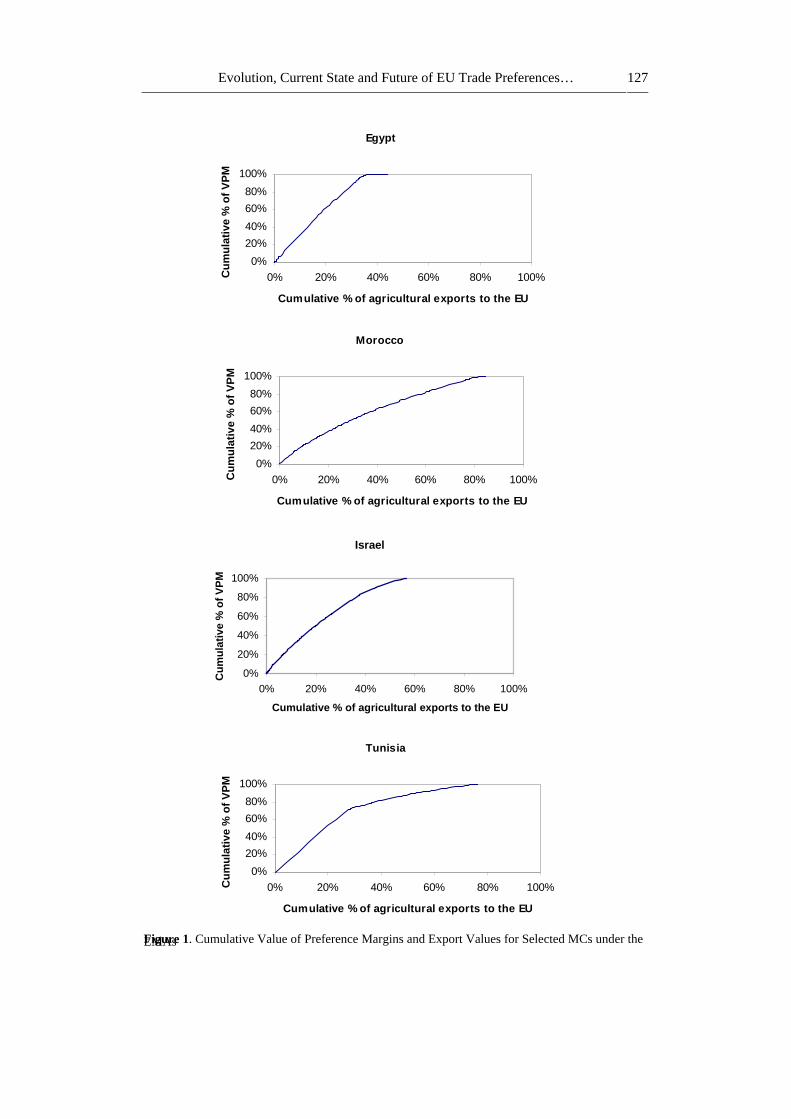
A directly related aspect that throws light on the nature of the EU’s agricultural trade policies vis-à-vis the MCs and on pressure for future change, is the extent to which the overall size of the VPM is evenly (or unevenly) spread over all agricultural exports to the EU from the MC concerned. Figure 1 presents information on this issue in graphical form for four selected MCs. In the country graphs, the cumulative size of the VPM under the EMA as a per cent of the total VPM (on the vertical axis) is plotted against the cumulative value of the respective country’s agricultural exports to the EU in per cent of total agricultural exports to the EU (on the horizontal axis), and products are arranged by increasing size of their percentage preference margin. Clearly, product coverage as defined above is where the upward sloping line hits 100 per cent of the total VPM and becomes flat (compare graphs with Table 4.1). The most interesting feature of the graphs, then, is the curvature of the lines. Where the upward sloping line is linear, the product-specific preference margins make up the same percentage of the export value of all products covered by preferences. On the other hand, the more curvature there is in a line, the more unequal is the percentage margin among products.
29 This distance is even greater for Syria, where the share of preferential trade in trade which is subject to an
MFN-tariff is four times the product coverage.

126
Table 4.4. Distribution of VPM under the EMAs by Product Groups
Algeria Egypt Israel Jordan Lebanon Morocco Palestine Syria Tunisia Total MCs Total 100% 100% 100% 100% 100% 100% 100% 100% 100% 100% Of which: Meat and live animals - - 0.7% - 0.0% 0.0% - 0.0% 0.0% 0.1% Fish 55.0% - - - 0.5% 32.2% - 0.0% 19.3% 21.9% Dairy and eggs 0.1% - 0.0% - 1.2% - - 0.2% - 0.0% Flowers and live plants - 1.0% 29.5% 0.4% 0.1% 0.3% 60.8% 0.2% 0.0% 5.1% Vegetables 1.4% 64.1% 19.4% 41.0% 2.0% 18.5% 4.4% 9.2% 0.4% 16.8% Fruit 25.4% 29.5% 28.6% 52.8% 1.2% 21.0% 34.8% 0.3% 6.6% 19.2% Cereals and milling industry products - 4.4% - - 0.8% - - - - 0.2% Oilseeds and oleaginous fruit 0.6% 0.1% - - 0.4% 0.1% - 0.1% 0.0% 0.1% Fats and oils - - - - 11.3% 0.1% - 86.4% 71.2% 17.0% Preparations of meat and fish 1.5% - 2.0% - 0.6% 18.2% - - 0.4% 10.3% Sugars - 0.0% - - 0.1% - - 0.2% - 0.0% Preparations of cereals - - - - - - - - - - Preparations of vegetables and fruits 0.5% 0.6% 18.9% 5.8% 42.2% 8.8% - 2.4% 0.2% 8.2% Tobacco - - - - 34.4% - - 0.8% - 0.2% Cotton - - - - - - - - - - Other 15.6% 0.3% 0.8% - 5.3% 0.7% - 0.1% 1.8% 0.9%
Sources: As for Table 4.1.
Evolution, Current State and Future of EU Trade Preferences… 127
Figure 1. Cumulative Value of Preference Margins and Export Values for Selected MCs under the EMAs
Morocco
0%20%40%60%80%
100%
0% 20% 40% 60% 80% 100%
Cumulative % of agricultural exports to the EU
Cum
ulat
ive
% o
f VPM
Israel
0%
20%
40%
60%
80%
100%
0% 20% 40% 60% 80% 100%
Cumulative % of agricultural exports to the EU
Cum
ulat
ive
% o
f VPM
Egypt
0%20%40%60%80%
100%
0% 20% 40% 60% 80% 100%
Cumulative % of agricultural exports to the EU
Cum
ulat
ive
% o
f VPM
Tunisia
0%20%40%60%80%
100%
0% 20% 40% 60% 80% 100%
Cumulative % of agricultural exports to the EU
Cum
ulat
ive
% o
f VPM
Harald Grethe, Stephan Nolte and Stefan Tangermann 128
In the case of Egypt, the line is rather steep (showing that product coverage is relatively low), but nearly linear, which indicates that products that receive preferences experience nearly equal preferential margins in terms of their share in the export value. The average percentage preference margin for preferential products exported by Egypt to the EU is 9.9 per cent. Some products, mainly preserved fruit and vegetables and fruit juices, have a higher percentage preference margin of up to 53 per cent. These products, however, matter little compared to total preferential trade. Products with a percentage preference margin of above 15 per cent have only a 0.1 per cent share in total preferential trade. In absolute terms, the bulk of the VPM accrues to very few products. Potatoes, green beans, onions, table grapes, lemons and strawberries, all of which have a percentage preference margin very close to the average of 9.9 per cent, make up 73 per cent of Egypt's VPM.
For Morocco, the line is much flatter (larger product coverage) but still close to linear, again indicating essentially equal treatment of all preferential products. The average percentage preference margin here is 10.7 per cent. Products with higher individual percentage preference margins include olive oil, preserved strawberries and mushrooms with up to 35 per cent. Preparations of fish and aquatic animals also have a higher percentage preference margin of up to 20 per cent. While the plant products mentioned before do not contribute significantly to the total VPM of Morocco, fish and preparations are by far the most important products for Morocco and make up for more than 50 per cent of Morocco's VPM. Among crop products, tomatoes with 9 per cent, mandarins with 7 per cent and oranges with 5 per cent of the total VPM are the most important products. The latter, as well as most fishery products, has an individual percentage preference margin rather close to the average one.
For Israel and particularly Tunisia, there is more curvature in the lines, indicating that the percentage preference margins differ significantly among products, either due to differing MFN tariff rates or different magnitudes of the preferential tariff cuts. In such cases, not only is there a difference between products receiving preferences and those not benefiting from preferences, but also among the products covered by preferences. The average percentage preference margin for Israel is with 7.7 per cent lower than those of the above-treated countries. Israel is, however, exporting quite a lot of products to the EU with preference margins above 10 per cent and below 5 per cent, making up for 37 per cent and 10 per cent of the total VPM and for 24 per cent and 22 per cent of preferential trade. The products with the highest percentage preference margin are various types of fruit juices with up to 35 per cent, not, however, importantly contributing to the total VPM. The case is different for Tunisia, where olive oils make up 71 per cent of that country’s total VPM, at up to 42 per cent. This stems from the high MFN tariffs as well as substantial reduction rates. As a result of the tariff preference for olive oils, at 21 per cent, the average percentage preference margin of Tunisia exceeds that of all other MCs. Excluding olive oils from the analysis, the average percentage preference margin and the distribution over preferential products would be very similar to the other countries analyzed in this section. Apart from olive oil, fish, dates and oranges contribute most to Tunisia's VPM.
In the latter two cases, the benefits resulting from preferential treatment by the EU are distributed unevenly across product sectors, so producers in different product sectors may tend to be happy about EU preferences to rather different degrees. More generally, the larger the area below the lines and above the diagonal, the more unequal are the effects of preferential treatment for different product sectors, and the more potential there is for split

Evolution, Current State and Future of EU Trade Preferences… 129
opinions among different producer groups about the benefits of the arrangements with the EU.
Finally, in order to make an attempt at saying something about the importance and size of the overall VPM for the individual country, the VPM is compared to the size of several economic indicators. In Table 4.5, VPMs under the EMA are related to total agricultural exports to the EU and to the agricultural GDP of the countries concerned (to indicate the relevance of EU preferences for the agricultural sector) and to their total GDP (to indicate the significance of EU agricultural preferences for the whole economy).
Table 4.5. Size of the Value of the Preference Margin
Value of preference margin in mio. € % of agr. exEU % of GDPagr. % of GDPtotal Algeria 1.75 4.39% 0.03% 0.00% Egypt 10.98 3.58% 0.07% 0.01% Israel 36.55 4.25% 1.23% 0.03% Jordan 0.33 4.56% 0.16% 0.00% Lebanon 0.92 2.80% 0.04% 0.00% Morocco 122.34 8.84% 1.91% 0.32% Palestine 0.35 7.00% 0.13% 0.01% Syria 5.72 4.16% 0.12% 0.03% Tunisia 46.60 15.86% 1.83% 0.21% Total MCs 225.52 7.35% 0.55% 0.06%
Sources: Eurostat, World Bank (2005a, 2005b), International Monetary Fund, Central Bureau of Statistics, European Central Bank (2004), own calculations. All GDP and export data for 2001-2003 (agricultural share in GDP available for 2001-2002 in most regions, for 2001 in Cyprus, for 2002 in Malta and Israel; GDP available only for 2001-2002 in Israel) The value of preference margins amounts to a significant share of MC agricultural
exports to the EU in all cases. But the situation looks somewhat different if the VPM is compared to the GDP of the agricultural sector. For Israel, Morocco and Tunisia, the VPM exceeds 1 per cent of the agricultural GDP, for all other countries the VPM is 0.2 per cent or less of the agricultural GDP. As a group, the VPM for the MCs is equivalent to about 0.6 per cent of the agricultural GDP. If preference margins are compared to total GDP, they appear, of course, much smaller. On average for all MCs, the VPM is no more than 0.06 per cent of total GDP. Only for Morocco and Tunisia does the VPM exceed 0.2 per cent of their total GDP. This is due to the combination of their relatively large preference margins compared to the size of their agricultural sectors and the relatively large shares of their agricultural sectors in the whole economy. For all other MCs the VPM is 0.03 per cent or less of their total GDP.
One element which is completely new in the EMA, but not covered here, is the reciprocity of agricultural preferences; preferences are also granted by the MCs for imports of temperate zone products originating from the EU. These preferences are considerable: for example, for wheat the TRQs agreed upon by the MCs in the EMAs to date add up to more

Harald Grethe, Stephan Nolte and Stefan Tangermann 130
than 1.8 mio. tons, equivalent to about 13 per cent of all wheat exports of the EU in 2001-2003.30
OUTLOOK A gradual extension of preferences will be an element of the relations between the EU
and the MCs in the field of agricultural trade in the years to come. All EMAs include provisions which foresee the further liberalization of agricultural trade, although at a date that differs from country to country. Tunisia, Israel, Morocco and the Palestinian Authority have already negotiated such extensions. Throughout this process preferential access to EU markets will be improved further. However, the value of preferences granted to the MCs eventually depends on the level of EU import barriers to MFN suppliers which themselves depend, finally, on the nature of future agricultural policies applied by the EU.
Due to various internal and external factors, the trend of agricultural policy making leads away from price support as implemented by border protection. This process started in 1992 with the reforms under EU Commissioner MacSharry for typical temperate zone products. The Agenda 2000 as well as the most recent Mid Term Review reforms (MTR) have carried forward this process. A significant reduction of the intervention price has recently been agreed for rice, and a reform of the EU’s sugar policies, including substantial price reductions, is under negotiation. Many elements contribute to this process. First, the continuing enlargement of the EU to include some large agricultural producers puts pressure on the EU budget. In the years to come, the current accession candidates Bulgaria, Romania and Croatia will probably become EU members. Turkey may follow later. Turkish accession in particular may contribute to further reform of policies for Mediterranean products such as olive oil. A second factor contributing to a reduction of agricultural price supports are the constraints resulting from the EU's agricultural commitments under the WTO. The commitments that have resulted from the UR have already required policy adjustments in the EU. In the current round of negotiations, further tariff reductions and a full phasing out of export subsidies will probably be agreed upon, and will force the EU to reduce the level of price support.
A third external factor could result in the long run decline of EU protection for Mediterranean agricultural products: the ongoing process of bilateral trade liberalization not only with the MCs, but also with many other "southern countries". In the negotiations with South Africa and MERCOSUR, agricultural trade was the most profound concern of the EU, and so far the EU has tried to avoid opening up its markets for agricultural products substantially. On the other hand, the EU has a strong economic interest in trade liberalization for industrial products and it could become more and more difficult for the EU to pursue a policy of free trade in industrial products while exempting large segments of agricultural production.
30 For an analysis of the preferences granted by the MCs to the EU under the EMAs, see Grethe and
Tangermann (1999a, pp. 23-6). The EU’s preferential access to the wheat markets of Jordan and Syria is not limited by TRQs. The amount of wheat exported by the EU to Jordan have been minor in the past, but have risen twenty fold to about 100,000 tons after the EMA entered into force in 2003. The quantities of wheat exported to Syria are small as well. In addition, Syria usually applies MFN tariffs of less than 10% to wheat products. Therefore, Syria is not expected to become an important destination for EU wheat exports as a result of the EMA.
Evolution, Current State and Future of EU Trade Preferences… 131
For all these reasons it is likely that protection for agricultural products in the EU will continue to decline, and hence margins of preference will erode in the future. While valuable in the short run, the economic benefits potentially resulting from trade preferences granted by the EU will thus be of a transitory nature. For the EU, on the other hand, the remaining trade barriers against the MCs become less relevant due to the decreasing domestic EU price level. Against this background the questions arises as to whether cumbersome future negotiations towards a gradual extension of agricultural preferences granted to the MCs are a wise policy to pursue. Transaction costs involved in preferential trade are high, and accrue at many stages: in bilateral trade negotiations, in the administration of innumerable TRQs and high geographical and seasonal variations of tariffs, and at the level of trading companies which have to act in a rather nontransparent field of complex bilateral trade policies (Abbott 2002). In addition, the entry price system as well as the wide prevalence of TRQs lead to economic rents resulting in a waste of resources due to rent-seeking behavior and a non-optimal allocation of resources in production.
Given these high costs of product-specific and differentiated preferences, the full inclusion of MCs’ agricultural exports in a free trade area with the EU seems a worthy alternative. The effect on EU markets may be limited for many reasons. First, compared to an increasing EU market, the MCs are relatively small in terms of agricultural production. Agricultural GDP in the MCs is only about 17 per cent of that in the current EU-25 and the four accession candidates combined. Furthermore, natural resources, especially water, are rather scarce in most of the MCs and therefore put a limit on additional exports. Finally, transportation costs and increasing quality standards applied by EU importers limit the competitiveness of many MC products on EU markets. Garcia Alvarez-Coque (p. 408) states that "only a few countries … are able to export the quality products demanded by high- income consumers". Grethe (2004) arrives at a similar conclusion for Turkey where, in contrast to a priori expectations, full abolishment of EU market access barriers for fruits and vegetables would lead to only small gains in exports.
ACKNOWLEDGEMENTS The authors acknowledge research assistance provided by Marco Artavia Oreamuno and
very helpful comments from two anonymous reviewers. A predecessor of this article is published as Grethe and Tangermann (1999a).
REFERENCES
Abbott, P.C. Tariff-Rate Quotas: Failed Market Access Instruments? European Review of
Agricultural Economics. 1 (2002): 109-130. Attina, F. The Euro-Mediterranean Partnership Assessed: The Realist and Liberal Views.
European Foreign Affairs Review. 2 (2003): 181-200. Central Bureau of Statistics (2003). Statisitlite No. 35 – The Israeli Economy. Jerusalem,
December 2003. http://www.cbs.gov.il/statistical/is_eco_e.pdf, accessed 5 January 2005. Chemnitz, C., and H. Grethe. EU Trade Preferences for Moroccan Tomato Exports – Who
Benefits? Contributed paper at the XIth International Congress of the European

Harald Grethe, Stephan Nolte and Stefan Tangermann 132
Association of Agricultural Economists, "The Future of Rural Europe in the Global Agri-Food System", 23-27 August 2005, Copenhagen.
Commission of the European Communities. Council Decision on the signing, on behalf of the European Community, of the Euro-Mediterranean Agreement establishing an Association between the European Community and its Member States, of the one part, and the People's Democratic Republic of Algeria, of the other Part. COM(2002) 157 final, Brussels, April 2002a.
. Council Decision on the signing, on behalf of the European Community, of the Euro-Mediterranean Agreement establishing an Association between the European Community and its Member States, of the one part, and the Republic of Lebanon, of the other Part. COM(2002) 170 final, Brussels, June, 2002b.
European Central Bank. Monthly Bulletin – December 2004. Frankfurt am Main, December 2004. http://www.ecb.int/pub/pdf/mobu/mb200412en.pdf, accessed 6 January 2005.
. Monthly Bulletin – January 2002. Frankfurt am Main, December 2002. http://www.ecb.int/pub/pdf/mobu/mb200201en.pdf, accessed 6 January 2005
European Commission. External Relations: The Euro-Mediterranean Partnership. 2005. http://europa.eu.int/comm/external_relations/euromed/index.htm, accessed 19 January 2005.
European Union. Official Journal. Various issues. EUROSTAT. EEC External Trade. CD ROM version, various issues. FAO. Internet Database. http://apps.fao.org, accessed January 2005. GATT. Schedules of Market Access Concessions. Electronic version, Geneva 1994. Garcia-Alvarez-Coque, J.-M. Agricultural Trade and the Barcelona Process: Is Full
Liberalization Possible? European Review of Agricultural Economics. 3 (2002): 399-422. Grethe, H. Effects of Including Agricultural Products in the Customs Union between Turkey
and the EU. A Partial Equilibrium Analysis for Turkey. CeGE-Schriften, Center for Globalization and Europeanization of the Economy, Georg-August-Universität Göttingen, No. 9. Peter Lang Verlag, Frankfurt am Main, 2004. Also published at http://webdoc.sub.gwdg.de/diss/2004/grethe/index.html.
Grethe, H. and S. Tangermann. The New Euro-Mediterranean Agreements – An Analysis of Trade Preferences. In FAO (ed.), Expert Consultation on the Preparation for the Next Trade Negotiations on Agriculture, Report of a Meeting held in Rabat, Morocco, 9-11 December 1998, FAO Sub-Regional Office, Tunis, Tunisia. Reprinted as Discussion Paper 9901, Institute of Agricultural Economics, University of Göttingen. http://www.gwdg.de/~uaao. 1999a.
. The EU Import Regime for Fresh Fruit and Vegetables after Implementation of the Results of the Uruguay Round. In FAO (ed.), Expert Consultation on the Preparation for the Next Trade Negotiations on Agriculture, Report of a Meeting held in Rabat, Morocco, 9-11 December 1998, FAO Sub-Regional Office, Tunis, Tunisia. Reprinted as Discussion Paper 9902, Institute of Agricultural Economics, University of Göttingen. http://www.gwdg.de/~uaao. 1999b.
International Monetary Fund. IMF Country Report No. 03/31 – Cyprus: Selected Issues and Statistical Appendix. Washington D.C., February 2003. http://www.imf.org/external/pubs/cat/longres.cfm?sk=16336.0, accessed 4 January 2005.

Evolution, Current State and Future of EU Trade Preferences… 133
Jünemann, A. Six Years after: Reinvigorating the Euro-Mediterranean Partnership. In: Hanelt, C.-P. et al. (ed.). Europe's Emerging Foreign Policy and the Middle Eastern Challenge. Bertelsmann Foundation, 2002: 59-77.
Kommission der Europäischen Gemeinschaften. Vorschlag für einen Beschluß des Rates über die Unterzeichnung und die vorläufige Anwendung einiger Bestimmungen des Europa-Mittelmeer-Assoziationsabkommens zwischen der Europäischen Gemeinschaft und ihren Mitgliedstaaten einerseits und der Arabischen Republik Syrien andererseits im Namen der Europäischen Gemeinschaft. KOM(2004) 808 endg., Brussels, December 2004.
Nolte, S. From Lomé IV to Cotonou and EBA – An Analysis of Trade Preferences and Redistribution of Economic Benefits. M. Sc. Thesis. Göttingen, December 2002.
Pomfret, R. Mediterranean Policy of the European Community. A Study of Discrimination in Trade. 1986.
Radwan, S., and J.-L. Reiffers. The Impact of Agricultural Liberalization in the Context of the Euro-Mediterranean Partnership. FEMISE report, November 2003.
Riess, A., Vanhoudt, P. and K. Uppenberg. Further Integration with the EU: Just One Ingredient in the Reform Process. EIP Papers. 6 (2), The Mediterranean Region, a Special Report, 2001.
Skully, D. Economics of Tariff-Rate Quota Administration. USDA, ERS Technical Bulletin No. 1893, 2001.
World Bank. World Development Indicators Data Query. Washington D.C. 2005a. http://devdata.worldbank.org/data-query/, accessed 4 January 2005.
. Country at a Glance Tables – Malta at a Glance. Washington D.C. 2005b http://www.worldbank.org/cgi-bin/sendoff.cgi?page=%2Fdata%2Fcountrydata%2Faag%2Fmlt_aag.pdf, accessed at 4 January 2005.