Happiness at Work WHR 280217cep.lse.ac.uk/pubs/download/dp1474.pdf · 2 . Introduction . Happiness...
78
ISSN 2042-2695 CEP Discussion Paper No 1474 March 2017 Happiness at Work Jan-Emmanuel De Neve George Ward
Transcript of Happiness at Work WHR 280217cep.lse.ac.uk/pubs/download/dp1474.pdf · 2 . Introduction . Happiness...
ISSN 2042-2695
CEP Discussion Paper No 1474
March 2017
Happiness at Work
Jan-Emmanuel De Neve George Ward

Abstract Happiness is typically defined by how people experience and evaluate their lives as a whole. Since the majority of people spend much of their lives at work, it is critically important to gain a solid understanding of the role that employment and the workplace play in shaping happiness for individuals and communities around the world. In this paper, we focus largely on the role of work and employment in shaping people’s happiness, and investigate how employment status, job type, and workplace characteristics relate to measures of subjective wellbeing.
Keywords: subjective wellbeing, employment, job type, job characteristics JEL codes: I31
This paper was produced as part of the Centre’s Wellbeing Programme. The Centre for Economic Performance is financed by the Economic and Social Research Council.
Acknowledgements We are grateful to John Helliwell, Richard Layard, Andrew Clark, Valerie Moller and Shun Wang for useful comments and valuable suggestions. We thank the Gallup Organization for providing access to the Gallup World Poll data set. De Neve serves as a Research Advisor to Gallup. Support from the US National Institute on Aging (Grant R01AG040640), the John Templeton Foundation and the What Works Centre for Wellbeing is gratefully acknowledged.
Jan-Emmanuel De Neve, Saïd Business School, University of Oxford and Centre for Economic Performance, London School of Economics. George Ward, Institute for Work and Employment Research, MIT and Centre for Economic Performance, London School of Economics.
Published by Centre for Economic Performance London School of Economics and Political Science Houghton Street London WC2A 2AE
All rights reserved. No part of this publication may be reproduced, stored in a retrieval system or transmitted in any form or by any means without the prior permission in writing of the publisher nor be issued to the public or circulated in any form other than that in which it is published.
Requests for permission to reproduce any article or part of the Working Paper should be sent to the editor at the above address.
J-E. De Neve and G. Ward, submitted 2017.

2
Introduction
Happiness is typically defined by how people experience and evaluate their lives as a whole.1
Since the majority of people spend much of their lives at work, it is critically important to gain a
solid understanding of the role that employment and the workplace play in shaping happiness for
individuals and communities around the world.
In this chapter, we focus largely on the role of work and employment in shaping people’s
happiness, and investigate how employment status, job type, and workplace characteristics relate
to measures of subjective wellbeing. Nevertheless, it is important to note from the onset that the
relationship between happiness and employment is a complex and dynamic interaction that runs
in both directions. Recent research shows that work and employment are not only drivers of
happiness, but that happiness can also itself help to shape job market outcomes, productivity, and
even firm performance.2
The overwhelming importance of having a job for happiness is evident throughout the analysis,
and holds across all of the world’s regions. When considering the world’s population as a whole,
people with a job evaluate the quality of their lives much more favorably than those who are
unemployed. The importance of having a job extends far beyond the salary attached to it, with
non-pecuniary aspects of employment such as social status, social relations, daily structure, and
goals all exerting a strong influence on people’s happiness.
The importance of employment for people’s subjective wellbeing shines a spotlight on the
misery and unhappiness associated with being unemployed. In this chapter, we delve into
unemployment and build on the existing research literature to show empirically that individuals
do not adapt over time to becoming unemployed and that unemployment can even have a
“scarring” effect after regaining employment. The data also show that high unemployment has
spillover effects, and negatively affects everyone - even those who are employed. These results
are obtained at the individual level but they also come through at the macroeconomic level, with
national unemployment levels correlating negatively with average national wellbeing across the
world.

3
We also consider how happiness relates to the types of job that people do. The overarching
finding on job type is that data from around the globe reveal an important difference in how
blue-collar and white-collar jobs are related to happiness. Even when accounting for any relevant
covariates between these two broad categories of job type, we find that blue-collar labor is
systematically correlated with lower levels of happiness, and that this is true of all labor-
intensive industries such as construction, mining, manufacturing, transport, farming, fishing, and
forestry.
In addition to considering happiness differentials between broad categories of job type, we also
study job quality by focusing on more specific workplace characteristics and how they relate to
employees’ happiness. As might be expected, we find that those in well-paying jobs are happier
and more satisfied with their lives and their jobs, but a number of further aspects of people’s jobs
are strongly predictive of varied measures of happiness. Work-life balance emerges as a
particularly strong predictor of people’s happiness. Further factors include job variety and the
need to learn new things, as well the level of individual autonomy enjoyed by the employee.
Moreover, job security, and social capital (as measured through the support one receives from
fellow workers) are also positively correlated with happiness, while jobs that involve risks to
health and safety are generally associated with lower levels of subjective wellbeing.
The data used in this chapter are drawn mainly from the Gallup World Poll, which covers over
150 countries worldwide and is representative of 98% of the world’s population. Nationally
representative samples of people for these countries have been surveyed for most years
beginning in 2006. These surveying efforts allow the analyses reported in this chapter to
incorporate hundreds of thousands of individual responses that enable us to investigate how
employment status and job type measures relate to the wellbeing of respondents. The Gallup
World Poll is complemented by the European Social Survey for the analysis of how more
specific workplace characteristics relate to happiness, and the German Socio-Economic Panel is
used to illustrate dynamics surrounding unemployment and happiness over time.
For the sake of ease, we use the terms happiness and wellbeing interchangeably. However,
important differences exist between the different elements that make up subjective wellbeing,

4
and how these relate to employment characteristics. Such differences are captured in this chapter
by systematically using a number of measures: life evaluation (by way of the Cantril “ladder of
life”3), positive4 and negative5 affect to measure respondents’ experienced positive and negative
wellbeing, as well as the more domain-specific items of job satisfaction6 and employee
engagement7. We find that these diverse measures of subjective wellbeing correlate strongly with
each other, but that there are nevertheless important differences in how they relate to aspects of
work and employment. For example, we find that being self-employed is associated with higher
overall life evaluation in most developed nations, but that self-employment is also associated
with the heightened experience of negative emotions such as stress and worry.
We conclude the chapter by emphasizing the main results and by suggesting a number of
possible subsequent avenues for researchers and policy-makers to consider. Given the
importance of employment for happiness, it is evident that even more weight ought to be given
to fostering employment, as well as protecting people against the damaging effects of
joblessness. Moreover, policies that promote high quality jobs could be stimulated by, for
example, incentivizing employers who provide jobs with working conditions that are conducive
to people’s wellbeing. The results reported in this chapter provide new empirical evidence for
such policies in a global context.
Employment status and subjective wellbeing around the world
In Figure 1 we present differences in the self-reported wellbeing of individuals around the world
according to whether or not they are employed. The bars measure the subjective wellbeing of
individuals of working age8 who are employed (either for an employer or for themselves
regardless of whether they work full-time or part-time) and those who are currently unemployed.
In all cases where we present either global or regional averages such as these, we weight the
averages by national population.9 As can be seen, the difference in average subjective wellbeing
between having and not having a job is very large indeed. This is the case regardless of whether
one considers wellbeing measures that gauge life evaluation or positive and negative affective
states. In fact, the employed evaluate the quality of their lives around 0.6 points higher on
average as compared to the unemployed on a scale from 0 to 10. Equally noteworthy is that

5
individuals who are unemployed report approximately 30 percent more negative affective
experiences as compared to individuals that are employed. The notion that employment matters
greatly for the wellbeing of individuals is one of the most robust results to have come out of the
economic study of human happiness.10
Figure 1 presents simply the raw wellbeing differentials between those in and out of work. These
descriptive statistics are corroborated in the regression analyses, which break employment status
into finer categories and consider men and women as well as different regions separately. Here
we are able to control for a number of additional variables in a multivariate regression analysis
that may be related to both labor market outcomes as well as subjective wellbeing. These are
gender, age (and its squared term), level of education, (the natural logarithm of) income, marital
status, and household composition. These variables are included in order to avoid so-called
‘omitted variable bias,’ in case these demographic variables might be driving both employment
and happiness and thus lead us to false conclusions on the relationship between work and
wellbeing. Moreover, these regressions incorporate country and year fixed-effects in order to
account for the many political, economic, and cultural differences between countries as well as
year-to-year variation that would otherwise cloud our interpretation of the relationship between
employment and happiness.
In all of our regression analyses throughout the chapter, we standardize the various outcome
variables such that they each have a mean of 0 and a standard deviation of 1 in the whole sample.
This enables us to more easily compare the magnitude of the coefficients across the different
outcomes. The coefficients on each of the employment status indicator variables in Table 1
estimate the difference in standard deviation units of each of the three outcome variables (life
evaluation, positive affect, and negative affect) associated with holding that status, as compared
to being employed full-time for an employer, controlling for income as well the other
demographic variables noted above.

6
As can be seen, the unemployed evaluate the overall state of their lives less highly on the Cantril
ladder and experience more negative emotions in their day-to-day lives as well as fewer positive
ones. These are among the most widely accepted and replicated findings in the science of
happiness.11 Here, income is being held constant along with a number of other relevant
covariates, showing that these unemployment effects go well beyond the income loss associated
with losing one’s job.12
While we are able to control for a number of confounding variables in this analysis, one further
important methodological concern is the possibility of so-called ‘reverse causality.’ Indeed, as
noted, there is some evidence that the relationship between employment and happiness is
dynamic in nature and may run in both directions. That is to say that happier individuals may be
somewhat more likely to obtain employment in the first place or that unhappy people may be
more likely to lose their jobs.13 This means that the cross-sectional results reported in this
chapter - and much of the related literature - cannot be interpreted causally and require this
important caveat. Nevertheless, while this important methodological proviso needs to be noted, a
number of studies have shown that the damaging effects of unemployment remain large in
within-person longitudinal analyses, which hold constant an individual fixed effect,14 while
others have leveraged external employment shocks - namely plant closures - to further
demonstrate the causal effects of unemployment on subjective wellbeing.15
If unemployment is so bad, what about part-time work? As one might expect, much depends
here on whether one actually wants to work any more hours. If the respondent is underemployed
- that is, is seeking to work more hours than they currently do - then, in line with intuition, there
remains some scope for happiness gains through increasing their employment. This is not the
case for individuals who report actually preferring to be part-time employed. In fact, part-time
employed individuals who do not seek more hours of work report greater happiness and less
negative experiences (such as stress and worry) as compared to full-time employed people,
controlling for income and other confounding variables. As will be noted later, this particular
finding applies mostly to women rather than men.

7
Being self-employed has a complex relationship to wellbeing.16 While the global data indicate
that self-employment is generally associated with lower levels of happiness as compared to being
a full-time employee, the follow-up analyses reported later in this chapter show that this very
much depends on the region of the world that is being considered as well as which measure of
subjective wellbeing is under consideration.
In Figure 2 and Table 2 we investigate whether the relationship between employment and
wellbeing varies by gender. Being of working age and out of the labor force has a different
effect on the subjective wellbeing of men and women. The data suggest that not participating in
the labor market (for example by being a stay-at-home parent, being out of the labor force
through disability, or being retired) is worse for the happiness of men than it is for women. Both
men and women of working age who are out of the labor force evaluate their lives more
negatively than those in full-time work, but the effect is much stronger for men. Moreover,
while men in this situation experience higher negative and lower positive affect, there is no
statistically significant difference between the daily emotional experiences of women who are
out of the labor force and those who are full-time employees.
In line with the existing body of research, the results indicate that unemployment is devastating
for the wellbeing of both men and women. Nevertheless, the effects of joblessness tend to be felt
more strongly by men. One further notable gender difference regards part-time work. Women
who work part-time but who do not wish for any more hours experience fewer negative affective
states (such as stress and worry) in their day-to-day lives and more positive ones as compared to
full-time employed women, whereas the same is not the case for men.
In Figure 3 and Table 3 we investigate whether the relationship between employment and
wellbeing varies by world region.17 As can be seen in Figure 3, across all of the world regions,

8
we find that individuals in employment generally report higher life evaluation and positive affect
than those who are unemployed. The unemployed also report more negative affective
experiences across all regions around the world. The magnitude of the regression coefficients on
being unemployed reported in panel A of Table 3 does, however, indicate that the strength of the
relationship to life evaluation is less pronounced in South Asia and Southeast Asia. Furthermore,
panel B in Table 3 shows that for these two regions there does not appear to be a statistically
significant relationship between unemployment and positive affective experiences, although
panel C in Table 3 notes a significantly higher level of negative affective experiences.
In terms of self-employment, the results reveal an interesting reversal across regions. Being self-
employed tends to be associated with higher life evaluation and positive affect (as compared to
being a full-time employee) across Europe, North America, Australia, New Zealand, the
Commonwealth of Independent States, and East Asia. However, individuals that are self-
employed in Latin America, the Caribbean, and Sub-Saharan Africa tend to report lower life
evaluation and less positive affective experience. Interestingly, however, although in some
regions self-employment is associated with higher levels of life evaluation, most regions do
converge in terms of showing that employing oneself and running one’s own business is
generally associated with the experience of more negative emotions such as stress and worry.18
Unemployment dynamics and spillovers
Unemployment is damaging to people’s happiness, but how short-lived is the misery associated
with being out of work? People tend to adapt to many different circumstances, and
unemployment may well be one of them. If the pain is only fleeting and people quickly get used
to being unemployed, then we might see joblessness as less of a key public policy priority in
terms of happiness. However, a number of studies have demonstrated that people do not adapt
much, if at all, to being unemployed.19 We cannot show this dynamic using the Gallup World
Poll, which provides repeated snapshots of countries across the world, but we can instead look to
9
longitudinal data from the German Socio-Economic Panel, which has each year since 1984
surveyed and re-surveyed the same large random sample of the German population.
We are interested in two issues here: adaptation and scarring. First, in Figure 4 we investigate
whether people adapt to being jobless as they spend longer and longer out of work.20 As can be
seen, there is a large initial shock to becoming unemployed, and then as people stay unemployed
over time their levels of life satisfaction remain low. A second issue is scarring: several studies
have shown that even once a person becomes re-employed, the prior experience of
unemployment leaves a mark on his or her happiness. Comparing people who are both in work,
those who have recently experienced a bout of unemployment are systematically less happy than
those who have not.21
As we have seen, being out of a job is detrimental to the subjective wellbeing of the unemployed
themselves. What about everyone else? A further canonical finding in the literature on
unemployment and subjective wellbeing is that there are so-called “spillover” effects.22 As we
will see in more detail below when we come to examine the effects of specific job
characteristics, job security is a key driver of subjective wellbeing.23 High levels of
unemployment can have an indirect effect on those who remain in work, as they increase fear
and heighten the sense of job insecurity. Poor labor market conditions tend to signal to those in
work that layoffs are relatively commonplace and that they may well be next in line to lose their
jobs.24
We can investigate this by turning our attention back to the Gallup World Poll data. We can see
in Table 4 that, controlling for one’s own employment status, the unemployment of one’s peers
enters negatively into a subjective wellbeing equation. The unemployment rate is calculated here
as the fraction of the labor force unemployed within the respondent’s gender, age group (20s,
30s, and so on), country, and year. The negative effect of peers’ joblessness can be seen in
columns 1 and 2, with the comparison unemployment rate having a negative effect on life
evaluation. An interesting new finding here, however, is that while the overall evaluative
subjective wellbeing of those who are not unemployed seems to be negatively affected by others’
unemployment, their day-to-day experience of life does not seem to be similarly affected in
models 3-6 which investigate effects on positive and negative affect.

10
Although higher unemployment rates have negative spillovers for those still in work, the third
row of Table 4 shows the opposite may be true for those who are out of work. This so-called
“social norm” effect has been widely shown in the literature.25 For the unemployed, the
individual effects of unemployment are less strongly felt in situations where the local
unemployment rate is higher, as in areas of high unemployment, the social stigma of
unemployment may be lessened while it may also be easier to find social contacts. Much of the
existing evidence is focused on a handful of countries and finds significant effects only for men.
We are able to show here in a worldwide sample that this social norm effect is present for both
men and women: unemployed people evaluate their lives less negatively on the Cantril ladder,
the higher the comparison unemployment rate. They also experience fewer negative and more
positive emotions in their day-to-day lives. It is worth noting, however, that even at
conventionally high levels of unemployment, the overall effect of being unemployed on the
individual is still very much negative across all three measures of subjective wellbeing.
Our analyses have thus described the damaging effects of unemployment on the individual as
well as the negative spillover effects on those around them. This raises the question of whether
these broadly negative effects of unemployment also show up in the macroeconomic data. High
levels of unemployment have an indirect effect on those who remain in work because they
heighten the sense of job insecurity, since generally poor labor market conditions signal to those
in work that redundancies are relatively commonplace. If this is the case, we may be able to
detect this in the relationship between the unemployment rate and the average wellbeing in a
society. Figure 5 shows a scatterplot that maps average wellbeing for most countries in the world
against their unemployment rate.26
Although any such bivariate treatment of the relationship between national wellbeing and
unemployment is necessarily limited in nature, in line with the analyses that focus on the
individual impact of falling unemployed we find a generally negative correlation between
unemployment rates and societal wellbeing at the national level. In an online appendix (Figure
A8), the same cross-sectional relationship is reported by world region. These regional results
mostly corroborate the generally negative relationship between national unemployment and
subjective wellbeing, with the exceptions of Southeast Asia and Sub-Saharan Africa. The global
relationship depicted in Figure 5 is not only found in most regions, but is also present across the
entities that make up large nations. For example, it has analogously been shown that this cross-
sectional relationship between unemployment rates and average wellbeing is also found when
considering the separate states that make up the United States of America.27

11
Subjective wellbeing and job type
In addition to investigating the importance of having a job, the data also allow us to ask whether
different types of jobs are associated with higher or lower levels of subjective wellbeing. The
availability of eleven different job types in the Gallup World Poll allows us to gain a sense for
which types of employment are perhaps more or less associated with happiness across the world.
The available categories cover many kinds of jobs, including being a business owner, office
worker, or manager, and working in farming, construction, mining, or transport.
Figure 6 represents the descriptive data on how these varied broad job types relate to our three
main measures of subjective wellbeing - life evaluation, positive affect, and negative affect. The
overarching finding here is that the global data reveal an important difference in how blue-collar
and white-collar work are related to happiness (also when controlling for any differences in
income, as shown below). We find that labor-intensive work is systematically correlated with
less happiness and this is the case across a number of labor-intensive industries such as
construction, mining, manufacturing, transport, farming, fishing, and forestry. In fact, people
around the world who categorize themselves as a manager, an executive, an official, or a
professional worker evaluate the quality of their lives at a little over 6 out of 10 whereas people
working in farming, fishing, or forestry evaluate their lives around 4.5 out of 10 on average. A
very similar picture is obtained when considering not only life evaluation but also the day-to-day
experience of positive affective states such as smiling, laughing, enjoyment, or feeling well
rested. The data also show the situation is similar when considering negative affective states such
as feelings of worry, stress, sadness, and anger. Here we find that professionals in senior roles
(manager, executive, or official) experience fewer negative affective states as compared to all
other job types.
It is worth noting that we are considering average effects in all of our analyses. While
individuals doing some types of jobs are generally more or less happy on average than those
doing another type, there will be individual heterogeneity in these effects that we are not able to
investigate fully in our analysis. People differ in their interests and personalities, among other
things, and a large literature for example on ‘job fit’ suggests there are few jobs that would be
ideal for everyone - certain types of people are best suited to and more able to flourish in
different types of jobs.28

12
It is also of interest to note that classic economic theory would suggest that there should be little
difference in the happiness or utility of people with different types of jobs, holding constant their
skill level. This is because so-called “compensating wage differentials” or “equalizing
differences” should balance the happiness levels associated with the types of jobs that an
individual chooses to take on.29 That is to say that people willing to take on a job that they
anticipate is not going to make them happy should be compensated monetarily to the extent that
it should at least compensate for the unhappiness associated with that particular job as compared
to another job that would have made them happier but with a lower pay attached to it. The
empirical case for the existence of such compensating wage differentials is mixed30, and while
we do not directly address this point in our analysis, we do not appear to observe a strong
presence of such compensating differentials in the global data employed here.31
The descriptive statistics shown in Figure 6 represent the raw differences in happiness across job
types. Of course, there are likely to be many things that differ across people working in these
diverse fields that could potentially be driving these happiness differentials. If we want to have a
more precise view of how varied job types actually relate to happiness than we need to hold constant the confounding variables such as the different wages associated with different job
types as well as the age, gender, marital status, and education level of the individual. To account
and control for these and other differences we also report a multiple regression analysis in Table
5. In terms of life evaluation and positive affect, these regressions replicate the descriptive
statistics shown above. Senior professionals (manager, executive, official) evaluate their lives
higher and report more positive affective experiences. The self-reported happiness of office
workers (clerical, sales, or service) is significantly lower than their senior colleagues, even
controlling for income and other covariates. We find that the association of being in labor-
intensive jobs and wellbeing is even greater still.

13
In an online appendix (Figures A1-3), we also split these descriptive and statistical analyses on
job type and happiness by gender. Although some small differences can be observed, these
analyses do little to alter the interpretations from the general trends reported above. The same
cannot quite be said of the relationship between job type and happiness, however, when we split
the analysis by the world’s different regions. As shown in Figure 7, there are some clear
differences in life evaluation across regions and job types as is to be expected, but the trends are
somewhat less streamlined as compared to the globally pooled data that was reported on above.
Other things equal, senior professionals report the highest life evaluation across all regions (at
the notable exception of farming/forestry/fishing workers in North America, Australia, and New
Zealand who report equal or higher life evaluation and positive affect). Office workers and
manual laborers report lower life evaluation, a trend most pronounced in the MENA, East Asia,
and Latin American regions in particular. The figures that represent the relation between job type
and positive affect and negative affect are given in the online appendix, along with
accompanying multiple regression tables by region.
The World Happiness Report is mostly concerned with how people experience and evaluate their
lives as a whole, rather than domain-specific wellbeing outcomes. The academic literature on the
relationship between work and wellbeing, however, has for a long time also considered other
measures of wellbeing. The notion of job satisfaction has been widely studied in particular, and
more recently the literature has begun to investigate other outcomes such as employee
engagement.32 The Gallup World Poll contains data on both of these domain-specific wellbeing
items, and in Table 6 we report the correlations between the measures of job satisfaction and
employee engagement and the subjective wellbeing items that we have employed so far. All
these measures correlate with each other to varying degrees and mostly in line with intuition.
Being satisfied (as opposed to dissatisfied) with your job is strongly correlated with the Cantril
ladder measure of life evaluation, whereas feeling actively engaged with your job is more
strongly correlated with positive affect. The strongest relationship across all of these measures of
general and workplace wellbeing is that feeling ‘actively disengaged with one’s job’ is most
strongly correlated with low job satisfaction. Whereas in Table 6 we correlate these measures
with each other using individual-level responses, in appendix table A5 we also examine the
correlation of these variables when we consider the unit of analysis to be country-year and look
at the correlation of these national average wellbeing measures.
Job satisfaction and employee engagement around the world

14
In Figure 8 we map average job satisfaction around the world. Here we color nations around the
globe according to job satisfaction. Unlike the general wellbeing measures that elicit a broader
scale of responses, the data on job satisfaction refers to a simpler yes/no question. We map the
percentage of respondents in work by who reported to be “satisfied” (as opposed to
“dissatisfied”) with their job.33 The resulting picture provides a general sense for job satisfaction
around the world indicating that countries across North and South America, Europe, and
Australia and New Zealand typically see more individuals reporting satisfaction with their jobs.
In an online appendix (Table A13), we provide more detailed information on the levels of job
satisfaction around the world.
In Figure 9 we move on to consider the global distribution of employee engagement. This
survey measure in the Gallup World Poll asks whether individuals feel ‘actively engaged,’ ‘not
engaged,’ or ‘actively disengaged’ in their jobs. The results paint a bleak picture of employee
engagement around the world. The number of people noting that they are actively engaged is
typically less than 20%, while being around 10% in Western Europe, and much less still in East
Asia.
The difference in the global results between job satisfaction and employee engagement may
partially be attributable to measurement issues, but it also has to do with the fact that both
concepts measure different aspects of happiness at work. While job satisfaction can perhaps be
reduced to feeling content with one’s job, the notion of (active) employee engagement requires
individuals to be positively absorbed by their work and fully committed to advancing the
organization’s interests. Increased employee engagement thus represents a more difficult hurdle
to clear.
The generally low worldwide levels of employee engagement may also underlie why many
people do not report being happy while at work. In fact, a recent study collected data from
individuals at different times of the day via a smartphone app.34 Troublingly, the authors found
that paid work is ranked lower than any of the other 39 activities individuals can report engaging
in, with the exception of being sick in bed. The more precise extent to which people are unhappy
at work varies with where they work, whether they combine work with other activities, whether
they are alone or with others, and the time of day or night that respondents are working.

15
We also consider how the varied job types studied above are related to measures of job
satisfaction and employee engagement. Figure 10 paints a picture for the relationship between
job type and job satisfaction that closely tracks the trends that were reported earlier for the links
between job type and the more general measures of subjective wellbeing. Senior professionals
report much greater job satisfaction as compared to all other job types. The relationship between job type and employee engagement reveals an interesting and important difference with all other
wellbeing measures looked at so far in relation to job type. Figure 11 shows clearly that business
owners report being much more actively engaged at work as compared to all other job types.
When considering job satisfaction and engagement across the world’s regions in Figures 12 and
13, we observe the same general trends that were inferred from the global data. It is worthwhile
to note, however, that some regions see much starker differences in job satisfaction between job
types. For example, in Central and Eastern Europe and in the MENA region we find that about
90% of senior professionals report being satisfied with their job whereas this number drops to
little over 60% for workers in the farming, fishing, or forestry industries. No such large
differentials in job satisfaction are found in Western Europe or North America, Australia, and
New Zealand. In terms of job engagement statistics, Figure 13 indicates that the outlier remains
being a business owner across most regions with the exception of South and Southeast Asia.
Tables 7 and 8 report regression results of the relationships between job types and job
satisfaction and engagement by region, controlling for the usual set of income, demographic
variables, as well as country and year fixed effects. Notwithstanding the introduction of the
control variables, we find that the results largely mirror the descriptive statistics, the main
exception being that the correlation between being a business owner and being actively engaged
is now only statistically significant for Western Europe and Central and Eastern Europe. In an
online appendix (Figures A4-5) we also split these descriptive statistics on job type and job
satisfaction and engagement by gender. The separate findings for men and women do not lead us
to largely different interpretations from the general trends reported above.

16
Job characteristics and subjective wellbeing
We now turn to look more closely at job quality. We have seen that being in work is a strong
predictor of higher subjective wellbeing and that certain broad types of jobs are associated with
higher and lower levels of individual happiness, even once we control for confounding variables
such as income and education. But what is it specifically about these different types of jobs that
produce different levels of wellbeing across individuals?
In order to answer this question more precisely we draw on data from the European Social
Survey (ESS), which benefits from more detailed questions about job characteristics together
with several measures of subjective wellbeing. What ultimately makes for a ‘good job?’ For a
long time the answer to this important question was simply how much the job paid, and
occasionally also how many hours of labor it entailed. The ever-increasing amount of survey
data available now allows us to go much further than this, and ask what particular aspects of a
job are most predictive of different measures of wellbeing. In the ESS, for example, respondents
who are in work are asked about the amount of variety their job entails, how much autonomy
they have in how they carry out their work, how much support they receive from co-workers
around them, along with a number of further job characteristics.
By regressing subjective wellbeing measures on such measures of work design, together with
earnings and a number of other demographic variables, we are able to infer what matters most to
people in their working lives. This is a distinctly democratic way of investigating what exactly
makes a ‘good job.’ Rather than impose certain ideas about which characteristics are most
important in a job, using multivariate regression analysis in this way we allow workers
themselves to determine which aspects of their jobs are the biggest drivers of their wellbeing.
Much of the literature in this vein focuses on the elements of jobs that correlate with job
satisfaction35, but it is also important to know what elements of people’s jobs ultimately feed
through into how they evaluate their lives as a whole, as well how job characteristics affect the
emotional states that people experience as they proceed through their lives. We thus follow
much of the existing literature in estimating job satisfaction equations, but also investigate the
effects of job characteristics on life satisfaction, general happiness “taking all things together,” as
well as a positive affect measure referring to emotions felt in “the last two weeks.”36

17
In line with the literature and general intuition, we find that higher wages are indeed predictive
of greater wellbeing. Those in well-paying jobs are happier and more satisfied with their lives
and jobs than those in the lower income brackets. The relationship is roughly log-linear,
however, suggesting that there are diminishing returns to higher income: an extra $100 of salary
is worth much more to someone at the lower end of the income distribution than someone
already earning much more. It is still striking that a number of further aspects of people’s jobs
are strongly predictive of the different measures of subjective wellbeing even once we condition
upon log earnings.
As always, these regressions control for a standard set of demographic variables, but here we
also control for industry as well as occupation dummies. That is, when we ask about having a
lesser or greater amount of a specific job characteristic - be it autonomy, security, co-worker
support, or whatever else - we are comparing workers who have the same occupation and who
work in the same industry.
What is important, beyond income? Work-life balance comes out in Table 9 as perhaps the
strongest workplace driver of an individual’s subjective wellbeing. This turns out to be true
across the board, in terms of people’s life and job satisfaction, general happiness, and moment-
to-moment emotional experiences. Those who have a job that leaves them too tired to enjoy the
non-work elements of their lives report levels of positive affect in their day-to-day lives that are
substantially lower than those who do not. Furthermore, workers who report that their job
interferes with their ability to spend time with their partner and family, as well as those who
“bring their job home” with them by worrying about work matters even when they are not at
work, report systematically lower levels of subjective wellbeing across all four measures,
controlling as always the usual covariates, including the level of remuneration they receive and
the number of hours they work per week.
We can also see in Table 9 that the content of the job is important. Those with jobs that entail
high levels of variety and the need to learn new things are more satisfied with their lives and
their jobs and experience more positive emotions day-to-day. Further, individual autonomy in
the workplace is a significant driver of happiness: having control over how the workday is

18
organized as well as the pace at which the employee works is positively correlated with higher
wellbeing outcomes. Conversely, those with jobs that involve risks to their health and safety
generally score worse on the measures of subjective wellbeing captured in this survey.
Social capital in the workplace is even more important. The level of support that a worker
receives from his or her fellow workers is very strongly predictive of all four measures of
subjective wellbeing in the sample, as is being able to have a say in policy decisions made by the
organization for which the employee works. Furthermore, workers who report being a member
of a trade union are generally more satisfied with their jobs, though the differential in life
satisfaction as well as positive affect between union and non-union workers is statistically
insignificant in the sample.
As we saw earlier in our discussion of the spillover effects of unemployment, job security is a
robust driver of individual wellbeing. Those who feel their livelihood is at risk systematically
report lower levels of subjective wellbeing than those who report having high levels of perceived
job security. Connected to this is the notion of being able to ‘get on in life’: those who feel they
have a job that has good opportunities for advancement and promotion - even controlling for
their current level of remuneration and the current content of their job - feel more satisfied with
their jobs and lives and also tend to experience more positive affective states.
Finally, bosses have been shown to be important. Although the data does not permit us here to
measure and quantify the importance of who one’s boss is and how he or she affects one’s
wellbeing, recent work has demonstrated that bosses and supervisors can play a substantial role
in determining subjective wellbeing. In particular, the competence of bosses has been shown to
be a strong predictor of job satisfaction, even controlling for individual fixed effects in a
longitudinal analysis that follows people who stay in the same job as their boss gains (or loses)
competence over time. 37

19
Conclusion
As has been shown in the various editions of the World Happiness Report, national levels of
subjective wellbeing vary greatly across the globe. The different kinds of work that people in
different corners of the world do may well contribute in some way to these cross-country
differentials. After all, work makes up such an important part of our lives. The structure of
economies differs a great deal, both across countries at any one point in time as well as within
countries as they develop over time. Thus the kind of work that people actually engage in during
their days differs greatly - whether they sit in offices, work on production lines, or work in the
fields - and this can be a potentially contributing factor to the global differences in wellbeing that
we observe.
We also considered how happiness is related to the broad type of job being performed. The
principal result on job type is that data from around the world reveal a significant difference in
how manual and non-manual labor are related to happiness. Even when accounting for relevant
covariates between these two broad categories of job type, we found that blue-collar work is
systematically correlated with less happiness. We also investigated job quality more closely by
looking at specific workplace characteristics and how they relate to happiness. Well-paying jobs
are conducive to happiness, but this is far from being the whole story. A range of further aspects
were found to be strongly predictive of varied measures of happiness; some of the most
important job factors that were shown to be driving subjective wellbeing included work-life
balance, autonomy, variety, job security, social capital, and health and safety risks.
This chapter has aimed to bring an empirical perspective to the relationship between happiness
and employment, job type, and job characteristics around the world. Throughout the world,
employed people evaluate the quality of their lives much higher than those who are unemployed.
The clear importance of employment for happiness emphasizes the damage that unemployment
can do. As such, this chapter delved further into the dynamics of unemployment to show that
individuals’ happiness adapts very little over time to being unemployed and that past spells of
unemployment can have lasting impact even after regaining employment. The data also showed
that rising unemployment negatively affects everyone, even those still employed. These results
are obtained at the individual level, but they also come through at the macroeconomic level, with
national unemployment levels being negatively correlated with average national wellbeing across
the world.

20
The results and inferences drawn from the available data are far from exhaustive but aim to
inspire further research as well as provide some empirical guidance to employees, employers,
and policy-makers. Given the importance of employment for happiness, it is evident that even
more weight could be given to fostering employment. Equally, policies aimed at helping people
to manage the non-monetary as well as the monetary difficulties associated with being
unemployed, in addition to helping them back into work, will likely help to raise societal
wellbeing. In addition to the quantity of jobs, policy instruments can be used to encourage
employers to improve the quality of jobs. In turn, recent research suggests that high levels of
worker wellbeing may even lead to gains in productivity and firm performance,38 a finding that
points toward the benefits of engaging in what might be called ‘high-road’ employment
strategies conducive to employee wellbeing. Generally, the analyses reported in this chapter
provide additional empirical evidence for the merit of policies that focus on both the quantity and
the quality of employment to support worldwide wellbeing.

21
References
Artz, B. M., Goodall, A. H., & Oswald, A. J. (2016). Boss competence and worker wellbeing. Industrial and Labor Relations Review, forthcoming.
Blanchflower, D., & Oswald, A.J. (2004). Wellbeing over time in Britain and the USA. Journal of Public Economics, 88, 1359– 1386.
Bockerman, P., & Ilmakunnas, P. (2012). The Job Satisfaction-productivity Nexus: A Study Using Matched Survey and Register Data. Industrial and Labor Relations Review, 65 (2), 244–262.
Bonhomme, S., & Jolivet, G. (2009). The pervasive absence of compensating differentials. Journal of Applied Econometrics, 24 (5), 763-795.
Bryson, A., & Mackerron, G. (2017). Are you happy while you work? The Economic Journal, 127(599), 106–125.
Clark, A.E. (2003). Unemployment as a Social Norm: Psychological Evidence from Panel Data. Journal of Labour Economics, 21, 323-351.
Clark, A.E. (2010). Work, Jobs and Well-Being Across the Millennium. In E. Diener, J. Helliwell, and D. Kahneman (Eds.), International Differences in Well-Being. Oxford: Oxford University Press.
Clark, A.E., & Oswald A.J. (1994). Unhappiness and Unemployment, Economic Journal, 104, 648-659.�
Clark, A.E., Diener, E., Georgellis, Y. & Lucas, R. (2008). Lags and Leads in Life Satisfaction: A Test of the Baseline Hypothesis. Economic Journal, 118, F222–F243.
Clark, A., Georgellis, Y., & Sanfey, P. (2001). Scarring: The psychological impact of past unemployment. Economica, 68(270), 221-241.
Clark, Andrew E., & Georgellis, Y. (2013). Back to baseline in Britain: adaptation in the British household panel survey. Economica, 80.319: 496-512.
De Neve, J.-E., & Oswald, A.J. (2012). Estimating the influence of life satisfaction and positive affect on later income using sibling fixed-effects. Proceedings of the National Academy of Sciences, 109(49), 19953-19958.
Di Tella, R., R, MacCulloch, & Oswald A.J. (2001). Preferences over Inflation and Unemployment: Evidence from Surveys of Happiness, American Economic Review, 91, 335-341.
Edmans, A. (2011). Does the Stock Market Fully Value Intangibles? Employee Satisfaction and Equity Prices. Journal of Financial Economics, 101(3), 621-640.
Eisenberg, P., & Lazarsfeld, P. (1938). The psychological effects of unemployment.

22
Psychological Bulletin, 35, 358-390.
Freeman, R. B. (1978). Job Satisfaction as an Economic Variable. The American Economic Review, 68(2), 135-141.
Harter, J. K., Schmidt, F. L., & Hayes, T. L. (2002). Business-unit-level relationship between employee satisfaction, employee engagement, and business outcomes: A meta-analysis, Journal of Applied Psychology, 87(2), 268-279.
Harter, J. K., Schmidt, F. L., & Keyes, C. L. (2003). Wellbeing in the workplace and its relationship to business outcomes: A review of the Gallup studies. Flourishing: Positive psychology and the life well-lived, 2, 205-224.
Helliwell, J.F., & Haifang, H. (2014). New measures of the costs of unemployment: Evidence from the subjective well-being of 3.3 million Americans. Economic Inquiry, 52(4), 1485-1502.
Judge, T. A., Thoresen, C. J., Bono, J. E., & Patton, G. K. (2001). The Job Satisfaction-Job Performance Relationship: A Qualitative and Quantitative Review. Psychological Bulletin, 127(3), 376-407.
Kassenboehmer, S.C., & Haisken-DeNew, J.P. (2009). You're fired! The causal negative effectof entry unemployment on life satisfaction. The Economic Journal, 119: 448-462.
Knabe, A., & Rätzel, S. (2011). Scarring or Scaring? The psychological impact of past unemployment and future unemployment risk. Economica, 78(310), 283-293.
Kristof-Brown, Amy L., Ryan D. Zimmerman, and Erin C. Johnson. (2005) Consequences of individual's fit at work: A meta-analysis of person-job, person-organization, person-group, and person-supervisor fit. Personnel Psychology, 58: 281-342.
Luechinger, S., Meier, S., & Stutzer, A. (2010). Why does unemployment hurt the employed? Evidence from the life satisfaction gap between the public and the private sector," Journal of Human Resources 45.4: 998-1045.
Osterman, P. (2013). Introduction to the special issue on job quality: What does it mean and how might we think about it? Industrial & Labor Relations Review, 66(4), 739-752.
Oswald, A., Proto, E., & Sgroi, D. (2014). Happiness and Productivity. Journal of Labor Economics, 33(4), 789–822.
Rosen, S. (1986). The theory of equalizing differences. In Ashenfelter, Orley; Layard, Richard. The Handbook of Labor Economics. New York: Elsevier. 641–692.
Winkelmann, L., & Winkelmann, R. (1998). Why are the unemployed so unhappy? Evidence from panel data. Economica, 65, 1-16.

23
Tables
Table 1: Subjective Wellbeing and Employment Status (1) (2) (3)
Life Evaluation Positive Affect Negative Affect Employment (v. employed full-time for employer) Employed Full-Time for Self -0.018*** 0.008 0.018***
(0.005) (0.006) (0.006) Employed Part-Time (does not want more hours) 0.048*** 0.017*** -0.021***
(0.006) (0.006) (0.006) Employed Part-Time (would like more hours) -0.096*** -0.016*** 0.089***
(0.007) (0.006) (0.007) Out of Labor Force -0.045*** -0.024*** 0.022***
(0.005) (0.006) (0.008) Unemployed -0.236*** -0.100*** 0.207***
(0.008) (0.008) (0.008) Control Variables Household Income (ln) 0.218*** 0.124*** -0.118***
(0.005) (0.004) (0.003) Education: Medium (vs. low) 0.159*** 0.103*** -0.080***
(0.005) (0.006) (0.006) Education: High 0.308*** 0.215*** -0.118***
(0.007) (0.008) (0.008) Marital Status: Married (vs. single) 0.046*** 0.016*** -0.024***
(0.004) (0.004) (0.004) Marital Status: Divorced/Separated -0.091*** -0.109*** 0.121***
(0.006) (0.006) (0.006) Marital Status: Widowed -0.089*** -0.133*** 0.148***
(0.008) (0.008) (0.008) Female 0.082*** 0.012*** 0.072***
(0.003) (0.004) (0.004) Age -0.019*** -0.024*** 0.021***
(0.001) (0.001) (0.001) Age2 0.000*** 0.000*** -0.000***
(0.000) (0.000) (0.000)
Children in Household -0.031*** -0.016*** 0.032*** (0.004) (0.004) (0.003)
Adults in Household -0.008*** -0.008*** 0.010*** (0.001) (0.001) (0.001)
Country + Year FEs Yes Yes Yes Observations 848594 817339 805839 R-squared 0.084 0.032 0.032 Countries 162 162 162 Standard errors in parentheses adjusted for clustering at the country level. Outcome variables are standardized to have mean=0 and SD=1. Sample is 21-60 year olds. p < * 0.1 ** p < 0.05 *** p < 0.01.

24
Table 2: Subjective Wellbeing and Employment Status by Gender Life Evaluation Positive Affect Negative Affect
Men Women Men Women Men Women Employment (v. employed full-time for employer) Employed Full-Time for Self -0.024*** -0.009 0.008 0.011 0.018** 0.018**
(0.006) (0.006) (0.007) (0.007) (0.007) (0.007) Employed Part-Time (does not want more hours) 0.025*** 0.064*** 0.005 0.035*** -0.000 -0.044***
(0.009) (0.007) (0.008) (0.007) (0.008) (0.008) Employed Part-Time (would like more hours) -0.120*** -0.072*** -0.028*** 0.002 0.094*** 0.079***
(0.008) (0.008) (0.008) (0.008) (0.009) (0.008) Out of Labor Force -0.092*** -0.027*** -0.069*** 0.003 0.078*** -0.008
(0.006) (0.005) (0.007) (0.006) (0.009) (0.008) Unemployed -0.281*** -0.201*** -0.145*** -0.055*** 0.217*** 0.195***
(0.009) (0.009) (0.010) (0.008) (0.010) (0.009) Country + Year FEs Yes Yes Yes Yes Yes Yes Observations 394629 453965 377950 439389 372192 433647 R-squared 0.084 0.084 0.033 0.033 0.026 0.032 Countries 162 162 162 162 162 162 Standard errors in parentheses adjusted for clustering at the country level. Outcome variables are standardized to have mean=0 and SD=1. Further controls: log income, education level, marital status, household composition, gender, age and its square. Sample is 21-60 year olds. p < * 0.1 ** p < 0.05 *** p < 0.01.

25
Table 3: Subjective Wellbeing and Employment Status Around the World Region: W Europe C+E Europe CIS SE Asia S Asia E Asia LA + Carib NA+ANZ MENA SSA
Panel A: Life Evaluation Employment (v. employed full-time for employer) Employed Full-Time for Self 0.019** 0.083*** 0.030* 0.018 -0.008 0.025** -0.092*** 0.022 -0.001 -0.051***
(0.008) (0.014) (0.016) (0.019) (0.028) (0.011) (0.011) (0.020) (0.013) (0.012) Employed Part-Time (does not want more hours) 0.066*** 0.070*** 0.062*** 0.063** 0.026 0.106*** 0.018 0.080*** 0.090*** -0.017
(0.011) (0.019) (0.015) (0.025) (0.057) (0.015) (0.019) (0.022) (0.014) (0.014) Employed Part-Time (would like more hours) -0.174*** -0.135*** -0.014 -0.012 -0.108* -0.002 -0.148*** -0.214*** -0.108*** -0.085***
(0.012) (0.020) (0.019) (0.023) (0.055) (0.027) (0.016) (0.030) (0.016) (0.012) Out of Labor Force -0.126*** -0.068*** -0.011 0.019 0.005 0.011 -0.048*** -0.171*** -0.017 -0.087***
(0.013) (0.012) (0.010) (0.016) (0.036) (0.014) (0.012) (0.025) (0.010) (0.014) Unemployed -0.396*** -0.306*** -0.187*** -0.113*** -0.095* -0.180*** -0.257*** -0.434*** -0.258*** -0.156***
(0.014) (0.023) (0.021) (0.030) (0.047) (0.025) (0.018) (0.041) (0.016) (0.016) Observations 125659 78228 72053 47723 62986 52100 98357 18043 136099 156412 R-squared 0.115 0.160 0.087 0.071 0.122 0.133 0.064 0.110 0.081 0.074
Panel B: Positive Affect Employment (v. employed full-time for employer) Employed Full-Time for Self 0.006 0.033* 0.006 0.023 0.017 0.061*** -0.034*** 0.038* -0.012 -0.010
(0.014) (0.018) (0.018) (0.018) (0.025) (0.013) (0.011) (0.021) (0.016) (0.010) Employed Part-Time (does not want more hours) 0.016 0.045** 0.060*** 0.094*** -0.026 0.070** -0.007 0.048 -0.002 -0.038***
(0.012) (0.021) (0.019) (0.025) (0.031) (0.033) (0.016) (0.031) (0.018) (0.013) Employed Part-Time (would like more hours) -0.058*** -0.072*** 0.006 0.082*** -0.010 0.077*** -0.043*** 0.009 -0.056*** -0.027**
(0.012) (0.024) (0.021) (0.023) (0.058) (0.017) (0.012) (0.034) (0.017) (0.012) Out of Labor Force -0.073*** 0.027* -0.021 0.026 0.036 0.030* -0.018 -0.083*** -0.043*** -0.087***
(0.012) (0.015) (0.015) (0.022) (0.031) (0.017) (0.012) (0.018) (0.013) (0.013) Unemployed -0.112*** -0.077*** -0.102*** 0.013 -0.076 -0.074** -0.058*** -0.124*** -0.231*** -0.078***
(0.016) (0.024) (0.028) (0.033) (0.051) (0.028) (0.014) (0.040) (0.020) (0.015) Observations 113004 78759 73044 47369 63685 49783 99432 15098 120161 156067 R-squared 0.027 0.082 0.058 0.020 0.058 0.033 0.020 0.027 0.038 0.028

26
Panel C: Negative Affect Employment (v. employed full-time for employer) Employed Full-Time for Self 0.084*** 0.055*** 0.033** -0.043** -0.081*** 0.001 0.027** 0.100*** 0.037** -0.012
(0.013) (0.014) (0.014) (0.019) (0.019) (0.009) (0.013) (0.027) (0.015) (0.010) Employed Part-Time (does not want more hours) -0.025* 0.035* 0.021 -0.091*** -0.047 -0.050*** -0.084*** -0.088** -0.051*** -0.008
(0.014) (0.019) (0.016) (0.023) (0.035) (0.018) (0.016) (0.032) (0.017) (0.013) Employed Part-Time (would like more hours) 0.146*** 0.136*** 0.050*** -0.007 0.047 -0.007 0.104*** 0.184*** 0.108*** 0.058***
(0.014) (0.021) (0.018) (0.024) (0.031) (0.033) (0.013) (0.034) (0.020) (0.013) Out of Labor Force 0.147*** 0.066*** 0.057*** -0.063*** -0.111*** -0.004 -0.041*** 0.244*** -0.029** 0.011
(0.022) (0.014) (0.012) (0.018) (0.027) (0.016) (0.012) (0.027) (0.014) (0.012) Unemployed 0.260*** 0.241*** 0.176*** 0.163*** 0.187*** 0.207*** 0.205*** 0.377*** 0.249*** 0.111***
(0.017) (0.025) (0.023) (0.049) (0.043) (0.031) (0.018) (0.051) (0.019) (0.013) Observations 113004 78759 73044 47369 63685 49783 99432 15098 111485 153243 R-squared 0.041 0.052 0.031 0.026 0.054 0.027 0.042 0.050 0.036 0.041 Standard errors in parentheses adjusted for clustering at the country level. Outcome variables are standardized to have mean=0 and SD=1. Further controls: log income, education level, marital status, household composition, gender, age and its square. Sample is 21-60 year olds. p < * 0.1 ** p < 0.05 *** p < 0.01.

27
Table 4: Social Comparison Effects of Unemployment Life Evaluation Positive Affect Negative Affect
Men Women Men Women Men Women Unemployed -0.298*** -0.236*** -0.176*** -0.073*** 0.276*** 0.240***
(0.015) (0.013) (0.015) (0.013) (0.014) (0.014) Unemployment Rate -0.449*** -0.154*** -0.014 -0.006 0.080 -0.058
(0.066) (0.047) (0.061) (0.041) (0.062) (0.045) Unemployed * Unemployment Rate 0.209** 0.199*** 0.219** 0.091 -0.425*** -0.218***
(0.087) (0.060) (0.096) (0.056) (0.089) (0.057) Country + Year FEs Yes Yes Yes Yes Yes Yes Observations 394555 453285 377876 438738 372132 433055 R-squared 0.085 0.084 0.033 0.033 0.027 0.032 Countries 162 162 162 162 162 162 Standard errors in parentheses adjusted for clustering at the country level. Outcome variables are standardized to have mean=0 and SD=1. Further controls: log income, education level, marital status, household composition, gender, age and its square. Sample is 21-60 year olds. p < * 0.1 ** p < 0.05 *** p < 0.01.

28
Table 5: Job Type and Subjective Wellbeing (1) (2) (3)
Life Evaluation
Positive Affect
Negative Affect
Job Type (v. Professional) Manager/Executive/Official 0.033*** -0.021** 0.019**
(0.009) (0.009) (0.009) Business Owner -0.050*** -0.053*** 0.031***
(0.008) (0.008) (0.008) Clerical or Office Worker -0.021*** -0.069*** -0.009
(0.007) (0.008) (0.008) Sales Worker -0.070*** -0.121*** 0.039***
(0.009) (0.010) (0.009) Service Worker -0.096*** -0.106*** 0.033***
(0.007) (0.008) (0.007) Construction or Mining Worker -0.153*** -0.178*** 0.069***
(0.010) (0.012) (0.012) Manufacturing Worker -0.128*** -0.171*** 0.052***
(0.009) (0.011) (0.011) Transportation Worker -0.113*** -0.195*** 0.066***
(0.011) (0.014) (0.011) Installation or Repair Worker -0.131*** -0.151*** 0.074***
(0.011) (0.014) (0.013) Farming/Fishing/Forestry Worker -0.136*** -0.162*** 0.032***
(0.010) (0.011) (0.009)
Country + Year FEs Yes Yes Yes Observations 338282 333927 328000 R-squared 0.080 0.029 0.018 Countries 153 153 153 Standard errors in parentheses adjusted for clustering at the country level. Outcome variables are standardized to have mean=0 and SD=1. Further controls: log income, education level, marital status, household composition, gender, age and its square. Sample is 21-60 year olds. p < * 0.1 ** p < 0.05 *** p < 0.01.

29
Table 6: Correlation Matrix of Individual Responses to General and Domain-Specific SWB Measures
Life Evaluation Positive Affect Negative Affect Job Satisfaction Engaged Disengaged Life Evaluation 1 Positive Affect 0.252 1 Negative Affect -0.189 -0.372 1 Satisfied with Job 0.280 0.253 -0.178 1 Actively Engaged with Job 0.105 0.168 -0.0672 0.156 1 Actively Disengaged with Job -0.188 -0.257 0.140 -0.411 -0.209 1 Note: All correlations are statistically significant at at least the 0.1% level.

30
Table 7: Job Satisfaction and Job Type by Region W Europe C+E Europe CIS SE Asia S Asia E Asia LA + Carib NA + ANZ MENA SSA
(1) (2) (3) (4) (5) (6) (7) (8) (9) (10) Job Type (v. Professional) Manager/Executive/Official -0.017 -0.061* 0.044 -0.051 0.022 -0.025 -0.083 -0.048 0.006 -0.030
(0.012) (0.033) (0.038) (0.030) (0.036) (0.067) (0.057) (0.043) (0.034) (0.039) Business Owner 0.021 -0.091 0.015 -0.082*** -0.022 -0.084** -0.031 0.047 -0.071** -0.074**
(0.015) (0.094) (0.051) (0.027) (0.028) (0.038) (0.024) (0.034) (0.032) (0.030) Clerical or Office Worker -0.032** -0.122*** -0.064 -0.101*** 0.046 -0.097** -0.028 -0.091* -0.086*** -0.099**
(0.014) (0.029) (0.047) (0.034) (0.034) (0.043) (0.026) (0.047) (0.024) (0.042) Sales Worker -0.076*** -0.292*** -0.232*** -0.149*** -0.127*** -0.210*** -0.162*** -0.166*** -0.261*** -0.234***
(0.020) (0.041) (0.036) (0.051) (0.043) (0.042) (0.029) (0.038) (0.041) (0.040) Service Worker -0.055*** -0.200*** -0.162*** -0.169*** -0.049 -0.187*** -0.118*** -0.080 -0.186*** -0.291***
(0.013) (0.036) (0.027) (0.044) (0.062) (0.047) (0.028) (0.059) (0.039) (0.031) Construction or Mining Worker -0.059*** -0.273*** -0.221*** -0.216*** -0.274*** -0.286*** -0.150*** 0.008 -0.462*** -0.247***
(0.019) (0.051) (0.039) (0.068) (0.038) (0.082) (0.034) (0.061) (0.057) (0.047) Manufacturing Worker -0.110*** -0.363*** -0.188*** -0.234*** -0.194*** -0.249*** -0.117*** -0.145* -0.314*** -0.238***
(0.023) (0.038) (0.031) (0.040) (0.059) (0.080) (0.034) (0.076) (0.053) (0.047) Transportation Worker -0.039* -0.266*** -0.083** -0.186*** -0.096** -0.211* -0.177*** -0.089* -0.355*** -0.264***
(0.020) (0.049) (0.031) (0.063) (0.045) (0.112) (0.044) (0.042) (0.051) (0.055) Installation or Repair Worker -0.068* -0.227*** -0.162*** -0.109 -0.084** -0.216*** -0.052 -0.047 -0.257*** -0.319***
(0.034) (0.048) (0.048) (0.065) (0.035) (0.070) (0.046) (0.066) (0.051) (0.058) Farming/Fishing/Forestry Worker -0.039 -0.413*** -0.320*** -0.145*** -0.110*** -0.310*** -0.152*** 0.004 -0.277*** -0.244***
(0.047) (0.075) (0.045) (0.043) (0.037) (0.037) (0.042) (0.086) (0.044) (0.041) Country + Year FEs Yes Yes Yes Yes Yes Yes Yes Yes Yes Yes Observations 40544 14382 17824 15616 17296 15038 20297 5266 31289 38472 R-squared 0.008 0.047 0.046 0.024 0.066 0.043 0.026 0.014 0.053 0.047 Countries 21 17 12 9 6 6 21 4 18 33 Standard errors in parentheses adjusted for clustering at the country level. Outcome variables are standardized to have mean=0 and SD=1. Further controls: log income, education level, marital status, household composition, gender, age and its square. Sample is 21-60 year olds. p < * 0.1 ** p < 0.05 *** p < 0.01.

31
Table 8: Employee Engagement and Job Type by Region W Europe C+E Europe CIS SE Asia S Asia E Asia LA + Carib NA + ANZ MENA SSA
(1) (2) (3) (4) (5) (6) (7) (8) (9) (10) Job Type (v. Professional) Manager/Executive/Official 0.035** 0.077** 0.118* -0.036 0.017 -0.020 -0.035 -0.043 0.054 -0.063
(0.014) (0.038) (0.069) (0.063) (0.069) (0.056) (0.069) (0.043) (0.037) (0.054) Business Owner 0.239*** 0.235** 0.155 -0.074 -0.045 0.010 0.095 0.164 0.008 0.037
(0.050) (0.097) (0.144) (0.092) (0.076) (0.039) (0.073) (0.131) (0.066) (0.066) Clerical or Office Worker -0.097*** -0.159*** -0.089** -0.145** -0.073 -0.160*** -0.124*** -0.194*** -0.085** -0.148***
(0.022) (0.028) (0.039) (0.064) (0.049) (0.028) (0.039) (0.047) (0.041) (0.040) Sales Worker -0.020 -0.214*** -0.147*** -0.166** -0.068 -0.109*** -0.145** -0.206* -0.101** -0.121**
(0.023) (0.038) (0.030) (0.067) (0.053) (0.035) (0.054) (0.096) (0.047) (0.058) Service Worker -0.017 -0.193*** -0.130*** -0.130** -0.033 -0.104*** -0.090** -0.048 -0.003 -0.133***
(0.014) (0.038) (0.032) (0.057) (0.035) (0.027) (0.040) (0.070) (0.045) (0.033) Construction or Mining Worker 0.013 -0.230*** -0.086*** -0.206*** -0.101** -0.045 0.007 0.040 -0.115** -0.125**
(0.034) (0.035) (0.031) (0.066) (0.041) (0.046) (0.064) (0.120) (0.046) (0.049) Manufacturing Worker -0.063*** -0.195*** -0.134*** -0.180*** -0.158*** -0.108*** -0.092* -0.222** -0.086* -0.151***
(0.021) (0.031) (0.046) (0.048) (0.045) (0.029) (0.053) (0.077) (0.046) (0.054) Transportation Worker -0.011 -0.205*** -0.168*** -0.199*** -0.028 -0.105* -0.216*** -0.205** -0.126** -0.200***
(0.036) (0.046) (0.041) (0.054) (0.039) (0.054) (0.069) (0.089) (0.059) (0.048) Installation or Repair Worker -0.045 -0.262*** -0.101* -0.240*** -0.140** -0.159*** 0.017 -0.085 -0.078 -0.169***
(0.031) (0.044) (0.058) (0.061) (0.065) (0.045) (0.085) (0.115) (0.072) (0.048) Farming/Fishing/Forestry Worker 0.125** -0.173** -0.197*** -0.134* -0.082** -0.088** -0.148* -0.101 -0.098* -0.203***
(0.061) (0.067) (0.058) (0.075) (0.033) (0.031) (0.081) (0.173) (0.056) (0.039) Country + Year FEs Yes Yes Yes Yes Yes Yes Yes Yes Yes Yes Observations 26334 14614 11291 5652 7108 8157 13711 3753 13752 13417 R-squared 0.009 0.030 0.032 0.017 0.032 0.018 0.011 0.020 0.011 0.028 Countries 21 17 12 9 7 5 21 4 16 30 Standard errors in parentheses adjusted for clustering at the country level. Outcome variables are standardized to have mean=0 and SD=1. Further controls: log income, education level, marital status, household composition, gender, age and its square. Sample is 21-60 year olds. p < * 0.1 ** p < 0.05 *** p < 0.01.

32
Table 9: Subjective Wellbeing and Job Characteristics (1) (2) (3) (4)
Units Life
Satisfaction Happiness Job
Satisfaction Positive Affect
Wages (Log) 0.068** 0.041* 0.084*** 0.048** (0.030) (0.024) (0.025) (0.019)
Hours of Work (Weekly hours) 0.002 0.001 0.000 0.002** (0.001) (0.001) (0.001) (0.001)
Responsible for supervising employees (0/1) 0.030 0.031 0.029 0.025 (0.023) (0.022) (0.018) (0.022)
High variety in work (Very True=1) 0.079*** 0.081*** 0.229*** 0.101*** (0.024) (0.028) (0.020) (0.021)
Job requires learning new things (Very True=1) 0.047** 0.059** 0.137*** 0.074*** (0.019) (0.023) (0.018) (0.020)
Wages depend on effort (Very True=1) 0.042 0.044 0.026 0.062* (0.029) (0.031) (0.023) (0.035)
Can get support/help from co-workers (Very True=1) 0.107*** 0.161*** 0.249*** 0.133*** (0.019) (0.020) (0.025) (0.020)
Job entails health/safety risk (Very True=1) -0.155*** -0.086* -0.194*** -0.135*** (0.045) (0.045) (0.033) (0.031)
Can decide start/finish time (Very True=1) -0.040** -0.026 -0.019 -0.016 (0.016) (0.028) (0.031) (0.029)
Job is secure (Very True=1) 0.103*** 0.105*** 0.190*** 0.089*** (0.018) (0.023) (0.025) (0.018)
Job requires very hard work (Strongly Agree=1) -0.034 0.018 -0.024 0.029 (0.037) (0.037) (0.031) (0.028)
Never enough time to get everything done (Strongly Agree=1) -0.015 -0.016 -0.132*** -0.081** (0.025) (0.028) (0.025) (0.030)
Good opportunities for promotion (Strongly Agree=1) 0.107** 0.073* 0.210*** 0.111** (0.040) (0.041) (0.046) (0.040)
Job prevents giving time to family/partner (Often/Always=1) -0.150*** -0.100*** -0.214*** -0.174*** (0.019) (0.019) (0.023) (0.021)
Worry about work problems when not working (Often/Always=1) -0.107*** -0.084*** -0.033 -0.196*** (0.025) (0.020) (0.029) (0.028)
Too tired after work to enjoy things (Often/Always=1) -0.210*** -0.201*** -0.221*** -0.405*** (0.022) (0.027) (0.024) (0.033)
Control over how daily work is organized (8-10/10=1) 0.046*** 0.088*** 0.192*** -0.019 (0.017) (0.018) (0.019) (0.022)
Control over pace of work (8-10/10=1) 0.085*** 0.069*** 0.091*** 0.066** (0.021) (0.020) (0.022) (0.024)
Control over policy decisions of organization (8-10/10=1) 0.031 0.040* 0.121*** 0.053** (0.026) (0.022) (0.024) (0.023)
Trade Union Member (0/1) 0.020 0.040** 0.053* 0.022 (0.021) (0.019) (0.029) (0.021)
Self-Employed (v. Employee) (0/1) 0.053 0.008 0.039 0.026 (0.034) (0.036) (0.029) (0.036)
Education (Years) 0.004* 0.003 -0.010*** -0.002 (0.002) (0.002) (0.002) (0.002)
Female (0/1) 0.038 0.037 0.048* -0.066** (0.025) (0.024) (0.023) (0.024)
Age (Years) -0.045*** -0.049*** -0.003 -0.036*** (0.006) (0.008) (0.006) (0.008)
Age^2 (Years^2) 0.000*** 0.000*** 0.000 0.000*** (0.000) (0.000) (0.000) (0.000)
Observations 11555 11555 11555 11555 R-squared 0.287 0.229 0.220 0.160 Standard errors in parentheses adjusted for clustering at the country level. All outcome variables standardised to have mean of 0 and standard deviation of 1. Source: European Social Survey: Round 5 (2010). Further controls: marital status, household composition, migrant status, industry and occupation dummies, country dummies. * p < 0.1 ** p < 0.05 *** p<0.01

33
Figures
Figure 1: Subjective Wellbeing and Employment Status
4.5
4.7
4.9
5.1
5.3
5.5
Life Evaluation
6264
6668
7072
Positive Affect
2025
3035
40
Negative Affect
Source: Gallup World Poll. Cantril Ladder of Life is a 0-10 scale, Positive and Negative Experience Indexes both 0-100.Mean levels of subjective well-being 2014-2016 by employment status. 95% CI bars shown.
Employed Unemployed

34
Figure 2: Subjective Wellbeing and Employment Status by Gender
44.
55
5.5
Men Women
Life Evaluation
6264
6668
7072
Men Women
Positive Affect
2025
3035
40
Men Women
Negative Affect
Source: Gallup World Poll. Cantril Ladder of Life is 0-10, Positive and Negative Experience Indexes both 0-100.Mean levels of subjective well-being 2014-2016 by employment status. 95% CI bars shown.
Employed Unemployed

35
Figure 3: Subjective Wellbeing and Employment Status by World Region
3.5
4.5
5.5
6.5
W Europe
C+E Euro
pe CIS
SE AsiaS Asia
E Asia
LA+C
arib
NA+ANZ
MENASSA
Life Evaluation50
6070
80
W Europe
C+E Euro
pe CIS
SE AsiaS Asia
E Asia
LA+C
arib
NA+ANZ
MENASSA
Positive Affect
1020
3040
50
W Europe
C+E Euro
pe CIS
SE AsiaS Asia
E Asia
LA+C
arib
NA+ANZ
MENASSA
Negative Affect
Source: Gallup World Poll. Life Evaluation is the Cantril Ladder of Life, 0-10 scale. Positive and Negative Experience Indexes both 0-100.Mean levels of subjective well-being 2014-2016 by employment status. 95% CI bars shown.
Employed Unemployed

36
Figure 4: Adaptation to Spells of Unemployment
-1.5
-1-.5
0Ef
fect
on
SWB
(Life
Sat
isfa
ctio
n 0-
10)
-4 -3 -2 -1 0 1 2 3 4+Number of years before/after entry into unemployment
WomenMen
Source: German Socio-Economic Panel 1984-2014.95% CI bars shown. Specification follows Clark and Georgellis (2013). For more details and full regression results, see online appendix.

37
Figure 5: Unemployment Rates and National Levels of Subjective Wellbeing
AF
AL
DZ
AO
AR
AM
AUAT
AZ
BH
BD
BY
BE
BZ
BJ
BT
BO
BA
BW
BR
BG
BF
BI
KH
CM
CA
CF
TD
CL
CN
CO
CGCD
CR
HRCY
CZ
DK
DO
EC
EG
SVEE
ET
FI
FR
GA GE
DE
GH
GR
GT
GN HT
HN
HKHU
IS
IN
ID
IRIQ
IEIL
IT
CI
JM
JP
JO
KZ
KE
KV
KW
KG
LV
LB
LSLR
LY
LT
LU
MK
MG
MW
MY
ML
MT
MR
MU
MX
MD
MN
ME MA
MZMM NA
NP
NLNZ
NI
NE
NG
NO
PK
PS
PA
PYPEPH
PL
PT
PR
QA
RORU
RW
SA
SN
RS
SL
SG
SK
SI
ZA
KR
SS
ES
LKSD
SECH
SY
TJ
TZ
TH
TG
TN
TR
TM
UGUA
AEGBUS
UY
UZ
VEVN
YE
ZM
ZW
24
68
Life
Eva
luat
ion
0 .1 .2 .3 .4Unemployment Rate
Source: Gallup World Poll, 2014-2016.

38
Figure 6A: Life Evaluation and Job Type
45
67
Cant
ril L
adde
r of L
ife
Professional Worker Manager/Executive/Official Business Owner
Clerical or Office Worker Sales Worker Service Worker
Construction or Mining Worker Manufacturing Worker Transport Worker
Installation or Repair Worker Farming/Fishing/Forestry Worker
Source: Gallup World Poll. Mean Cantril Ladder worldwide 2011-2013, by reported job type. 95% CI bars shown.

39
Figure 6B: Positive Affect and Job Type
6070
80Po
sitive
Affe
ct In
dex
(0-1
00)
Professional Worker Manager/Executive/Official Business Owner
Clerical or Office Worker Sales Worker Service Worker
Construction or Mining Worker Manufacturing Worker Transport Worker
Installation or Repair Worker Farming/Fishing/Forestry Worker
Source: Gallup World Poll. Mean Positive Experience Index worldwide 2011-2013, by reported job type. 95% CI bars shown.

40
Figure 6C: Negative Affect and Job Type
2022
2426
2830
Nega
tive
Affe
ct In
dex
(0-1
00)
Professional Worker Manager/Executive/Official Business Owner
Clerical or Office Worker Sales Worker Service Worker
Construction or Mining Worker Manufacturing Worker Transport Worker
Installation or Repair Worker Farming/Fishing/Forestry Worker
Source: Gallup World Poll. Mean Negative Experience Index worldwide 2011-2013, by reported job type. 95% CI bars shown.
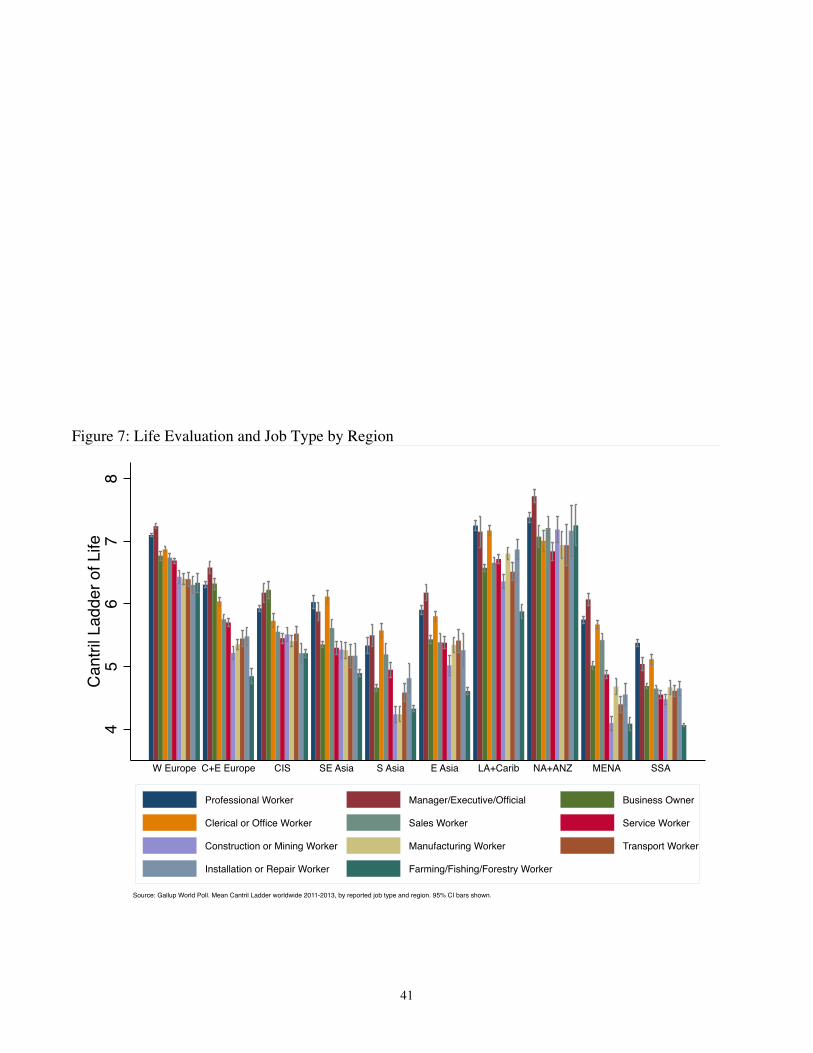
41
Figure 7: Life Evaluation and Job Type by Region
45
67
8Ca
ntril
Lad
der o
f Life
W Europe C+E Europe CIS SE Asia S Asia E Asia LA+Carib NA+ANZ MENA SSA
Professional Worker Manager/Executive/Official Business Owner
Clerical or Office Worker Sales Worker Service Worker
Construction or Mining Worker Manufacturing Worker Transport Worker
Installation or Repair Worker Farming/Fishing/Forestry Worker
Source: Gallup World Poll. Mean Cantril Ladder worldwide 2011-2013, by reported job type and region. 95% CI bars shown.

42
Figure 8: Job Satisfaction Around the World
40%-45%45%-50%50%-55%55%-60%60%-65%65%-70%70%-75%75%-80%80%-85%85%-90%90%-95%95%-100%No data
Source: Gallup World Poll, 2006-2012. Percentage of employed respondents between 21-60 years old reporting to be 'satisfied' (v. 'dissatisfied') with their job.

43
Figure 9: Employee Engagement Around the World
0 20 40 60 80 100
Sub-Saharan Africa
Middle East & North Africa
North America and ANZ
Latin America & Caribbean
East Asia
South Asia
Southeast Asia
C-wealth of Independent States
Central and Eastern Europe
Western Europe
Source: Gallup World Poll 2014-2016.
% Actively Disengaged % Not Engaged % Actively Engaged

44
Figure 10: Job Satisfaction and Job Type
6070
8090
% S
atisfi
ed W
ith J
ob
Professional Worker Manager/Executive/Official Business Owner
Clerical or Office Worker Sales Worker Service Worker
Construction or Mining Worker Manufacturing Worker Transport Worker
Installation or Repair Worker Farming/Fishing/Forestry Worker
Source: Gallup World Poll. % resporting satisfied (v. dissatifsdied) with their job worldwide 2010-2012, by reported job type. 95% CI bars shown.

45
Figure 11: Employee Engagement and Job Type
510
1520
% A
ctive
ly En
gage
d W
ith J
ob
Professional Worker Manager/Executive/Official Business Owner
Clerical or Office Worker Sales Worker Service Worker
Construction or Mining Worker Manufacturing Worker Transport Worker
Installation or Repair Worker Farming/Fishing/Forestry Worker
Source: Gallup World Poll. % resporting activey engaged (v. actively disengaged or not engaged) worldwide 2012-2013, by job type. 95% CI bars shown.

46
Figure 12: Job Satisfaction and Job Type by Region
5060
7080
9010
0%
Sat
isfied
With
Job
W Europe C+E Europe CIS SE Asia S Asia E Asia LA+Carib NA+ANZ MENA SSA
Professional Worker Manager/Executive/Official Business Owner
Clerical or Office Worker Sales Worker Service Worker
Construction or Mining Worker Manufacturing Worker Transport Worker
Installation or Repair Worker Farming/Fishing/Forestry Worker
Source: Gallup World Poll. % responding satisfied (v. dissatifsdied) with their job worldwide 2010-2012, by reported job type and region. 95% CI bars shown.

47
Figure 13: Employee Engagement and Job Type by Region
05
1015
2025
3035
4045
50%
Act
ively
Enga
ged
With
Job
W Europe C+E Europe CIS SE Asia S Asia E Asia LA+Carib NA+ANZ MENA SSA
Professional Worker Manager/Executive/Official Business Owner
Clerical or Office Worker Sales Worker Service Worker
Construction or Mining Worker Manufacturing Worker Transport Worker
Installation or Repair Worker Farming/Fishing/Forestry Worker
Source: Gallup World Poll. % responding activey engaged (v. actively disengaged or not engaged) worldwide 2012-2013, by job type and region. 95% CI bars shown.

48
Online Appendix
Tables
Table A1: Social Comparison Effects of Unemployment
Life Evaluation Positive Affect Negative Affect (1) (2) (3) (4) (5) (6)
Unemployed -0.234*** -0.274*** -0.101*** -0.132*** 0.209*** 0.251*** (0.007) (0.011) (0.008) (0.011) (0.008) (0.011)
Unemployment Rate -0.074* -0.100** 0.027 0.007 -0.061 -0.033 (0.041) (0.041) (0.034) (0.035) (0.037) (0.038)
Unemployed * Unemployment Rate 0.233*** 0.181*** -0.247***
(0.055) (0.052) (0.051) Country + Year FEs Yes Yes Yes Yes Yes Yes Observations 847840 847840 816614 816614 805187 805187 R-squared 0.084 0.084 0.032 0.032 0.032 0.032 Countries 162 162 162 162 162 162 Standard errors in parentheses adjusted for clustering at the country level. Outcome variables are standardized to have mean=0 and SD=1. Further controls: log income, education level, marital status, household composition, gender, age and its square. Sample is 21-60 year olds. p < * 0.1 ** p < 0.05 *** p < 0.01.

49
Table A2: Job Type by Gender Life Evaluation Positive Affect Negative Affect (1) (2) (3) (4) (5) (6)
Men Women Men Women Men Women Job Type (v. Professional) Manager/Executive/Official 0.043*** 0.025** -0.012 -0.031** 0.009 0.035**
(0.011) (0.012) (0.011) (0.013) (0.011) (0.014) Business Owner -0.045*** -0.051*** -0.052*** -0.049*** 0.037*** 0.022**
(0.010) (0.011) (0.010) (0.011) (0.010) (0.011) Clerical or Office Worker -0.017* -0.028*** -0.051*** -0.085*** -0.015 -0.005
(0.010) (0.008) (0.011) (0.010) (0.010) (0.010) Sales Worker -0.047*** -0.086*** -0.099*** -0.139*** 0.039*** 0.039***
(0.012) (0.010) (0.013) (0.011) (0.012) (0.011) Service Worker -0.071*** -0.118*** -0.082*** -0.126*** 0.013 0.048***
(0.010) (0.009) (0.011) (0.010) (0.010) (0.010) Construction or Mining Worker -0.147*** -0.143*** -0.175*** -0.133*** 0.074*** 0.026
(0.011) (0.026) (0.013) (0.026) (0.012) (0.030) Manufacturing Worker -0.115*** -0.144*** -0.169*** -0.174*** 0.038*** 0.075***
(0.011) (0.013) (0.014) (0.015) (0.013) (0.015) Transportation Worker -0.110*** -0.083*** -0.194*** -0.122*** 0.066*** 0.068**
(0.012) (0.031) (0.015) (0.036) (0.012) (0.032) Installation or Repair Worker -0.120*** -0.189*** -0.142*** -0.167*** 0.071*** 0.108***
(0.012) (0.037) (0.016) (0.040) (0.014) (0.040) Farming/Fishing/Forestry Worker -0.126*** -0.154*** -0.153*** -0.175*** 0.040*** 0.028**
(0.013) (0.013) (0.013) (0.013) (0.012) (0.013) Country + Year FEs Yes Yes Yes Yes Yes Yes Observations 191957 146325 188440 145487 184227 143773 R-squared 0.076 0.084 0.028 0.030 0.013 0.018 Countries 153 153 153 153 153 153 Standard errors in parentheses adjusted for clustering at the country level. Outcome variables are standardized to have mean=0 and SD=1. Further controls: log income, education level, marital status, household composition, gender, age and its square. Sample is 21-60 year olds. p < * 0.1 ** p < 0.05 *** p < 0.01.

50
Table A3: Anticipation of and Adaption to Unemployment Spells in Germany
All Men Women
(1) (2) (3)
Leads
3-4 Years Hence -0.096*** -0.083** -0.111** (0.031) (0.041) (0.047)
2-3 Years -0.086*** -0.086** -0.086** (0.031) (0.043) (0.044)
1-2 Years -0.140*** -0.145*** -0.134*** (0.030) (0.043) (0.044)
Within 1 Year -0.272*** -0.284*** -0.260*** (0.031) (0.043) (0.044)
Lags Unemployed 0-1 Year -0.910*** -1.116*** -0.712***
(0.037) (0.054) (0.050) 1-2 Years -1.042*** -1.269*** -0.827***
(0.058) (0.087) (0.077) 2-3 Years -0.877*** -0.962*** -0.771***
(0.085) (0.124) (0.115) 3-4 Years -1.087*** -1.333*** -0.859***
(0.110) (0.186) (0.131) 4+ Years -0.831*** -1.168*** -0.517***
(0.137) (0.229) (0.153)
Further Controls Yes Yes Yes
Individual FEs Yes Yes Yes Observations 158996 86547 72449 Source: German Social-Economic Panel. Standard errors in parentheses, clustered at the level of the individual. All regressions include controls for age, age2, years of education, marital status, log income, number of children, region and wave dummies. Dependent variable is life satisfaction (0-10 scale). For more information on specification, which follows Clark and Georgelis (2013), please see text. * p < 0.10, ** p < 0.05, *** p < 0.01.

51
Table A4i: Job Type and Life Evaluation Around the World W Europe C+E Europe CIS SE Asia S Asia E Asia LA + Carib NA + ANZ MENA SSA
(1) (2) (3) (4) (5) (6) (7) (8) (9) (10) Job Type (v. Professional) Manager/Executive/Official 0.026* 0.100*** 0.096** -0.024 -0.035 0.047 -0.013 0.016 0.068** -0.038
(0.013) (0.024) (0.036) (0.032) (0.066) (0.030) (0.034) (0.025) (0.027) (0.026) Business Owner -0.005 0.087*** 0.103*** -0.115*** -0.059 -0.051 -0.111*** -0.032 -0.030 -0.096***
(0.017) (0.021) (0.034) (0.028) (0.055) (0.032) (0.022) (0.030) (0.023) (0.016) Clerical or Office Worker -0.028** -0.019 0.013 -0.041 -0.013 -0.024 -0.003 -0.071** -0.045** -0.020
(0.013) (0.021) (0.025) (0.033) (0.044) (0.015) (0.023) (0.030) (0.019) (0.019) Sales Worker -0.072*** -0.120*** -0.036** -0.095*** -0.046 -0.100*** -0.063** -0.093*** -0.054* -0.093***
(0.016) (0.022) (0.015) (0.030) (0.042) (0.023) (0.026) (0.031) (0.030) (0.026) Service Worker -0.086*** -0.127*** -0.119*** -0.121*** -0.074* -0.116*** -0.085*** -0.118*** -0.090*** -0.119***
(0.013) (0.021) (0.017) (0.028) (0.037) (0.024) (0.027) (0.024) (0.025) (0.016) Construction or Mining Worker -0.154*** -0.185*** -0.069*** -0.167*** -0.199*** -0.141*** -0.184*** -0.011 -0.173*** -0.167***
(0.020) (0.032) (0.022) (0.039) (0.052) (0.040) (0.035) (0.029) (0.027) (0.021) Manufacturing Worker -0.149*** -0.177*** -0.111*** -0.137*** -0.189*** -0.125*** -0.056** -0.142*** -0.128*** -0.094***
(0.019) (0.025) (0.024) (0.029) (0.057) (0.033) (0.028) (0.038) (0.031) (0.023) Transportation Worker -0.132*** -0.143*** -0.072*** -0.125*** -0.104* -0.119* -0.078** -0.167** -0.156*** -0.113***
(0.024) (0.031) (0.021) (0.038) (0.056) (0.063) (0.036) (0.058) (0.036) (0.024) Installation or Repair Worker -0.172*** -0.191*** -0.079** -0.135*** -0.043 -0.100* -0.099** -0.088 -0.167*** -0.155***
(0.024) (0.035) (0.030) (0.043) (0.039) (0.050) (0.042) (0.051) (0.032) (0.028) Farming/Fishing/Forestry Worker -0.135*** -0.188*** -0.063*** -0.149*** -0.119* -0.118*** -0.192*** 0.034 -0.114*** -0.189***
(0.028) (0.031) (0.019) (0.027) (0.059) (0.022) (0.038) (0.061) (0.036) (0.020) Country + Year FEs Yes Yes Yes Yes Yes Yes Yes Yes Yes Yes Observations 52607 31514 28912 22404 24393 22649 34805 8889 48212 63496 R-squared 0.075 0.130 0.086 0.083 0.130 0.145 0.064 0.065 0.080 0.083 Countries 21 17 12 9 7 6 21 4 19 36 Standard errors in parentheses adjusted for clustering at the country level. Outcome variables are standardized to have mean=0 and SD=1. Further controls: log income, education level, marital status, household composition, gender, age and its square. Sample is 21-60 year olds. p < * 0.1 ** p < 0.05 *** p < 0.01.

52
Table A4ii: Job Type and Positive Affect Around the World W Europe C+E Europe CIS SE Asia S Asia E Asia LA + Carib NA + ANZ MENA SSA
(1) (2) (3) (4) (5) (6) (7) (8) (9) (10) Job Type (v. Professional) Manager/Executive/Official 0.001 -0.012 0.042 -0.074** -0.064 -0.025 -0.052 -0.037 0.004 -0.079***
(0.011) (0.032) (0.028) (0.035) (0.050) (0.038) (0.039) (0.026) (0.029) (0.029) Business Owner 0.018 -0.030 0.000 -0.145*** -0.048 -0.014 -0.069*** -0.021 -0.060** -0.097***
(0.019) (0.025) (0.041) (0.031) (0.032) (0.019) (0.019) (0.043) (0.024) (0.020) Clerical or Office Worker -0.059*** -0.090*** -0.054* -0.070 -0.039 -0.077** -0.045** -0.092*** -0.065** -0.086***
(0.014) (0.026) (0.032) (0.051) (0.039) (0.029) (0.020) (0.027) (0.024) (0.027) Sales Worker -0.051** -0.233*** -0.164*** -0.216*** -0.136** -0.141*** -0.107*** -0.066* -0.078** -0.109***
(0.020) (0.026) (0.022) (0.048) (0.051) (0.033) (0.023) (0.035) (0.034) (0.025) Service Worker -0.061*** -0.173*** -0.133*** -0.186*** -0.052 -0.086** -0.094*** -0.061*** -0.104*** -0.139***
(0.013) (0.023) (0.025) (0.041) (0.038) (0.031) (0.021) (0.017) (0.026) (0.024) Construction or Mining Worker -0.089*** -0.309*** -0.130*** -0.223*** -0.286*** -0.208*** -0.083*** 0.028 -0.247*** -0.160***
(0.025) (0.034) (0.033) (0.058) (0.044) (0.046) (0.028) (0.038) (0.032) (0.026) Manufacturing Worker -0.131*** -0.289*** -0.147*** -0.190*** -0.180*** -0.140*** -0.061** -0.159*** -0.261*** -0.163***
(0.016) (0.028) (0.029) (0.043) (0.048) (0.042) (0.025) (0.036) (0.041) (0.029) Transportation Worker -0.090*** -0.288*** -0.154*** -0.287*** -0.212*** -0.236*** -0.123*** -0.079 -0.246*** -0.216***
(0.028) (0.037) (0.033) (0.051) (0.074) (0.076) (0.031) (0.050) (0.039) (0.029) Installation or Repair Worker -0.036 -0.236*** -0.216*** -0.204*** -0.129*** -0.177*** -0.060* -0.093 -0.146*** -0.203***
(0.031) (0.041) (0.046) (0.046) (0.046) (0.058) (0.033) (0.089) (0.047) (0.034) Farming/Fishing/Forestry Worker -0.093*** -0.233*** -0.216*** -0.219*** -0.151*** -0.093*** -0.079*** 0.051 -0.207*** -0.199***
(0.024) (0.033) (0.027) (0.034) (0.038) (0.028) (0.029) (0.069) (0.032) (0.022) Country + Year FEs Yes Yes Yes Yes Yes Yes Yes Yes Yes Yes Observations 52744 31745 29327 22619 24568 22755 35051 8272 43514 62930 R-squared 0.015 0.068 0.052 0.025 0.060 0.030 0.020 0.016 0.037 0.031 Countries 21 17 12 9 7 6 21 4 19 36 Standard errors in parentheses adjusted for clustering at the country level. Outcome variables are standardized to have mean=0 and SD=1. Further controls: log income, education level, marital status, household composition, gender, age and its square. Sample is 21-60 year olds. p < * 0.1 ** p < 0.05 *** p < 0.01.

53
Table A4iii: Job Type and Negative Affect Around the World W Europe C+E Europe CIS SE Asia S Asia E Asia LA + Carib NA + ANZ MENA SSA
(1) (2) (3) (4) (5) (6) (7) (8) (9) (10) Job Type (v. Professional) Manager/Executive/Official 0.019* 0.051* -0.022 0.053 0.020 -0.024 0.130*** -0.055 0.001 0.052*
(0.010) (0.026) (0.029) (0.047) (0.046) (0.033) (0.041) (0.039) (0.034) (0.030) Business Owner 0.051*** 0.063*** 0.064** 0.007 -0.057 0.001 0.065** 0.078 0.086*** 0.045***
(0.016) (0.020) (0.032) (0.035) (0.042) (0.020) (0.026) (0.046) (0.023) (0.016) Clerical or Office Worker -0.024* 0.023 -0.027 -0.010 -0.048 -0.070*** 0.044* -0.013 -0.004 0.015
(0.012) (0.020) (0.025) (0.041) (0.052) (0.014) (0.025) (0.033) (0.022) (0.023) Sales Worker 0.014 0.090*** 0.027 -0.016 0.039 0.018 0.063** 0.077 0.064* 0.055***
(0.018) (0.022) (0.018) (0.038) (0.057) (0.029) (0.029) (0.048) (0.037) (0.018) Service Worker 0.021 0.052** 0.010 0.018 -0.039 -0.042** 0.068*** 0.038 0.052** 0.094***
(0.013) (0.021) (0.020) (0.033) (0.042) (0.016) (0.026) (0.028) (0.021) (0.018) Construction or Mining Worker 0.036 0.131*** 0.009 0.046 0.117 -0.012 0.041 0.007 0.162*** 0.075***
(0.025) (0.032) (0.020) (0.040) (0.074) (0.037) (0.031) (0.043) (0.030) (0.024) Manufacturing Worker 0.029 0.112*** -0.004 0.044 0.033 -0.032 0.042 -0.090** 0.134*** 0.145***
(0.029) (0.024) (0.022) (0.044) (0.052) (0.032) (0.031) (0.041) (0.039) (0.027) Transportation Worker -0.014 0.059** -0.006 0.075 0.050 -0.001 0.119*** 0.016 0.206*** 0.099***
(0.030) (0.026) (0.023) (0.049) (0.060) (0.030) (0.035) (0.061) (0.035) (0.021) Installation or Repair Worker 0.043 0.152*** -0.007 0.036 0.014 0.031 0.073* -0.135 0.123*** 0.158***
(0.028) (0.035) (0.031) (0.058) (0.065) (0.054) (0.040) (0.084) (0.044) (0.028) Farming/Fishing/Forestry Worker 0.064** 0.118*** 0.022 -0.021 -0.015 -0.030 0.017 -0.082 0.032 0.087***
(0.032) (0.026) (0.020) (0.035) (0.049) (0.025) (0.037) (0.048) (0.043) (0.017) Country + Year FEs Yes Yes Yes Yes Yes Yes Yes Yes Yes Yes Observations 52744 31745 29327 22619 24568 22755 35051 8272 39087 61430 R-squared 0.018 0.028 0.022 0.018 0.038 0.024 0.034 0.018 0.022 0.021 Countries 21 17 12 9 7 6 21 4 19 36 Standard errors in parentheses adjusted for clustering at the country level. Outcome variables are standardized to have mean=0 and SD=1. Further controls: log income, education level, marital status, household composition, gender, age and its square. Sample is 21-60 year olds. p < * 0.1 ** p < 0.05 *** p < 0.01.

54
Table A5: Correlation Matrix of Country-Year Averages of SWB Measures
Life Evaluation
Positive Affect
Negative Affect
Job Satisfaction Engaged Disengaged
Life Evaluation 1 Positive Affect 0.51* 1 Negative Affect -0.17* -0.18* 1 Satisfied with Job 0.73* 0.42* -0.05 1 Actively Engaged with Job 0.09* 0.32* 0.08* 0.30* 1 Actively Disengaged with Job -0.32* -0.47* -0.01 -0.51* -0.51* 1 * p < 0.05

55
Table A6: Job Satisfaction and Employment Status
W Europe C+E Europe CIS SE Asia S Asia E Asia LA + Carib NA + ANZ MENA SSA (1) (2) (3) (4) (5) (6) (7) (8) (9) (10)
Employment (v. employed full-time for employer) Employed Full-Time for Self 0.057*** 0.069 -0.091** 0.100*** 0.106** 0.058 0.005 0.119*** 0.089*** 0.067**
(0.014) (0.070) (0.042) (0.029) (0.038) (0.044) (0.014) (0.034) (0.031) (0.026) Employed Part-Time (does not want more hours) 0.058*** 0.003 -0.049 0.075* -0.050 -0.063 0.019 0.095** 0.048 0.046
(0.013) (0.038) (0.032) (0.036) (0.038) (0.061) (0.030) (0.036) (0.034) (0.029) Employed Part-Time (would like more hours) -0.159*** -0.468*** -0.343*** -0.090 -0.253* -0.071 -0.329*** -0.215*** -0.280*** -0.282***
(0.027) (0.048) (0.052) (0.053) (0.143) (0.047) (0.026) (0.057) (0.048) (0.031) Out of Labor Force 0.000 0.000 0.000 0.000 0.000 0.000 0.000 0.000 0.000 0.000 Country + Year FEs Yes Yes Yes Yes Yes Yes Yes Yes Yes Yes Observations 42194 14899 18319 15446 18335 15637 22029 4810 32427 38413 R-squared 0.011 0.052 0.042 0.023 0.068 0.037 0.036 0.020 0.048 0.054 Countries 20 17 12 9 6 6 21 4 18 33 Standard errors in parentheses adjusted for clustering at the country level. Outcome variables are standardized to have mean=0 and SD=1. Further controls: log income, education level, marital status, household composition, gender, age and its square. Sample is 21-60 year olds. p < * 0.1 ** p < 0.05 *** p < 0.01.
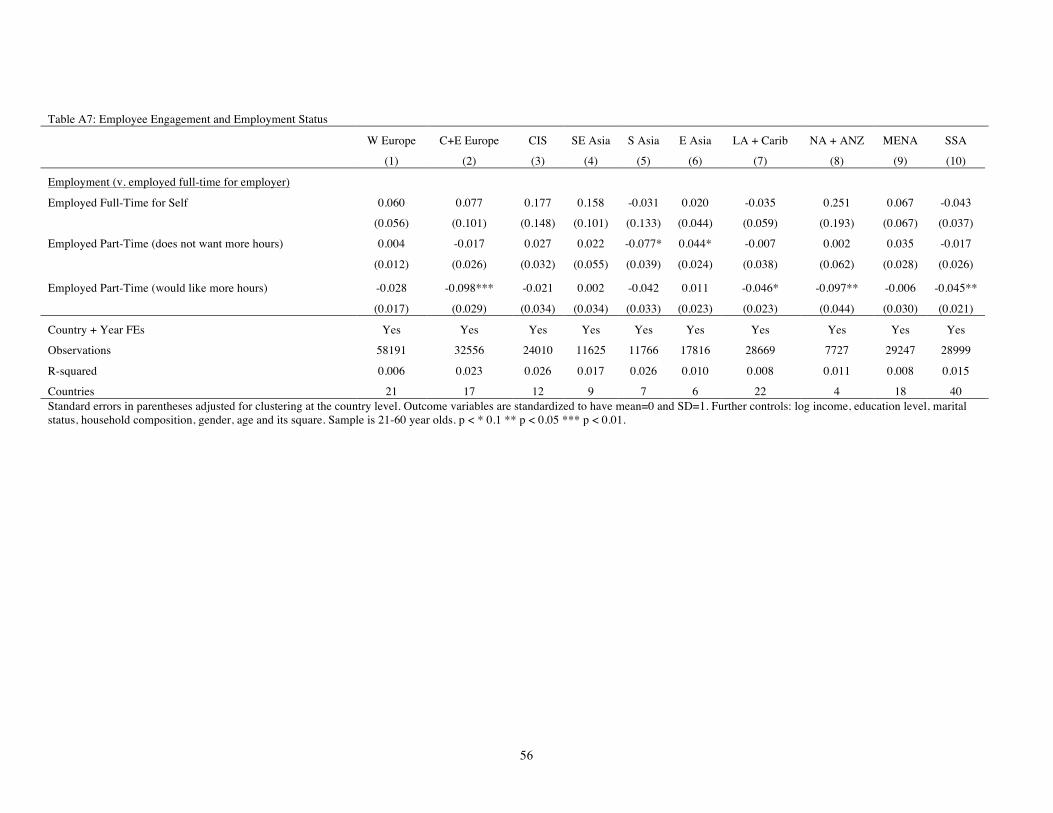
56
Table A7: Employee Engagement and Employment Status
W Europe C+E Europe CIS SE Asia S Asia E Asia LA + Carib NA + ANZ MENA SSA
(1) (2) (3) (4) (5) (6) (7) (8) (9) (10)
Employment (v. employed full-time for employer)
Employed Full-Time for Self 0.060 0.077 0.177 0.158 -0.031 0.020 -0.035 0.251 0.067 -0.043
(0.056) (0.101) (0.148) (0.101) (0.133) (0.044) (0.059) (0.193) (0.067) (0.037)
Employed Part-Time (does not want more hours) 0.004 -0.017 0.027 0.022 -0.077* 0.044* -0.007 0.002 0.035 -0.017
(0.012) (0.026) (0.032) (0.055) (0.039) (0.024) (0.038) (0.062) (0.028) (0.026)
Employed Part-Time (would like more hours) -0.028 -0.098*** -0.021 0.002 -0.042 0.011 -0.046* -0.097** -0.006 -0.045**
(0.017) (0.029) (0.034) (0.034) (0.033) (0.023) (0.023) (0.044) (0.030) (0.021)
Country + Year FEs Yes Yes Yes Yes Yes Yes Yes Yes Yes Yes
Observations 58191 32556 24010 11625 11766 17816 28669 7727 29247 28999
R-squared 0.006 0.023 0.026 0.017 0.026 0.010 0.008 0.011 0.008 0.015
Countries 21 17 12 9 7 6 22 4 18 40 Standard errors in parentheses adjusted for clustering at the country level. Outcome variables are standardized to have mean=0 and SD=1. Further controls: log income, education level, marital status, household composition, gender, age and its square. Sample is 21-60 year olds. p < * 0.1 ** p < 0.05 *** p < 0.01.

57
Table A8: Job Satisfaction, Employee Engagement, and Employment Status Job Satisfaction Employee Engagement
(1) (2) (3) (4) (5) (6) All Men Women All Men Women
Employment (v. employed full-time for employer) Employed Full-Time for Self 0.057*** 0.061*** 0.051*** 0.031 0.015 0.047
(0.011) (0.012) (0.013) (0.024) (0.028) (0.037) Employed Part-Time (does not want more hours) 0.032*** 0.021 0.035*** 0.018* 0.003 0.014
(0.011) (0.015) (0.012) (0.009) (0.015) (0.011) Employed Part-Time (would like more hours) -0.254*** -0.291*** -0.217*** -0.033*** -0.028** -0.042***
(0.018) (0.022) (0.019) (0.009) (0.012) (0.011) Country + Year FEs Yes Yes Yes Yes Yes Yes Observations 222509 125047 97462 251107 139111 111996 R-squared 0.034 0.040 0.028 0.006 0.007 0.006 Countries 146 146 146 158 158 158 Standard errors in parentheses adjusted for clustering at the country level. Outcome variables are standardized to have mean=0 and SD=1. Further controls: log income, education level, marital status, household composition, gender, age and its square. Sample is 21-60 year olds. p < * 0.1 ** p < 0.05 *** p < 0.01.

58
Table A9: Job Satisfaction, Employee Engagement, and Job Type Job Satisfaction Employee Engagement
(1) (2) (3) (4) (5) (6) All Men Women All Men Women
Job Type (v. Professional) Manager/Executive/Official -0.033*** -0.023* -0.045*** 0.011 0.001 0.039**
(0.010) (0.013) (0.014) (0.014) (0.017) (0.020) Business Owner -0.045*** -0.032** -0.055*** 0.094*** 0.094*** 0.106***
(0.013) (0.015) (0.016) (0.026) (0.030) (0.038) Clerical or Office Worker -0.065*** -0.050*** -0.075*** -0.119*** -0.102*** -0.134***
(0.010) (0.015) (0.012) (0.012) (0.017) (0.015) Sales Worker -0.193*** -0.185*** -0.195*** -0.118*** -0.098*** -0.131***
(0.015) (0.019) (0.018) (0.016) (0.020) (0.020) Service Worker -0.140*** -0.114*** -0.160*** -0.077*** -0.062*** -0.094***
(0.013) (0.017) (0.016) (0.013) (0.018) (0.016) Construction or Mining Worker -0.240*** -0.232*** -0.200*** -0.087*** -0.070*** -0.168***
(0.020) (0.021) (0.047) (0.016) (0.018) (0.036) Manufacturing Worker -0.208*** -0.192*** -0.228*** -0.125*** -0.100*** -0.157***
(0.015) (0.018) (0.020) (0.013) (0.016) (0.022) Transportation Worker -0.184*** -0.178*** -0.144*** -0.141*** -0.126*** -0.209***
(0.020) (0.022) (0.045) (0.018) (0.020) (0.049) Installation or Repair Worker -0.171*** -0.171*** -0.080 -0.119*** -0.102*** -0.192***
(0.020) (0.021) (0.051) (0.019) (0.021) (0.053) Farming/Fishing/Forestry Worker -0.208*** -0.196*** -0.228*** -0.138*** -0.115*** -0.163***
(0.017) (0.019) (0.023) (0.018) (0.021) (0.024) Country + Year FEs Yes Yes Yes Yes Yes Yes Observations 216024 121847 94177 118153 65947 52206 R-squared 0.032 0.037 0.027 0.010 0.010 0.010 Countries 147 147 147 143 143 143 Standard errors in parentheses adjusted for clustering at the country level. Outcome variables are standardized to have mean=0 and SD=1. Further controls: log income, education level, marital status, household composition, gender, age and its square. Sample is 21-60 year olds. p < * 0.1 ** p < 0.05 *** p < 0.01.

59
Table A10: Subjective Wellbeing and Job Characteristics by Gender
Men Women
(1) (2) (3) (4) (5) (6) (7) (8)
Units Life
Satisfaction Happiness Job
Satisfaction Positive Affect
Life Satisfaction Happiness
Job Satisfaction
Positive Affect
Wages (Log) 0.070** 0.052** 0.078*** 0.031 0.069* 0.033 0.087** 0.063**
(0.027) (0.021) (0.022) (0.022) (0.038) (0.030) (0.032) (0.025)
Hours of Work (Weekly hours) 0.003** 0.001 0.003* 0.003** 0.001 0.001 -0.002 0.002
(0.001) (0.001) (0.002) (0.001) (0.002) (0.001) (0.001) (0.002)
Responsible for supervising employees (0/1) 0.031 0.016 0.033 0.021 0.036 0.054** 0.033* 0.038
(0.026) (0.027) (0.026) (0.025) (0.028) (0.025) (0.018) (0.031)
High variety in work (Very True=1) 0.054 0.092** 0.218*** 0.120*** 0.101*** 0.072** 0.240*** 0.083***
(0.032) (0.036) (0.028) (0.026) (0.026) (0.033) (0.030) (0.029)
Job requires learning new things (Very True=1) 0.072** 0.073* 0.134*** 0.055* 0.026 0.039* 0.132*** 0.087***
(0.035) (0.037) (0.026) (0.030) (0.018) (0.023) (0.022) (0.028)
Wages depend on effort (Very True=1) 0.019 0.070** 0.003 0.075 0.077* 0.011 0.057 0.052
(0.043) (0.031) (0.027) (0.047) (0.038) (0.052) (0.055) (0.042)
Can get support/help from co-workers (Very True=1) 0.128*** 0.162*** 0.188*** 0.141*** 0.092*** 0.160*** 0.301*** 0.125***
(0.024) (0.027) (0.027) (0.031) (0.023) (0.028) (0.031) (0.024)
Job entails health/safety risk (Very True=1) -0.171*** -0.090* -0.189*** -0.112** -0.140* -0.092 -0.205*** -0.192***
(0.036) (0.049) (0.050) (0.044) (0.081) (0.064) (0.066) (0.063)
Can decide start/finish time (Very True=1) -0.009 -0.017 0.001 -0.021 -0.057 -0.015 -0.029 0.005
(0.028) (0.048) (0.045) (0.039) (0.034) (0.029) (0.041) (0.036)
Job is secure (Very True=1) 0.072* 0.081* 0.231*** 0.107*** 0.126*** 0.125*** 0.155*** 0.072**
(0.035) (0.040) (0.028) (0.028) (0.022) (0.021) (0.033) (0.027)
Job requires very hard work (Strongly Agree=1) -0.037 0.026 -0.041 0.061 -0.039 0.003 -0.016 -0.009
(0.035) (0.044) (0.040) (0.037) (0.045) (0.040) (0.042) (0.040)
Never enough time to get everything done (Strongly Agree=1) -0.056 -0.050 -0.169*** -0.178*** 0.014 0.011 -0.114*** 0.002
(0.048) (0.050) (0.043) (0.038) (0.030) (0.028) (0.038) (0.037)
Good opportunities for promotion (Strongly Agree=1) 0.077 0.099* 0.230*** 0.126** 0.141** 0.051 0.183*** 0.103*

60
(0.048) (0.051) (0.046) (0.060) (0.059) (0.053) (0.058) (0.052)
Job prevents giving time to family/partner (Often/Always=1) -0.166*** -0.128*** -0.206*** -0.194*** -0.131*** -0.071** -0.214*** -0.156***
(0.027) (0.023) (0.032) (0.030) (0.034) (0.029) (0.033) (0.029)
Worry about work problems when not working (Often/Always=1) -0.089** -0.067** -0.027 -0.229*** -0.126*** -0.102*** -0.045 -0.175***
(0.034) (0.025) (0.038) (0.038) (0.031) (0.023) (0.033) (0.034)
Too tired after work to enjoy things (Often/Always=1) -0.206*** -0.208*** -0.189*** -0.388*** -0.216*** -0.205*** -0.245*** -0.427***
(0.026) (0.032) (0.033) (0.042) (0.033) (0.035) (0.035) (0.035)
Control over how daily work is organized (8-10/10=1) 0.058* 0.107*** 0.201*** 0.005 0.040* 0.072** 0.186*** -0.032
(0.029) (0.024) (0.033) (0.038) (0.021) (0.026) (0.025) (0.023)
Control over pace of work (8-10/10=1) 0.097*** 0.059** 0.068** 0.048 0.073** 0.075** 0.109*** 0.080***
(0.026) (0.024) (0.031) (0.031) (0.030) (0.033) (0.024) (0.027)
Control over policy decisions of organization (8-10/10=1) 0.030 0.040 0.148*** 0.074** 0.034 0.042 0.087** 0.033
(0.027) (0.027) (0.030) (0.029) (0.039) (0.033) (0.039) (0.040)
Trade Union Member (0/1) -0.011 -0.007 0.078** 0.005 0.053* 0.082*** 0.037 0.028
(0.027) (0.024) (0.034) (0.029) (0.029) (0.025) (0.037) (0.042)
Self-Employed (v. Employee) (0/1) 0.084 0.052 -0.034 0.068 0.023 -0.023 0.038 -0.002
(0.064) (0.067) (0.060) (0.073) (0.039) (0.042) (0.044) (0.042)
Education (Years) 0.007** 0.005 -0.004 0.001 0.001 0.002 -0.014*** -0.005
(0.003) (0.003) (0.004) (0.004) (0.003) (0.003) (0.004) (0.003)
Age (Years) -0.034*** -0.051*** -0.006 -0.037*** -0.057*** -0.048*** 0.003 -0.038***
(0.008) (0.011) (0.010) (0.012) (0.010) (0.010) (0.008) (0.010)
Age^2 (Years^2) 0.000*** 0.001*** 0.000 0.000*** 0.001*** 0.000*** 0.000 0.000***
(0.000) (0.000) (0.000) (0.000) (0.000) (0.000) (0.000) (0.000)
Observations 5588 5588 5588 5588 5967 5967 5967 5967
R-squared 0.273 0.224 0.213 0.173 0.310 0.249 0.241 0.157 Standard errors in parentheses adjusted for clustering at the country level. All outcome variables standardised to have mean of 0 and standard deviation of 1. Source: European Social Survey: Round 5 (2010). Further controls: marital status, household composition, migrant status, industry and occupation dummies, country dummies. * p < 0.1 ** p < 0.05 *** p < 0.01

61
Table A11: Gallup World Poll: Summary Statistics Mean Std. Dev.
Life Evaluation (0-10) 5.444 2.242 Positive Affect (0-100) 68.216 28.986 Negative Affect (0-100) 27.637 29.504 Satisfied with Job (0/1) 0.782 0.413 Actively Engaged with Job (0/1) 0.161 0.367 Actively Disengaged with Job (0/1) 0.186 0.389 Employment Status (all 0/1) Employed Full-Time for Employer 0.341 0.474 Employed Full-Time for Self 0.158 0.365 Employed Part-Time (does not want more hours) 0.073 0.260 Employed Part-Time (would like more hours) 0.078 0.269 Out of Labour Force 0.280 0.449 Unemployed 0.070 0.255 Job Type (all 0/1) Professional Worker 0.176 0.381 Manager/Executive/Official 0.051 0.219 Business Owner 0.141 0.348 Clerical or Office Worker 0.107 0.310 Sales Worker 0.077 0.266 Service Worker 0.126 0.331 Construction or Mining Worker 0.048 0.214 Manufacturing Worker 0.057 0.232 Transportation Worker 0.036 0.187 Installation or Repair Worker 0.022 0.148 Farming/Fishing/Forestry Worker 0.158 0.365 Controls Annual Household Income ($) 26504 956368 Education: Low 0.299 0.458 Education: Medium 0.513 0.500 Education: High 0.184 0.388 Marital Status: Single 0.235 0.424 Marital Status: Married 0.665 0.472 Marital Status: Divorced/Separated 0.061 0.240 Marital Status: Widowed 0.033 0.177 Female 0.534 0.499 Age 38.4 11.3 Children in Household (0/1) 0.58 0.49 Adults in Household (#) 3.00 1.45

62
Table A12: Summary Statistics Survey: European Social
Mean Std. Dev.
Life Satisfaction (0-10) 6.707 2.339
Happiness (0-10) 7.117 2.028
Job Satisfaction (0-10) 7.308 1.968
Positive Affect (0-10) 6.283 2.149
Hours of Work 40.529 13.245
Responsive for supervising employees 0.280 0.449
High variety in work 0.329 0.470
Job requires learning new things 0.293 0.455
Wages depend on effort 0.113 0.316
Can get support/help from co-workers 0.358 0.480
Job entails health/safety risk 0.076 0.265
Can decide start/finish time 0.118 0.322
Job is secure 0.297 0.457
Job requires very hard work 0.191 0.393
Never enough time to get everything done 0.100 0.300
Good opportunities for promotion 0.050 0.219
Job prevents giving time to family/partner 0.218 0.413
Worry about work problems when not working 0.250 0.433
Too tired after work to enjoy things 0.264 0.441
Control over how daily work is organized 0.451 0.498
Control over pace of work 0.401 0.490
Control over policy decisions of organization 0.231 0.422
Trades Union Member 0.223 0.416
Log Wages 9.688 1.179

63
Table A13: Job Satisfaction Around the World
Country
% Satisfied with Job
Lower 95% CI
Upper 95% CI Country
% Satisfied with Job
Lower 95% CI
Upper 95% CI
1 Austria 95.1 94.2 96.0 81 Cambodia 78.9 77.3 80.5 2 Norway 94.6 93.4 95.9 82 Pakistan 78.1 76.6 79.6 3 Iceland 94.5 92.5 96.6 83 Jamaica 78.1 74.0 82.1 4 Netherlands 93.8 92.8 94.8 84 Estonia 77.8 76.1 79.5 5 Switzerland 93.7 92.3 95.1 85 Bangladesh 77.7 76.1 79.3 6 Thailand 93.7 92.9 94.5 86 Peru 77.4 75.6 79.2 7 Denmark 93.5 92.5 94.4 87 Croatia 77.1 75.3 78.8 8 Luxembourg 93.4 91.9 94.9 88 Kyrgyzstan 76.0 74.2 77.8 9 Sweden 92.7 91.7 93.7 89 Libya 75.8 71.7 79.9
10 Turkmenistan 91.7 90.3 93.2 90 Romania 75.1 72.7 77.4 11 Ireland 91.5 90.2 92.8 91 Egypt 75.1 73.8 76.3 12 Finland 91.2 89.9 92.6 92 Bulgaria 74.9 72.4 77.4 13 Belgium 91.1 89.8 92.5 93 Turkey 74.9 73.1 76.7 14 Laos 90.7 89.3 92.1 94 Russia 74.6 73.5 75.7 15 Canada 90.5 89.4 91.7 95 South Korea 74.0 71.9 76.2 16 Germany 90.4 89.8 91.0 96 Japan 74.0 72.5 75.5 17 Venezuela 90.1 88.8 91.4 97 Ethiopia 73.7 70.7 76.6 18 Singapore 90.0 88.9 91.0 98 Bosnia Herzegovina 73.7 71.2 76.2 19 Costa Rica 89.9 88.7 91.2 99 Indonesia 73.3 71.9 74.7 20 Australia 89.2 87.9 90.5 100 Albania 73.3 71.0 75.5 21 Cyprus 88.7 86.9 90.4 101 Dominican Republic 72.7 70.6 74.8 22 New Zealand 88.6 87.2 90.0 102 Ukraine 72.3 70.5 74.2 23 Slovenia 88.5 86.8 90.3 103 Lebanon 72.3 70.9 73.7 24 Portugal 88.4 86.9 90.0 104 Myanmar 72.0 67.7 76.4 25 Panama 88.3 86.9 89.7 105 Iraq 72.0 70.0 73.9 26 Spain 88.1 86.8 89.4 106 Belarus 71.6 70.0 73.2 27 Guatemala 88.1 86.7 89.5 107 India 71.5 70.4 72.6 28 Qatar 87.8 86.4 89.2 108 China 71.4 70.4 72.4 29 Oman 87.7 85.0 90.4 109 Angola 71.1 67.0 75.2 30 Kuwait 87.4 86.3 88.5 110 Niger 71.1 69.1 73.0 31 United Kingdom 87.4 86.7 88.1 111 Mozambique 70.8 68.3 73.2 32 United Arab Emirates 87.1 86.0 88.3 112 Macedonia 70.6 67.8 73.4 33 Uzbekistan 87.0 85.6 88.5 113 Central African Republic 70.4 67.5 73.4 34 Poland 86.9 85.2 88.7 114 Iran 70.3 68.2 72.3 35 France 86.0 84.5 87.5 115 Moldova 70.0 68.2 71.7 36 Mauritius 86.0 82.3 89.6 116 Azerbaijan 69.8 67.8 71.9 37 Puerto Rico 85.7 79.2 92.3 117 Montenegro 69.7 67.3 72.2 38 Saudi Arabia 85.7 84.6 86.8 118 Palestine 69.3 67.3 71.3 39 Brazil 85.6 84.3 86.9 119 Cuba 69.1 64.9 73.2 40 Italy 85.5 83.9 87.1 120 Algeria 68.6 66.0 71.1 41 Namibia 85.4 80.9 89.8 121 Serbia 68.5 66.2 70.7

64
42 United States 85.3 83.7 87.0 122 Tunisia 68.4 66.6 70.2 43 Malta 85.2 82.8 87.6 123 Chad 67.9 65.3 70.5 44 Malaysia 85.0 83.6 86.5 124 Cameroon 64.9 62.3 67.5 45 Nepal 84.9 83.3 86.4 125 Morocco 64.8 62.1 67.4 46 Kosovo 84.7 82.6 86.9 126 Ghana 63.1 60.6 65.7 47 Bolivia 84.7 83.3 86.2 127 Syria 62.7 60.5 64.9 48 Paraguay 84.5 82.9 86.1 128 Mauritania 61.7 59.5 63.9 49 Sri Lanka 84.4 82.7 86.2 129 South Africa 61.3 59.0 63.6 50 Belize 84.1 79.0 89.2 130 Congo Brazzaville 60.0 56.3 63.7 51 Guyana 84.1 78.7 89.5 131 Nigeria 59.5 57.6 61.5 52 Suriname 84.1 79.2 88.9 132 Sierra Leone 59.2 56.5 62.0 53 Czech Republic 83.1 81.6 84.7 133 Yemen 58.9 56.7 61.1 54 Honduras 83.1 81.4 84.8 134 Tanzania 57.8 55.6 59.9 55 Ecuador 83.0 81.3 84.6 135 Sudan 56.7 54.2 59.3 56 Colombia 82.7 81.1 84.4 136 Liberia 56.6 53.2 59.9 57 Mexico 82.4 80.7 84.2 137 Zimbabwe 56.3 54.1 58.5 58 Hungary 82.4 80.4 84.3 138 Burkina Faso 56.2 53.8 58.6 59 Nicaragua 82.3 80.6 84.0 139 Botswana 56.1 53.2 59.0 60 Argentina 82.2 80.6 83.8 140 Georgia 55.9 53.3 58.5 61 Mongolia 82.2 80.3 84.0 141 Ivory Coast 55.3 50.5 60.1 62 Trinidad and Tobago 82.1 78.8 85.4 142 Zambia 55.2 52.3 58.1 63 Latvia 82.1 80.4 83.7 143 Swaziland 55.1 48.4 61.8 64 Israel 82.1 80.7 83.4 144 Guinea 55.1 51.4 58.7 65 Uruguay 82.0 80.4 83.6 145 Senegal 54.7 52.0 57.4 66 Djibouti 81.9 79.6 84.2 146 Burundi 54.3 51.0 57.5 67 Hong Kong 81.5 79.5 83.6 147 Comoros 54.1 52.0 56.2 68 Philippines 81.4 79.8 83.0 148 Mali 53.7 51.5 55.9 69 Slovakia 81.4 79.5 83.4 149 Gabon 52.5 48.2 56.7 70 Tajikistan 81.3 79.3 83.4 150 Kenya 52.0 49.9 54.1 71 El Salvador 80.9 79.0 82.7 151 Malawi 51.8 49.0 54.7 72 Jordan 80.7 79.1 82.2 152 Rwanda 51.7 49.3 54.1 73 Vietnam 80.0 78.7 81.4 153 Uganda 51.0 48.9 53.1 74 Afghanistan 80.0 78.0 82.0 154 Armenia 50.7 48.2 53.2 75 Bahrain 79.9 78.2 81.7 155 Congo Kinshasa 50.2 46.9 53.5 76 Somaliland 79.9 78.1 81.7 156 Benin 49.3 46.6 52.0 77 Chile 79.8 78.0 81.6 157 Haiti 48.5 45.3 51.8 78 Kazakhstan 79.5 77.8 81.1 158 Madagascar 45.3 42.9 47.7 79 Lithuania 79.4 77.7 81.1 159 Togo 44.8 41.1 48.5 80 Greece 79.2 77.4 81.1 160 Lesotho 44.4 37.7 51.2 Source: Gallup World Poll, 2006-2012. National average percentage of employed respondents between 21-60 years old who reported being “satisfied” (as opposed to “dissatisfied”) with their job.

65
Appendix Figures
Figure A1: Life Evaluation and Job Type by Gender
45
67
Cant
ril L
adde
r of L
ife
Men Women
Professional Worker Manager/Executive/Official Business Owner
Clerical or Office Worker Sales Worker Service Worker
Construction or Mining Worker Manufacturing Worker Transport Worker
Installation or Repair Worker Farming/Fishing/Forestry Worker
Source: Gallup World Poll. Mean Cantril Ladder worldwide 2011-2013, by reported job type and gender. 95% CI bars shown.
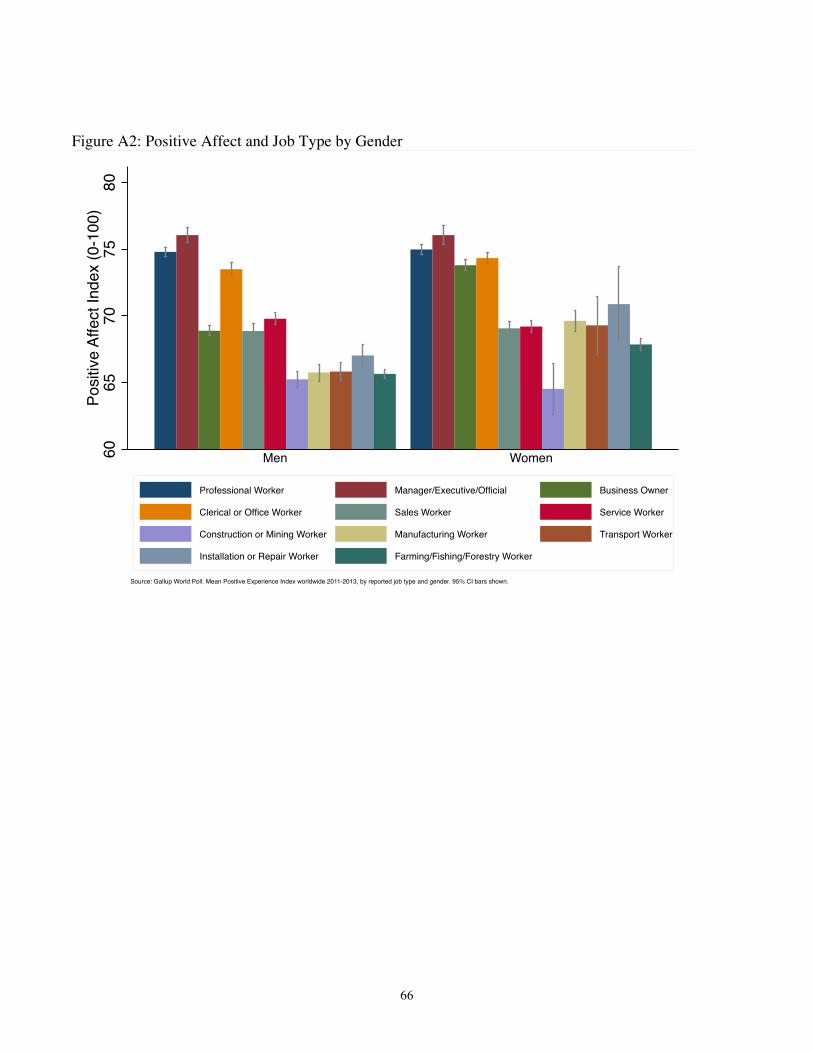
66
Figure A2: Positive Affect and Job Type by Gender
6065
7075
80Po
sitive
Affe
ct In
dex
(0-1
00)
Men Women
Professional Worker Manager/Executive/Official Business Owner
Clerical or Office Worker Sales Worker Service Worker
Construction or Mining Worker Manufacturing Worker Transport Worker
Installation or Repair Worker Farming/Fishing/Forestry Worker
Source: Gallup World Poll. Mean Positive Experience Index worldwide 2011-2013, by reported job type and gender. 95% CI bars shown.
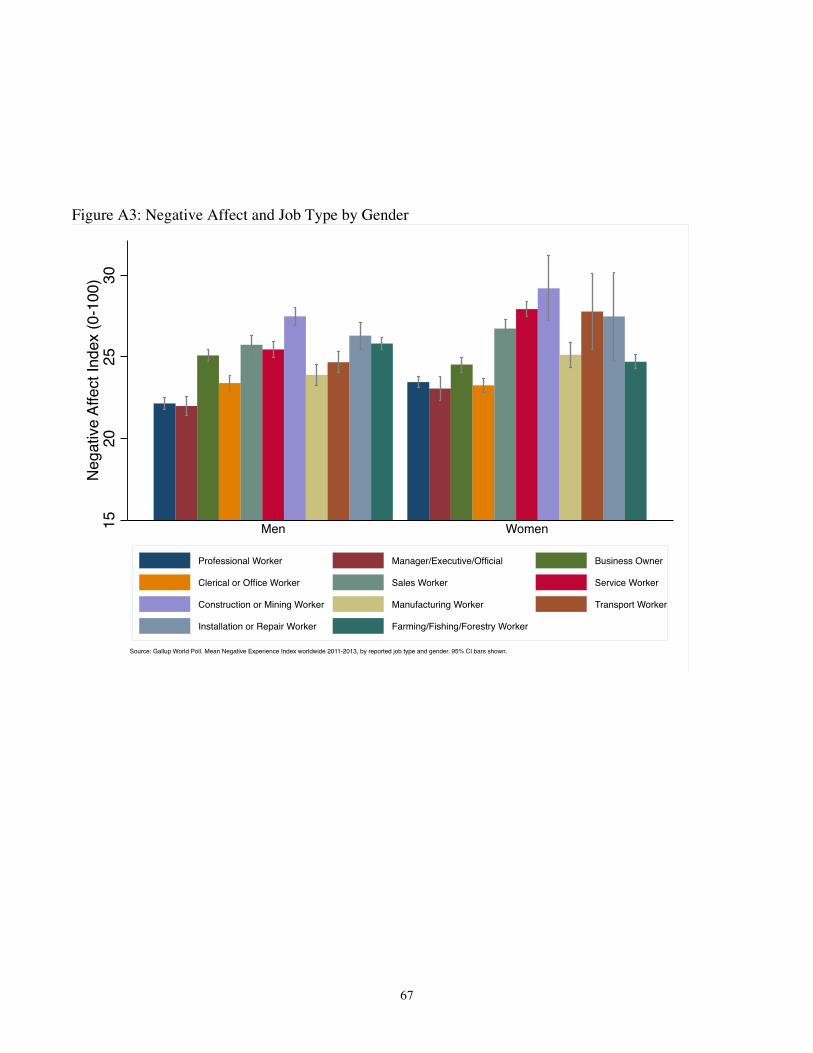
67
Figure A3: Negative Affect and Job Type by Gender
1520
2530
Nega
tive
Affe
ct In
dex
(0-1
00)
Men Women
Professional Worker Manager/Executive/Official Business Owner
Clerical or Office Worker Sales Worker Service Worker
Construction or Mining Worker Manufacturing Worker Transport Worker
Installation or Repair Worker Farming/Fishing/Forestry Worker
Source: Gallup World Poll. Mean Negative Experience Index worldwide 2011-2013, by reported job type and gender. 95% CI bars shown.

68
Figure A4: Job Satisfaction and Job Type by Gender 50
6070
8090
% S
atisfi
ed W
ith J
ob
Men Women
Professional Worker Manager/Executive/Official Business Owner
Clerical or Office Worker Sales Worker Service Worker
Construction or Mining Worker Manufacturing Worker Transport Worker
Installation or Repair Worker Farming/Fishing/Forestry Worker
Source: Gallup World Poll. % responding satisfied (v. dissatifsdied) with their job worldwide 2010-2012, by reported job type and gender. 95% CI bars shown.

69
Figure A5: Employee Engagement and Job Type by Gender
05
1015
20%
Act
ively
Enga
ged
With
Job
Men Women
Professional Worker Manager/Executive/Official Business Owner
Clerical or Office Worker Sales Worker Service Worker
Construction or Mining Worker Manufacturing Worker Transport Worker
Installation or Repair Worker Farming/Fishing/Forestry Worker
Source: Gallup World Poll. % responding activey engaged (v. actively disengaged or not engaged) worldwide 2012-2013, by job type and gender. 95% CI bars shown.

70
Figure A6: Positive Affect and Job Type by Region
5060
7080
90Po
sitive
Affe
ct In
dex
(0-1
00)
W Europe C+E Europe CIS SE Asia S Asia E Asia LA+Carib NA+ANZ MENA SSA
Professional Worker Manager/Executive/Official Business Owner
Clerical or Office Worker Sales Worker Service Worker
Construction or Mining Worker Manufacturing Worker Transport Worker
Installation or Repair Worker Farming/Fishing/Forestry Worker
Source: Gallup World Poll. Mean Positive Experience Index worldwide 2011-2013, by reported job type and region. 95% CI bars shown.

71
Figure A7: Negative Affect and Job Type by Region 10
1520
2530
3540
45Ne
gativ
e Af
fect
Inde
x (0
-100
)
W Europe C+E Europe CIS SE Asia S Asia E Asia LA+Carib NA+ANZ MENA SSA
Professional Worker Manager/Executive/Official Business Owner
Clerical or Office Worker Sales Worker Service Worker
Construction or Mining Worker Manufacturing Worker Transport Worker
Installation or Repair Worker Farming/Fishing/Forestry Worker
Source: Gallup World Poll. Mean Negative Experience Index worldwide 2011-2013, by reported job type and region. 95% CI bars shown.

72
Figure A8: Unemployment Rates and National Life Evaluation by Region
ATBE
CY
DKFI
FR
DE
GR
IS
IE
IT
LUMT
NLNO
PT
ES
SECH
GB
24
68
0 .1 .2 .3 .4
W Europe
AL
BABG
HR
CZ
EE
HU KV
LVLT
MKME
PLRO
RS
SK
SI
24
68
0 .1 .2 .3 .4
C + E Europe
AM
AZ
BY
GE
KZ
KG
MDRU
TJ
TM
UA
UZ
24
68
0 .1 .2 .3 .4
CIS
KH
ID
MY
MM
PH
SGTH
VN
24
68
0 .1 .2 .3 .4
SE Asia
AF
BD
BT
IN
NP
PK
LK
24
68
0 .1 .2 .3 .4
S Asia
CNHK
JP
MN
KR
24
68
0 .1 .2 .3 .4
E Asia
AR
BZBO
BRCL
CO
CR
DO
ECSV
GT
HT
HNJM
MX
NIPA
PYPE
PR
UY
VE
24
68
0 .1 .2 .3 .4
L America + Carib
AUCANZUS
24
68
0 .1 .2 .3 .4
N America + ANZ
DZBH
EG IRIQ
IL
JO
KW
LBLY
MA
PS
QA SA
SY
TN
TR
AE
YE
24
68
0 .1 .2 .3 .4
MENA
AO
BJ BWBF
BI
CM
CF
TDCGCD
ET GAGH
GN
CI
KE
LSLR
MGMWML MR
MU
MZNA
NE
NG
RW
SNSLZA
SS
SD
TZTG
UG
ZM
ZW
24
68
0 .1 .2 .3 .4
SSA
Life
Eva
luat
ion
(Can
tril L
adde
r 0-1
0)
Unemployment RateSource: Gallup World Poll, 2014-2016.

1 OECD Guidelines on Measuring Subjective Wellbeing (2013) 2 De Neve and Oswald (2012), Oswald, Proto, and Sgroi (2015), Edmans (2011) 3 The Cantril ladder item to survey life evaluation asks the following question: “Please imagine a ladder, with steps numbered from 0 at the bottom to 10 at the top. The top of the ladder represents the best possible life for you and the bottom of the ladder represents the worst possible life for you. On which step of the ladder would you say you personally feel you stand at this time?” 4 The measure for positive affect is an index that measures respondents’ experienced positive wellbeing on the day before the survey using the following five items: (i) Did you feel well-rested yesterday?; (ii) Were you treated with respect all day yesterday?; (iii) Did you smile or laugh a lot yesterday?; (iv) Did you learn or do something interesting yesterday?; (v) Did you experience the following feelings during a lot of the day yesterday? How about enjoyment? 5 The measure for negative affect is an index that measures respondents’ experienced negative wellbeing on the day before the survey using the following five items: (i) Did you experience the following feelings during a lot of the day yesterday? How about physical pain?; (ii) Did you experience the following feelings during a lot of the day yesterday? How about worry?; (iii) Did you experience the following feelings during a lot of the day yesterday? How about sadness?; (iv) Did you experience the following feelings during a lot of the day yesterday? How about stress?; (v) Did you experience the following feelings during a lot of the day yesterday? How about anger? 6 The questionnaire measure asks respondents to chose whether they are either “satisfied” or “dissatisfied” with their job. 7 The survey measure asks respondents how engaged they are with the job they do, with 3 response categories: “actively engaged”, “not engaged”, and “actively disengaged”. 8 Throughout this chapter we restrict our analyses to the working age population between the ages of 21-60. 9 We follow a procedure analogous to that outlined in Chapter 2. When calculating world or regional averages, we in all cases use population-adjusted weighting. Gallup’s own weights sum to the number of respondents in each country. To produce population-adjusted weights for the period 2014-2016 here, we first adjust the Gallup weights such that each country has an equal weighting. We then multiply that weight by the total population aged between 15 and 64 in 2015 (this population data is drawn from the World Bank’s World Development Indicators). 10 See, e.g., Clark and Oswald (1994); Clark (2010); Kassenböhmer and Haisken-DeNew 2009 11 See, e.g., Clark and Oswald (1994); Winkelmann and Winkelmann (1998); Helliwell and Huang (2014). 12 The non-pecuniary effects of unemployment have been the subject of decades of research in psychology and economics. A seminal study back in the 1930s (Eisenberg and Lazersfeld 1938), for example, found that, when someone loses their job they lose not only their income but also other things that are important to them such status, social contact with others in the workplace, and daily structure and goals.13 Evidence for this has been provided by a handful of studies including recent work on a large-scale US panel study that evaluated whether the wellbeing of adolescents predicted their labor market outcomes. De Neve and Oswald (2012) found that adolescents and young adults who report higher life satisfaction or positive affect grow up to earn significantly higher levels of income later in life (controlling for socio-economic status) and significant mediating pathways included a higher probability of getting hired and promoted. 14 See, e.g., Blanchflower and Oswald (2004). 15 Kassenböhmer and Haisken-DeNew (2009).

16 It is worth noting that self-employment can refer to a huge range of things – from owning a large multinational grocery chain all the way to being a sole-trader on a market stall. 17 We look here at 10 world regions: Western Europe (W Europe), Central and Eastern Europe (C+E Europe), The Commonwealth of Independent States (CIS), South-East Asia (SE Asia), South Asia (S Asia), East Asia (E Asia), Latin America and the Caribbean (LA+Carib), North American and Australia and New Zealand (NA+ANZ ), Middle East and North Africa (MENA), and Sub-Saharan Africa (SSA). 18 The notable exceptions here are South-East Asia and South Asia where self-employed individuals report less negative affect as compared to being full-time employees. 19 See, e.g., Clark et al (2008); Clark and Georgelis (2013). 20 Our approach here follows Clark et al (2008) and Clark and Georgelis (2013). We take advantage of the longitudinal nature of the German Socio-Economic Panel, which has been running since the 1980s, and take a within-person (i.e. fixed effect) approach and ask to what extent people who become unemployed and stay unemployed adapt to their circumstances in terms of happiness. We look at both the 4 years prior to becoming unemployed as well as the 4+ years following that event. Those entering the panel already unemployed are dropped from the analysis (i.e. we exclude any left-censored spells). For each individual, we look only at the first occurrence of unemployment they experience in the panel, and examine how the respondent’s happiness adapts as they experience their first spell of unemployment. Specifically, we run the following regression: LSit = ai + q’Xit + β-4U-4,it + β-3U-3,it + β-2U-2,it + β-1U-1,it + β0U0it + β1U1it + β2U2it + β3U3it + β4U4it + eitwhere LSit refers to the life satisfaction on a 0-10 scale of person i in year t and X is a vector of control variables typical to the literature. Those who are unemployed are split into five categories: the U dummies (U0 to U4) refer to those who have been unemployed for under a year, those unemployed between 1-2 years, and so on up to four (or more) years. The U-4 to U-1 dummies refer to future entry into unemployment in the next 0-1 years, 1-2 years and so on. Figure 4 reports these lag and lead coefficients from this equation, along with 95% confidence intervals. The omitted category in this equation is those who will not enter into being unemployed in the following four years. The sample is all those individuals who are not unemployed in their first year in the panel. The aI term is an individual fixed effect, such thatthe adaptation we are examining here compares the life satisfaction of someone who has been unemployed for 3 years with their own life satisfaction before becoming unemployed. 21 See, e.g., Clark et al (2001); Knabe and Rätsel (2011). 22 Di Tella et al (2001). 23 E.g. Knabe and Rätsel (2011); Luechinger et al (2010). 24 In addition to job insecurity effects caused by others’ unemployment, there may be further psychological conduits. One is that in times of high unemployment people may be more likely to stay in jobs they do not particularly enjoy, given the difficulty of finding a more agreeable job when labor market conditions are poor. A second is that those who are left in work may feel some level of guilt being unemployed whilst those around them are being laid off and suffering the consequences of job loss. Finally, there may be more immediate spill-over effects, with those close to unemployed people – spouses and other family members in particular – suffering as they live with and attempt to provide support for the unemployed 25 See Clark (2003). 26 In order to present an up-to-date picture of the relationship, we calculate the 2016 unemployment rate for each country using the Gallup World Poll sample. This is the fraction of those participating in the labor force between the ages of 21 and 60 who report being unemployed. The most recent set of unemployment rate figures produced by the World Bank (in the 2016 World Development Indicators) pertain to 2014; an analogous analysis using this data together with the 2014 Gallup data produce similar results.
27 Note that Helliwell and Huang (2014) obtain the negative correlation between unemployment and wellbeing in the cross-sectional data for the United States without even including those individuals that are themselves unemployed. 28 See, e.g. Kristof-Brown et al (2005) for a review. 29 See, e.g., Rosen (1986). 30 See, e.g., Bonhomme and Jolivet (2009). 31 Our analyses do not address the theory of “compensating differentials” head-on but it is worthwhile noting that there are a number of possible reasons behind why such stark differences are observed in the happiness levels associated with different job types even though compensating differentials in terms of income may suggest otherwise (holding skill levels constant). One plausible reason being that most individuals may not have a wide range of options to choose from in terms of which type of job to perform (even when holding skill levels constant) and, as such, there is not as much free movement between job types as economic theory would have it. Another reason why we find that the classic notion of compensating differentials does not fit these data well is because monetary compensation is really only but a part of the overall package of job characteristics that relate job type to happiness. 32 See, e.g., Freeman (1978); Harter et al. (2002, 2003); Bockerman and Ilmakunnas (2012), Judge et al (2001). 33 The question was incuded in the Gallup World Poll between 2006 and 2012. Here we map the country averages over this period. More detailed information on these figures is provided in Table A13. 34 Bryson and Mackerron (2017). 35 See, e.g. Clark (2010). There are a number of approaches to the measurement of job quality. For a useful overview, see Osterman (2013). 36 The survey questions we use are: 1) “All things considered, how satisfied are you with your life as a whole nowadays?” 2) “Taking all things together, how happy would you say you are?” 3) “How satisfied are you in your main job?” 4) A positive affect measure aggregated from three questions asking how much in the last two weeks the respondent has “felt cheerful and in good spirits”, “felt calm and relaxed”, “felt active and vigorous”. 37 Artz et al. (2016). 38 See, e.g., Oswald, Proto, and Sgroi (2015), Edmans (2011), and Harter et al. (2002)

CENTRE FOR ECONOMIC PERFORMANCE Recent Discussion Papers
1473 Diego Battiston Jordi Blanes i Vidal Tom Kirchmaier
Is Distance Dead? Face-to-Face Communication and Productivity in Teams
1472 Sarah Flèche Teacher Quality, Test Scores and Non-Cognitive Skills: Evidence from Primary School Teachers in the UK
1471 Ester Faia Gianmarco Ottaviano
Global Banking: Risk Taking and Competition
1470 Nicholas Bloom Erik Brynjolfsson Lucia Foster Ron Jarmin Megha Patnaik Itay Saporta-Eksten John Van Reenen
What Drives Differences in Management?
1469 Kalina Manova Zhihong Yu
Multi-Product Firms and Product Quality
1468 Jo Blanden Kirstine Hansen Sandra McNally
Quality in Early Years Settings and Children’s School Achievement
1467 Joan Costa-Font Sarah Flèche
Parental Sleep and Employment: Evidence from a British Cohort Study
1466 Jo Blanden Stephen Machin
Home Ownership and Social Mobility
1465 Decio Coviello Stefano Gagliarducci
Tenure in Office and Public Procurement
1464 Claudia Olivetti Barbara Petrongolo
The Economic Consequences of Family Policies: Lessons from a Century of Legislation in High-Income Countries

1463 Claudia Hupkau Marion Leturcq
Fertility and Mothers' Labor Supply: New Evidence Using Time-to-Conception
1462 Clement Bellet The Paradox of the Joneses: Superstar Houses and Mortgage Frenzy in Suburban America
1461 Georg Graetz Guy Michaels
Is Modern Technology Responsible for Jobless Recoveries?
1460 Thomas Breda Alan Manning
Diversity and Social Capital within the Workplace: Evidence from Britain
1459 Monica Langella Alan Manning
Diversity and Neighbourhood Satisfaction
1458 Giordano Mion Luca David Opromolla Alessandro Sforza
The Diffusion of Knowledge via Managers’ Mobility
1457 Kristian Behrens Giordano Mion Yasusada Murata Jens Suedekum
Distorted Monopolistic Competition
1456 Tony Beatton Michael P. Kidd Stephen Machin Dipa Sarkar
Larrikin Youth: New Evidence on Crime and Schooling
1455 Andrew Eyles Stephen Machin Sandra McNally
Unexpected School Reform: Academisation of Primary Schools in England
1454 Rabah Arezki Thiemo Fetzer Frank Pisch
On the Comparative Advantage of U.S. Manufacturing: Evidence from the Shale Gas Revolution
The Centre for Economic Performance Publications Unit Tel 020 7955 7673 Fax 020 7404 0612
Email [email protected] Web site http://cep.lse.ac.uk