
Haor Regions of Bangladeshteacher.buet.ac.bd/akmsaifulislam/presentations/Flash_Flood... · BUET...
90
Flash Flood Forecasting for the Northeast Haor Regions of Bangladesh A.K.M. Saiful Islam Professor Institute of Water and Flood Management Bangladesh University of Engineering and Technology (BUET)
Transcript of Haor Regions of Bangladeshteacher.buet.ac.bd/akmsaifulislam/presentations/Flash_Flood... · BUET...
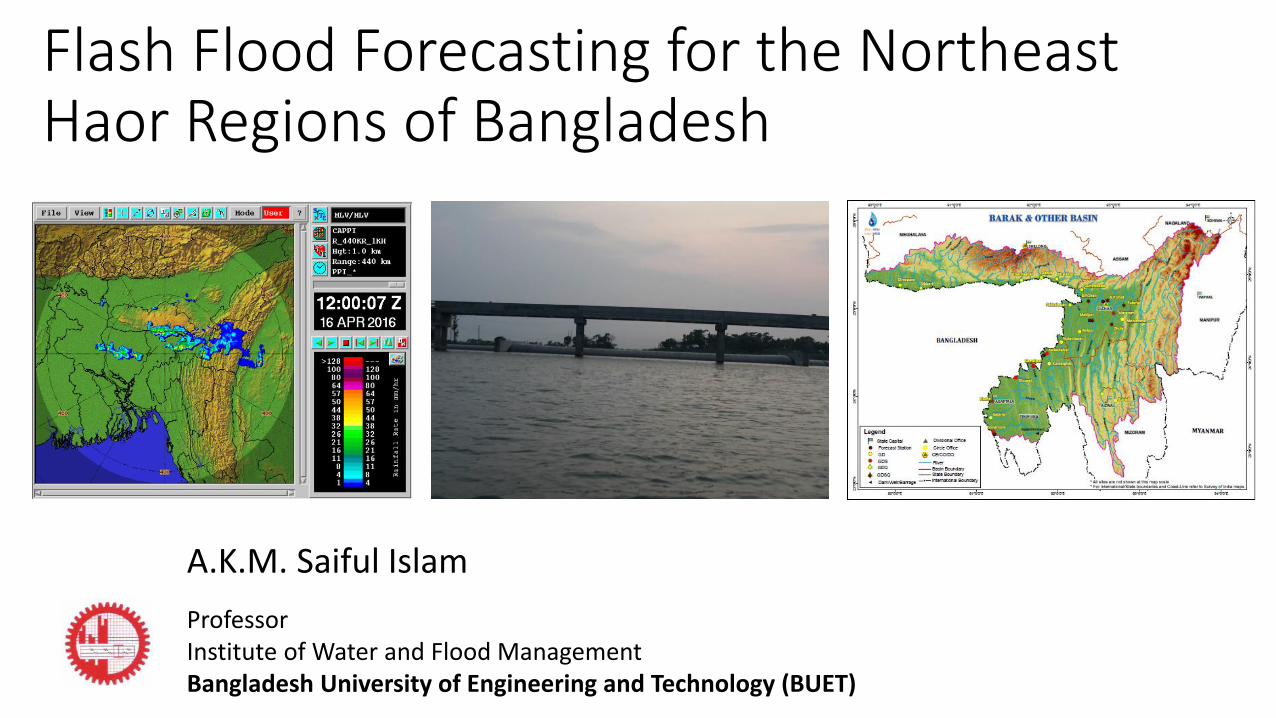
Flash Flood Forecasting for the Northeast Haor Regions of Bangladesh
A.K.M. Saiful Islam
ProfessorInstitute of Water and Flood Management Bangladesh University of Engineering and Technology (BUET)

BUET Study Team• Prof AKM Saiful Islam, Principal Investigator
• Prof G.M. Tarekul Islam, Co-Investigator
• Prof Mashfiqus Salehin, Co-Investigator
• Prof Sujit Kumar Bala, Co-Investigator
• Prof M. Shahjahan Mondal, Co-Investigator
• Shammi Haque, Co-Investigator
• Binata Roy, Co-Investigator
• Partha Das, Co-Investigator
• Mohan Kumar Das, Research Associate
• Md. Samiun Basir, Research Assistant
• Diponkar Saha, Research Assistant
• Md. Jamal Uddin Khan, Research Assistant

Outline of the presentation
• Natural disasters experiences in Bangladesh in 2016 and impact of double El Niño of 2014-2016
• Flash flood issues in the northeast Haor regions of Bangladesh
• Present condition and needs of flash flood forecasting
• FFEWS Project – Developing Flash flood Early Warning System under the HILIP Project of LGED to assists FFWC of BWDB.
• Rainfall forecasting using Weather Research Forecasting Modeling for the April 2017 Flash Flood Event
• Needs of developing pre-monsoon danger levels

Bangladesh experiences a number of natural disasters in 2016
• Heat wave continues from 6 -30 April 2016 effects human health.
• Wheat crops has been attacked by Blast Virus for the first time in February 2016.
• Flash flood occurred in the north east regions of Bangladesh during 17-22 April 2016 and destroys crops about 30% of the area of that regions.
• Thunderstorms and lightening kills about 57 people on two consecutive events on 12-13 May 2016.
• Cyclone and storms surge of ‘Roanu’ hits Bangladesh coasts on 21 May 2016 which kills more than 26 people and damages houses, crops, roads etc.

MODIS Image between April 15 to April 23, 2016.
• April in Thailand is typically hot and sweaty but this year's scorching weather has set a record for the longest heat wave in at least 65 years.
• Phalodi in Rajasthan, India recorded 51.0 Deg C Temperature on 19 May, 2016, which is the highest ever recorded temperature in India.
Yellow shows the warmest temperatures

Two low pressure system due to Western Disturbance and one high pressure systems

Heat wave during April continues for 26 days (6 April to 30 April)

A total of 57 people died during 12-13 May 2016 hit by the lightening
• Govt. is now declared it as disaster Farmers are working during thunder stormsWithout any protection

Global Lightening strikes map

Courtesy: R. Holle, Vaisala (2016)
Lightening strokes detected on 12-13 May 2016

Comparison of lightening death in Bangladesh with USA
99
114
136
123
112
51
141
2010
2011
2012
2013
2014
2015
2016
Bangladesh Lighting Fatalities2010-2016
(Source: Daily Star)
For more Information:
http://teacher.buet.ac.bd/akmsaifulislam/index.html
( so far this year)

Cyclone ‘Roanu’ hits Bangladesh on 21 May 2016 and kills more than 26 people and destroys crops, houses, road networks, fish firms, trees etc.

Deep depression (left) in Bay of Bengal and heat wave in India (right) during the cyclone Roanu

This graph illustrates the change in global surface temperature relative to 1951-1980 average

Carbon DioxideLATEST MEASUREMENT: March 2016403.28 ppm
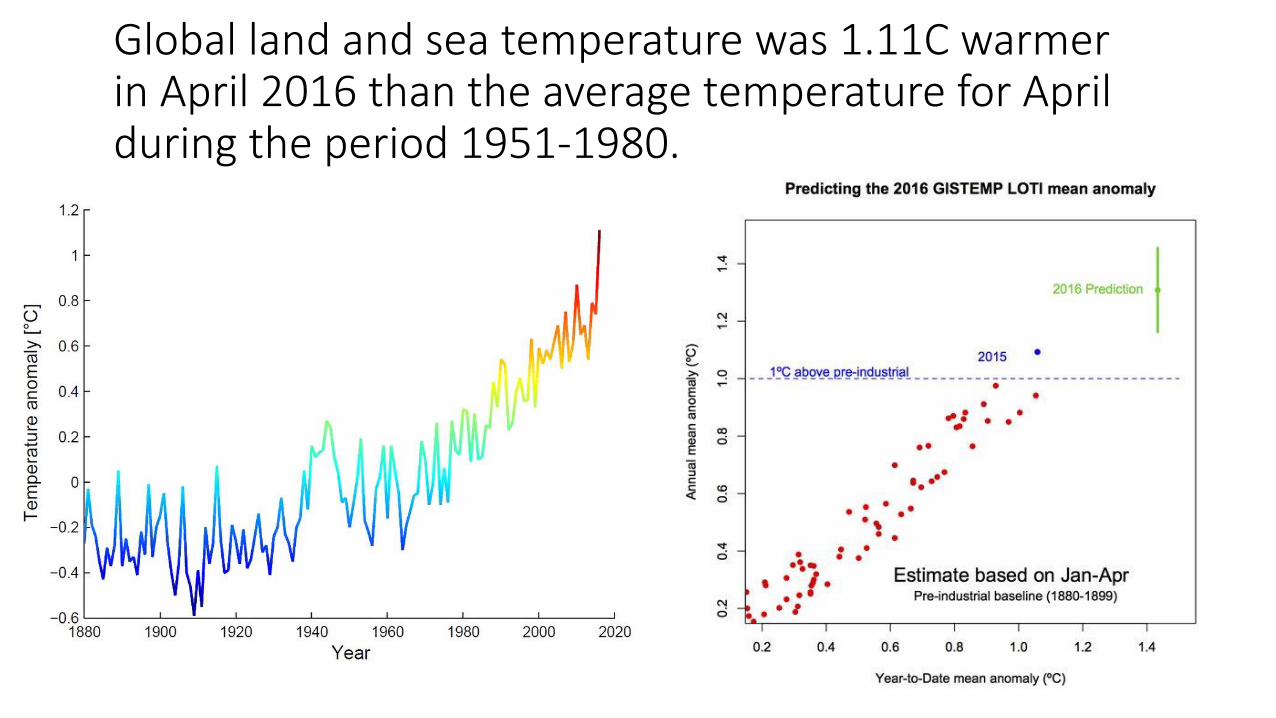
Global land and sea temperature was 1.11C warmer in April 2016 than the average temperature for April during the period 1951-1980.

Temperature anomaly based on the observed data of the 24 BMD stations (1971-2015)
-0.8
-0.6
-0.4
-0.2
0
0.2
0.4
0.6
0.8
19
71
19
72
19
73
19
74
19
75
19
76
19
77
19
78
19
79
19
80
19
81
19
82
19
83
19
84
19
85
19
86
19
87
19
88
19
89
19
90
19
91
19
92
19
93
19
94
19
95
19
96
19
97
19
98
19
99
20
00
20
01
20
02
20
03
20
04
20
05
20
06
20
07
20
08
20
09
20
10
20
11
20
12
20
13
20
14
Tem
pera
ture
Anom
aly
(0C
) re
lative to
19
71
-20
15
Solid bold line represents 3 year moving average

Temperature Anomaly (ᵒC) relative to 1861-1880 for Bangladesh (RCP8.5)
• Increasing trend ranging between 3.24°C to 5.77°C under RCP 8.5 scenario over Bangladesh.
0
1
2
3
4
5
6
7
2000 2010 2020 2030 2040 2050 2060 2070 2080 2090 2100
Tem
pera
ture
Anom
aly
(0C
) re
lative to
18
61
-18
80
ACCESS1_CSIRO-CCAM-1391M CCSM4_CSIRO-CCAM-1391M CNRM-CM5_SMHI-RCA4 CNRM-CM5_CSIRO-CCAM-1391M
EC-EARTH_SMHI-RCA4 IPSL-CM5A-MR_SMHI-RCA4 MIROC5_SMHI-RCA4 MPI-ESM-LR_CSIRO-CCAM-1391M
MPI-ESM-LR_MPI-REMO2009 MPI-ESM-LR_SMHI-RCA4 GFDL-ESM2M_SMHI-RCA4
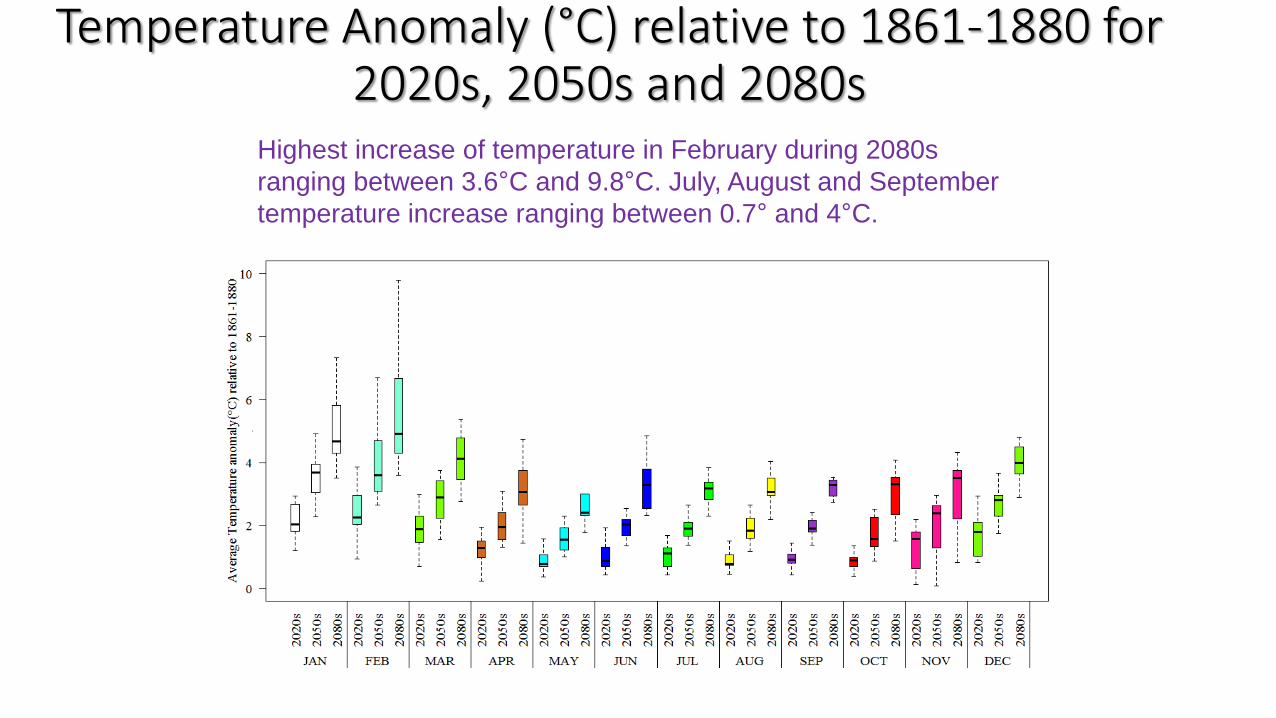
Temperature Anomaly (°C) relative to 1861-1880 for 2020s, 2050s and 2080s
Highest increase of temperature in February during 2080s
ranging between 3.6°C and 9.8°C. July, August and September
temperature increase ranging between 0.7° and 4°C.
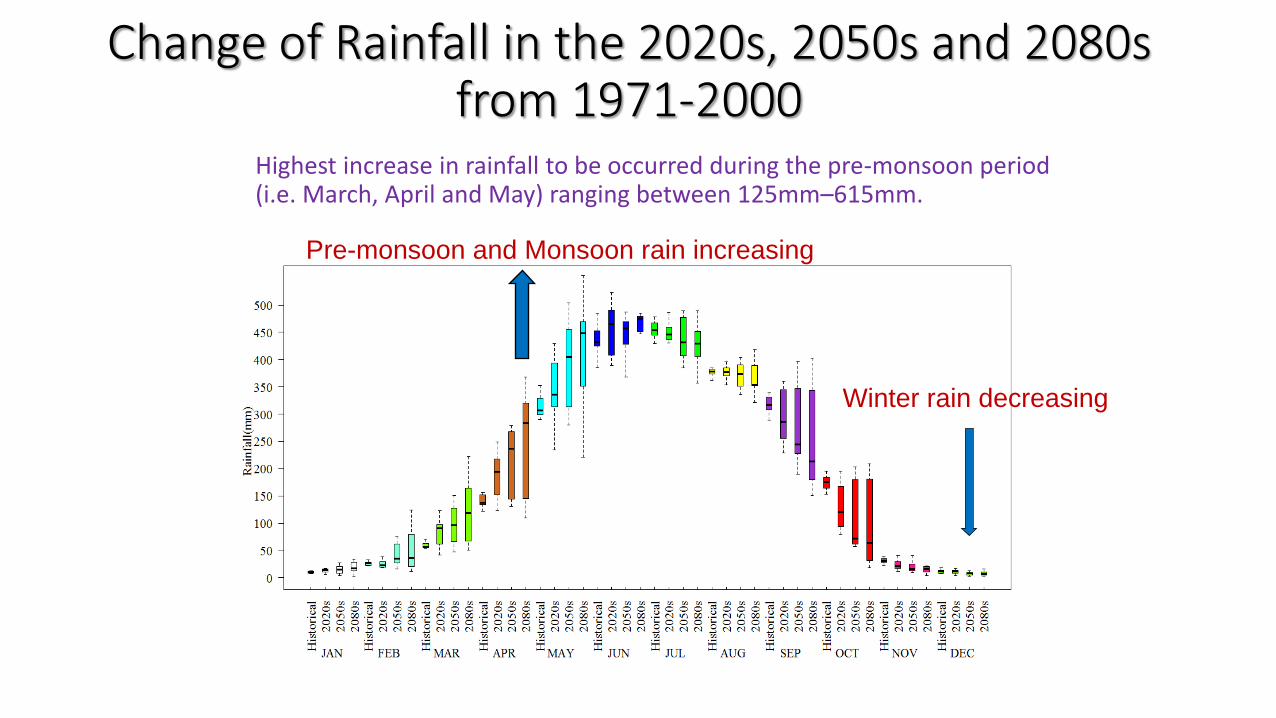
Change of Rainfall in the 2020s, 2050s and 2080s from 1971-2000
Highest increase in rainfall to be occurred during the pre-monsoon period (i.e. March, April and May) ranging between 125mm–615mm.
Pre-monsoon and Monsoon rain increasing
Winter rain decreasing
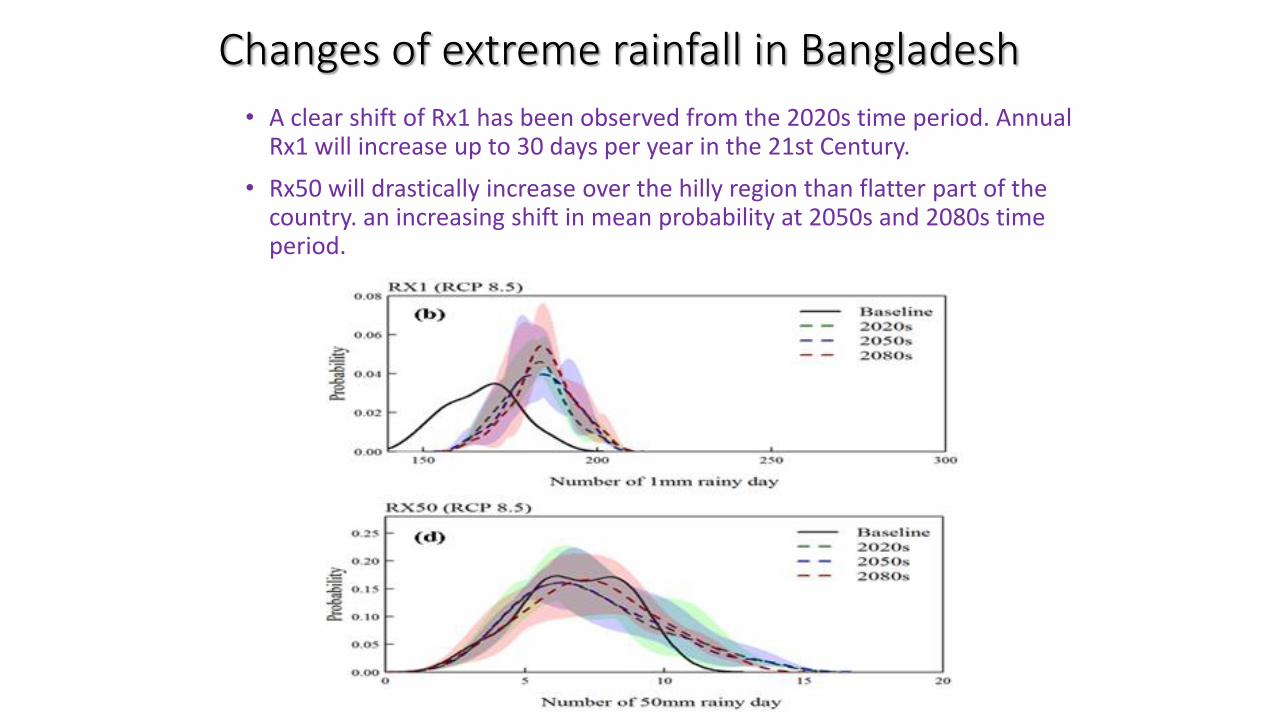
Changes of extreme rainfall in Bangladesh
• A clear shift of Rx1 has been observed from the 2020s time period. Annual Rx1 will increase up to 30 days per year in the 21st Century.
• Rx50 will drastically increase over the hilly region than flatter part of the country. an increasing shift in mean probability at 2050s and 2080s time period.

Uncertainty in the Changes of Future Flow
• increasing tendency of the discharge ofBrahmaputra River at Bahadurabadstation during monsoon when floodusually occurs, while some othermodels show a decreasing tendencytowards the end of the 21st century.
• During the pre-monsoon period(MAM), some of the models showsignificant increases of the dischargepeaks, while most of the models showthat the peak during this season willremain relatively unchanged.

Land Ice
• Data from NASA's GRACE satellites show that the land ice sheets in both Antarctica and Greenland are losing mass. The continent of Antarctica has been losing about 134 billion metric tons of ice per year since 2002, while the Greenland ice sheet
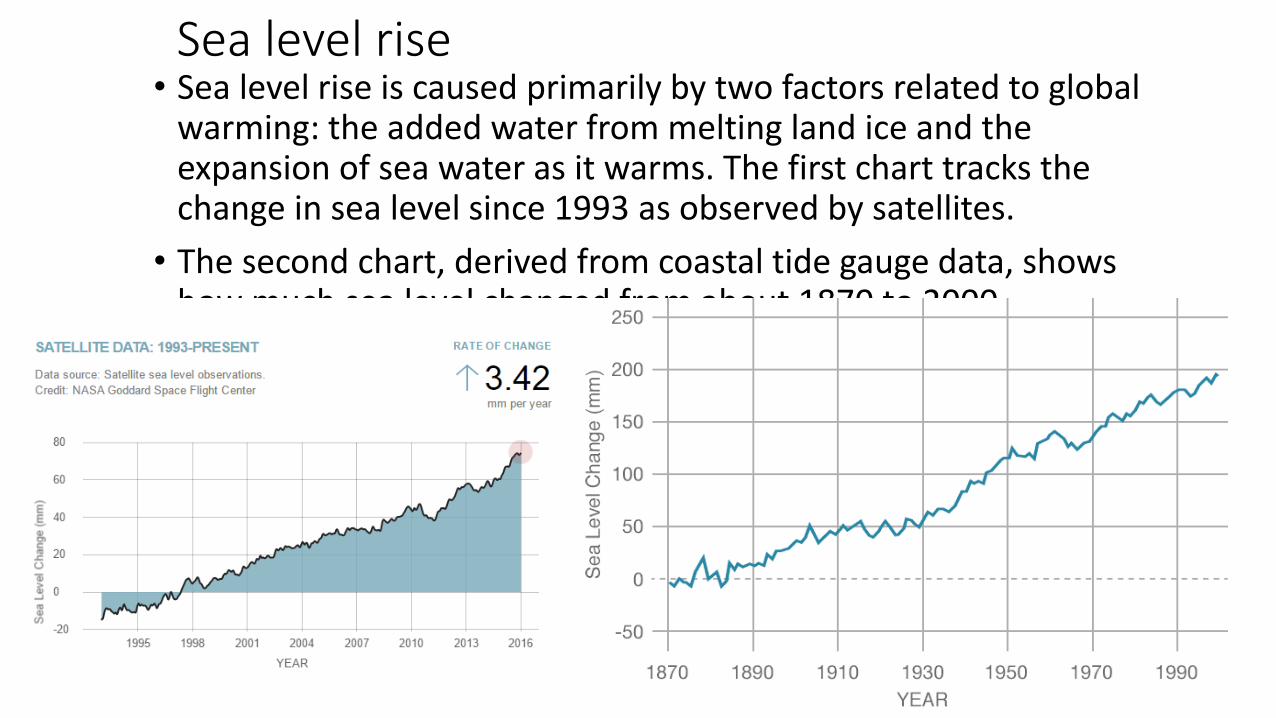
Sea level rise• Sea level rise is caused primarily by two factors related to global
warming: the added water from melting land ice and the expansion of sea water as it warms. The first chart tracks the change in sea level since 1993 as observed by satellites.
• The second chart, derived from coastal tide gauge data, shows how much sea level changed from about 1870 to 2000.

Inundation map for 1.0m and 0.5m Sea Level Rise (SLR)
• Inundation area will be increased under increased SLR
1.0m SLR0.5m SLR

El Niño Winter Pattern

La Niña Winter Pattern

Comparing with other historical El Niños
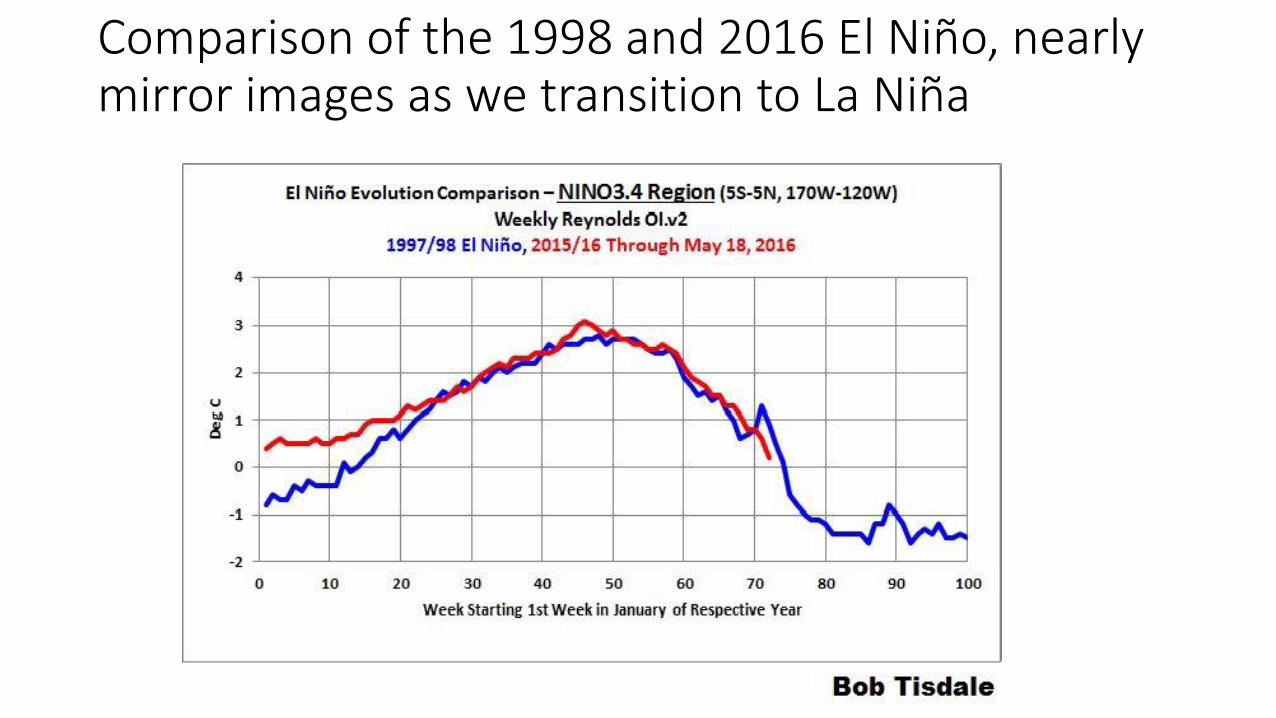
Comparison of the 1998 and 2016 El Niño, nearly mirror images as we transition to La Niña

Comparing Images of El Niño of 1998 and 2016

Predicted La Niña

1998 floods1988 floods 2007 floods
2016 flash flood
2010 flash flood
1984 floods
2004 flash floods

Flash Flood Flash Flood Forecasting and Early Warning System (FFEWS)
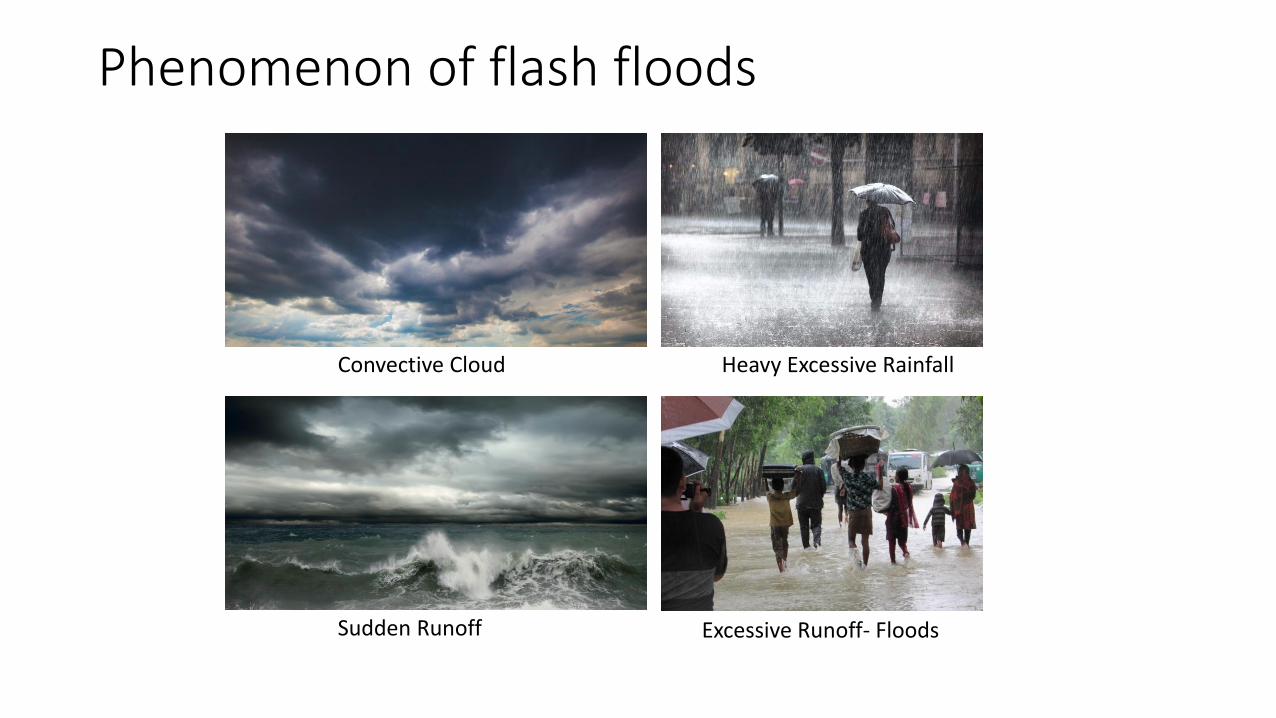
Phenomenon of flash floods
Convective Cloud Heavy Excessive Rainfall
Sudden Runoff Excessive Runoff- Floods

Flash Flood
• A flash flood is characterized by flood occurred from heavy or excessive rainfall in a short period of time over a relatively small area.
• In flash flood, water level rises and falls quite rapidly with little or noadvance weather forecast or warning. Typically, flash flood occurs inareas where the upstream basin topography is relatively steep andthe concentration time of the basin is relatively short.
• In Bangladesh, flash floods generally occur in the north-east (Known as Haor areas) during pre-monsoon season (March-May).

How Flash Flood occur

Flash Flood Forecasting
• Flash floods represent forecast and detection challenges because they are not always caused simply by meteorological phenomena.
• Flash floods result when specific meteorological and hydrological conditions exist together.
• Although heavy rainfall is usually a factor, a given amount and duration of rainfall may or may not result in a flash flood, depending on the hydrologic characteristics of the watershed where the rain is occurring.

Necessity of Flash Flood Forecasting

Flash Flood Forecasting Project
• Forecasting flash flood and proper dissemination of information are challenging tasks considering the complex topography, observed data availability, computation resources availability, lead time requirements and institutional ability to disseminate information. In this context,
• Institute of Water and Flood Management (IWFM) of BangladeshUniversity and Engineering and Technology (BUET) has proposed thisresearch study for comprehensive modeling and community basedforecasting system, which will be delivered to the Flood Forecasting andWarning Center (FFWC) of Bangladesh Water Development Board (BWDB).
FFEWAS
• The proposed research study has been funded by the Climate Adaptation and Livelihood Improvement Project (CALIP) of the International Fund for Agricultural Development (IFAD) and Government of Bangladesh. This fund will be used in assisting national organizations (e.g. FFWC of BWDB, IWM and BMD for their capacity building through providing professional trainings and knowledge products.
• This study will carry out a research to develop a feasible, open source supported modeling tools to forecast flash flood in the Haor region of Bangladesh and assisting national organizations (e.g. FFWC of BWDB, IWM and BMD) for their capacity building through providing professional trainings and knowledge products.

Flow Chart of Methodology
• Data Assimilation for WRF
• Weather Modeling for Rainfall forecasting
• Rainfall Runoff modeling, HEC-HMS
• Hydraulic Modeling, HEC-RAS
• Flood Inundation Modeling , HEC-RAS 2D
• Flood information at the Gauge stations and flood maps
• Statistical Modeling (ANN, SVN)
• Flash Flood Guideline
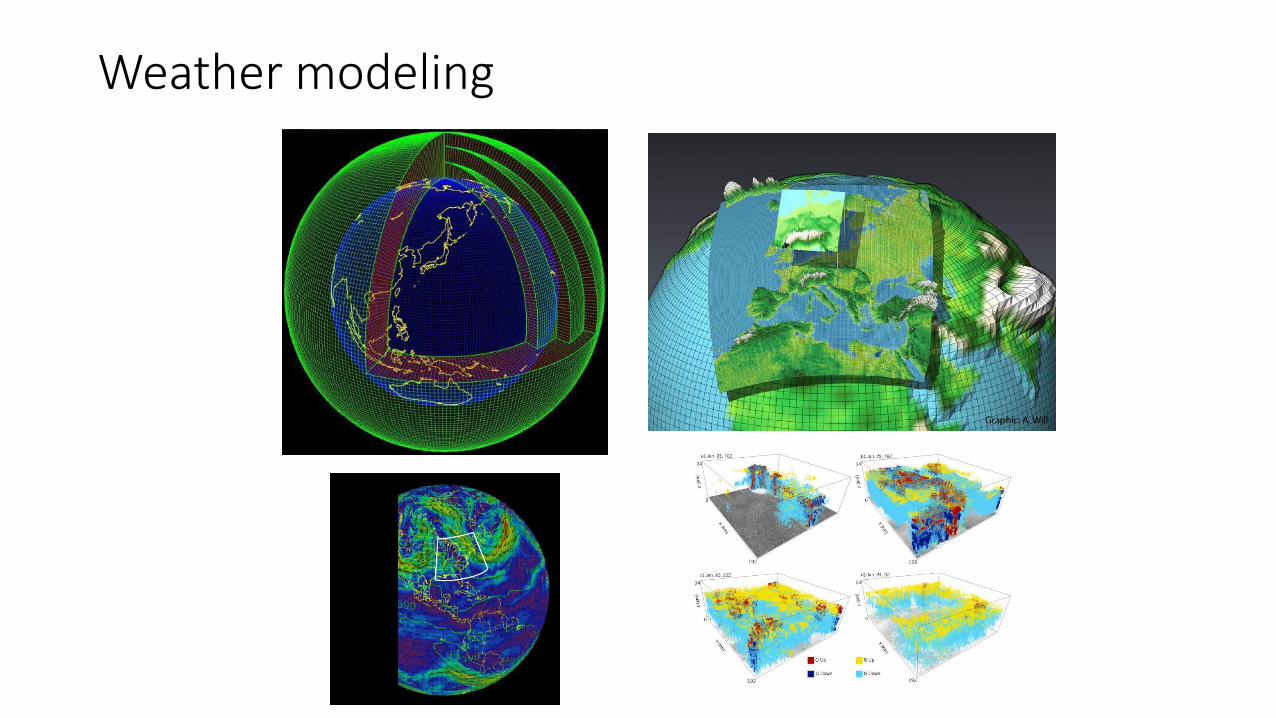
Weather modeling

Weather modeling using WRF
• The WRF model has been used for simulation of the MCSs associated with squalls in this study.
• The WRF model is a new generation mesocale NWP system designed to serve both operational forecasting and atmospheric research needs (NCAR 2009).
• It features multiple dynamical cores, a 3DVAR data assimilation system, and a software architecture allowing for computational parallelism and system extensibility.
• WRF is suitable for a broad spectrum of applications across scales ranging from meters to thousands of kilometers.
• Applications of WRF include research and operational NWP, data assimilation and parameterized physics research, downscaling climate simulations, driving air quality models, atmosphere-ocean coupling, and idealized simulations (i.e., boundary layer eddies, convection, baroclinic waves).
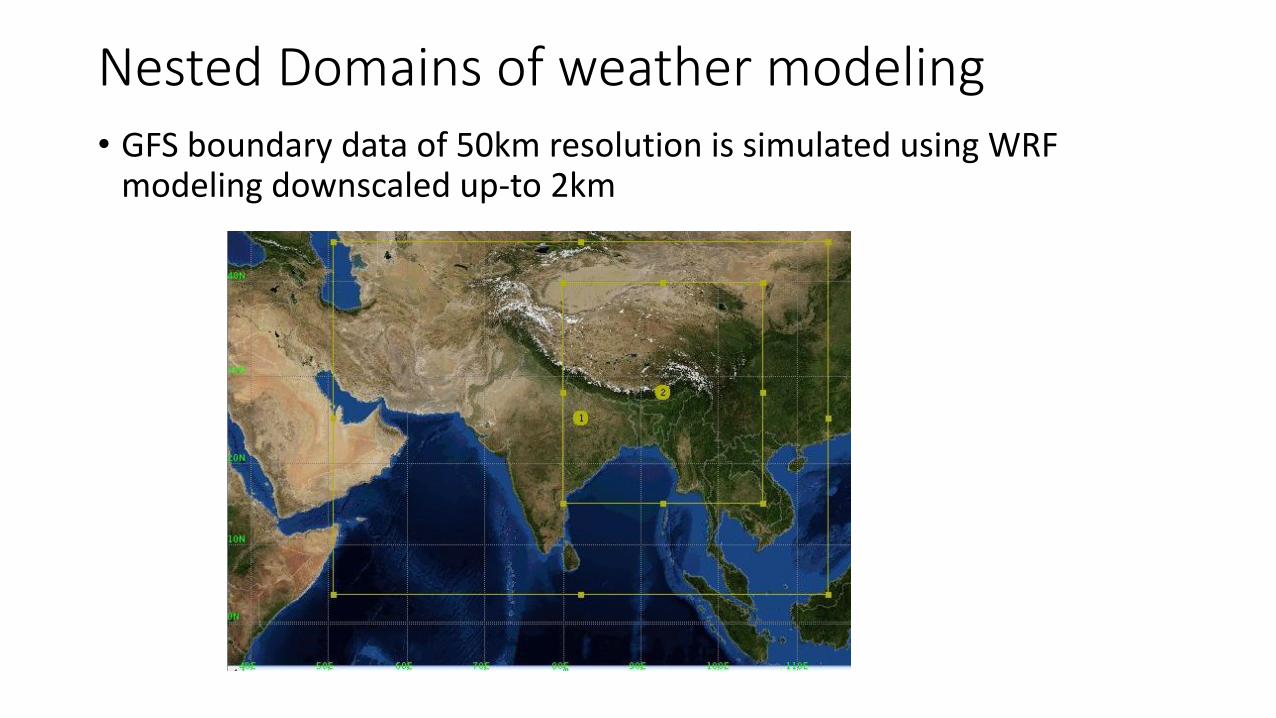
Nested Domains of weather modeling• GFS boundary data of 50km resolution is simulated using WRF
modeling downscaled up-to 2km
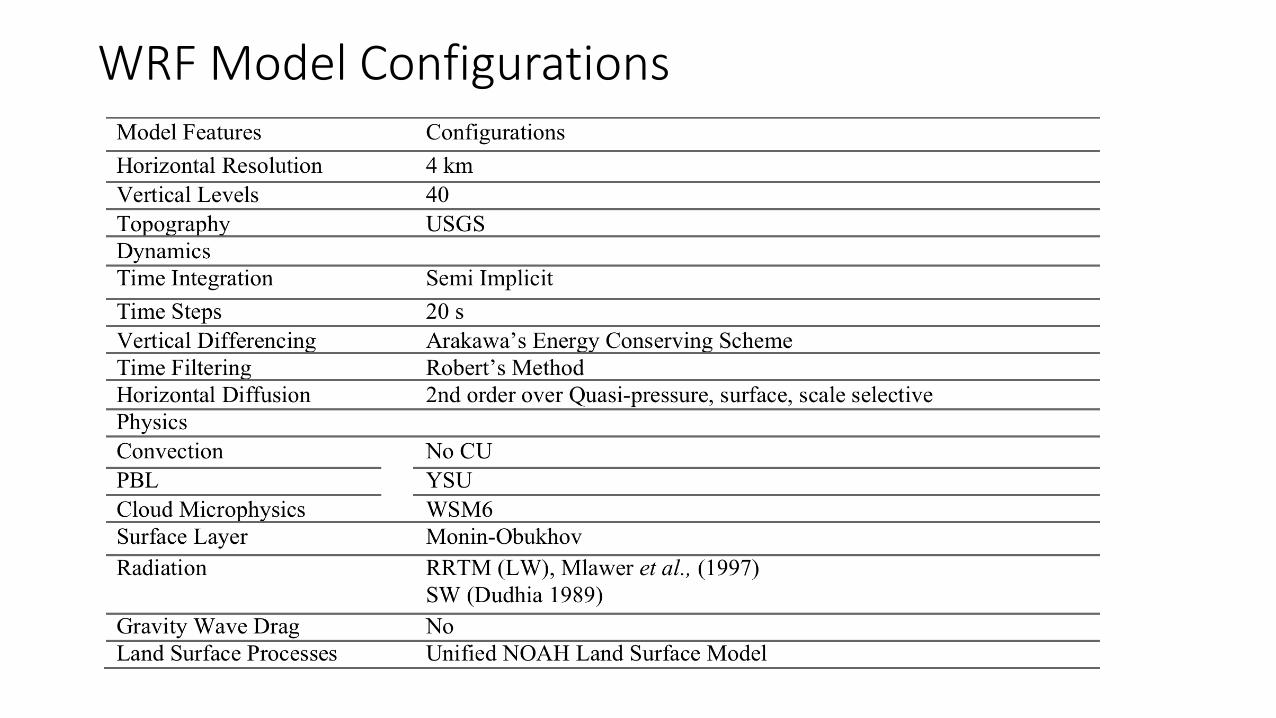
WRF Model Configurations

3-hourly accumulated rainfall forecasting using WRF (5-day lead)
Hydrological and Hydrodynamic modeling
• Hydrologic modelling system is essential to simulate precipitation-runoff process in a watershed system. The entire procedure requires pre-processing of necessary data to develop basin hydrology. Considering all the aspects, the objectives of this study have been set as follows:
To delineate the watershed and stream network of Upper Meghna Basin by using Arc Hydro tools and HEC-GeoHMS.
To setup a distributed hydrologic model of Upper Meghna basin in HEC-HMS.
To calibrate and validate the model using flow data at Bhairab Bazar station as well as other flash flood occurring points.
To find out flows at 25 flash flood warning points which will use as boundary conditions for HEC RAS model development.
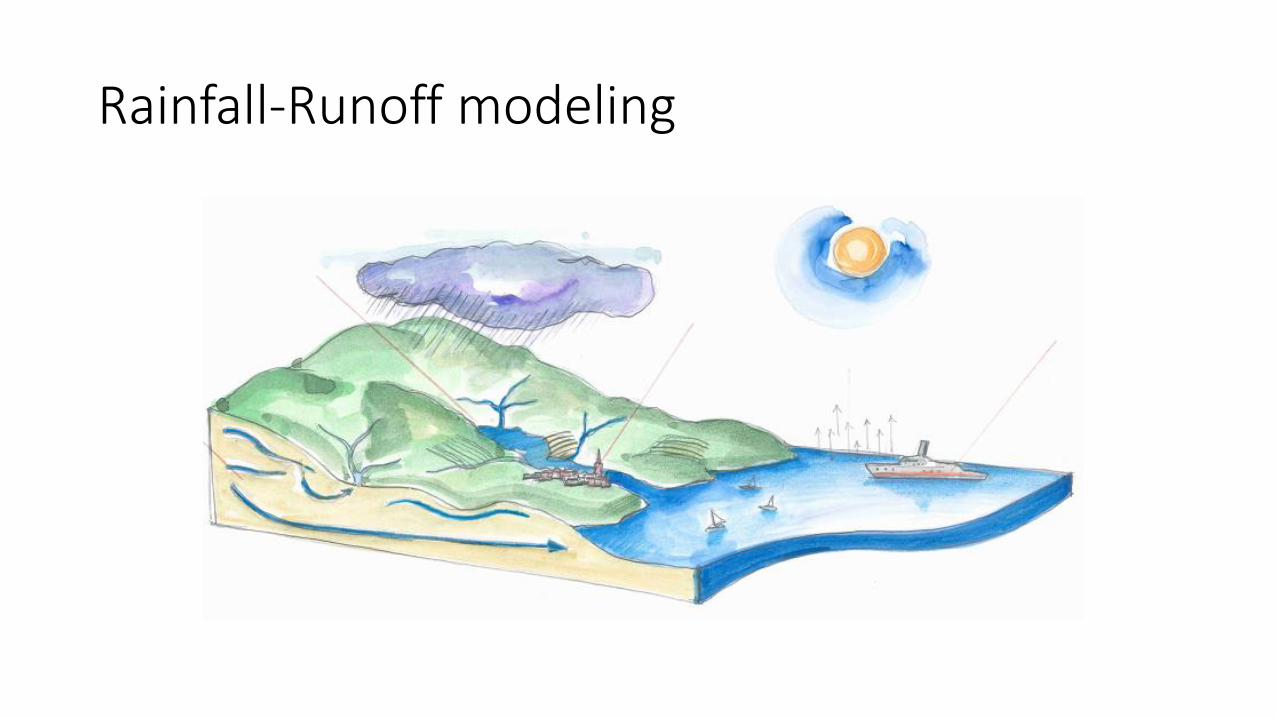
Rainfall-Runoff modeling
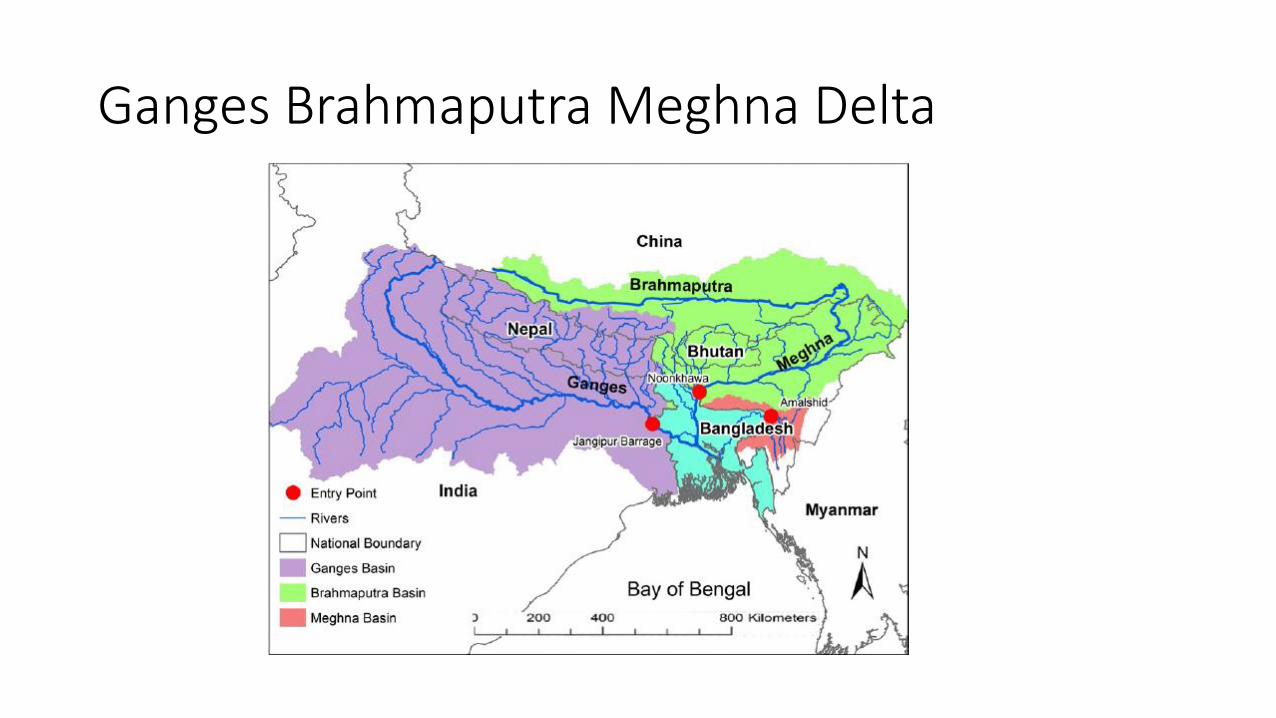
Ganges Brahmaputra Meghna Delta

Flood water comes from three major basins: Ganges, Brahmaputra and Meghna (GBM)
Brahmaputra
GangesMeghna

Meghna Basins in the Haor RegionsIndia 57% and Bangladesh 43% of area 82,000 km2
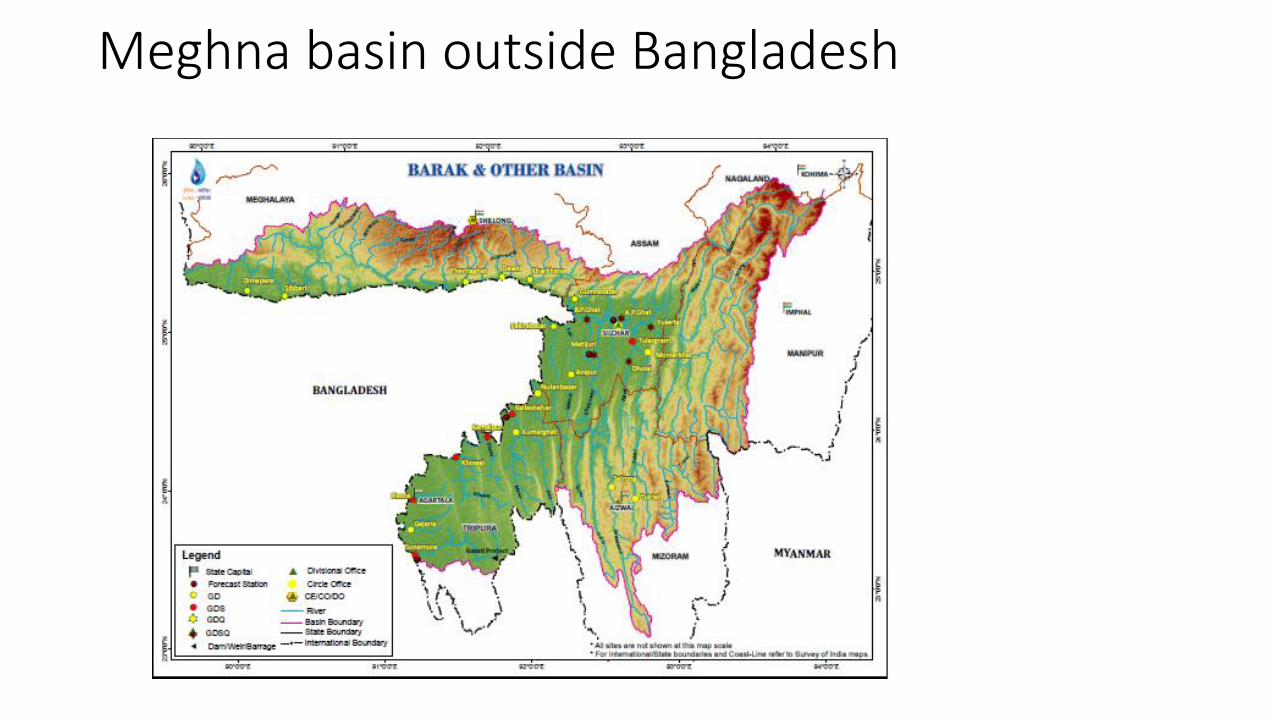
Meghna basin outside Bangladesh

Northeast Haor Regions of Bangladesh

Eastern Hilly rivers
Lukha river
Kongsho riverSurma river

Basin modeling using HEC-HMS
• HEC-HMS omits any detailed accounting of movement of water within the soil.
• It includes models of infiltration from the land surface. But it does not model storage and movement of water vertically within the soil layer.
• It implicitly combines the near surface flow and overland flow and models this as direct runoff.
• It does not include a detailed model of interflow or flow in the groundwater aquifer, instead representing only the combined outflow as base flow.
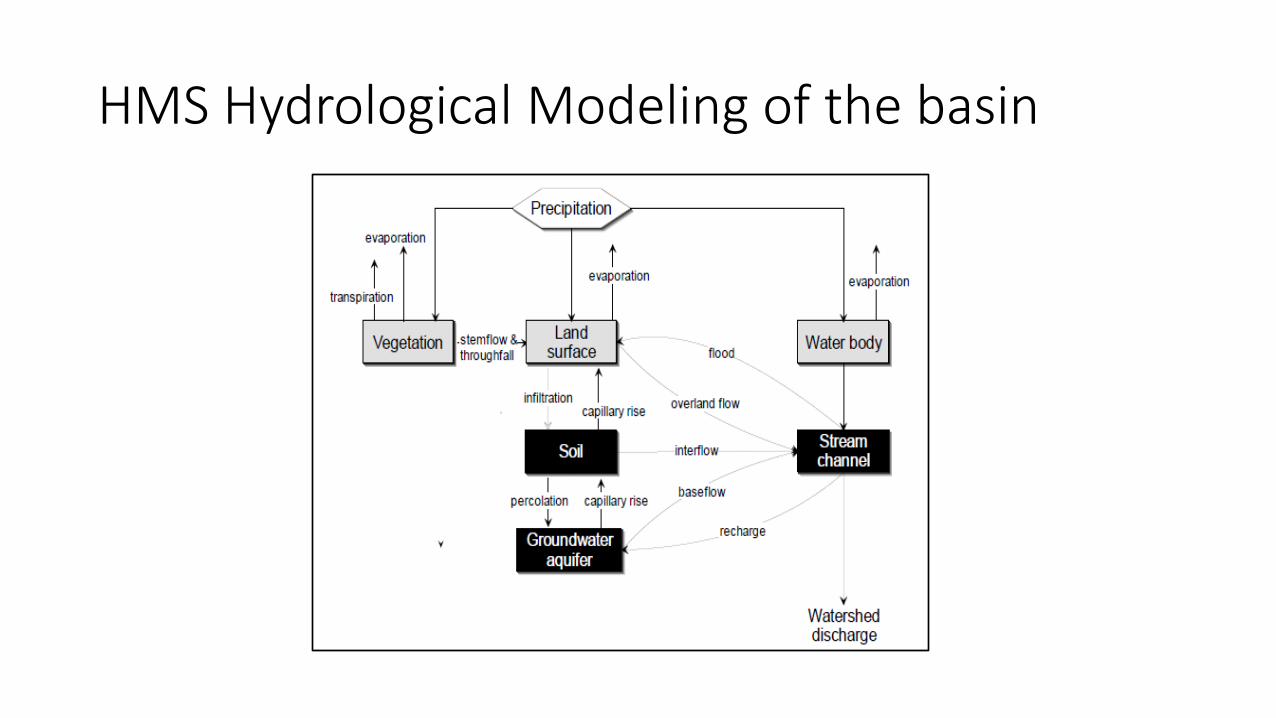
HMS Hydrological Modeling of the basin
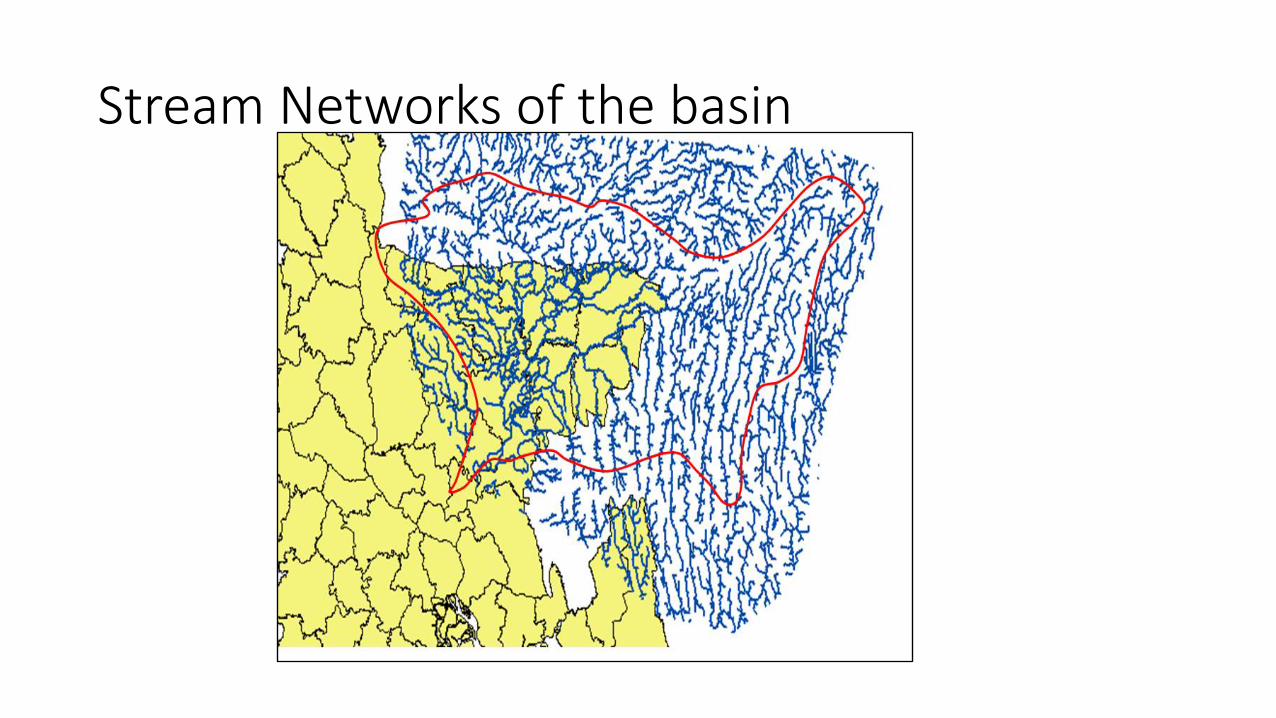
Stream Networks of the basin

Zoomed view of river network
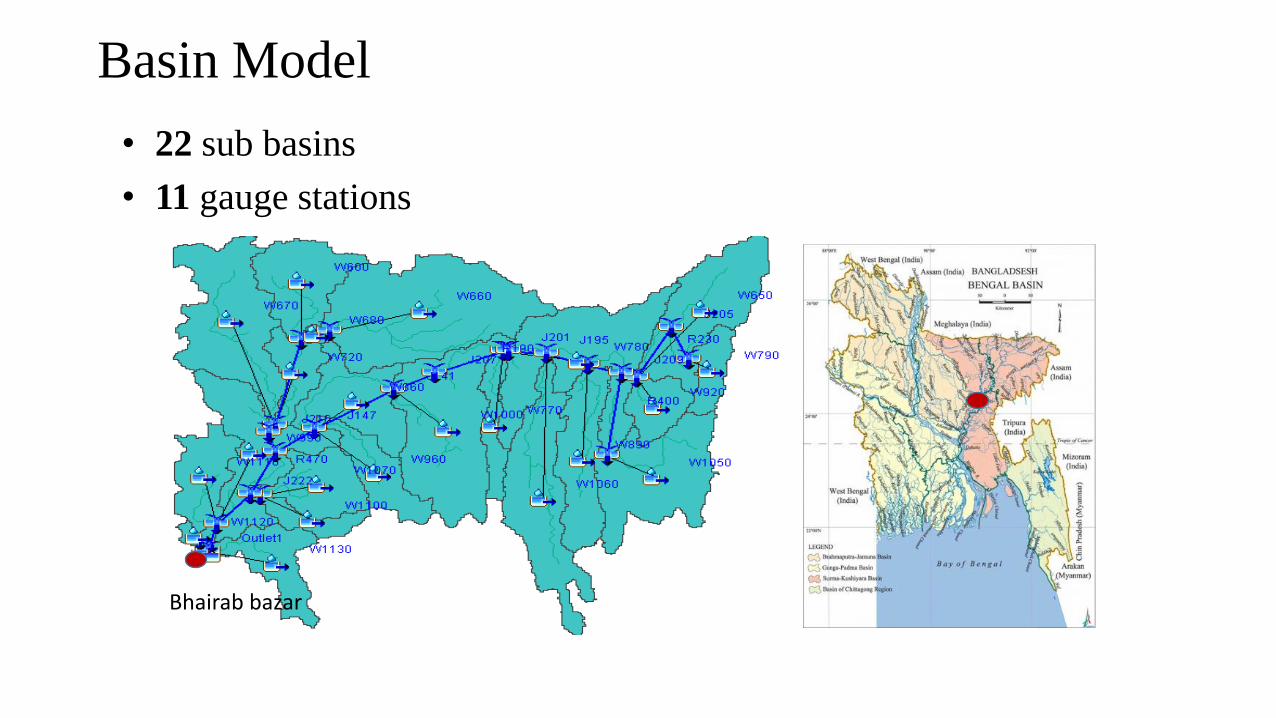
Basin Model
• 22 sub basins
• 11 gauge stations
Bhairab bazar

Curve Number Grid
Land use and soil data are used to generate Curve number grid for each subbasin
CN (Curve Number) value ranges from 71 to 100

Necessary Data and Sources of the Study
Data Source Resolution/Period
DEM HydroSHEDS (source:
http://hydrosheds.cr.usgs.gov/index.php)
30s
Stream
Network
HydroSHEDS 30s
Land use map GlobCover (source:
http://due.esrin.esa.int/globcover/)
1:5,000,000
Soil data map FAO (source:
http://www.fao.org/climatechange/54273
/en/)
1000 m
Precipitation BWDB & NASA 2005, 2006
Discharge BWDB 2005, 2006
Future
Precipitation
RCP 8.5 scenario ( Model name:
CCSM4; Lead Research Center:
National Center for Atmospheric
Research)
2030, 2050, 2080
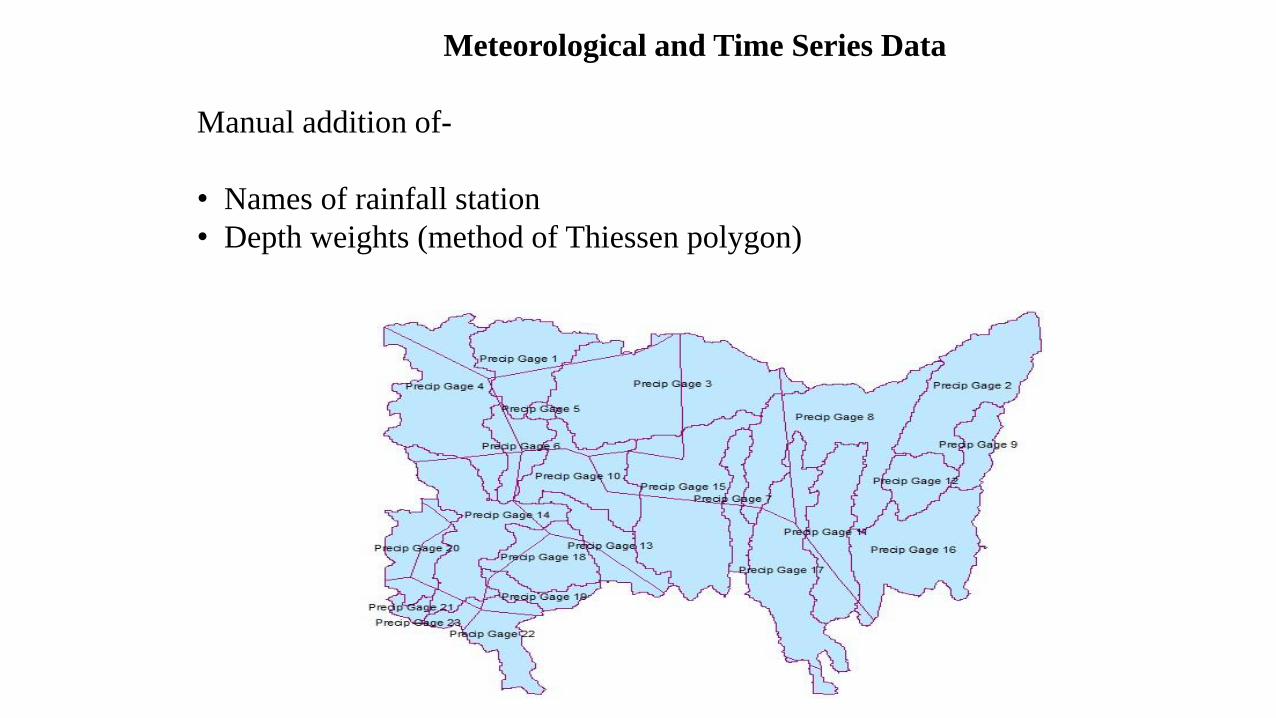
Meteorological and Time Series Data
Manual addition of-
• Names of rainfall station
• Depth weights (method of Thiessen polygon)

Model Parameters Calibration and Validation
• Calibration Point : Bhairab Bazar
• Calibration Period : 2005
• Validation Period : 2006
Elements Parameters Initial Final
For all Sub basins
Lag time, tp (hr) 18.86 144
Peaking coefficient, Cp 0.5 0.22
Initial Discharge (m3/sec) 10 100
Recession constant 0.11 0.91
Initial Abstraction, Ia0
0.15488 to
0.15509
For all ReachesMuskingum K (hr) 6 24
Muskingum X 0.45 0.45
Table: Final Calibrated Parameters

0
2000
4000
6000
8000
10000
12000
5-May-05 5-Jun-05 5-Jul-05 5-Aug-05 5-Sep-05 5-Oct-05 5-Nov-05
Flo
w (
cum
ec)
Time Period (year 2005)
OBSERVED FLOW SIMULATED FLOW
NSE = 0.83
RSR = 0.41
PBIAS= +5.53
Calibration Graph
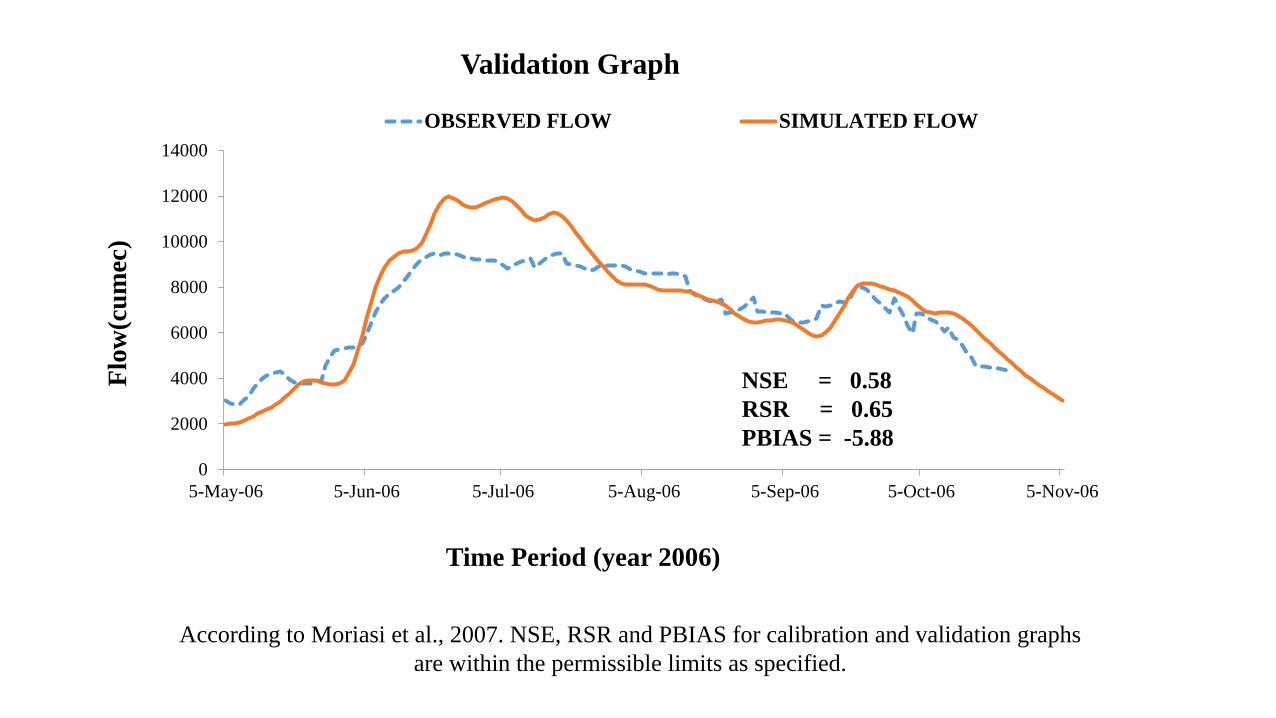
Validation Graph
0
2000
4000
6000
8000
10000
12000
14000
5-May-06 5-Jun-06 5-Jul-06 5-Aug-06 5-Sep-06 5-Oct-06 5-Nov-06
Flo
w(c
um
ec)
Time Period (year 2006)
OBSERVED FLOW SIMULATED FLOW
NSE = 0.58
RSR = 0.65
PBIAS = -5.88
According to Moriasi et al., 2007. NSE, RSR and PBIAS for calibration and validation graphs
are within the permissible limits as specified.

One dimensional river flow modeling

Hydrodynamic modeling of NE Regions using HEC-RAS 1D/2D model
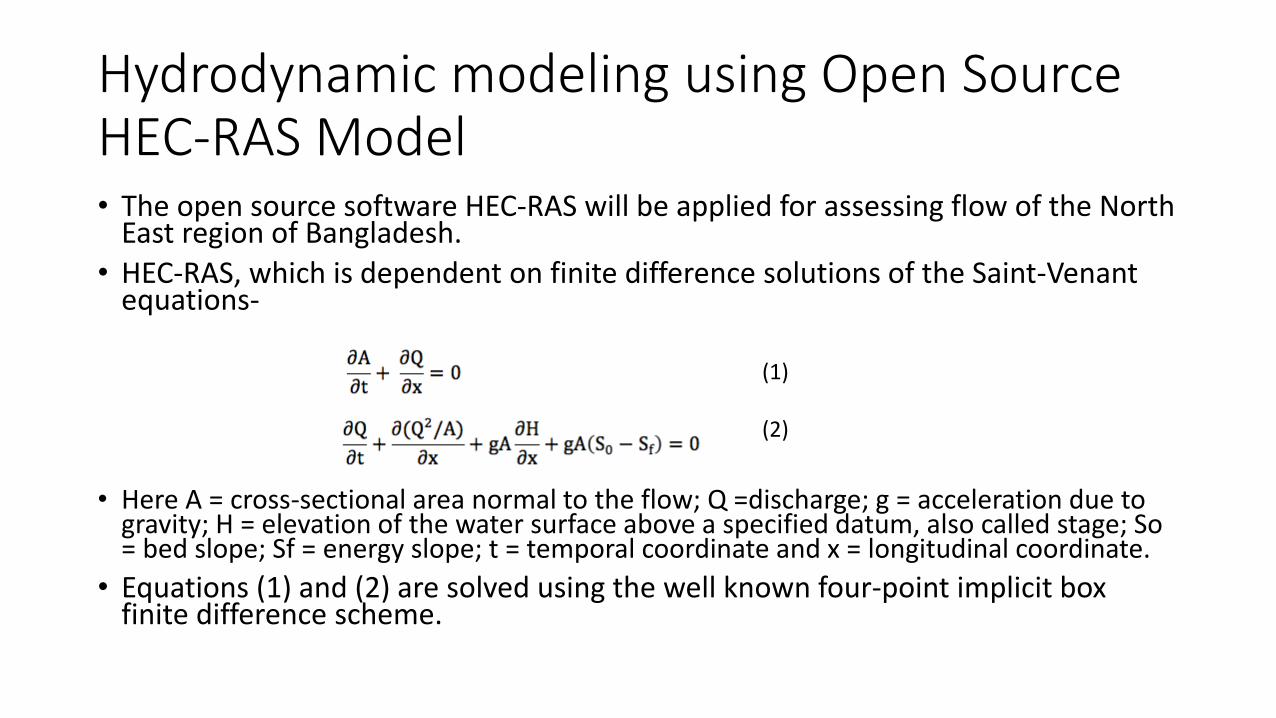
Hydrodynamic modeling using Open Source HEC-RAS Model• The open source software HEC-RAS will be applied for assessing flow of the North
East region of Bangladesh.
• HEC-RAS, which is dependent on finite difference solutions of the Saint-Venantequations-
• Here A = cross-sectional area normal to the flow; Q =discharge; g = acceleration due to gravity; H = elevation of the water surface above a specified datum, also called stage; So = bed slope; Sf = energy slope; t = temporal coordinate and x = longitudinal coordinate.
• Equations (1) and (2) are solved using the well known four-point implicit box finite difference scheme.
(1)
(2)

Steady Flow Simulation

Steady Flow Simulation

Existing Forecasting Stations of FFWC
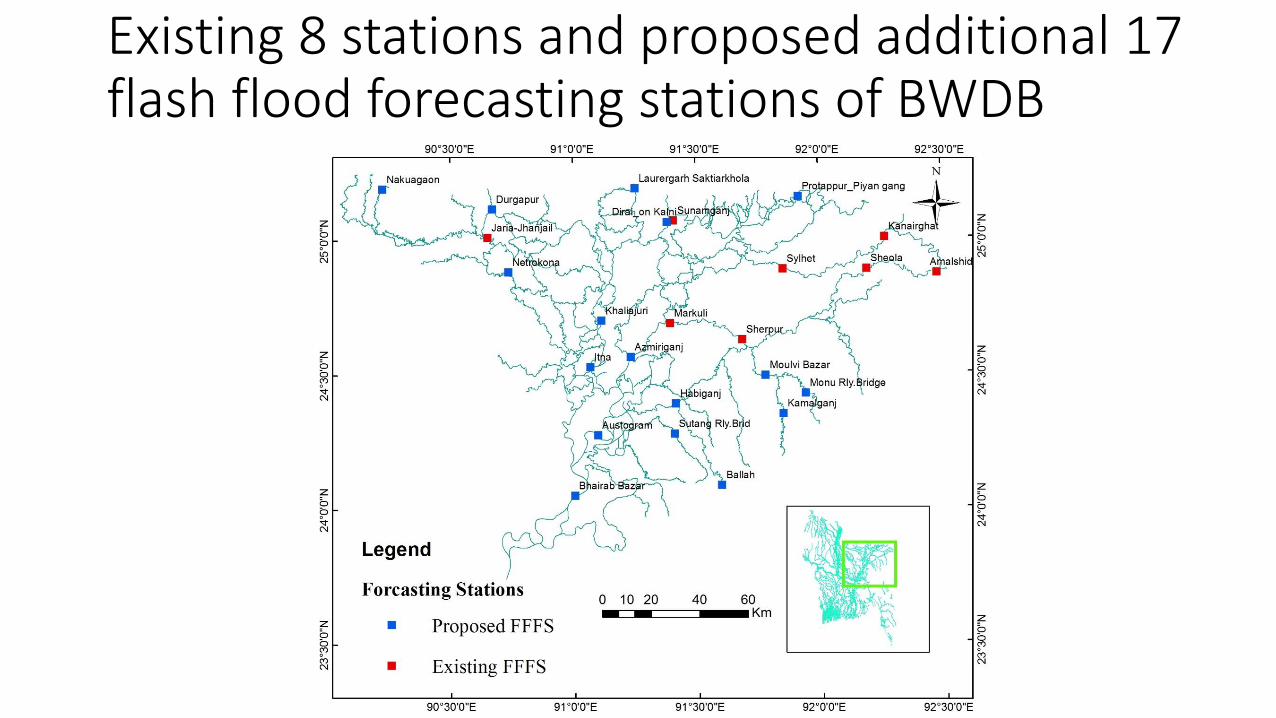
Existing 8 stations and proposed additional 17 flash flood forecasting stations of BWDB

Capacity building and knowledge sharing and dissemination• Two short courses will be held during the project period on-
• Weather modeling
• Hydrological and Hydrodynamic modeling
• A number of national seminars and workshops (like this workshop) will be held like this workshop to gather feedbacks from the participants.
• Research reports will be published and will be presented in the disseminating workshop.

Flash flood event in the north east region during 17-22 April 2016 and 17-18 April 2010

Orography of heavy rainfall location

WRF model domain used for rainfall forecasting to improve flash flood forecasting of the north east Haor regions of Bangladesh
18km 6 km
372 × 259418 × 460

WRF model parameters for simulating flash flood event on 18 April 2010
Model Features Configurations
Horizontal Resolution 18 km and 6 km
Vertical Levels 30
Topography USGS
Time Integration Semi Implicit
Vertical Differencing Arakawa’s Energy Conserving Scheme
Time Filtering Robert’s Method
Horizontal Diffusion 2nd order over Quasi-pressure, surface, scale selective
Convection Kain-Fritsch (new Eta) scheme
PBL YSU
Cloud Microphysics WSM 6-class graupel scheme
Surface Layer Monin-Obukhov
Radiation RRTM (LW), SW (Dudhia 1989)
Gravity Wave Drag No
Land Surface Processes Unified NOAH Land Surface Model

TRMM derived 3 hourly rainfall on 17 April 2010

TRMM derived 3 hourly rainfall on 18 April 2010

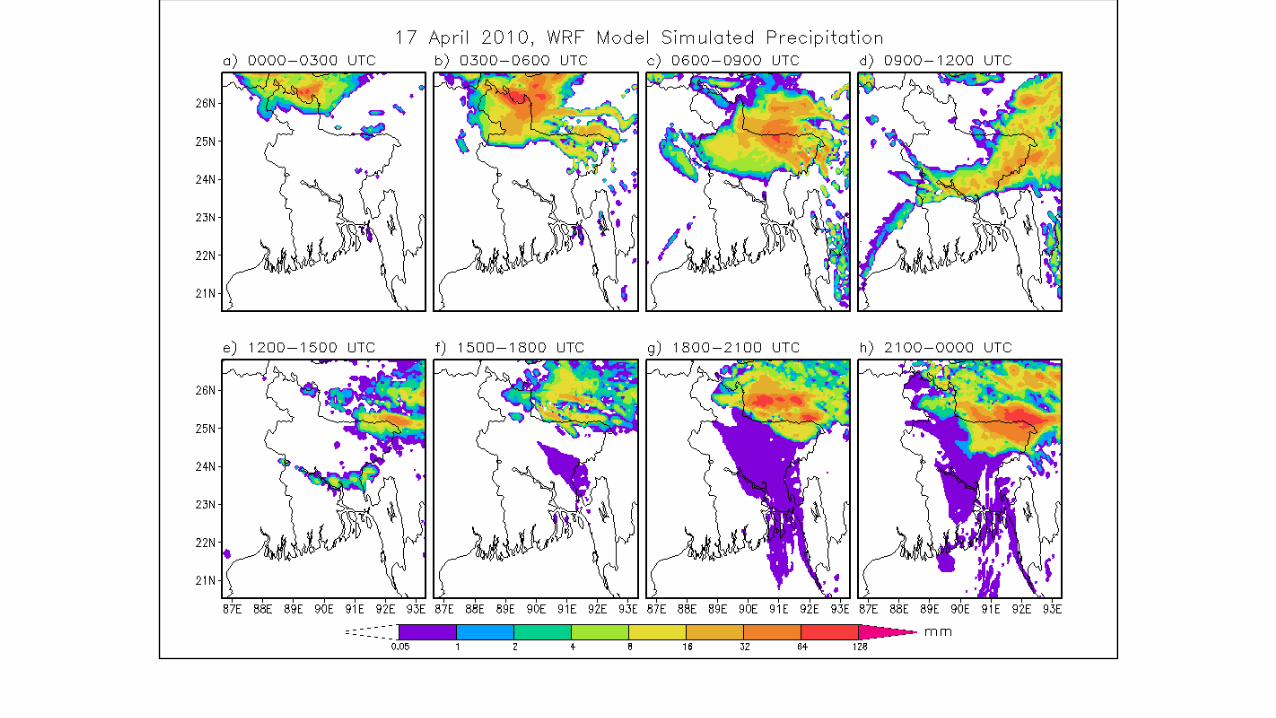
WRF simulated 6 hourly rainfall on 17 and 18 April 2010
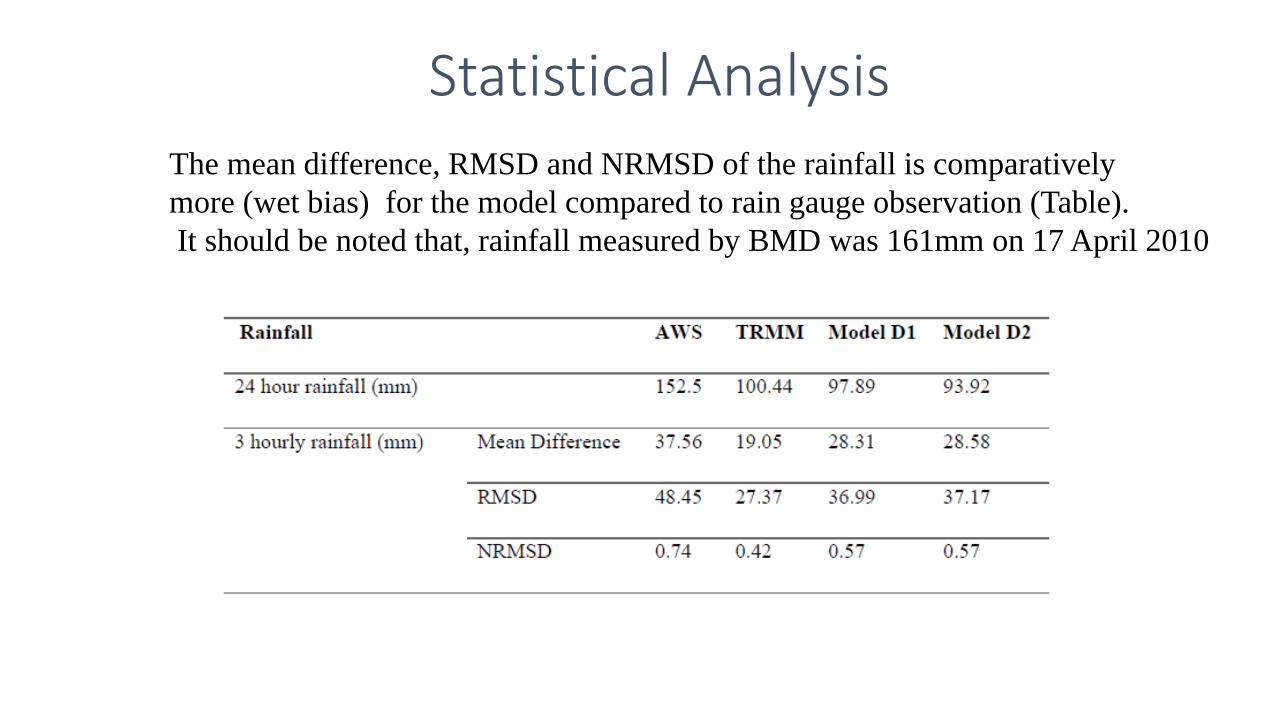
Statistical AnalysisThe mean difference, RMSD and NRMSD of the rainfall is comparatively
more (wet bias) for the model compared to rain gauge observation (Table).
It should be noted that, rainfall measured by BMD was 161mm on 17 April 2010

Summary
• This study has investigated the ability of a cloud-resolving WRF to
reproduce the convective cells associated with a heavy rainfall event over
the Haor region of Bangladesh.
• The ability of WRF model with a highest resolution of 18 and 6 km
horizontal grid spacing to predict heavy rainfall near Sylhet in the
northeastern part of Bangladesh on 17 and 18 April 2010 was evaluated.
• The model underestimated the strength of the storm in general in term of
the rainfall. The simulated rainfall is usually about 93.92 mm day-1, for
outer domain and 97.89 mm day-1 for inner domain but observed amount
is 161 mm day-1. TRMM retrieved 24 hours rain amount is 100 mm which
is also less compared to rain gauge observation.
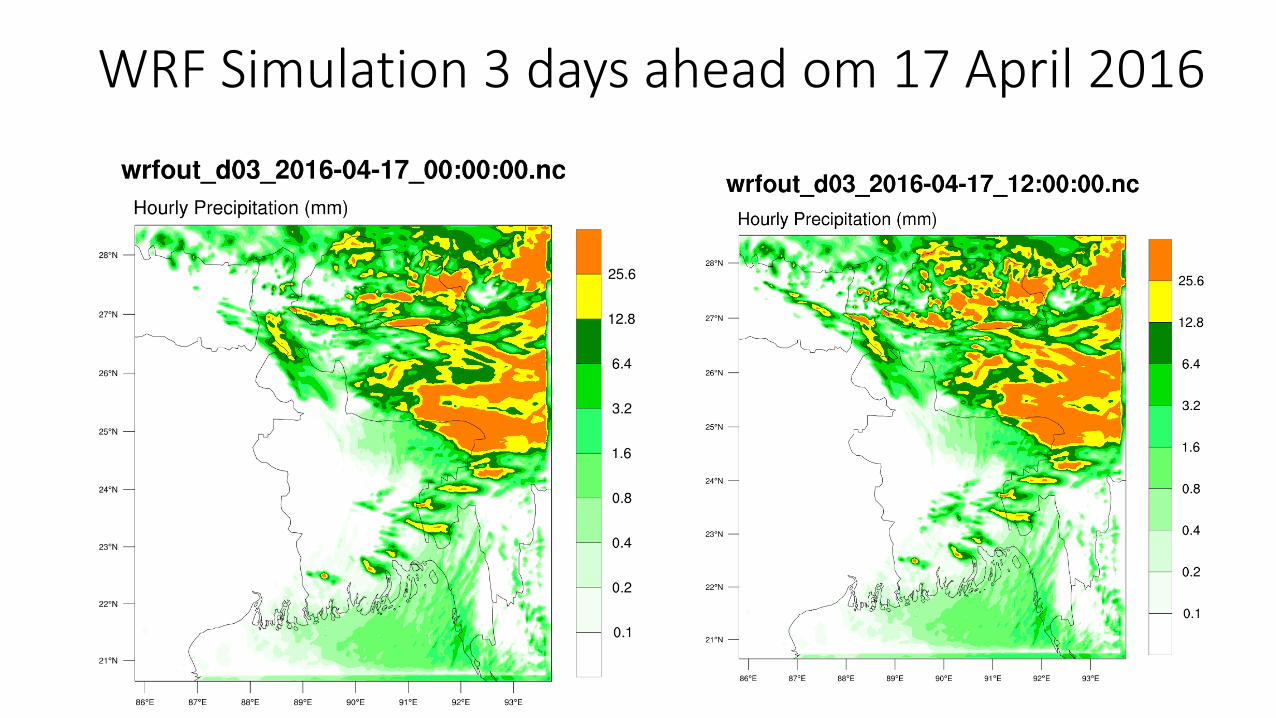
WRF Simulation 3 days ahead om 17 April 2016

WRF Simulation 4 days ahead on 18 April 2016
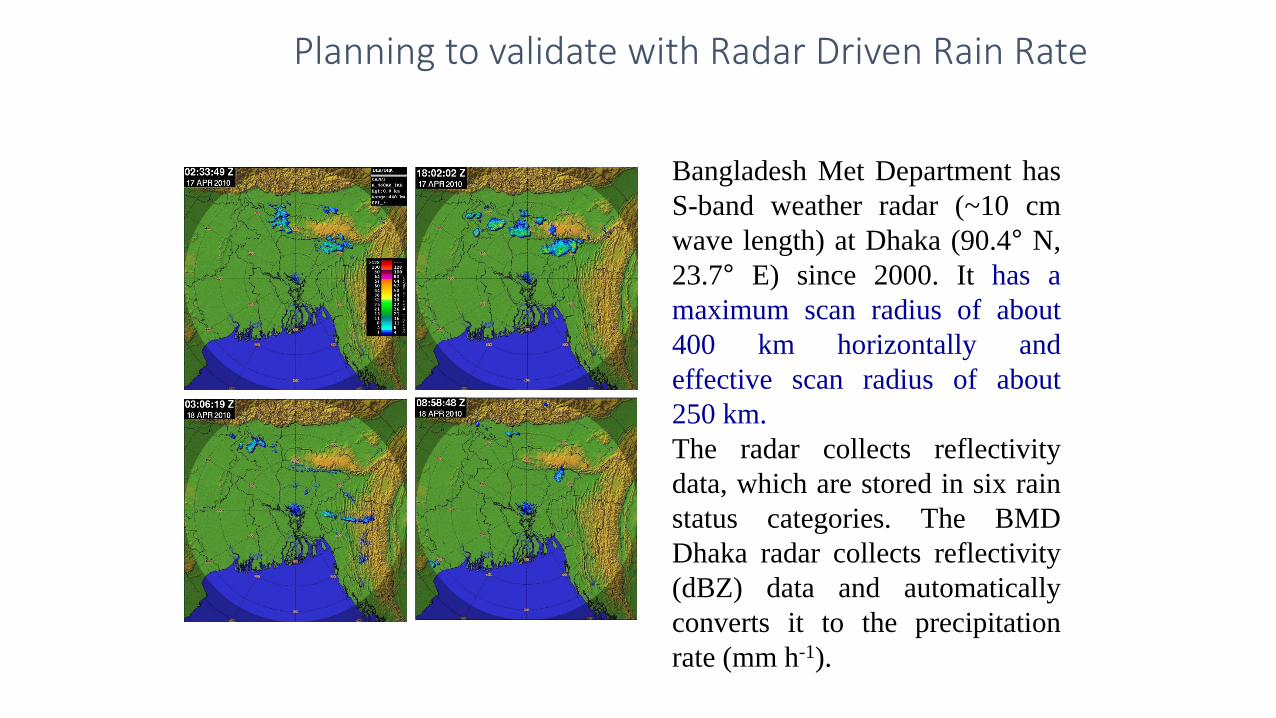
Planning to validate with Radar Driven Rain Rate
Bangladesh Met Department has
S-band weather radar (~10 cm
wave length) at Dhaka (90.4° N,
23.7° E) since 2000. It has a
maximum scan radius of about
400 km horizontally and
effective scan radius of about
250 km.
The radar collects reflectivity
data, which are stored in six rain
status categories. The BMD
Dhaka radar collects reflectivity
(dBZ) data and automatically
converts it to the precipitation
rate (mm h-1).

Pre monsoon Danger Level for saving borocrops of the Northeast Haor Regions

Station No
River Name Station Name Station IDWater level (m) for the floods
with the return period Best Fitted Distribution
2.33 - yr 5-yr 10-yr 20-yr 50-yr 100-yr
1 Bhogai-Kangsa Nakuagaon SW 34 21.08512435 21.735 22.250 22.731 23.332 23.767 P3
2 Bhogai-Kangsa Jaria-jangail SW 36 7.191266398 8.085 8.707 9.228 9.805 10.177 GEV
3 Dhalai Kamalganj SW 67 19.58179966 20.160 20.455 20.643 20.797 20.870 GEV
4 Dhanu-Baulai-Ghorautra Khaliajuri SW 72 5.310325723 5.885 6.197 6.409 6.594 6.687 GEV
5 Dhanu-Baulai-Ghorautra Itna SW 73
4.45995617 5.07 5.56 6.02 6.60 7.03 GEV
4.539844518 5.12 5.54 5.91 6.35 6.66 LN3
4.520187821 5.12 5.57 5.97 6.46 6.80 LN
6 JadukataLaurergarh Saktiarkhola
SW 131.5 6.912978193 7.764 8.477 9.184 10.135 10.873 LP3
7 Khowai Ballah SW 15722.05413694 23.168 24.047 24.866 25.887 26.622 P3
21.82891589 23.008 24.148 25.408 27.299 28.922 LP3
8 Khowai Habiganj SW 159 9.35128886 10.385 11.042 11.548 12.061 12.363 GEV
9 Kushiyara Amalshid SW 172.513.34018479 15.307 16.603 17.637 18.724 19.386 GEV
13.29706122 15.159 16.435 17.509 18.727 19.534 LP3
10 Kushiyara Sheola SW 173 11.2231633 12.865 13.938 14.787 15.673 16.209 GEV
11 Kushiyara Sherpur SW 175.5 7.743932498 8.437 8.803 9.043 9.247 9.347 GEV
12 Monu Monu Rly.Bridge SW 201 17.15154048 17.983 18.439 18.750 19.024 19.164 GEV
13 Monu Moulvi Bazar SW 202 10.57036849 11.390 11.811 12.080 12.302 12.408 GEV
14 Someswari Durgapur SW 263 11.49004033 11.724 11.911 12.088 12.317 12.487 LP3
15 Surma-Meghna Kanairghat SW 266 11.15511783 12.856 14.039 15.028 16.125 16.829 GEV
16 Surma-Meghna Sylhet SW267
8.632004977 9.849 10.673 11.345 12.071 12.526 GEV
8.810893352 9.852 10.481 10.961 11.455 11.755 LP3
8.689338181 9.800 10.541 11.156 11.846 12.301 P3
17 Surma-Meghna Sunamganj SW 269 6.413609658 7.179 7.639 7.990 8.354 8.577 P3
18 Surma-Meghna Bhairab Bazar SW 273 3.039491307 3.245 3.390 3.512 3.648 3.737 GEV
19 Sutang Sutang Rly.Brid SW 280 5.237623312 5.971 6.507 6.972 7.513 7.877 GEV
20 Mogra Netrokona SW 310 4.725462281 5.632 6.319 6.938 7.686 8.209 GEV
21 Mogra Atpara SW 311 5.186224734 6.338 7.125 7.789 8.548 9.055 P3
Danger level based on frequency analysis of water level during Pre-monsoon season (March-15 May)

Submersible Embankment Height
No Haor Name
Submersible Embankment Crest Height No Haor Name
Submersible Embankment Crest Height
1 Angurali 5.61 21 Khai haor 6.7732 Balali Padma Sree Haor 6.525 22 Kushiyara Bardal haor 12.3383 Baram Haor 3.402 23 Makalkandi haor 4.0814 Bhanda Beel 3.708 24 Mohalia Haor 5.1835 Chandra Sonar Thal haor 5.154 25 Motian haor 5.2776 Chaptir haor 4.32 26 Naluar haor(polder-1) 5.567 Dewghar 3.377 27 Naluar haor(polder-2) 6.2798 Dhankunia haor 5.139 28 Nawtana khal project 5.2649 Gurmar haor 5.534 29 Pagnar Haor 5.889
10 Haijda Embankment Project 6.602 30 Pathar Churi haor (Area-1) 8.455
11 Halir haor 5.92 31 Pathar Churi haor (Area-2) 8.2212 Humaipur haor 2.25 32 Shafique haor 14.13713 Jamkhola haor 5.823 33 Shanghair Haor 6.43914 Joal Bhanga haor 6.832 34 Shanir Haor 5.94715 Joydhona Haor 5.28 35 Sonamoral haor 5.35716 Kalikota Haor 3.936 36 Tanguar haor 4.37117 Kalner haor(Polder-1) 6.4 37 Udgal Beel haor 4.89818 Kalner haor(Polder-2) 7.485 38 Updakhali Project 6.35419 Kalner haor(Polder-3) 7.258 39 Zilkar haor 9.23620 Karchar haor 7.355

Thank you
Scenes of Bangladesh caught in my camera