Handling of missing values in statistical software ... · PDF fileHandling of missing values...
29
Eberle, Toutenburg: Handling of missing values in statistical software packages for windows Sonderforschungsbereich 386, Paper 170 (1999) Online unter: http://epub.ub.uni-muenchen.de/ Projektpartner
-
Upload
trannguyet -
Category
Documents
-
view
222 -
download
2
Transcript of Handling of missing values in statistical software ... · PDF fileHandling of missing values...

Eberle, Toutenburg:
Handling of missing values in statistical softwarepackages for windows
Sonderforschungsbereich 386, Paper 170 (1999)
Online unter: http://epub.ub.uni-muenchen.de/
Projektpartner
Handling of missing values in statistical software
packages for windows
W� Eberle H� Toutenburg
September ��� ����
Abstract
The problem of estimating parameters of distributions by an incom�
plete data set is theoretically considered� but in practice the implementa�
tion of the developed methods in commercial statistical software packages
varies from program to program� None of the examined software o�ers all
possible methods� In some programs the user has no choice concerning
the use of a method� or no methods at all are available� However� the
most popular programs have not always the largest variety of methods�
Hence some work is still waiting for the producer of statistical software�
� Introduction
In most cases� the theory of statistical methods gives answers about what todo if there is a complete data set� On the other hand� more often than we�dlike to the observations are incomplete� In the last years several people dealtwith the question of incomplete data and missing values� Indeed� Little andRubin ���� give an extensive description about the theory of missing valuesand how to solve this problem� In practice the statistical calculations are madeby software packages� While examining an incomplete data set it is importantto know how the program treats missing values and what tools are o�ered� Thispaper presents the main results of an experience of several software packagesregarding the missing value problem� The results were obtained by a seminarat the Institute of Statistics at the Ludwig�Maximilians�University Munich insummer ����� In the rst section of this report the examined software packagesare mentioned� The items which are considered are discussed in the secondsection� And the third section presents the result of this investigation� The lastsection contains a summary of the comparison�
� Object of Analysis
In this investigation� the election of the statistical software packages was moreintuitive than calculated� The intention was to take that into the project whichis widespread in use but also more unknown programs as well� All the soft�ware packages are able to work with the operating system MS�Windows� Asmentioned above the title of this paper was theme of a seminar in which eachstudent had to examine one package� Therefore the number of elected software
�
MINITAB Release ���� SPSS Release ���SYSTAT �� for Windows SAS ����STATISTICA�w ���� StatXact Version ���Stata ��� LogXact Version ���S�PLUS ��� JMP Version ����
Table ���� examined statistical software packages
was restricted by ten� The statistical software packages in the study are printedin table ����
� Aspects of the investigation
The aim of this investigation was not only to answer the question of what theprogram does when the data set is incomplete � that means the presentation ofmissing values and o�ered methods for treating them etc� � but also how thesemethods are documented in the online help and in the manuals� In the followingthe central items of interest will be described�
The rst item concerns the missing data code� Each software package thatshall work with missing values needs a code to identify them� For the handlingof incomplete data sets it is necessary for the user to know how missing valuesare coded� Some problems may arise if the code is unknown� Especially if thecode of the program and the code of the imported data set are not the same�Then mistakes may arise while reading in the data�Imagine the input data set uses a point as a symbol for the missing value� butthe program uses a blank� Then the missing value will not be recognized� Asa result� an error will arise if the variable is numeral or the column will be rec�ognized as alphanumeral if there is a missing value in the rst observation� Inevery case� the datasets in the program and the original are di�erent�Another mistake arises if the original dataset uses a number� ��� for example�as a code for a missing value� The mentioned program reads the data withoutproblems� but when calculating some statistics the results will be wrong� be�cause the original missing data code will be recognized as a number and not asmissing value and therefore will be included in the calculation� So the seconditem concerns the existence of a desirable option that enables one to say howmissing values are coded in the original dataset and the program transforms it�
Sometimes there are some reasons for a missing value� This happens whenan individual refuses to answer or it passes some questions because of a certainanswer to a previous question �e�g� some questions are only for woman other areonly for man a�s�o�� Now these di�erent reasons shall be distinguished� Thenthey need di�erent codes but all these codes must be recognized as a missingvalue by the program� The questions are� is it possible to de ne more thanone value as a code for missing values�� or even better� does an option exist tode ne a whole area of values as missing value codes�
The fourth item concerns the representation of missing values in tables and
�

graphics� It is examined whether it is possible to create them when the data isincomplete and how missing values are taken into account� In some cases it canbe choosen whether a new category shall be created� In other cases not eventhe number of ignored observations is shown� Especially in time series severalmethods can be applied�
Several statistical methods for incomplete datasets assume that the valuesare missing completely at random �MCAR� That means the observed valuesare as well as the missing values a random subsample of the sample set� So it isnecessary to test before using the method whether this assumption is ful lled ornot� Therefore the following item deals with the question if the program o�ersa test to assure MCAR�
A further item of the investigation concerns the calculation of descriptivestatistics in presence of missing values� Descriptive statistics means� mode� me�dian� arithmetic mean� variance� standard deviation� skewness� kurtosis� stan�dard error and quartiles� Here� the main interest are not the methods theprogram o�ers because there is only one� It is examined if the program refusesone of these actions because of missing values�
The calculation of covariance and correlation is seperated from the descrip�tive statistics because here is more than one variable involved� There are twopossibilities to handle missing values� The rst ignores all observations havingmissing values in at least one of the variables� This is called complete caseanalysis� The second takes only variables which are involved in the next calcu�lation and ignores the observations with missing values� That is called availablecase analysis� In the last case a problem sometimes arises when calculating acorrelationmatrix� Each element of this matrix represents a correlation of twovariables� If a dataset is incomplete the number of incomplete observations ineach pair of variables may not be the same and a di�erent amount of obser�vations is excluded from the calculation of the matrixelements� As a result�the amount of observations for the calculation of the di�erent correlations maynot be equal� Under this circumstances� sometimes correlations higher thanone or lower than minus one may arise� On the other hand� in some cases notenough observations are left for a calculation by using the complete case anal�ysis� Therefore it is desirable to have the choice between this two alternatives�This question is dealt with by the seventh item�
The next item treats the o�ered options to calculate tests and con denceareas when there are missing values in the data and� of course� if it is allowedto carry out these actions with incomplete data�
The handling of missing values by applying higher statistical methods suchas regression analysis� analysis of variance� cluster analysis� discriminance anal�ysis and time series is also considered in this investigation� The results are putinto the ninth item� It is not the intention to explain here exactly the theoreti�cal background of the used methods� Therefore several statistic literature existslike Little and Rubin ���� �as mentioned above� Rao and Toutenburg ������Toutenburg ������ etc� The used methods are EM�algorithm� interpolation�extrapolation� imputation and some more�
�

Sometimes not all of the possible statistical methods are o�ered in everysoftware package� so it would be a good thing to have a programming languageto create macros for this special use� The next examined question concerns theexistence of a language to program macros�
All the questions above ask for the o�ered possibilities to deal with incom�plete data sets� but it is also important to know how the program works� Theuser should be informed about possibilities and options the program o�ers andabout the assumptions that may be satis ed to use a tool in the right way� Thisinformation should be obtained by reading the manuals and the online help aswell� To judge their quality several items were subject of the investigation� Firstof all it is examined whether and how the algorithms are explained� The seconditem concerns the representation of the theoretical background� The manualsand the online help should reveal the statistical background in a short way andthe user is able to refresh his knowledge about the method� If he wants a de�tailed information there should be given a list of further literatur� This is thethird item� The last item concerns examples which shall help to understand theuse of the o�ered methods and how these can be called� It must be remarkedthat this judgement is not at all representative because each user may haveother expectations to manuals and online help�
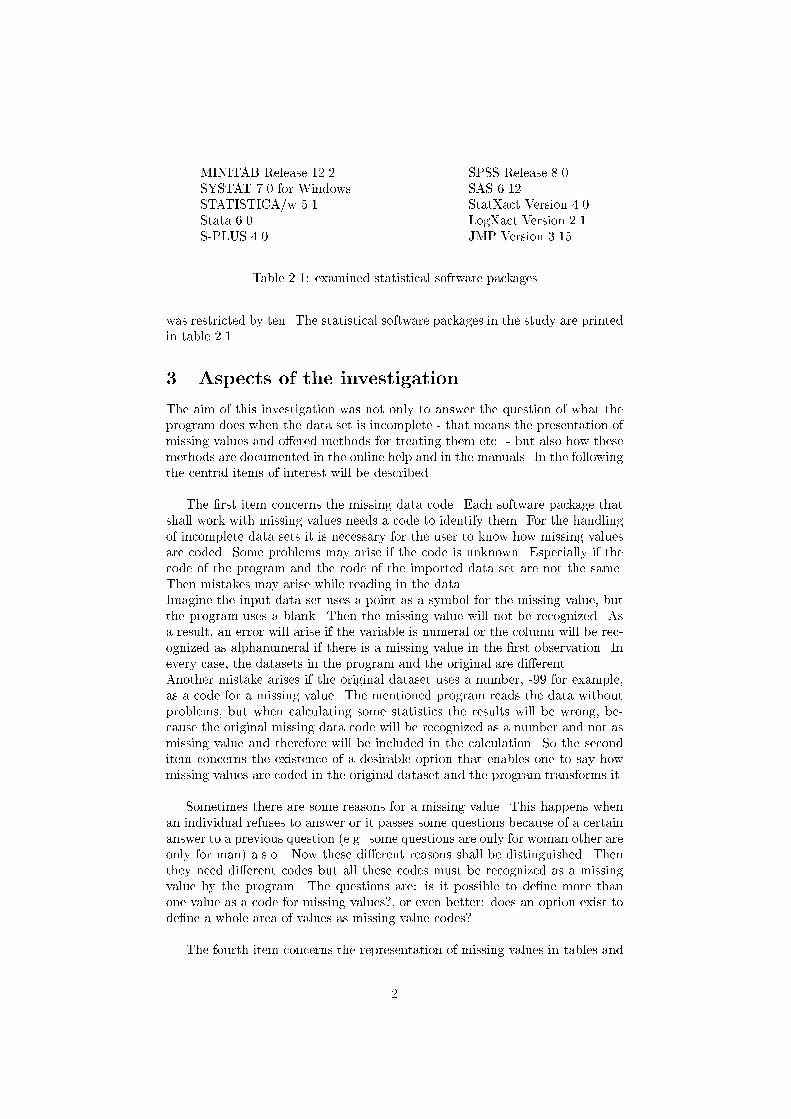
The above mentioned items� which are considered at each statistical softwarepackage in table ���� are listed in table ���� The results of the investigation arerepresented in the following section�
� Results of the Investigation
The rst considered software package is MINITAB Release ����� It is usedin science� industrie and economy in many countries all over the world� Allavailable procedures can be called by mouse click on the pull down menu or bywriting the command in the Session Window�
This program codes missing values in numeral and date�time variables witha star as well� In alphanumeral variables the code is a blank� If a nonde nedvalue arises while calculating a new variable the value is set as missing� too�
MINITAB is able to read datasets from external les which are created inMS�Excel� Quatro Pro� Lotus ����� and dBASE but also text or data les� Thereare no di�culties while reading in data with a di�erent code for missing valuesfrom these les� MINITAB o�ers the option to change the code during or afterthe reading in procedure� A probleme will only arise if a missing value in anumeral variable is coded with a blank in the original data set� In this caseMINITAB is not able to di�er whether it is a missing value or a separator� As aresult MINITAB ignores the missing value and reads the next value� Thereforethe MINITAB data set di�ers from the original because there are no missingvalues and hence less observations� Here it is necessary to change the missingvalue code before reading or use the option Import Special Text� There it ispossible to de ne the format� The alternative for reading in an external le isthis� It is possible to enter the data via the command line editor in the sessionwindow� There a missing value in a numeral variable must be writen with a
�
�� Coding of missing values
�a in numeral variables�
�b in alphanumeral variables�
�c in data�time variables�
�� Existence of an option to change the code while reading an externaldataset�
�� Possibility of changing the code of missing values or de ning several valuesor even an area as missing�
�� Representation of missing values in
�a tables and
�b graphics�
�� Test on MCAR o�ered�
�� Possibility of calculating descriptive statistics in presence of missing val�ues�
� O�ered options at calculating covariances and correlations�
�� O�ered methods by applying tests and con nence intervals�
�� O�ered methods by applying
�a regression analysis
�b analysis of variance�
�c cluster analysis�
�d discriminant analysis�
�e time series�
��� Possibility of programming macros�
��� Quality of manuals and online help�
�a Explanation of algorithm�
�b Presentation of the theoretical background�
�c List of further literature�
�d Quality and presence of examples�
Table ���� list of examined items
�

single quotation mark and a double in an alphanumeral variable� It is evenpossible to edit the data in a worksheet directly� This is the easier way becauseeach cell is set as missing if no entry is made� MINITAB decides the type ofthe variable while reading the rst row� If there is a missing value in a numeralvariable coded with a dot MINITAB puts it as alphanumeral�
An advantage of MINITAB concerns item three in table ���� This programhas an option to de ne several codes as a code for missing values and evenseveral areas� The information about the number of observations and missingvalues can be obtained for each variable in the Info Window�
In frequency tables the number of observations and missing values is pre�sented if this action is called by the tally command with the option count� Oth�erwise it isn�t mentioned� The option Cross Tabulation o�ers to choose whethermissing values shall be included or not or just for speci c variables� If theyare included MINITAB creates an additional category for the missing values foreach variable that has one�In this software package are two kinds of graphs� high�resoluted graphs �coregraphs� �D graphs� speciality graphs and character graphs� The rst o�ersgraphics with high quality and the possibility to make some changes� The sec�ond has the advantage that its graphics can be printed with every printer butby far not as exact as high�resoluted graphs� If a character graph of a variablewith missing values is called� these will be ignored� High�resoluted graphs treatthis problem as follows� If the variable is categorial a new category for missingvalues will be created� If it is a metric variable� points with at least one missingvalue won�t be plotted� In time series plots the point on both sides of a miss�ing value will be connected with a straight line� Therefore the scale remainsthe same� In every case� the number of ignored observations are written in theSession Window�
A test that asures MCAR in the data set is not o�ered� but it is possible toprogram a macro�
The calculation of descriptive statistics �as mentioned above is possible withtwo commands� The rst �describe informs about the number of observationsand missing values� mean� minimum and maximum� median� standard deviationand quartiles� The second ��describe is a macro which gives no informationabout the number of missing values� but it calculates additional variance� skew�ness� kurtosis and con dence intervals a�s�o� and plots some descriptive graphics�Several measurements can be called via the stats command or the menu bar�The treatment of incomplete data is here very easy� All observations with amissing value are excluded from these calculations�
This software package uses the available case analysis or the pairwise deletionto treat missing values while calculating covariances and correlations as well�There is no other possibility o�ered� Therefore it is possible to receive invalidvalues in a correlation matrix as mentioned in the previous section�
For calculating inductive statistics such as tests and con dence intervalsMINITAB uses only complete observations� That is observation with missingvalues are excluded from the calculation� Only the ���test of independencerefuses incomplete variables�
In the regression analysis and the logistic regression incomplete observationswill be excluded from the calculations� In addition the regression analysis o�ersthe option to calculate tted values for the response if the independent variablesof the observation is complete� The output contains the number of excluded ob�
�

servations�The problem of incomplete data in the analysis of variance treats MINITABas follows� Incomplete observations will be excluded from the calculation� Un�fortunately the number of excluded or included observations won�t be put out�Sometimes a balanced design changes to an unbalanced� In this case the two�way�ANOVA produces an error message and no calculations will be made�The cluster analysis in MINITAB o�ers two options� One tries to unite observa�tions the other tries to group variables� In the rst case variables with missingvalues can�t be chosen in the dialog box� In the second case incomplete obser�vations are excluded from the analysis and no information about the number ofincluded or excluded observations will be given�If a discriminant analysis is called to an incomplete data set MINITAB excludesall observations with missing values from the calculation� Here the number ofignored observations is given in the output�MINITAB has several procedures for calculating time series� These are mov�ing average� trend analysis� decomposition and single and double exponentialsmoothing� In each procedure it is possible to receive forecasts� but only the rst three accept variables with missing values� These procedures do not ignoreincomplete observations � because this would cause a change of the time scale �but still don�t plot it� The output of each procedure contains the informationabout the number of incomplete observations�
Of course� there are not all possibilities o�ered to handle incomplete datasetsbut fortunately MINITAB enables the user to program macros� Therefore hecan write programs for his requirements�
To judge the quality of the manuals two books were considered� This isthe MINITAB User�s Guide� which contains a clear overview of the structurand usage of MINITAB� and the MINITAB Reference Manual� which informsabout all the possibilities of statistical calculations o�ered by MINITAB� Othermanuals are available such as MINITAB Quick Reference and MINITAB MiniManual which are only summaries of the two mentioned� The algorithms ofgeneral statistical methods and methods for missing data are explained com�prehensibly� The online help contains the same information� In addition tothat� the online help deals with the problem of reading in incomplete data setsfrom external les� The statistical theory in the manuals is not as spread outas in a school book� but users who have a certain knowledge of the statisticalbackground have a summary and repetition� It is especially explained when theuse of a special method is indicated� The theory of missing values is not givenbut in many sections it is said what MINITAB does if missing values enter aprocedure� At the end of each chapter a list of literature for further informationabout the theory is given� but there is no literature found for incomplete data�For each procedure several clear and well explained examples are given� butnone for missing values�The online help has no list of literature at all except the MINITAB documen�tation� It contains clear examples� but also such which explain how MINITABtreats missing values� Therefore it possible to learn to work with MINITABwithout using the manuals� So the manuals explain MINITAB and its abilitiesin a very clear way� but the information about the missing data problem is verysmall� On the other hand there are only a view possibilities o�erd to treatmissing values� The online help explications of the usage of procedures is moreextensive than that in the manuals but the theory is shorter� The manual has

no section about missing values� Therefore this subject is scattered� but all inall it is a good reference book for the procedures�
The second examined software package is STATISTICA Version � Edition��� This is a version in german� All available procedures can be called by themenu� but also via command lines� The data sheet is always visible� Here thedata can be entered directly� It is possible to write numbers and words into thecells as well� STATISTICA de nes for each word a number starting with ����Date and time values will be recoded in real numbers� So STATISTICA hasonly to treat variables which are numeral� The code for a missing value is ������but can be chosen between ����� and ����� In the data sheet this number willnot be shown� that means the cell is empty� In addition to that� the user is ableto de ne this code for each variable separately�
The data can be read from di�erent external les� These can be les whichare created with MS�Excel� Lotus ������ Symphony� Quattro� dBase� Paradox�SPSS� SAS� Oracle� Sybase or ASCII� les� While reading in the data a modulDatenmanagement recognizes their structure and converts all logical and textvariables and labes and empty cells into the STATISTICA format as well� Addi�tional STATISTICA o�ers an option to change the code of variables or calculatenew variables� It is also possible to enter the data via clip board into the datasheet� but in this case the data sheet must be extended at least to the size ofthe data set which shall be imported� Otherwise only the rst ten observationswill be read in�
This software package has not the ability to de ne more than one value or anarea as missing value� Therefore the user must be aware that in case of readingin a data set with more than one code for missing value will cause a problem�Either all missing codes will be recognized as misssing by STATISTICA � then adistinction of di�erent reasons for no value is impossible � or only one code willbe accepted and the other must be recoded afterwards via the Datamanagement�This modul o�ers an option to replace missing values� There are two possibilitiesfor the replacement� mean imputation and weighted mean imputation where theweights come from another variable� It is also possible to choose the observationswhich shall be used for the calculation�
While creating tables� such as frequency or contingence tables� STATISTICAenables the user to decide whether there should be a category for missing valuesor not� This decision is not o�ered if graphics will be applied� Here the programignores incomplete cases and does not mention this� There is one exception� theoption Missing Data�Ausreisser�Plots produces a graphic where data points formissing values are plotted� In addition to that� thresholds can be set and valuesabove and below them values are considered as outliers�
STATISTICA calculates each descriptive statistic without problems� Thenumber of observations� which are entered for the calculation� is shown� To callfor covariance or correlation matrices there exists the choice between casewiseand pairwise deletion�
If it is asked for tests and con dence areas STATISTICA applies the availablecase analysis�
In the regression calculations the dialogbox allows to choose between a list�wise deletion and a mean imputation� Additional if multiple regression is calleda pairwise deletion can be elected� It is possible to use weigthed mean impu�tation� too� Therefore it is necessary to manipulate the dataset with the data
�

management tool before� For the cluster analysis and discriminance analysis itis the same� Only the analysis of variance o�ers no choice� Here is always thecomplete case analysis used�For the analysis of time series it is necessary to have a complete dataset� If thedata contains missing values at the beginning or at the end of the time seriesSTATISTICA excludes these cases from further calculations� The remainingholes can be lled by mean imputation or by the arithmetic mean of �N neigh�bours where N can be chosen� If N exceed the time serie an error messageappears� Then the user has to elect a smaller N � STATISTICA o�ers the op�tion to ll the missing values with the median of �N neighbours� In additionto that the program enables the user to elect regression imputation and linearinterpolation as method for calculating estimations for the missing values�
This software package has an own programming language at its disposal�With STATISTICA BASIC the user is able to write his own macros�
The only delivered manual is STATISTICA Benutzerhandbuch� It has threeparts� The rst introduces how to use the program� It contains an index whereit is possible to nd a section about missing data� There are the treatmentsof incomplete data listed� but not explained and it is not said which method isused at each procedure� Here it is refered to the online help� The second partgives an overview about the statistical methods� Here it is somewhat di�cultto nd a place where treatments of incomplete data is mentioned� In fact� onlyin the section of correlation matrices the problem of missing values is discussed�The last part contains several example� but examples of dealing with missingvalues are sparse� The manual has no bibliography and some literature is onlygiven at a few places�In comparison with the manual the online help is much more extensive� con�cerning the part one and two� and deals mainly with the use of STATISTICAand the statistical theory� There is much more literature listed where furtherinformation about the theory can be found� In addition internet links can becalled and connect StatSoft� In the home page of Statsoft one can nd addi�tional macros� The algorhythms are given neither in the manuals nor in theonline help�
SYSTAT �� enables the user to start the procedures either via pull downmenu or via icons or via the Command Editor� It distinguishes between twotypes of data� numeral and alphanumeral �strings� SYSTAT marks missingvalues in numeral variables with a dot and in alphanumeral with a blank�This program is able to open data sets from di�erent les� These are SPSS�spreadsheet� database or ASCII les� It is possible to import all rows andcolumns or just a range by entering the number of the rst and the last case orcolumn� In ASCII� les missing numerical data is �agged by a dot and missingcharacter data is marked by a blank which is enclosed within quotation marks�If this is forgotten SYSTAT cannot recognize the missing values and errors willarise� SYSTAT interprets each line as a row� Therefore the next observed valuewill be put at the place of the missing and the case has empty cells at the endof the row� Furthermore� it is not possible to change the coding while readingin the data� The user must change it after or before the import� The last isindicated when missing values are coded with a character� but in general� noproblems appear while importing data from external les� Besides neither it ispossible to de ne several values� an area nor another value as code for a missing
�

value� The code is x�A table can be extended with an additional category for missing values by
using the command �Include missing values�� In graphics incomplete observa�tions will be ignored and no information is given about this action� It is noteven mentioned how many observations are included for the graph� Only if anew category for missing values is de ned� before they will be plotted�
Calculating descriptive statistics for one variable is carried out by ignoringmissing values� To calculate Pearson�s correlation coe�cient� the covarianceor the sum of squares of the cross�products of deviation �SSCP� the user canchoose from one of the following methods� EM�algorithm �for metric variables�listwise or pairwise deletion� When the pairwise deletion is chosen to calculatethe SSCP matrix each result is weighted with the quotient of the number ofrows and the number of observations which enter the calculation for each matrixelement� If the EM�Algorithmn is used the output contains information aboutthe number of iterations and the missing pattern� Furthermore� it is possible tocontrol the number of iterations� the convergence criteria and the in�uence ofoutlier� In addition estimations of mean and correlation matrix is given and atest on MCAR is carried out�
Tests and con dence intervals are calculated by ignoring incomplete obser�vations� There is one exception� The ���test for independence o�ers the optionto include missing values in an additional category�
The regression analysis of SYSTAT treats missing values as follows� Itdoesn�t matter if the missings are in the independent or dependent variableseach incomplete case will be omitted� The output informs the user about theignored cases� In the analysis of variances� the cluster analysis and the dis�criminant analysis� SYSTAT treats this problem treats in the same way� In thecluster analysis the manual recommends to create a new category for missingvalues with a binary coding� Then the option �Join� can be used to clearifywhether there is a missing data system� In time series SYSTAT has two optionsfor treating missing values� Either they will be omitted or they will be estimatedby a distance�weighted least square interpolation �DWLS�interpolation��DWLS interpolates by locally quadratic approximating curves that are weightedby the distance to each nonmissing point in the series� With this algorithm� allnonmissing values in the series contribute to the missing data estimates� andthus complex local features can be modelled by the interpolant��SYSTAT Statis�tics�In each case incomplete observations at the beginning or the end of the seriewill be ignored�The �Delete��option works as follows��Retain only the leading nonmissing valuesfor analysis� In series that begin with one or more missing values� the series isdeleted from the rst missing value following one or more nonmissing values�This option enables you to forecast missing values from nonmissing subsectionof the series��SYSTAT Statistics�These forecasts can be inserted into the series before repeating the procedurelater�
SYSTAT enables to write small programs� but no macros� These programsmust be imported into the command window and submitted�
There are ve books which document the use of SYSTAT� These are Data�Graphics� Statistics� New Statistics and Command Reference� Data containsintroductory information about SYSTAT� All books except the Command Ref�
��

erence have in each chapter an introduction and a table of contents� At the end�an extensive list of literatur is given� The manuals are clear� Key words areplaced on the margin and di�erent fonts are used� The theory is only explainedin a short way� It is assumed that the user already has the knowledge of theprocedures which must be recalled� Clear examples support the explanationof the procedures� Methods for missing data especially the EM�Algorithm isexplained extensively and problems are mentioned� On the other hand� not allof the procedure descriptions mention the treatment of missing values� Theonline help is clear� because of the di�erent fonts� but is not as extensive as themanual� A list of further literatur is not given� The topic �missing values� isonly mentioned in time series and correlation calculation�
Stata ��� is one of the less known software packages in Germany� but in eng�lish speaking countries its use is more spread out� According to the statementson the homepage of Stata� the advantages of this program are high speed cal�culation and easy handling even for statistic beginners� This release is designedas a window program but its graphical surface is heavy reduced� There areno dialog boxes� icons or pull down menus to call a statistical function� Everycommand must be entered into the Stata�Command�Window� Several otherwindows exist� the Data�Result�Window containing the output� the Variables�Window containing a list of all variables� the Review�Window containing theexecuted commands� the Data�Window for showing the data set� the Stata�Editor for editing the data set� the Do�File�Editor for programming proceduresand the Graph�Window� which contains the graphical output� but only show�ing one graphic� A new graphic deletes the old one� Some graphics having anASCII format are less exact �e�g the histogram� Stata o�ers a wide range oftests and estimation methods with several options but therefore the commandsare sometimes pretty long�
Stata marks missing values in the data sheet with a dot in numeral and ablank in alphanumeral variables� If the data will be entered directly into thedata sheet the cell which is not edited in a variable is set as missing� If an ASCII le is read in a missing value in a numeral variable must be marked with a dotand in alphanumeral variables with two quotation marks� In addition to that� all�things that are not understood ��� are mentioned and stored as missing values��Getting started with Stata for windows ������ Missing values are coded withthe highest number� As a result� if the number of individuals with an incomeof more than ����� is called� observations without entry in the correspondingvariable will be counted� too� This is important if categories will be created� Ifone knows this it is possible to exclude missing values from creating categories�Not de ned calculations and calculations with missing values lead to a missingvalue� In this case Stata gives a message that missing values are generated� Itis not possible to de ne individual areas or several values as code for missingvalues� There are only a few types of variables available with a speci c amountof numbers �e�g� byte� int� long� �oat� double� Each value beneath the chosenamount will be recognized as a missing value�
In tables the number of missing values is not shown except if using thecommand inspect which enables the user to see the number of missing values�Furthermore� the use of the inspect�command results in a mini histogramm inthe text mode in which it is possible to see a rough guess of the amount ofthe missing values� Even the number of observed values is only sometimes
��

mentioned� Graphs ignore missing values� The only way to make these visibleis to de ne a new category� In time series it is necessary to estimate the missingvalues to avoid holes in the graph�
Stata o�ers no test on MCAR� but it has an option to check the data setfor two kinds of dependences� Firstly� if there is a missing value in variable a
then there is a missing value in variable b� too� and vice versa� Secondly� if a ismissing then variable c has a missing� but not vice versa�
Descriptive statistics will be calculated by omitting missing values� Only thecorrelation can be calculated by a complete case or an available case analysis�
Stata o�ers three methods to ll up an incomplete dataset� Firstly� it ispossible to use the regression imputation� Here are at least �� complete obser�vations necessary� In addition to that� the variance of the estimation will becalculated� Compared to STATISTICA the completed variable is stored in anew variable� therefore the old variable is still visible� Secondly� it is possibleto ll up a missing value by linear interpolation and third by linear inter� andextrapolation� In tests� regression analysis� analysis of variance� cluster anal�ysis� time series and others� there are these three methods in addition to thecomplete case analysis possible� A discriminant analysis is not available� It ispossible that in time series the moving average leads to missing values causedby incomplete data� This can be supressed by the nonmiss�command but it isnot explained how it works�
This software package has a language to program macros and procedureswhich can be stored as Ado�Files� The explanations in the manuals are oftennot enough for understanding� Furthermore� it is possible to put them into thehomepage of stata and to get some out of it�
For this examination there are seven manuals considered� These are Get�ting started with Stata� the Stata Graphics Manual� the Stata User�S Guide andfour Stata Reference Manuals� The algorithms are explained in most cases andimportant formulas for tests are given� The statistical theory is given for im�portant functions at least� Each chapter has a list of further literatur wherethe user can nd the statistical background which is left out in the manuals�Examples are given to all procedures� but it is very often assumed that the dataset is complete� Therefore there are only a few examples for the treatment ofmissing values� Stata o�ers two possibilities to receive help� Firstly� after enter�ing a command and calling the help an extensive explanation of this commandis given� Secondly� if the online help is called a word can be searched� but theresult is only a list of chapters in the manuals� In addition the user can getfurther information via internet� Either he calls the homepage of Stata or hemails his problem� The homepage o�ers many les for downloading and manytexts about Stata�
The software package S�PLUS is based on the S�Language which has someelements of C�C�� and even of other programming languages� It is possibleto modify existing procedures� Furthermore� a menu bar is given with whichactions can be started via dialogboxes� In S�PLUS� several windows exist� Thereis an Object Browser which contains all objects of the current working directory�Here the objects can be edited� The functions and commands will be enteredinto the Command Window which containing the text output� too� Graphsappear in seperat or in the same Graphsheet� which is optional� All submittedcommands are shown in the History Window� so they can be repeated� A Report
��
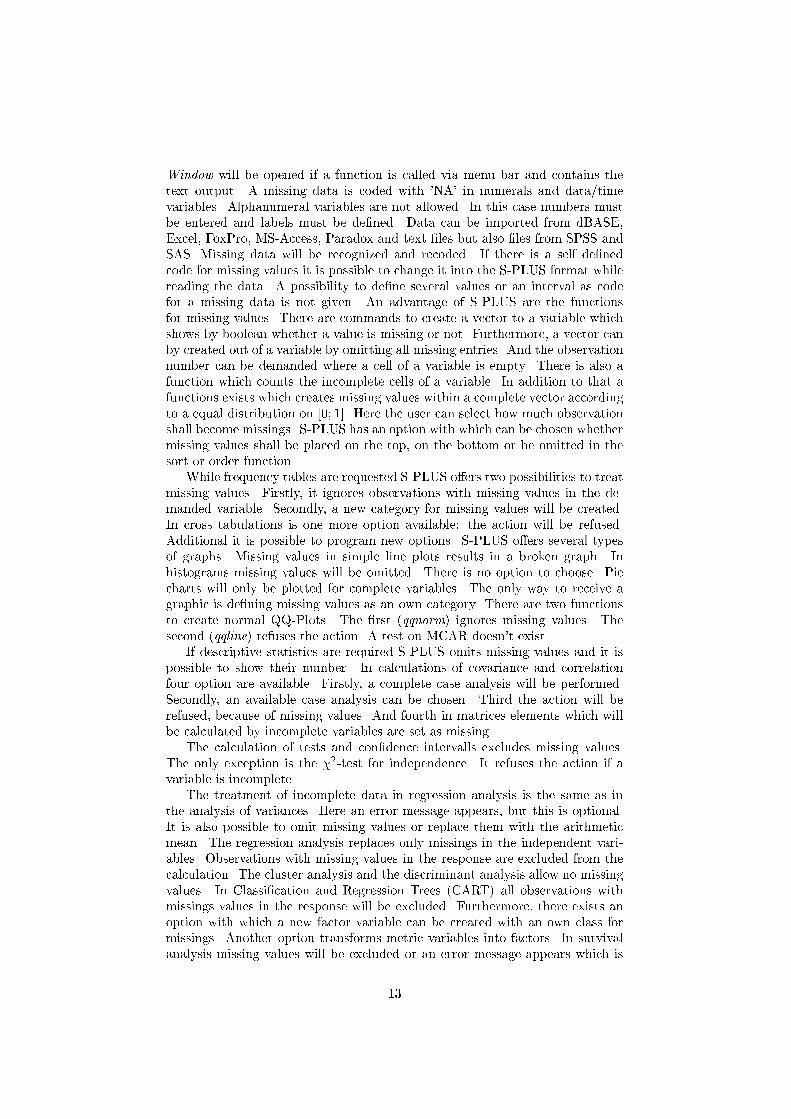
Window will be opened if a function is called via menu bar and contains thetext output� A missing data is coded with �NA� in numerals and data�timevariables� Alphanumeral variables are not allowed� In this case numbers mustbe entered and labels must be de ned� Data can be imported from dBASE�Excel� FoxPro� MS�Access� Paradox and text les but also les from SPSS andSAS� Missing data will be recognized and recoded� If there is a self de nedcode for missing values it is possible to change it into the S�PLUS format whilereading the data� A possibility to de ne several values or an interval as codefor a missing data is not given� An advantage of S�PLUS are the functionsfor missing values� There are commands to create a vector to a variable whichshows by boolean whether a value is missing or not� Furthermore� a vector canby created out of a variable by omitting all missing entries� And the observationnumber can be demanded where a cell of a variable is empty� There is also afunction which counts the incomplete cells of a variable� In addition to that afunctions exists which creates missing values within a complete vector accordingto a equal distribution on ��� ��� Here the user can select how much observationshall become missings� S�PLUS has an option with which can be chosen whethermissing values shall be placed on the top� on the bottom or be omitted in thesort or order function�
While frequency tables are requested S�PLUS o�ers two possibilities to treatmissing values� Firstly� it ignores observations with missing values in the de�manded variable� Secondly� a new category for missing values will be created�In cross tabulations is one more option available� the action will be refused�Additional it is possible to program new options� S�PLUS o�ers several typesof graphs� Missing values in simple line plots results in a broken graph� Inhistograms missing values will be omitted� There is no option to choose� Piecharts will only be plotted for complete variables� The only way to receive agraphic is de ning missing values as an own category� There are two functionsto create normal QQ�Plots� The rst �qqnorm ignores missing values� Thesecond �qqline refuses the action� A test on MCAR doesn�t exist�
If descriptive statistics are required S�PLUS omits missing values and it ispossible to show their number� In calculations of covariance and correlationfour option are available� Firstly� a complete case analysis will be performed�Secondly� an available case analysis can be chosen� Third the action will berefused� because of missing values� And fourth in matrices elements which willbe calculated by incomplete variables are set as missing�
The calculation of tests and con dence intervalls excludes missing values�The only exception is the ���test for independence� It refuses the action if avariable is incomplete�
The treatment of incomplete data in regression analysis is the same as inthe analysis of variances� Here an error message appears� but this is optional�It is also possible to omit missing values or replace them with the arithmeticmean� The regression analysis replaces only missings in the independent vari�ables� Observations with missing values in the response are excluded from thecalculation� The cluster analysis and the discriminant analysis allow no missingvalues� In Classi cation and Regression Trees �CART all observations withmissings values in the response will be excluded� Furthermore� there exists anoption with which a new factor variable can be created with an own class formissings� Another option transforms metric variables into factors� In survivalanalysis missing values will be excluded or an error message appears which is
��
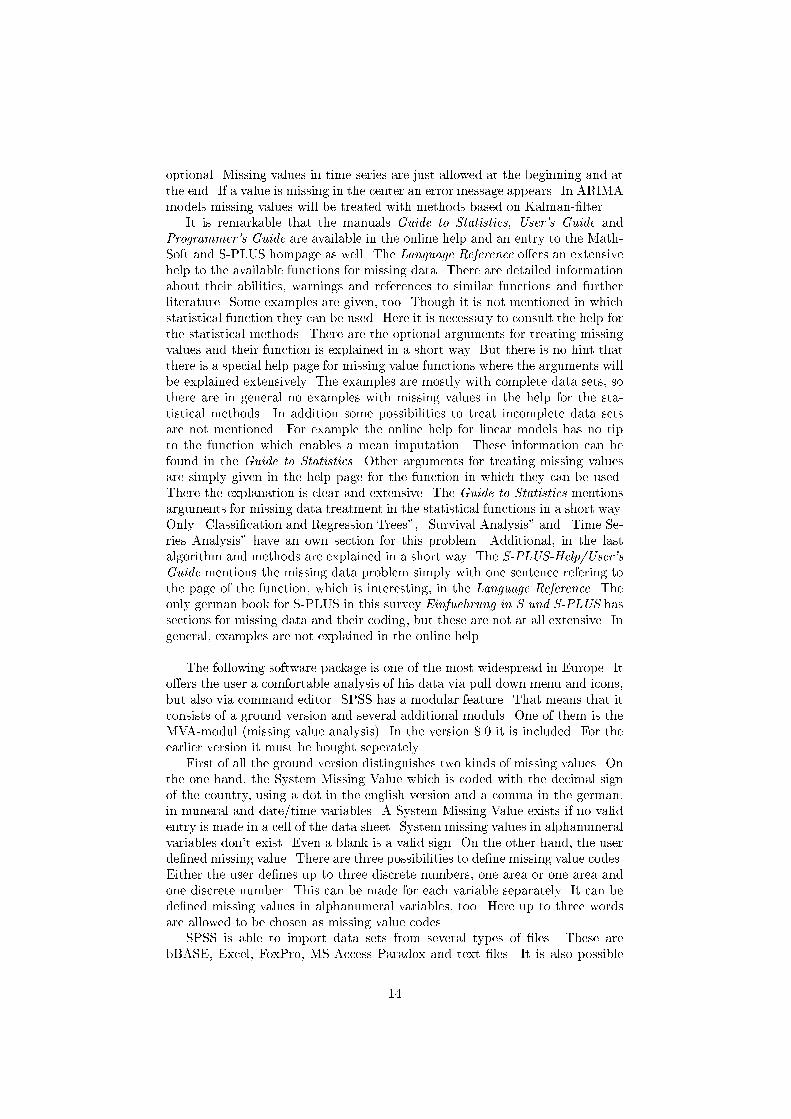
optional� Missing values in time series are just allowed at the beginning and atthe end� If a value is missing in the center an error message appears� In ARIMAmodels missing values will be treated with methods based on Kalman� lter�
It is remarkable that the manuals Guide to Statistics� User�s Guide andProgrammer�s Guide are available in the online help and an entry to the Math�Soft and S�PLUS hompage as well� The Language Reference o�ers an extensivehelp to the available functions for missing data� There are detailed informationabout their abilities� warnings and references to similar functions and furtherliterature� Some examples are given� too� Though it is not mentioned in whichstatistical function they can be used� Here it is necessary to consult the help forthe statistical methods� There are the optional arguments for treating missingvalues and their function is explained in a short way� But there is no hint thatthere is a special help page for missing value functions where the arguments willbe explained extensively� The examples are mostly with complete data sets� sothere are in general no examples with missing values in the help for the sta�tistical methods� In addition some possibilities to treat incomplete data setsare not mentioned� For example the online help for linear models has no tipto the function which enables a mean imputation� These information can befound in the Guide to Statistics� Other arguments for treating missing valuesare simply given in the help page for the function in which they can be used�There the explanation is clear and extensive� The Guide to Statistics mentionsarguments for missing data treatment in the statistical functions in a short way�Only �Classi cation and Regression Trees�� �Survival Analysis� and �Time Se�ries Analysis� have an own section for this problem� Additional� in the lastalgorithm and methods are explained in a short way� The S�PLUS�Help�User�sGuide mentions the missing data problem simply with one sentence refering tothe page of the function� which is interesting� in the Language Reference� Theonly german book for S�PLUS in this survey Einfuehrung in S und S�PLUS hassections for missing data and their coding� but these are not at all extensive� Ingeneral� examples are not explained in the online help�
The following software package is one of the most widespread in Europe� Ito�ers the user a comfortable analysis of his data via pull down menu and icons�but also via command editor� SPSS has a modular feature� That means that itconsists of a ground version and several additional moduls� One of them is theMVA�modul �missing value analysis� In the version ��� it is included� For theearlier version it must be bought seperately�
First of all the ground version distinguishes two kinds of missing values� Onthe one hand� the System Missing Value which is coded with the decimal signof the country� using a dot in the english version and a comma in the german�in numeral and date�time variables� A System Missing Value exists if no validentry is made in a cell of the data sheet� System missing values in alphanumeralvariables don�t exist� Even a blank is a valid sign� On the other hand� the userde ned missing value� There are three possibilities to de ne missing value codes�Either the user de nes up to three discrete numbers� one area or one area andone discrete number� This can be made for each variable separately� It can bede ned missing values in alphanumeral variables� too� Here up to three wordsare allowed to be chosen as missing value codes�
SPSS is able to import data sets from several types of les� These arebBASE� Excel� FoxPro� MS�Access Paradox and text les� It is also possible
��

to read in ASCII les� Here can be chosen between the options �Free eld� and�Fixed Columns�� In both cases no missing value can be recoded� That meansthe user can say what type of variable there is in the data set and what thename of the variable is� but all values which do not match with the type ofvariable will be set as System Missing Value and the user receives a message�Recoding values in a variable is possible when the data set is read in� There theuser can choose if the result shall be written in a new variable or overwrite theold�
The ground version of SPSS distinguishes two kinds of missing data treat�ments� The treatment before and while calling a speci c procedure� Treatmentsbefore the analysis means either to delete a variable if it is not in the main in�terest of the study and it contains many missings� or the other method� whichis also mentioned in the manuals� is to impute guessed values� The user candecide between ve options� Firstly� there is the mean imputation� Secondly�the imputated value can be calculated from the mean or thirdly the medianof the next �n observed values where n can be speci ed� It must be remarkedthat a system missing value is set if not enough neighbours exist� Fourthly�the guessed value is received from linear interpolation or fthly from the lineartrend� The last works as follows� For all observed values a linear trend line willbe calculated� The missing value will be replaced by the value of this trend lineat its place� Of course� for the last four methods the data set must be put inan order� It can be decided if the lled variable shall replace the old or form anew one� In the rst case the original variable is lost in the temporary data setand the danger of deleting this while saving it� exists� It should be mentionedthat the system missings and the user de ned missing values will be replacedas well�
Frequency tables show the frequency of all values that means all values inclu�sive the user de ned missing values and the system missing values� Additionalthe percentage is given for all values und for the valid values� too� The cum�mulative percentage is only given for the valid cases� In crosstabulation thelistwise deletion is used� In all kinds of graphs there are the options to selectlistwise or pairwise deletion� Furthermore� the user can decide whether missingvalues shall appear in an extra category or not� Line plots o�er also an optionto interpolate missing values and therefore repair the line� If a frequency statis�tic is called it is possible to view a graph� Three types are available� The barchart and the histogram omits missing values� The latter is only for numericvariables� The pie chart counts user de ned values twice� On the rst place it isunited in missing values and on the second a piece for each value is plotted� Itmust be remarked that user de ned intervals for missing values are not countedtwice�
SPSS has no problem to calculate descriptive statistics of variables withmissing values� The output contains allways the information about the numberof excluded observations� This software package o�ers three kinds of correlationthe bivariate� the partial and the distances correlation� In all it is possible todelete listwise deletion and in the two rst mentioned the user can select thepairwise deletion� too� The MVA�modul calculates the number of missing andnonmissing values� mean� standard deviation and extreme values� Means� co�varince matrix and correlation matrixwill be estimatied using listwise� pairwise�EM or regression methods�
In all kinds of tests it can be chosen between listwise and pairwise dele�
��

tion� The regression analysis enables the user to elect either listwise or pairwisedeletion or mean imputation to deal with incomplete data� The used methodis mentioned in the output� The analysis of variance allows listwise and pair�wise deletion and so it is in cluster analysis� The numbering of cases in thecluster analysis is somehow confusing� because it is not identical to that of thedatasheet� The reason is� incomplete observations will be omitted and the com�plete cases get new serial numbers� The discriminat analysis allows only listwisedeletion or mean imptutation� Missing values at the beginning or the end oftime series are allowed and deleted from the analysis� If a empty cell exists inthe center of it the calculation stops at this point and the time serie is onlyplotted till there�
As mentioned above SPSS has a modul to analyse missing values� TheMissing Value procedure performs three primary functions� Firstly� to describepatterns of missing data� This includes the answers to the following questions�Where are the missing values located� How extensive are they� Tend pairs ofvariables to have values missing in di�erent cases� Are data values extreme�And are values missing randomly� Secondly� to estimate means� standard de�viations� covariances and correlations using a listwise� pairwise� regression orexpectation�maximization method �EM method� The pairwise method alsodisplays counts of pairwise complete cases� Thirdly� to ll in missing valueswith estimated values� which will be obtained by using regression or EM meth�ods �SPSS Missing Value Analysis ���For examining the missing data pattern of a data set the modul o�ers three typesof pattern tables� The �Tabulated cases� shows the frequency of each missingvalue pattern� Counts and variables are both sorted by similarity of patterns�In addition to that� an option is given to eliminate patterns that occur in lessthan a chosen percentage of cases� The output table contains an additional col�umn in which the user can see how the number of complete observations wouldincrease if a speci c variable is deleted� The option �Cases with missing values�show case�by�variable patterns of missing and extreme values for cases that havemissing values� Cases and variables are both sorted by similarity of patterns�The �All cases� option displays for each case the pattern of missing and extremevalues� Here the missing values are distinguished in system missings and thedi�erent user de ned missing values� It is possible to sort them according to aspeci ed variable� The criteria for an extreme value is the same as for boxplots�Univariate statistics can be calculated� That means for each variable the num�ber of nonmissing values� the number and percentage of missing values� andthe count and percentage of missing values are displayed� Additional� for met�ric variables the mean� the standard deviation and the counts of extreme highand low values are shown� Three options are o�ered to examine possible miss�ing data pattern� Therefore SPSS creates internal for each variable a missingindicator variable that indicates whether the value of a variable is present ornot� The �Percent mismatch� option creates a table in which for each pair ofvariables the percentage of cases with one variable having and the other havingnot a missing value� Each diagonal element contains the percentage of missingvalues for a single variable� The second option compares for each quantitativevariable the means of two groups using Student�s t statistic� The t statistic� de�grees of freedom� counts of missing and nonmissing values and means of the twogroups are displayed� It is also possible to �display any two�tailed probabilitiesassociated with the t statistics� although interpretation of these probabilities
��
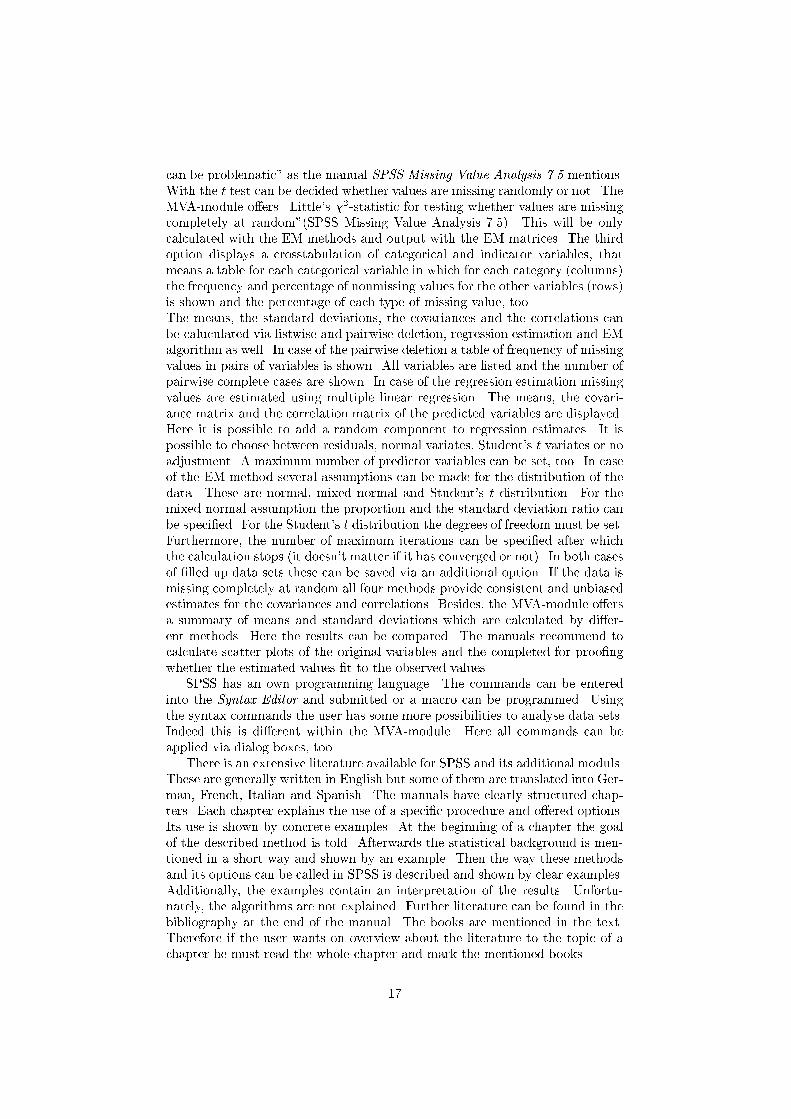
can be problematic� as the manual SPSS Missing Value Analysis �� mentions�With the t test can be decided whether values are missing randomly or not� TheMVA�module o�ers �Little�s ���statistic for testing whether values are missingcompletely at random��SPSS Missing Value Analysis ��� This will be onlycalculated with the EM methods and output with the EM matrices� The thirdoption displays a crosstabulation of categorical and indicator variables� thatmeans a table for each categorical variable in which for each category �columnsthe frequency and percentage of nonmissing values for the other variables �rowsis shown and the percentage of each type of missing value� too�The means� the standard deviations� the covariances and the correlations canbe caluculated via listwise and pairwise deletion� regression estimation and EMalgorithm as well� In case of the pairwise deletion a table of frequency of missingvalues in pairs of variables is shown� All variables are listed and the number ofpairwise complete cases are shown� In case of the regression estimation missingvalues are estimated using multiple linear regression� The means� the covari�ance matrix and the correlation matrix of the predicted variables are displayed�Here it is possible to add a random component to regression estimates� It ispossible to choose between residuals� normal variates� Student�s t variates or noadjustment� A maximum number of predictor variables can be set� too� In caseof the EM method several assumptions can be made for the distribution of thedata� These are normal� mixed normal and Student�s t distribution� For themixed normal assumption the proportion and the standard deviation ratio canbe speci ed� For the Student�s t distribution the degrees of freedom must be set�Furthermore� the number of maximum iterations can be speci ed after whichthe calculation stops �it doesn�t matter if it has converged or not� In both casesof lled up data sets these can be saved via an additional option� If the data ismissing completely at random all four methods provide consistent and unbiasedestimates for the covariances and correlations� Besides� the MVA�module o�ersa summary of means and standard deviations which are calculated by di�er�ent methods� Here the results can be compared� The manuals recommend tocalculate scatter plots of the original variables and the completed for proo ngwhether the estimated values t to the observed values�
SPSS has an own programming language� The commands can be enteredinto the Syntax Editor and submitted or a macro can be programmed� Usingthe syntax commands the user has some more possibilities to analyse data sets�Indeed this is di�erent within the MVA�module� Here all commands can beapplied via dialog boxes� too�
There is an extensive literature available for SPSS and its additional moduls�These are generally written in English but some of them are translated into Ger�man� French� Italian and Spanish� The manuals have clearly structured chap�ters� Each chapter explains the use of a speci c procedure and o�ered options�Its use is shown by concrete examples� At the beginning of a chapter the goalof the described method is told� Afterwards the statistical background is men�tioned in a short way and shown by an example� Then the way these methodsand its options can be called in SPSS is described and shown by clear examples�Additionally� the examples contain an interpretation of the results� Unfortu�nately� the algorithms are not explained� Further literature can be found in thebibliography at the end of the manual� The books are mentioned in the text�Therefore if the user wants on overview about the literature to the topic of achapter he must read the whole chapter and mark the mentioned books�
�

The online help o�ers the user only some short informations about the goal of aspeci c procedure� but there are no information about algorithm and statisticalbackground� On the other hand it is very clearly explained how the procedurecan be called� The syntax of the commands are given but unfortunately theoptions are not explained� An additional item in the online help leads the userto the web page of SPSS where informations can be read or questions can beposed� There are also web pages in di�erent languages� but these contain onlyshort information and refer to the american page�
The next considered software package is SAS in its release ���� � SAS is alsoa rather popular program especially in medical researches� If a new medicine isdeveloped its e�ect must be proofed and whether there are any undesired sidee�ects� Finally� the study results are sent to an institution which decides if amedicine may be sold� A leading institution is the american Food and DrugAdministration� This wants the data in an SAS format� Therefore the use ofSAS is assured�
SAS is a program whose user surface is not as comfortable as that of SPSSfor example� Besides� it o�ers a wide range of methods to analyse data setsand create reports� If SAS is called three windows will be opened� The Log� Window� the Output � Window and the Program Editor� Procedures can becarried out by tipping the commands into the Program Editor and to submitthem� The icons in the SAS window enable neither a statistical analysis nor thecreating of graphs� One icon activates the SAS�Assist� It is a less comfortabletool to carry out actions via dialog boxes as the surface of SPSS� The user hasto spend some time to nd out how he can run the chosen procedures which is adisadvantage� Finally the program should be as simple in use as possible� Theuser might work with it without consulting manuals�
SAS distinguishes two kinds of variable types� character and numeric� Thenumeric type contains also date��time� and some more formats� Several formatsare united to the character type� too� A missing value in a charachter variableis coded with a blank� The code in numeric variables is a dot� Nonnumericalcell entries in a numeric variable will be set as missing� Results of calculationswhich are not de ned are set as missing� too� The code is x and cannot bechanged� SAS allows neither the de nition of more than one value nor of anarea of values as missing values�
SAS can import data from text les� Here it is possible to choose a given le format� that means data les in which values are separated by commas orby tab deliminater� or a user de ned le format� Equal which format is electedit is not possible to change the code of a value while reading in the data if theaction is called by dialog boxes� Therefore missing values have to be recodedbefore or after reading the data� If the data is read in by syntax commandsthe user has more options� Usually the variables are of a special type� If thisis de ned no other type can be entered into the cells of the variable� Thatmeans a numeric variable allows no characters� SAS o�ers an option with whichcharacters are allowed in numeric variables� But in calculations these characterswill be regarded as missing values� This can be used to distinguish severalreasons for nonresponding� SAS is also able to read data sets from MS Exceland BMDP les�
Frequency tables and crosstabulations can be called by the PROC FREQprocedure� The default adjustment ignores missing values� but writes the num�
��

ber of excluded observations in the output� Two alternatives are o�ered� Firstly�a new category for missing values will be created for each variable with missingvalues� but only their number is printed in the table� Missing values are not in�cluded in culculations of statistics� The second alternative includes additionallythe missing values in statistical calculations�This software packages supports di�erent kinds of graphics which will be calcu�lated by several procedures� Graphs for categorical values� these are pie charts�block charts� bar charts� etc�� enables to create an additional category for miss�ing values which is plotted in the graph� Other procedures omit incompleteobservations� In time series two possibilities are given� Either the plot stops atthe rst missing value after an observed or missing values will be interpolatedby four methods� The cubic spline ts the data inside the rst and the lastobserved values� Additionally� the spline is extended by adding linear segmentsat the beginning and the end� The linear interpolation connects the observedvalue before and after the missing value� �The STEP method ts a discon�tinuous piecewise�constant curve� For point�in�time input data� the resultingstep function is equal to the most recent input value� For interval total or aver�age data� the step function is equal to the average value for the interval�� �Theaggregate method performs simple aggregation of time series without interpo�lation of missing values� If the input data are totals or averages� the results arethe sums or averages� respectively� of the input values for observations corre�sponding to the output observations� If the input data are point�in�time values�the result value of each output observation equals the input value for a selectedinput observation���SAS online help�
For calculating tests or con dence intervals SAS ignores incomplete cases�The regression analysis in SAS omits all incomplete observations� In generallinear models that can be calculated by the PROC GLM�procedure the treat�ment of missing values depends on the type of analysis� If an univariate model iselected observations with missing values are omitted equal the value is missingin the response or in the independent variables� In case of multivariat modelstwo possibilities are availabe� Either an observation will be excluded of thewhole calculation if a value is missing in at least one of the response variablesor it is excluded from the calculation of the considered variable if it has no validvalue in this variable� The number of used or excluded observations will not begiven in the output� If a probit model is calculated by the PROC PROBIT�procedure missing values in the response are treated as zero� The observationwill be excluded if the independent variables have at least one value missing�The analysis of variances ignores any observation with missing values�SAS distinguishes two cases in cluster analysis��If the data are coordinates� ob�servations with missing values are excluded from the analysis� If the data aredistances� missing values are not allowed in the lower triangle of the distancematrix� The uppertriangle is ignored���SAS�STAT User�s Guide�Missing values in discriminant analysis are treaten as follows��Observations withmissing values for variables in the analysis are excluded from the developmentof the classi cation criterion� When the values of the classi cation variableare missing� the observation is excluded from the classi cation criterion� but ifno other variables in the analysis have missing values for that observation� theobservation is classi ed and printed with the classi cation result���SAS�STATUser�s Guide�In time series any missing value at the beginning of the data set will be skipped�
��

An option can be speci ed� then �the rst continuous set of data with no missingvalues is used� otherwise� all data with nonmissing values for the independentand dependent variables are used� Note� however� that the observations contain�ing missing values are still needed to maintain the correct spacing in the timeseries� For output data sets� PROC AUTOREG can generate predicted valueswhen the dependent variable is missing���SAS online help� Another procedureis available to t �cubic spline curves to the nonmissing values of variables toform continuous�time approximations of the input series� The procedure canalso estimate rst derivatives of time series with respect to time� computed bydi�erentiating the interpolated spline curve���SAS online help�
The concept of this program bases on syntax commands as entirely men�tioned� Therefore it should be easy for an experienced SAS user to program hisown procedures or macros�
The quality of manuals is considered by the SAS�STAT User� Guide and theSAS�GRAPH Software� The rst chapter of the User�s Guide describes the ideaand the theory of statistical methods in a short way� Sometimes an example isgiven to make the things clearer� In these chapters the user can nd all availableprocedures of this context with a short describtion of its work� Additionally� thechapter in which the procedures are explained is named� In addition to that�a list of further literature is given� The following chapters describe the proce�dures extensively� The abilities of the procedures are mentioned� The syntaxand the options are explained clearly� Several examples are given with a shortexplanation of the output� In addition to that� each of these chapters name thetreatments of missing values in the procedures� Algorithms are not explicitelymentioned� The user can only guess it by reading the theory�The online help is not as extensive as the manuals� Here neither the theoreticalbackground nor the algoritms are mentioned� Only the idea and the syntax ofthe commands and its use is described� Sometimes an example is given whichare not as clear as those in the manuals� Furthermore� it is not easy to ndsomething speci c� because there are several references to one item and eachof the new opened pages contains another information� Sometimes it would beeasier for the user if all information of one item is united in one page�
The next software package is made for exact nonparametric inference� �Thegoal of StatXact is to enable statisticans and data analysts to make reliable in�ferences by exact and Monte Carlo methods when their data are sparce� heaviliytied� or skewed� and the accuracy of the corresponding large sample theory is indoubt� � � � If a data set is too large for the exact alhorithms� StatXact computesMonte Carlo estimates of the exact p�values to any desired accuracy� If the dataset is too large for both � � � � it is almost certainly large enough for asymptotictheory to work accurately���StatXact User Manual� In general this programdoesn�t expect missing values� There is only one command which assigns to anobservation of a variable the number one� if this observation is missing and zerootherwise� It is always expecting complete data sets� Indeed the data can beincomplete� Missing values will be coded with a dot in numeral and alphanu�meral variables as well� But incomplete observations will be excluded from allcalculations�
StatXact allows to import data les created by other software programs� Itcan read in data that are in ASCII Data� BMDP Data� BMDP New system�EGRET Data� EXCEL Data� dBASE Data� LOTUS ����� Data� SAS Transport
��

Data� SPSS Data� STATISTICA Data or SYSTAT Data format� Missing valueswill be recognized and recoded into the StatXact code� It is not planed to changeany variable while reading in the data� Of course� it is possible to transformvariables afterwards� Furthermore� the user cannot de ne missing values neitherone or more values nor a whole area of values� As mentioned above� StatXactis a program for inferences� Therefore graphics cannot be made� but the resultscan be stored in a le in a format that other programs can create a graph outof it� In tables the number of excluded observations is never mentioned� Onlythe number of used observations is mostly said in the output� The calculationof descriptive statistics for incomplete data sets is no problem for StatXact�missing values will be omitted� If descriptive statistics will be calculated theoption �count� carries out the number of included cases� This program o�ersno test on MCAR� but many other in which the available case analysis is used�Other statistics like regression analysis� cluster analysis a�s�o� are not o�ered�This software package has own commands to read in data� to store results orto transform variables� but it is not possible to write procedures� The syntax iseasy to learn by the manuals�
The manual StatXact For Windows User Manual is additionally stored ina le� If the user uses the index to nd something about missing values he willbe refered to one place in which only the treatment in the data editor is de�scribed� Besides� while reading the book one may nd some explications abouthow StatXact deals with missing values in descriptive statistics and variabletransformations� The manual discusses the theory extensively sometimes morethan statistical literature� Examples are given to make it clearer� Referencesare given but only at the end of the book and none at the end of each chapter�Caused by the sparce abilities to deal with missing values this problem is hardlymentioned� The online help is actually no help concerning missing values� be�cause the search for these words leads to no result� In general the online helpexplains the use of the dialog boxes and the o�ered options� The search foralgorithms� statistical theory or even literature fails� Furthermore� examples tothe commands are not to nd� All in all it is easy to navigate�
The following software package o�ers only exact methods for binary logisticregression analysis� LogXact is made from the same corporation which pro�grammed StatXact� It �performs unconditional maximum likelihood inference�conditional maximum likelihood inference� and conditional exact on the param�eters of the logistic regression model���LogXact User Manual� In case of largerdata sets asymptotical methods can be elected� Usually missing values are codedwith a dot equal if it is within a numeral or alphanumeral variable� It is inter�esting that this program in compare with StatXact is not able to read charactervariables from text les� It is also impossible to change the code while readingin the data� These must be done before or after importing� Each character innumeral variable is set as missing value� In addition to that� missing valuesin SYSTAT data les will not be recognized or recoded to the system missingvalue code of LogXact� This program provides to import data set from ASCIIData� BMDP Portable Data� BMDP New System Data� EGRET Data� SASTransport Data� SPSS PC� Data and SYSTAT Data les�
In the global options dialog box the user can de ne a number within theinterval ��� � ����� � � ����� as missing value code� This de nition is valid inthe whole data set� It is not allowed to de ne more than one value or even an
��
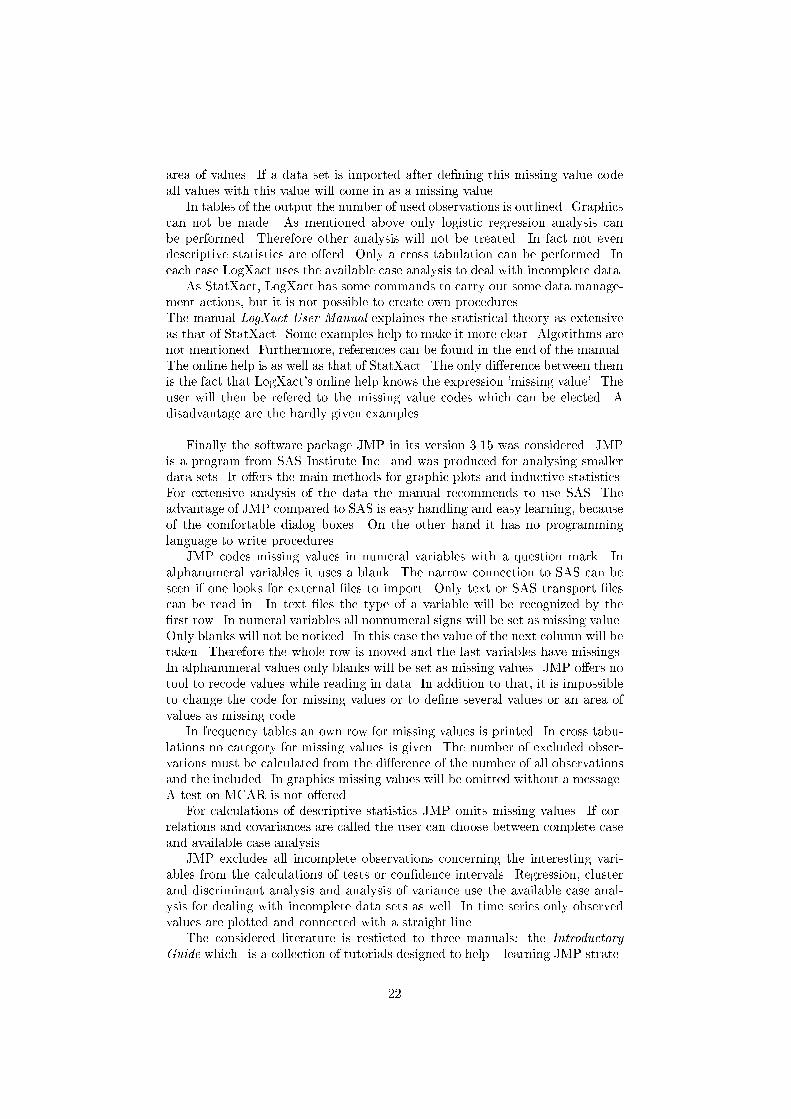
area of values� If a data set is imported after de ning this missing value codeall values with this value will come in as a missing value�
In tables of the output the number of used observations is outlined� Graphicscan not be made� As mentioned above only logistic regression analysis canbe performed� Therefore other analysis will not be treated� In fact not evendescriptive statistics are o�erd� Only a cross tabulation can be performed� Ineach case LogXact uses the available case analysis to deal with incomplete data�
As StatXact� LogXact has some commands to carry out some data manage�ment actions� but it is not possible to create own procedures�The manual LogXact User Manual explaines the statistical theory as extensiveas that of StatXact� Some examples help to make it more clear� Algotithms arenot mentioned� Furthermore� references can be found in the end of the manual�The online help is as well as that of StatXact� The only di�erence between themis the fact that LogXact�s online help knows the expression �missing value�� Theuser will then be refered to the missing value codes which can be elected� Adisadvantage are the hardly given examples�
Finally the software package JMP in its version ���� was considered� JMPis a program from SAS Institute Inc� and was produced for analysing smallerdata sets� It o�ers the main methods for graphic plots and inductive statistics�For extensive analysis of the data the manual recommends to use SAS� Theadvantage of JMP compared to SAS is easy handling and easy learning� becauseof the comfortable dialog boxes� On the other hand it has no programminglanguage to write procedures�
JMP codes missing values in numeral variables with a question mark� Inalphanumeral variables it uses a blank� The narrow connection to SAS can beseen if one looks for external les to import� Only text or SAS transport lescan be read in� In text les the type of a variable will be recognized by the rst row� In numeral variables all nonnumeral signs will be set as missing value�Only blanks will not be noticed� In this case the value of the next column will betaken� Therefore the whole row is moved and the last variables have missings�In alphanumeral values only blanks will be set as missing values� JMP o�ers notool to recode values while reading in data� In addition to that� it is impossibleto change the code for missing values or to de ne several values or an area ofvalues as missing code�
In frequency tables an own row for missing values is printed� In cross tabu�lations no category for missing values is given� The number of excluded obser�vations must be calculated from the di�erence of the number of all observationsand the included� In graphics missing values will be omitted without a message�A test on MCAR is not o�ered�
For calculations of descriptive statistics JMP omits missing values� If cor�relations and covariances are called the user can choose between complete caseand available case analysis�
JMP excludes all incomplete observations concerning the interesting vari�ables from the calculations of tests or con dence intervals� Regression� clusterand discriminant analysis and analysis of variance use the available case anal�ysis for dealing with incomplete data sets as well� In time series only observedvalues are plotted and connected with a straight line�
The considered literature is resticted to three manuals� the IntroductoryGuide which �is a collection of tutorials designed to help � learning JMP strate�
��
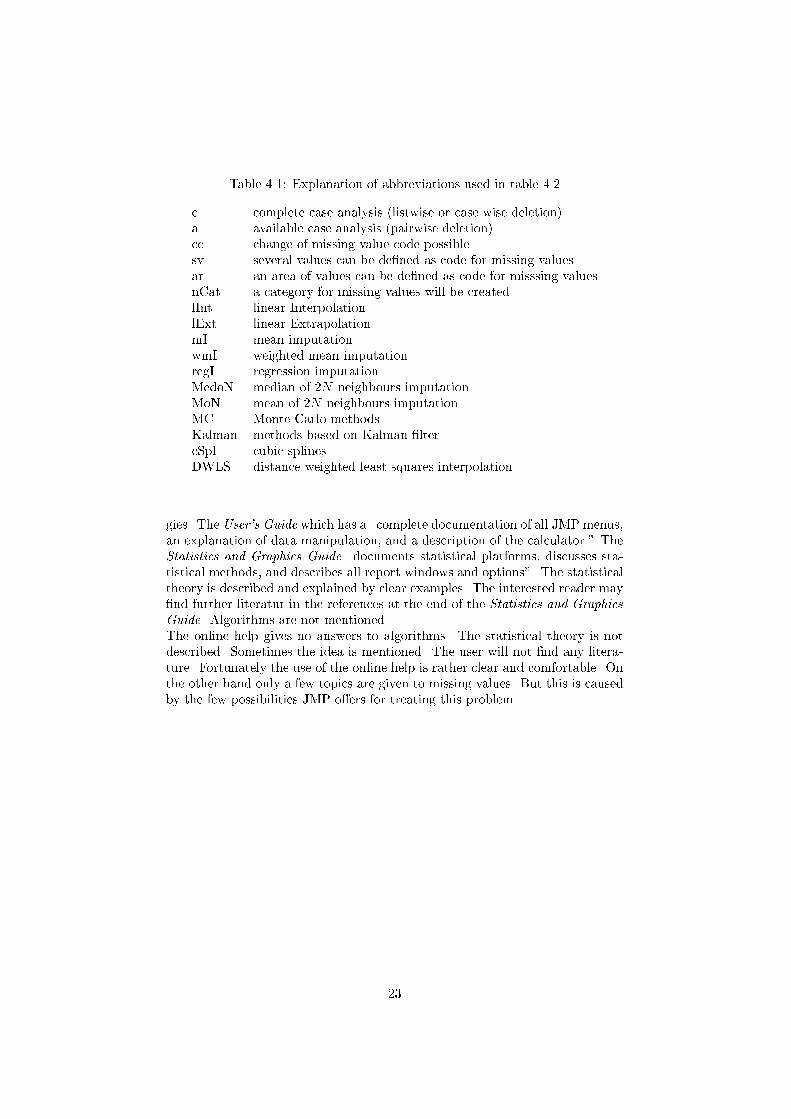
Table ���� Explanation of abbreviations used in table ���
c complete case analysis �listwise or case wise deletiona available case analysis �pairwise deletioncc change of missing value code possiblesv several values can be de ned as code for missing valuesar an area of values can be de ned as code for misssing valuesnCat a category for missing values will be createdlInt linear InterpolationlExt linear ExtrapolationmI mean imputationwmI weighted mean imputationregI regression imputationMedoN median of �N neighbours imputationMoN mean of �N neighbours imputationMC Monte Carlo methodsKalman methods based on Kalman ltercSpl cubic splinesDWLS distance weighted least squares interpolation
gies� The User�s Guide which has a �complete documentation of all JMP menus�an explanation of data manipulation� and a description of the calculator�� TheStatistics and Graphics Guide �documents statistical platforms� discusses sta�tistical methods� and describes all report windows and options�� The statisticaltheory is described and explained by clear examples� The interested reader may nd further literatur in the references at the end of the Statistics and GraphicsGuide� Algorithms are not mentioned�The online help gives no answers to algorithms� The statistical theory is notdescribed� Sometimes the idea is mentioned� The user will not nd any litera�ture� Fortunately the use of the online help is rather clear and comfortable� Onthe other hand only a few topics are given to missing values� But this is causedby the few possibilities JMP o�ers for treating this problem�
��

item
MINITAB
STATISTICA
SYSTAT
Stata
S�PLUS
SPSS
SAS
StatXact
LogXact
JMP
�
�a
�
�����
�
�
NA
�
�
�
�
�
�b
blank
�����
blank
blank
blank
blank
�
�
blank
�c
�
�����
NA
�
�
�
yes
no
no
no
yes
no
yes
no
no
no
�
sv�ar
cc
no
no
cc
sv�ar
sv
no
cc��
no
ar�value
�
�a
c�nCat
c�nCat
c�nCat
c
c�nCat�refuse
c���nCat��
c�nCat��
c
nCat
�b
c�nCat�
a
c
c
c�refuse
c�nCat�
c�nCat
c
a�lInt
�
no
no
yes
no
no
yes��
no
no
no
no
�
yes
yes
yes
yes
yes
yes
yes
yes
yes
a
c�a
c�a�
c�a
c�a�
c�a�
c�a
c
c�a
EM�
refuse
EM���regI��
�
c�
a
c�
c�regI�lInt�lExt
c�
c�a
c
a�MC
c
�
�a
c
c�a�mI�wmI�
c
c�regI�lInt�lExt
c�mI�refuse
c�a�mI
c
a
a
�b
c�
c
c
c�regI�lInt�lExt
c�mI�refuse
c�a
c
a
�c
c�
c�mI�wmI�
c
c�regI�lInt�lExt
refuse
c�a
c
a
�d
c
c�mI�wmI�
c
refuse
c�mI
c
a
�e
lInt
mI�lInt�regI�
c�DWLS
c�regI�lInt�lExt
c�refuse���
c�stop��
c�lInt�lExt�
a
MoN�MedoN
Kalman��
stop���cSpl
��
yes
yes
no�
yes
yes
yes
yes
no
no
no
����a
���
�
���
��
���
��
�
��
�
�
�
�b
���
���
���
��
���
��
���
���
���
���
�c
yes�no
no�yes
yes�no
yes�no
yes�yes
yes�no
yes�no
yes�no
yes�yes
yes�no
�d
�����
����
����
���
���
�����
���
����
����
����
Table����Comparisonofstatisticalsoftwarepackages�Forexplanationoftheitemsandabbreviationsseetable���and���respectively�
��
� Summary
This survey has shown that the missing value problem is treated very di�erentlyeven in this small selection of statistical software packages� Some of the smallerprograms as JMP� StatXact and LogXact have no idea to deal with missingvalues� except to omit incomplete observations� Here is not even a progamminglanguage o�ered to remove the lack of methods by the user� LogXact enablesonly to change the missing value code� JMP merely creates a new category formissing values in tables� LogXact and StatXact allow to choose the code formissing values out of star� dot and question mark while exporting a data set�SYSTAT is somehow more comfortable than these three� because here the userhas sometimes a choice how incomplete data shall be handeled� Amazingly� ito�ers an EM�Algorithm for calculating correlation matrices� but easier methodslike imputation methods are not at all considered� Additionally� the program�ming of macros is not provided� Therefore it is not possible to program any ofthe missing methods� The explanation of the EM�Algorithm is quite extensiveand SYSTAT is able to carry out a test on MCAR what is not at all taken forgranted� Only SPSS o�ers this test in its additional MVA module� Apart fromthat� the statistical background is only mentioned in the manuals in a short way�All the other software packages have a programming language on its disposal towrite macros and remove the lack of methods for missing value treatment� Themore popular program MINITAB enables the user to de ne his own missingvalue codes� either as several discrete values or as an area of values� In additionto that� SPSS o�ers the user to de ne an area and one discrete value� MINITABo�ers only complete case and available case analysis and in time series linearinterpolation to handle incomplete data� References to literature which dealswith missing values are not given� SAS is compareable with MINITAB� In mostcases the complete case analysis is used� but in time series several methods areo�ered and the statistical background is explained very extensively in the manu�als� S�PLUS o�ers mean imputation to ll up incomplete data what is necessary�because quite often actions will be refused because of missing values� This pro�gram is the only one which o�ers a method based on Kalman lter to deal withmissing values in time series� Furthermore� it has many functions for missingvalues� but no examples are given and no information about the treatment ofincomplete data sets is available in the online help� STATISTICA and Stata
�manuals � online help�only in categorical variables in high�resoluted graphs����test for independence refuses incomplete variables�
�if the two�way�ANOVA design changes to unbalanced an error message arises��c if variables will be clustered� If observations will be clustered MV are not allowed��in multiple regression�this action must be carried out with the data management before�for metric variables���test for independence enables to include missing values in a new category �optional�
�possibility to write programs��if missing values are in the center of the time series��in ARIMA�models��only in line plots��user de�ned missings are listed separately��with the MVA�module��in a special book about numerical algorithms��it can be decided whether missing values are included in calculations of statistics or not��the change of the code is valid for all variables
��

are also compareable in its abilities to deal with missing values� Both have sev�eral imputation methods in addition to the complete case and the available caseanalysis� On the other hand it is impossible to de ne several values or an area ofvalues as missing value code� Only STATISTICA allows to change the systemmissing code for each variable and the user may decide whether a new cate�gory for missing values in tables shall be created or not� Besides Stata enablesimputation methods in calculations of tests and con dence intervals but o�ersno discriminant analysis� The statistical theory of the methods is explained ina rather short way or missing� SPSS without its additional MVA module hasmany procedures to treat incomplete data� Several imputation methods areo�ered which must in most cases be carried out by data transformation beforeapplying statistical analysis� The user can also de ne codes for missing values inmore than one way� With the MVA module� which is especially for incompletedata sets� SPSS allows to examine the missing value pattern and the systemwhich possibly causes the nonresponding� Therefore it is the most comfortableprogram in this selection�
To sum up one must say that the problem of missing values is recognized�but considered in a di�erent intensity within the examined software packages�The perfect program was not in this survey� Hence� it should be an incentivefor all to enlarge the abilities for the missing value problem�
� Bibliography
D� Altman ����� Practical Statistics for Medical Research� Chapman ! Hall�Weinheim�
K� Backhaus� R� Erichson� W� Plinke� R� Weiber ������ Multivariate Anal�ysemethoden� Springer Verlag� Berlin� Heidelberg�
G� Bamberg� F� Baur ������ Statistik� Oldenburg Verlag �Au�age�
Bankhofer� Hilbert ����� Statistical Software Packages for Windows� A Mar�ket Survey� Statistical Papers ��� �������
G� Brosius� F� Brosius ������ SPSS Base System und Professional Statistics�Fuer die Versionen �x und ��x� Bonn� International Thomson Publishing ��Au�age�
A� Buehl� P� Zoepfel ������ SPSS fuer Windows ���� Praxisorientierte Ein�fuehrung in die moderne Datenanalyse� Bonn� Addison�Wesley �� Aufalge�
J�M� Chambers� T�J� Hastie ������ Statistic Models in S� Wadsworth andBrooks Cole�
CYTEL Software Corporation ������ LogXact For Windows User Manual�
CYTEL Software Corporation ������ StatXact For Windows User Man�ual�
��
T�R� Dawber ������ The Framingham Study The Epidemiology of Atheroscle�rotic Disease� Harvard University Press� Boston�
FDA� Food and Drug Administration� ����fnl�pdf� www�fda�gov�cder�guidance�
A� Fieger� H� Toutenburg ������ SPSS �fuer Windows� Tables Arbeitsbuchfuer Praktiker� Muenchen� Prentice Hall�
A� Fieger� H� Toutenburg ������ SPSS Trends fuer Windows Arbeitsbuchfuer Praktiker� Muenchen� Prentice Hall�
T� Hahl� R� Shelton� Dropping Variables That Have Only Missing Values� Ob�servations Vol� �� No� �� The SAS Institute� v�n��pp��html �
J� Hartung� B� Elpelt ������ Multivariate Statistik� Oldenburg Verlag� Muenchen�
H� Kahn� C� Sempos ������ Statistical Methods in Epidemiology� Oxford�
A� Krause ����� Einfuehrung in S und S�PLUS� Springer Verlag�
R� Little� D� Rubin ����� Statistical Analysis with Missing Data� John Wiley! Sons� New York�
S�PLUS � Guide to Statistics� Mathsoft �����
S�PLUS� User�s Guide� Version ��� Mathsoft �����
S�PLUS� Programmer�s Guide� Version ��� Mathsoft �����
MINITAB User�s Guide� Release �� for Windows ������
MINITAB Reference Manual� Release �� for Windows ������
C� R� Rao� H� Toutenburg ������ Linear Models Least Squares and Alter�natives� Springer Verlag� New York�
SAS Institute ������ JMP Version ��� Introductory Guide� SAS Institute Inc�
SAS Institute ������ JMP Version ��� User�s Guide� SAS Institute Inc�
SAS Institute ������ JMP Version ��� Statistics and Graphics Guide� SASInstitute Inc�
SAS Institute ������ SAS�STAT User�s Guide� Version �� SAS Institute Inc�
SAS Institute ������ SAS�GRAPH Software Reference� Version �� SAS Insti�tute Inc�
SPSS Inc� ������ SPSS Base System User�s Guide Release ���� Mary AnnHill� SPSS Inc�
�

SPSS Inc� ����� SPSS Missing Data Analysis ��� Mary Ann Hill� SPSSInc�
SPSS ������ SYSTAT ��� for Windows Data�
SPSS ������ SYSTAT ��� for Windows Graphics�
SPSS ������ SYSTAT for Windows Statistics�
SPSS ����� SYSTAT ��� for Windows New Statistics�
SPSS ����� SYSTAT ��� for Windows Command Reference�
Getting started with Stata for Windows� Stata Press ������ College Station�Texas�
Stata Graphics Manual Release �� Stata Press ������ College Station� Texas�
Stata User�s Guide Release �� Stata Press ������ College Station� Texas�
Stata Reference Manual Release �� Volume ���� Stata Press ������ CollegeStation� Texas�
StatSoft ����� STATISTICA Benutzerhandbuch�
H� Toutenburg ������ Lineare Modelle� Physica�Verlag� Heidelberg�
H� Toutenburg� A� Fieger� Ch� Kastner ������ Deskriptive Statistik fuer Betriebs�und Volkswirte� Eine Einfuehrung in SPSS fuer Windows� Muenchen� PrenticeHall�
H� Toutenburg� A� Fieger� Ch� Kastner ������ Induktive Statistik fuer Betriebs�und Volkswirte� Eine Einfuehrung in SPSS fuer Windows� Muenchen� PrenticeHall�
��