Handbook on Urban Infrastructure Finance - NewCities · Handbook on Urban Infrastructure Finance....
139
WITH SUPPORT FROM: Handbook on Urban Infrastructure Finance Dr. Julie Kim, Senior Fellow, New Cities Foundation
Transcript of Handbook on Urban Infrastructure Finance - NewCities · Handbook on Urban Infrastructure Finance....

WITH SUPPORT FROM:
Handbook on Urban Infrastructure FinanceDr. Julie Kim, Senior Fellow, New Cities Foundation

You can copy, download, or print this report for your own use, and you can include excerpts from New Cities Foundation publications, databases, and multimedia products in your own documents, presentations blogs, websites, and teaching materials, provided that suitable acknowledgment of the New Cities Foundation as source and copyright owner is given. All requests for public or commercial use and translation rights should be submitted to [email protected]. Request for permission to photocopy portions of this material for public or commercial use shall be addressed directly to the New Cities Foundation.
Kim, Julie, New Cities Foundation (2016), Handbook on Urban Infrastructure Finance
[online: http://bit.ly/NCFUrbanFinance]
Please cite this publication as:
This report was written as part of the Financing Urban Infrastructure Initiative and published in April 2016.
The opinions expressed and arguments employed herein are the Foundation’s. Edited by Naureen Kabir Collings, Director of Research, New Cities Foundation.
Handbook on Urban Infrastructure Finance
Dr. Julie Kim, Senior Fellow, New Cities Foundation
Photo credits for cover page:Denver Bike Lanes - Flickr © Mark Danielson | South Lake Union Streetcar, Seattle - Flickr © Curtis Cronn | Goethals Bridge Reconstruction project, New York/New Jersey - Wikipedia © US Cost Guards | Agua Espraiada - Flickr © Jornal SP Zona Sul | Plenary Properties Long Beach LLC (Developer), Edgemoor Infrastructure and Real Estate and Clark Construction (Contractor), Skidmore Owings & Merrill (Architect) | N-33 Road Project, Netherlands - Royal BAM Group © Aerophoto EELDE | London CrossRail project - Flickr © Department for Transport | Carlsbad desalination plant © Kleinfelder | FasTracks Commuter and Light Rail Project, Denver - Wikipedia © vxla | Rio Operations Center, Rio de Janeiro - Flickr © World Resources Institute | Hobart Airport, Tasmania - Wikipedia © R773 | Atlanta Beltline, Atlanta - Rails-to-Trails Conservancy © Ryan Gravel courtesy of Atlanta Beltline Inc.
Contents
Preamble.......................................................................................................................................................................................... 1
EXECUTIVE SUMMARY.......................................................................................................................................................T3
1. Introduction............................................................................................................................................................................... 18
1.1 Global Urbanization Context........................................................................................................................................... 18
1.2 Key Urban Infrastructure Challenges....................................................................................................................... 18
1.3 Handbook Objective and Organization..................................................................................................................... 22
2. Urban Infrastructure Financing Instruments............................................................................................ 23
2.1 Basic Concepts and Underlying Issues.................................................................................................................... 23
2.2 Public Sector Financing ................................................................................................................................................... 25
2.2.1 Intergovernmental Transfers from National and State/Provincial Governments..................................................................................................................................................... 26
2.2.2 Municipal Financing Instruments........................................................................................................ 28
2.2.3 Other Public Sector Financing Considerations......................................................................... 33
2.3 Private Sector Financing................................................................................................................................................... 33
2.3.1 Private Sector Financing vs. Private Capital................................................................................. 36
2.3.2 Equity Capital Sources................................................................................................................................ 37
2.3.3 Debt Capital Sources................................................................................................................................... 42
2.3.4 Public Private Partnership Models..................................................................................................... 43
2.3.5 Privatization through Divestments..................................................................................................... 48
2.3.6 Other Private Sector Financing Considerations........................................................................ 51
2.4 Financing Support from International Financial Institutions..................................................................... 53
2.5 Credit Enhancements and Other Financial Leveraging Tools................................................................... 58
3. Funding Considerations and Sustainable Revenue Sources..................................................... 61
3.1 Taxes and Other Related Revenue Sources.......................................................................................................... 62
3.2 User Charges............................................................................................................................................................................. 69
3.3 Revenues from Brownfield Recycling........................................................................................................................ 72

Contents
4. Innovations in Urban Infrastructure Funding and Financing..................................................... 77
4.1 CEPAC Bonds: Additional Revenue Source.......................................................................................................... 78
4.2 Crowdfunding: Small Projects and P3 Equity Capital................................................................................... 81
4.3 Pension Funds in the Greenfield Space: N-33 Project in the Netherlands...................................... 86
4.4 Local Government Funding Agencies: Multi-City Pooled Approach................................................... 89
4.5 Socially Responsible Financing..................................................................................................................................... 93
4.5.1 Green Bonds........................................................................................................................................................ 93
4.5.2 Social Impact Bonds..................................................................................................................................... 94
4.5.3 Carbon Tax/Cap-and Trade.................................................................................................................... 97
5. Summary, Conclusions, and Afterthoughts............................................................................................... 100
Appendix A: Institutional and Governance Dimensions to Urban Financing.................... 106
A.1 Institutional Capacity Building: IFI and NGO Support.................................................................................... 107
A.2 Institutional Requisite in P3 Implementation...................................................................................................... 109
Appendix B: Financing Smart City Concepts.................................................................................................. 115
References....................................................................................................................................................................................... 127

1
Handbook on Urban Infrastructure Finance
In early 2015, New Cities Foundation
launched the Financing Urban
Infrastructure Initiative to address critical
infrastructure financing issues and
challenges facing cities today. This
handbook is the culmination of that
initiative.
Infrastructure financing is a complex
subject that requires a great deal of
knowledge and experience. At the same,
infrastructure and its financing needs affect
everyone. And their effect is not a frivolous
one—our basic livelihood often depends on
them. There have been other guidebooks
and reports on the topic, some a helpful list
of various financing instruments available,
others more geared to investors and
financial professionals well versed in this
area.
The main thrust of this handbook is the
global urbanization trend and how cities
need to cope with providing basic
infrastructure services in the face of rapid
growth. Because most of this growth is
projected to occur in mid-size cities1 in
the emerging world, the handbook is
written with them in mind, recognizing
that these cities often have limited
financial savvy and knowledge. And they
are not alone in this—even those of us
who have devoted most of our lives on
the subject are often at a loss in the maze
of an ever-changing financial landscape.
This handbook focuses on financing
challenges at the local, sub-sovereign
level rather than at the national, sovereign
level where many larger and critical
macroeconomic issues are at stake—e.g.,
development of capital markets, currency
limitations—that are beyond the control
of local governments and addressed
amply elsewhere. This handbook does
not provide a laundry list of the state-
of-the-art infrastructure financing tools
and instruments (although we do provide
these as necessary) or detailed case
studies on a select few. Rather, it explains
the basic underlying concepts so that the
myriad financing vehicles available today
are understood in their proper context.
The concepts presented are sufficiently
cohesive and are intended to help cities
and local governments better navigate
the complex world of infrastructure
financing. In this regard, this document
is indeed a “handbook” and is more
a “how-to” guide than a policy paper.
This handbook is intended for the
public sector. Infrastructure, after all,
embodies public goods and services.
Preamble
1 Mid-size or the so-called ‘‘middle-weight city’’ is defined as cities with populations between 200,000 to 10 million.

2
Preamble
Many infrastructure assets such as energy
utilities are already mostly in private hands
and, though continuously evolving, their
financing market is mature. The most
critical infrastructure financing challenges
today, however, lay with those assets
that are still in the public domain—where
the financing is largely dependent on
subsidies, taxes, and other sources that are
unsustainable in the long run. We focus
less in this handbook on transfers and
subsidy-like funding and more on financing
instruments that help cities become more
self-sustainable in the long run. Because
many of these financing instruments are
more prevalent in countries with a mature
market economy, the case examples
we present tend to weigh in their favor.
Finally, in addition to a comprehensive
literature review, this handbook was
prepared based on extensive interviews
with key industry stakeholders from
both the public and private sectors.
3
Handbook on Urban Infrastructure Finance
Introduction
Urbanization is a well-known phenomenon
that has become an integral part of our
modern culture. Credible institutions like
McKinsey are predicting 65 percent of
the future growth in global productivity
will come from top 600 cities, a majority
being mid-size cities spread out across 57
countries and 440 of them—the so-called
Emerging 440—from the developing
world. With rapid and highly concentrated
growth, these 600 cities will undoubtedly
face many difficult challenges in the
foreseeable future.
Urbanization cannot happen in a vacuum.
Cities need to provide basic infrastructure
services—clean water, power and
electricity, roads, public transit, sewage
systems, telecommunications, schools,
hospitals, to name a few—to support the
rapid growth and the basic livelihood of
their citizens and businesses. Infrastructure
is capital-intensive and expensive to build
and, once built, lasts a long time. Unlike
the digital world that defines our ethos
today, however, infrastructure embodies
hard, fixed assets that are least of all agile
or robust—and the services do not come
cheap.
With rapid urbanization, we are currently
facing a global infrastructure financing
crisis. On the demand side, various
estimates indicate we need between $57 to $67 trillion in infrastructure spending
worldwide—almost 5 percent of gross
world product every year from now until
2030. This amount reflects a 60 percent
increase over and above historical
spending levels and 75 percent of it is
needed by cities around the world.
Furthermore, not all of this spending
need is in new construction. In many
developed economies with mature but
aging infrastructure systems, a significant
amount is needed to barely maintain
current levels of service. An added
challenge for many cities is the shifting
of funding responsibility from national to
local governments.
On the supply side, the irony is that there is
plenty of money, especially in the private
sector. There is currently an oversupply
of private capital. In particular, there
is also an unprecedented appetite for
infrastructure assets from the private
investment community—in part because
the asset class has performed consistently
well in recent years. Institutional investors,
such as pension funds who are particularly
suited for infrastructure assets with their
“long-termism,” have been increasing their
allocations steadily in the infrastructure
investment space in recent years.
International financial institutions and
development banks (collectively known as
IFIs) are also becoming much more active
Executive Summary

4
Executive Summary
in this space—and, increasingly, their
activities are at sub-sovereign, local levels.
The issue at hand, hence, is not a lack of
money, but rather insufficient infrastructure
projects in the pipeline to keep up with
the money supply. There is an important
distinction between financing and funding.
Infrastructure financing, in essence, is
raising the high upfront costs to build the
infrastructure when and where needed by
leveraging the future revenues that can
repay the upfront costs. Financing is the
raising of this upfront capital to expedite the
process. Funding is the revenue streams in
the future to repay the financing. The lack
of projects in the pipeline is due in reality
to many projects that are not financeable
because of the lack of clear revenue
sources.
This handbook is the culmination of the
Financing Urban Infrastructure Initiative
launched by the New Cities Foundation
(NCF) in early 2015. The primary aim
of the Initiative is to address critical
infrastructure financing (and funding)
issues and challenges facing cities today
as they undergo rapid urbanization.
Through this handbook, we hope to
provide a set of practical guidelines that
can help cities become smarter in the
urban infrastructure finance space and
respond more effectively and timely to the
basic infrastructure service needs of their
citizens and businesses.
This handbook is written primarily for mid-
size cities in the emerging world where
most of the urbanization and growth
is projected to take place and where
infrastructure financing challenges are
most daunting. Most likely, local
governments in these cities have limited
financial savvy and knowledge in what
is available in the market place. Rather
than providing a running list of the state-
of-the-art financing tools and instruments
or detailed case studies of a select few,
this handbook focuses on important
concepts underlying the myriad financing
vehicles available today so that they
are understood in proper context. In this
regard, this handbook is intended to be
more of a “how-to” rather than a major
policy document.
An overview of various urban infrastructure
financing instruments available to cities
today are provided as well as effective
ways of addressing the issues related to
sustainable funding sources described
above. It also discusses new and innovative
financing models that are emerging and
critical roles each stakeholders have to play
in dealing with the global infrastructure
financing crisis.
Urban Infrastructure Financing
Instruments
Although many infrastructure assets (e.g.,
energy utilities) are in private hands, the
most critical infrastructure financing
challenges facing cities today are
those assets in the public domain (e.g.,
public transit, roads, water/wastewater
treatment) where the public sector is
5
Handbook on Urban Infrastructure Finance
responsible for owning and operating the
assets and where financing largely relies
on grants, subsidies, taxes and other
sources that are unsustainable in the long
run. Currently, for these public assets,
infrastructure can be financed completely
by the public sector or can involve the
private sector.
Public Sector Financing Instruments
Public sector financing is almost always 100
percent debt financing (i.e., fully leveraged
with no equity capital at risk). The cost of
this debt financing is significantly lower
relative to the private sector due largely
to taxes and other public assets that
effectively serve as collateral on the debt.
Taxpayers are thus de facto equity holders
of government investments and any risks
associated with these investments are
ultimately borne by the taxpayers. These
risks, however, are not reflected in the
debt financing costs per se because they
are considered relatively risk free, implying
taxpayers are obligated to make the debt
holders whole in one way or another.
For fully publicly financed projects, first and
foremost, cities rely on their national and
state governments for support, which are
essentially inter-governmental transfers
in the form of direct grants, subsidies,
low-interest loans, and/or various forms
of credit enhancements. In conjunction
with these transfers from higher tier
governments, cities can seek their own
financing options. In this handbook, we
focus less on transfers and subsidy-like
funding and more on financing instruments
that help cities become more self-
sustainable in the long run. Because many
of these financing instruments are more
developed in the advanced economies,
the case examples we present tend to
weigh in their favor. In most countries, cities
commonly rely on bank loans to finance
their infrastructure projects, either through
commercial banks or public banks—e.g.,
landesbanks in Germany—that serve local
needs. However, one of the most robust
financing instruments available for cities
today is municipal bond financing (and
many variations thereof).
The U.S. has by far the largest and most
mature municipal bond markets in the
world. For cities and local governments
in the U.S., municipal bonds have played
a critical role in their ability to self-finance
major infrastructure projects, either
partially or fully. Most municipal bonds are
tax-exempt bonds, where the yields bond
holders earn are not subject to income
taxes. Tax credit bonds (e.g., BAB bonds
in the U.S.) have been emerging in recent
years as another viable municipal bond
instrument. They are taxable bonds that are
considered more cost effective because
tax subsidies are paid directly to issuers or
bond buyers. They also appeal to a large
group of investors with no in-country tax
liabilities, e.g., institutional and foreign
investors, who have been largely excluded
from the tax-exempt bond market in the
past.

6
Executive Summary
Although the municipal bond market
is not yet well developed outside the
U.S., many cities around the world
are beginning to explore it as a viable
financing option. Cities like Ahmedabad
and Bangalore in India and Johannesburg
and Kigali in Africa already have issued
bonds for their infrastructure. Others that
are new to the municipal bond market,
however, must ensure basic building
blocks are in place. Especially for cities
in the developing world, these building
blocks should include, in addition to
credible institutions, support from one
or more IFIs, establishment of their own
credit rating where possible, and full buy-
in from their national government, which
may ultimately be held responsible if they
default.
Private Sector Financing and Delivery Models
Private sector financing becomes
attractive when the public sector is fiscally
constrained and facing serious debt
capacity issues. Private sector financing is
generally perceived to be more expensive
because it almost always involves at-
risk equity capital. Also, unlike public
sector financing, the risks underlying the
investments are fully manifested as risk
premiums in the financing costs of both
the equity and debt capital.
Unlike public sector financing, equity
capital plays an important role in private
sector financing. It is used as a leverage to
raise the needed debt capital. Third-party
managed infrastructure equity funds have
been the critical source of this equity capital.
By some measure, these funds have been
able to raise about USD $300 billion over
the last decade, which, based on typical
leveraging that occurs in the industry,
could potentially mean as much as $1-1.5
trillion of financing available to support
infrastructure projects. In large part, this
equity capital is sourced from institutional
investors who collectively oversee over
$100 trillion in investment assets globally.
Although their investment in infrastructure
has been slow in growing, their role in
helping to close the global infrastructure
financing gap—perhaps as much as 20
percent—is now generally recognized.
More recently, institutional investors
have also been taking up the slack in
the long-term infrastructure debt space
left behind by commercial banking
and insurance industries as a result of
more stringent liquidity and leveraging
requirements in the post-2008 crisis
environment. Sourced from institutional
investors, major infrastructure debt funds
have also been emerging, offering a wide
range of products from bond-oriented to
subordinated debt and with varying terms
and risk-return profiles.
When private sector financing is
involved, it is also generally combined
with the delivery of infrastructure projects.
Historically, relative to the public sector,
it has been shown that the private sector
can be much more cost effective in the
delivery, but their financing can be more

7
Handbook on Urban Infrastructure Finance
expensive. Private sector participation
thus is better accepted politically when (a)
overall cost of providing infrastructure is
non-recourse in nature, i.e., the private
sector takes on most of the risks by not
adding any significant new debt to the
public sector’s balance sheet, and
(b) financing costs can be minimized,
especially to the extent that the cost
savings from efficiency gains in the
delivery surpass the higher financing costs
associated with private financing.
Two primary infrastructure delivery
approaches under private sector financing
are: (1) public-private partnerships (P3)
where the government continues to
own its infrastructure assets and play an
active oversight role but, through a long-
term concession agreement, delegates
its service delivery responsibilities to the
private sector over the lifecycle of the
assets and (2) divestment or privatization,
where the government sells its
infrastructure assets to the private sector
in whole or in part through a one-time
transaction relinquishing its responsibilities
commensurate with the shares sold.
P3 has been evolving continuously since
the 1990s. The key consideration is whether
the private sector takes on the brunt of the
overall financial risks (revenue-risk model)
or the public sector has the ultimate
financial liability in the long run (availability
payment model). Because preplanning and
procurement processes can be long,
complex, and costly regardless of project
size, P3 is generally preferred for large-
scale, capital intensive projects that
have long-term strategic importance. In
addition to financing, P3 offers a number of
advantages over the traditional approach
to delivering infrastructure. Most
importantly, P3 provides an opportunity
for the public sector to transfer some or
all of the risks inherent in infrastructure
projects to the private sector. Other
advantages include opportunities for
innovations, lifecycle approach to cost
and operational efficiencies, accelerated
implementation of critical infrastructure
projects, and bundling of multiple projects
across multiple jurisdictions for economies
of scale.
Privatization is essentially a brownfield
transaction where the public sector
receives capital from the sales proceeds
of existing facilities. These proceeds
are unencumbered in that the public
sector has no repayment obligations.
Privatization transactions thus have the
dual benefit of the private sector taking
over all the upkeep associated with the
existing infrastructure and also providing
additional capital for the public sector’s
disposal. Privatization often involves the
decoupling of vertically integrated sectors
(e.g., railroads, water utility) to separate
out those operations/assets that are more
amenable to competition and thus benefit
from privatization (e.g., train operations,
water reservoirs) from those that are more
monopolistic in nature, better left in public
hands (e.g., railroad tracks, water pipeline
8
Executive Summary
networks). Decoupling also helps to defray
the conflict of interest situation often
facing vertically integrated sectors, where
the government plays both the owner and
regulator roles.
Often, private sector financing and delivery
can be mired in political controversy.
There is sufficient evidence to prove,
however, that wider public acceptance
is possible if there is a clear mandate on
the use of the proceeds to reinvest in
infrastructure, credible institutions such
as public pensions are involved on the
buyer side, and a clear regulatory regime
is established to protect social objectives.
IFI Financing Support
In addition to public and private sector
financing, IFIs provide critical financial
support in the global infrastructure
financing space. IFIs are public sector
development banks and development
finance institutions that are owned by
one or more national governments.
Operating at international, regional, and
national levels, IFIs provide a critical
nexus between the public policy goals of
governments and the international capital
markets that allocate financial resources
on a global scale. Collectively, IFIs provide
both mobilization of significant capital and,
perhaps as importantly, knowledge on
institution-building, policy development,
and the blending of financial instruments
for investing in urban infrastructure.
Many IFIs have developed new
sub-sovereign level instruments to
specifically address urban infrastructure
investment challenges. Though limited,
some can also supply capital to municipal
governments directly without a state
guarantee. They have also developed other
mechanisms such as municipal funds,
risk-sharing facilities, or specialized
financial instruments that support urban
developments specifically. Today, IFIs
typically earmark 10 to 15 percent of their
total portfolio for urban programs. Much
more is also earmarked for infrastructure
projects that ultimately impact cities. By
some estimates, as much as 60 percent of
total IFIs lending has some impact on cities
and urban areas around the world.
Credit Enhancements and Leveraging Tools
Whether public or private sector financing,
it can be said that the basic goal of
infrastructure financing is to get as much
money as possible as cheaply as possible.
There are many credit enhancement
and other financial leveraging tools that
help to achieve this goal, especially on
the debt financing side. Most of these
tools are intended to decrease the risk
and increase the liquidity on the overall
investments. Low-interest subordinated
loans and standby contingent credits are
often provided by national governments
or by IFIs to help reduce risks to investors
and allow cities to borrow at lower interest
rates. In recent years, these subordinated
9
Handbook on Urban Infrastructure Finance
debt instruments have been used to target
large strategic infrastructure projects
to leverage significant private sector
financing, especially in the form of senior
debt (e.g., U.S. TIFIA program and EU-
EIB Project Bond Credit Enhancement
Facility). Financing costs can also be
reduced by providing tax incentives
(e.g., tax-exemption in municipal bonds)
or various forms of insurance products
or guarantees (e.g., MIGA political risk
insurance, HM Treasury Guarantee in the
U.K.).
Secondary refinancing markets also
provide additional liquidity for early-
phase investors to further leverage their
investments into new project opportunities,
thus improving the overall infrastructure
funding picture. Recapitalizations through
secondary markets involve replacing short
term, high risk, expensive capital with
longer term, lower risk, lower cost capital.
Sometimes this is accomplished through
pooling and securitization of multiple
assets into asset-backed securities
(ABS) that can be reissued and traded on
capital markets. Through these secondary
markets, cities can have a deeper and
wider dip into the private investment pool
for infrastructure.
Funding Considerations and
Sustainable Revenue Sources
In one form or another, financing is always
tied to repayment obligations and does not
address per se the fundamental problem
of reducing the infrastructure funding
gap. To effectively reduce the funding
gap, we need to address the revenue issue
and make more transparent where the
buck really stops ultimately.
Historically, many cities around the world
have generally relied on direct grants and
subsidies from IFIs and/or their national
and state governments as the primary
funding sources. These funds in turn come
from taxes that are levied at national and
state levels and, where available, from
sovereign wealth reserves tied directly
to publicly owned commodities and
assets. Although limited, direct grants and
subsidies from philanthropic sources can
also be an important funding source for
cities. These direct grants and subsidies
have no repayment obligations and can
be further leveraged to secure additional
infrastructure financing.
Outside direct grants and subsidies, the
two prevalent revenue funding sources
available currently for infrastructure
are taxes and user charges. Compared
to taxes, user charges are still limited
as a significant funding source for
infrastructure, especially for non-utility
sectors where a user-pay culture is yet
to be established. Increasingly, however,
taxes need to be supplemented with user
charges and striking the right balance
between the two sources will be critical in
addressing the impending infrastructure
funding crisis.

10
Executive Summary
Taxes
Regarding taxes, in addition to national
and state taxes, cities can increase their
self-reliance by enhancing their own local
taxing authority. In general, regardless
of who levies the taxes, as is the case
for vehicle-mile-traveled (VMT) tax, the
basic approach to taxing for infrastructure
should be closely tied to the wear-and-
tear of facilities and the actual cost
of producing infrastructure services
to make funding more sustainable in
the long run. For cities specifically, the
value capture approach and developer
exactions have proven particularly
effective. For both, the value of improved
infrastructure is captured by monetizing
the resulting increase in property values
through various taxing schemes (e.g., tax
increment financing, special assessments,
land value tax, betterment tax), incentive
payments (e.g., impact fees, tap fees,
linkage fees), or other means (e.g., joint
developments, negotiated exactions, land
or air rights lease/sale). For many cities in
the developed world, these value capture
approaches are largely within the current
tax regime without requiring major tax
reforms.
User Charges
Compared to taxes, it is generally easier
to tie user charges directly to the cost of
producing services so a perpetual funding
shortage can be avoided. They are thus
a more self-sustaining source in the
long run. Imposing user charges can be
politically sensitive, especially for sectors
such as water supply where the services
are often viewed as entitlements that
should be subsidized. Despite potential
public hostility, user charges can be the
key to unlocking private sector capital
and attracting innovative, self-sustaining
financing solutions in the long run. Better
quality service, more service options
catered to specific users, user vouchers,
and automated collection systems are
a few potential solutions that can help
incentivize users and their willingness to
pay.
There has been an ongoing debate about
the viability of user charges as a legitimate
and substantive funding solution,
especially in non-utility sectors (e.g., roads)
where the degree of externality is higher.
Two notable shifts in the infrastructure
industry at large at this juncture, however,
may trigger a more user charge-friendly
funding regime in the future. First, as
funding responsibility and infrastructure
provisions become more localized, it could
become easier to assign specific benefits
to specific users. In the case of toll roads,
for example, because toll facilities are by
nature local, public acceptance of tolling
have varied widely by location and tolling
policy at national level have had limited
effect. Decisions about tolling thus could
be made more effectively at the local
level. Second, as the role of the private
sector continues to feature prominently in
the potential infrastructure solution space,
it is important to recognize that the user
charge funding regime is the preferred and
11
Handbook on Urban Infrastructure Finance
more sustainable model in the long run to
engage the private sector more effectively.
The full potential for user charges has yet
to be explored. Our collective challenge
is to unleash this new source of funding
by creating a new value paradigm for
infrastructure that incentivizes users and
their willingness to pay.
Reducing Funding Needs through
Cost and Operational Efficiency
In addition to taxes and user charges,
an indirect approach to dealing with the
infrastructure funding issue is by reducing
overall funding needs. Several indirect
options are currently available to reduce
funding needs. One option is to increase
overall project efficiency and minimize
total project costs through a lifecycle
approach that integrates design and
construction with operations and
maintenance (O&M). A P3 delivery model is
the primary mechanism that enables such
lifecycle approaches. Because O&M costs
are often a large part of infrastructure
funding needs, another way is to
increase O&M efficiency through various
conservation and efficiency measures,
demand management, and congestion
pricing strategies that are aimed at
maximizing the use of existing facilities.
Most green and sustainability initiatives
and smart city concepts serve this purpose.
Reducing financing costs is another indirect
way to reduce the funding needs which,
as discussed earlier, can be achieved by
using various credit enhancement and
leveraging tools.
For smart city concepts in particular, no
conversation about cities can now take
place without considering their “smartness”
in one form or another. The primary goals of
these concepts are to improve the quality
and performance of urban services, reduce
resource consumption, and engage more
effectively and actively with its citizens.
Smart city concepts are continuing to
evolve and, in most cases, the benefits are
well recognized. The challenge, however,
is figuring out how to pay for them,
especially for cities and local governments
experiencing fiscal constraints. Potential
financing approaches to several key smart
city concepts are provided in this handbook
to help cities face the challenge and reap
the benefits.
Brownfield Recycling for Potential
Funding Source
There is a limit to how much taxpayers and
users can take on to pay for infrastructure.
Applied successfully in Australia in recent
years, brownfield recycling (also referred
to as social privatization) can potentially
provide a third major source of funding
for infrastructure. Brownfield recycling is
essentially the leveraging of existing
public infrastructure assets by leasing
or selling them to the private sector and
using the proceeds therefrom to fund new
infrastructure projects. Paired with the right
set of regulations, this approach provides
as close to free, unencumbered funding as
possible with no repayment obligations. In
general, the size of the proceeds tend to be
quite high and, coupled with no repayment
12
Executive Summary
obligations, this is one of few options that
begins to address the sheer magnitude of
the funding need at hand.
Innovations in Urban Infrastructure
Finance
For cities that must take on the brunt of
infrastructure provision responsibilities in
the face of rapid urbanization, innovative
ideas in urban infrastructure financing
could provide a welcome relief. They would
also be better served knowing the best
practices and new ideas that are emerging
in the world presently. Several innovative
urban financing models and best practices
are presented in the handbook, each
specifically mitigating the critical funding
and financing challenges cities are facing
today.
CEPAC Bonds for Additional Revenue
Source
In addressing the funding and sustainable
revenue issue, CEPAC (Certificados de
Potencial Adicional de Construção or
Certificates for Additional Construction
Potential) bonds in Brazil represent an
innovative urban funding instrument that
combines value capture, development
exaction, and air rights sale approaches.
Although they have been around since
2004, their use has been very limited
outside Brazil. CEPAC bonds are issued
by municipal governments as additional
development rights on specially
designated areas within their cities that
need redevelopment. The bonds entitle
the bond buyers (typically, developers and
investors) to build above the density limit
specified by the current zoning regulations
(referred to as “up-zoning”). The bonds
are offered both through public and
private auctions and are openly traded in
the stock market. The City of Sao Paolo,
for example, was able to raise over R$1.6 billion (US $800 million) for two small
redevelopment areas in the first five years
of their CEPAC bond offering. These bond
proceeds represented almost 60 percent
of the annual property tax revenues for the
city as a whole. The proceeds provided
upfront funding to build roads, transit,
and affordable housing in the designated
redevelopment areas. Bonds sold in
private auctions were also used by cities
as non-budgetary funding to pay for
infrastructure and housing contractors and
vendors that provided goods and services
in the redevelopment areas.
Crowdfunding for Small Projects and P3
Equity Capital
Because user charges will play an
increasingly important role to supplement
tax revenues, cities need to rethink
innovative ways to engage users more
effectively in both defining and financing
infrastructure needs. A crowdfunding
approach can help cities in this regard.
Crowdfunding combines the key aspects
of crowd sourcing with those of micro-
financing by establishing the connection
between (1) entrepreneurs—who aim to
raise capital—and (2) novel investors—
13
Handbook on Urban Infrastructure Finance
who form an emerging source of capital
in small amounts—through (3) internet-
based intermediaries. In the infrastructure
financing space, “civic” crowdfunding
initiatives that cater to serving the broader
public good have proven particularly
effective, especially for small projects (e.g.,
bike lanes or public parks) or as a strategic
financing option (e.g., “last mile funding” to
help a mature initiative reach fruition, seed
funding to create momentum to secure
larger funding, or a matching fund to fulfill
grant requirements). “Mini” bonds that
are in small denominations (e.g., in $500s
instead of the usual $20,000s) have also
proven to be an effective tool for cities that
target small “crowd” investors. In Denver,
for example, an on-line crowdsourcing
platform the city provided was instrumental
to the success of their issuance of $12
million mini-bonds, which were sold out
within a single hour. Crowdfunding is
also emerging as an important source of
equity capital for P3, helping to broaden
the pool of potential P3 equity investors.
In addition to social and political benefits,
crowdfunded P3 equity helps drive the rate
of return down and lower the overall cost
of capital, ultimately passing the savings
on to the public sector in the form of lower
availability payments or reduced tolls.
LGFA for Multi-City Pooled Approach
For many mid-sized cities around the
world, a critical challenge is in establishing
their own credibility in the global market
place and having projects of sufficient size
to warrant substantive investments. Local
Government Funding Agencies (LGFA) is a
multi-city pooled approach that provides a
conduit for financial cooperation between
cities to build such credibility. LGFA, a long-
proven concept in Scandinavia and the
Netherlands, has had limited applications
outside these countries. For those few
that exist currently, all of them are AAA-
rated and, collectively in 2012, they were
able to raise €70 billion (U.S. $80 billion)
in the global capital market. In a number
of countries in Europe and elsewhere,
the establishment of LGFAs is currently
being seriously considered. In France,
for example, Agence France Locale was
created in late 2014 and the planning of its
first bond issuance is currently underway.
LGFA is an agency jointly owned by
member cities and local governments
(sometimes with a minority ownership
stake by the national government) whose
primary mission is to pool the borrowing
needs of the local authorities and to
issue bonds in the capital markets. The
proceeds of these bonds are then on-lent
to member cities and local governments.
The process leading to the creation of
an LGFA supports the building of local
creditworthiness, helps to create local
markets, and increases transparency in
local decision-making. It has the potential
to reduce financing costs, transaction
costs, and also risk exposure as a result
of increased diversification. An LGFA is
furthermore a self-regulating entity in that
it prohibits the individual members from
excessive borrowing.
14
Executive Summary
At its best, infrastructure serves
communities at large and embodies public
goods and service. At a larger public policy
level, we also need innovative financing
approaches that are not all about financial
returns, but also address important issues
such as sustainability and social equity.
Many socially responsible financing
approaches have been emerging in recent
years, including green bonds, carbon tax/
cap-and-trade, and social impact bonds.
Green Bonds, Carbon Tax, and Cap-and-
Trade for Sustainability
Cities can issue green bonds to fund
“green” projects that have environmental
benefits, be they related to renewable
energy, low carbon transport, forestry,
or others that mitigate climate change.
Initially used primarily by IFIs and national
governments, the market is fast expanding
to lower levels of government and the
private sector. Gothenburg, Sweden, and
Johannesburg, South Africa, are two cities
that successfully issued green bonds
recently. Between 2013 and 2014, the
market more than tripled from $11 billion
to almost $37 billion, which is projected
to increase even further to $100 billion in
2015. Green bonds offer a number of
benefits that regular bonds do not,
including, for issuers, access to a broader
range of investors and, for investors,
repayments that are tied to the issuer
rather than the “green” project. The green
bond market is still evolving. Because
there currently are no standardized criteria
for what makes a bond “green,” nor strict
requirements for tracking or reporting on
proceeds, concerns of “green-washing”
have been increasing in recent years.
Carbon taxes and cap-and-trade are
also environmentally focused, but they
specifically address pollution and global
warming. The revenues therefrom are
generally used to fund energy, transport,
and other infrastructure projects that
address greenhouse gas emissions and
other related environmental issues.
Although many countries have explored
the implementation of carbon taxes with
much political debate, only a handful of
countries—e.g., India, Japan—have been
able to adopt the tax scheme as a matter
of national policy. The City of Boulder in the
U.S. was the first city to pass a municipal
carbon tax measure in 2006, where tax
proceeds were used for citywide programs
that reduced greenhouse gas emissions.
Regarding cap-and-trade, the European
Union (EU) has operated by far the largest
program thus far, but it has largely been
unsuccessful due to widely fluctuating
auction prices that have crashed on more
than one occasion. Cap-and-trade can be
an effective approach to meeting carbon
emission reduction goals, but collection
of any revenues from these programs is
generally considered to take a long time.
The State of California has been a unique
exception in this regard in that it has been
able to set up a working cap-and trade
auction program. The state has already
collected $2.3 billion in revenue, $250
15
Handbook on Urban Infrastructure Finance
million of which is specifically earmarked
for its high speed rail project.
Social Impact Bonds for Socially
Responsible Investing
A social impact bond (SIB), also referred
to as pay for success or social benefit
bond, is an innovative performance-based
financing tool that enables governments
to pay for only those programs that
deliver. The SIB concept is still new, but
beginning to generate significant interest
from countries like the U.K., U.S., Australia,
and Canada. For cities, SIBs can be a
useful tool to fund municipal programs
that address larger social issues such
as public safety, prison rehabilitation,
homelessness, workforce development,
and preventive healthcare programs. The
use of SIBs to finance “hard” infrastructure
projects have been limited thus far, but
they can potentially be used to finance
social infrastructure projects (e.g., prisons,
public healthcare facilities, affordable
housing). The use of SIBs can also present
an opportunity to unlock a large pool of
funds from philanthropic organizations,
foundations, and other non-profit entities.
They can also help to tap into the large
cash reserve held by major corporations
currently sitting on the sidelines. The Indian
government, for example, recently passed
legislation requiring large companies to
spend at least 2% of their annual profits on
corporate social responsibility. If significant
investments can be unleashed from these
socially responsible investors, SIBs can be a
powerful tool in the infrastructure financing
space with much broader applications
and with performance measures that are
more meaningful to cities—e.g., reduction
in commuting time, reduction in urban
pollution levels, decrease in electricity
“brownout” times, etc.
Conclusions and Afterthoughts
With infrastructure spending needs
almost at 5 percent of gross world product
every year from now to 2030, we are
facing a global infrastructure financing
crisis. This is a big problem that cannot
be solved by a small group of experts and
stakeholders. More than ever, a collective
effort is needed and each stakeholder has
an important role to play.
First and foremost, cities and local
governments need to become more
fiscally self-reliant to the extent feasible.
They also need to become smarter and
financially savvier. This handbook offers
some of the means that can help cities
to do so. Instead of relying primarily on
national governments and private sector
expertise, cities need to be at the forefront
in developing their own infrastructure
financing solutions. They need
to be proactive in involving multiple
stakeholders early on, coming up with
creative and innovative ideas themselves,
designing projects that are bankable, and
marketing them actively and globally.

16
Executive Summary
More than any other governments, cities
have a direct interface with taxpayers
and users. As local infrastructure project
sponsors and service providers, they
also have a better understanding of the
risks involved in delivering infrastructure
projects and services on the ground.
Likewise, when the private sector
is directly involved in financing and
delivering infrastructure facilities and
services, such as in P3 model, they too
have the opportunity to interact closely and
directly with the user community, be they
individuals or businesses. Where there is a
sufficient level of consumerism, together
with the private sector, cities must create
a new infrastructure value paradigm for
users and cultivate the user-paying culture
and users’ willingness to pay. Ultimately,
they need to jointly develop a sustainable
financing strategy with the right set of
incentives that balances tax revenues
with user charges and that address both
economic efficiency and social equity
issues.
National and state governments need to
embrace the global urbanization trend
fully. They need to help in establishing
coordinated inter-urban growth strategies
with specific incentives that are designed to
facilitate and encourage decentralization
and fiscal self-reliance of their cities.
Where appropriate, they should also
explore using cities and urban settings as
venues to test key national infrastructure
financing reform strategies that are more
difficult to implement at the national scale.
In addition, national governments should
explore brownfield recycling as a viable
option to solve their critical infrastructure
funding shortage issue, taking into
consideration lessons learned and best
practices from recent experiences from
Australia.
On the private investor side, direct and
active engagement of public pensions and
other key institutional investors cannot
be stressed enough, especially for major
strategic infrastructure projects that have
larger economic and social impacts. This
view is consistent with the current global
trend where, instead of going through
third-party fund managers, institutional
investors, in particular public pensions,
are intersecting more directly with local
infrastructure financing activities. Shared
liabilities in these situations have proven
to create inherent synergies between
governments and public pensions for
the greater benefit of the public, as
demonstrated by the N-33 Road Project
in the Netherlands discussed in this
handbook. Public pensions are also in a
better position to mitigate some of the
political concerns about private investor
involvement because their interests are
considered to be better aligned with those
of the public.
Collectively, we also need to develop
innovative approaches to encourage
more socially responsible investments. In
particular, we need to identify an effective
means to unleash substantive investments

17
Handbook on Urban Infrastructure Finance
from philanthropic, foundation, and other
non-profit organizations. We also need to
identify ways to raise corporate social
responsibility and unlock some of the
corporate cash reserve that is sitting on
the sidelines. Social impact financing and
crowdfunding are two potential venues
identified in this handbook to unlock these
funds, but many more innovative ideas
need to be developed in the future.
The most critical gap at this juncture,
however, is in “development financing,” i.e.,
financing greenfield and new construction
projects that stimulate new growth and
new developments, which have generally
been perceived to be risky in the financial
community. Some countries, such as
Singapore, have made an effective use
of their sovereign wealth funds in the
past to carry out their critical national
development agenda, but such efforts have
been limited. IFIs, national governments,
and institutional investors need to work
together to streamline this development
finance. More specifically, IFIs and national
governments need to provide short-term
early risk capital, institutional investors
need to commit stable low-cost capital
for the long-term from the get-go (thus
removing the refinancing risks), and
together they need to streamline the
process to establish formal and substantive
development financing. For cities and
local project sponsors, such streamlining
would reduce overall financing costs
significantly.
Finally and most importantly, taxpayers
and users need to recognize that, like
everything else, they are the ones who will
have to pay for infrastructure in the end.
They have to recognize the current reality
that the choices ultimately come down to
these: either they pay taxes or user charges
or they will get no service at all. Taxpayers
and users thus need to be better informed
about the infrastructure financing and
funding pictures of their cities. They also
need to be actively engaged and become
an integral part of the civic decision-making
process in the infrastructure space. Their
inputs will provide essential ingredients
not only in developing efficient and well-
functioning infrastructure facilities that
are sustainable in the long run but, with
the help of emerging technologies, also in
envisioning next generation systems that
are much more robust and agile that are
more aligned with the modern ethos of the
day.

18
Handbook on Urban Infrastructure Finance
1.1 Global Urbanization Context
Urbanization is a well-known phenomenon
that has become an integral part of our
modern culture. The role of cities and their
prominence in the global economy is now
at the center of contemporary dialogues,
both nationally and internationally. Credible
institutions like McKinsey are predicting
that 65 percent of the future growth in
global productivity will come from the
top 600 cities, generating $30 trillion
of new wealth for the world by 2025.2
The top 25 of these cities are mega cities
with over 10 million in population. A majority,
over 400, are mid-size cities with a population
between 200,000 to 10 million spread out
across 57 countries. Of the top 600, 440 of
the cities—the so-called Emerging 440—are
also from the developing world, with over
60 percent from China. Their growth would
be organic in nature, largely propelled
by the inevitable rural to urban migration
inherent in the development process. It is
estimated they would be responsible for
47 percent of future growth, generating
$23 trillion in new global wealth by 2025.
With rapid and highly concentrated growth,
these 600 cities will undoubtedly face
many difficult challenges in the foreseeable
future. For the top 25 mega cities, the risk
of hyper-urbanization and resulting urban
blight is always around the corner. They need
to be sensitive to when the marginal cost of
growth outweighs the marginal benefit. For
the rest, opportunities abound, but they come
with different challenges for different cities.
In developing countries, with organic growth
and latent consumerism on their side, cities
need to become much smarter to get
better access to the global marketplace.
In advanced economies, as organic growth
slows inevitably and the demographics
become more challenging, cities need to
compete harder to maintain their economic
and political legitimacy—often without
much success as we saw in Detroit and
other cities that had to resort to bankruptcy
in recent years. For all, however, foremost
on their agenda should be the need to
balance rapid growth that is economically
driven with sustainable and inclusive
development plans that are ecologically
sound and that ensure social equity for
all citizens, including the urban poor.
1.2 Key Urban Infrastructure
Challenges
Urbanization cannot happen in a vacuum
Cities need to provide basic infrastructure
services—clean water, power and
Chapter 1 Introduction
2 For more detailed discussions on Top 600 cities, see Dobbs et. al. (2012), MGI (2011), MGI (2012), and MGI/MIP (2013).
19
Introduction
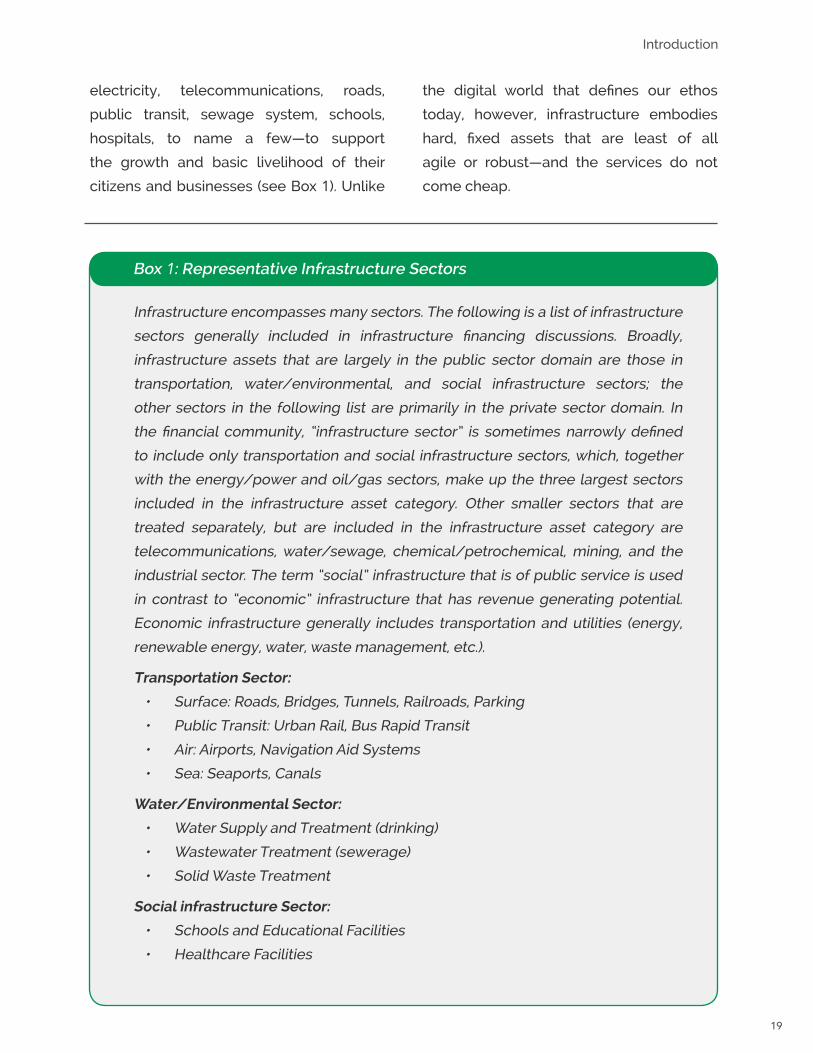
Infrastructure encompasses many sectors. The following is a list of infrastructure
sectors generally included in infrastructure financing discussions. Broadly,
infrastructure assets that are largely in the public sector domain are those in
transportation, water/environmental, and social infrastructure sectors; the
other sectors in the following list are primarily in the private sector domain. In
the financial community, “infrastructure sector” is sometimes narrowly defined
to include only transportation and social infrastructure sectors, which, together
with the energy/power and oil/gas sectors, make up the three largest sectors
included in the infrastructure asset category. Other smaller sectors that are
treated separately, but are included in the infrastructure asset category are
telecommunications, water/sewage, chemical/petrochemical, mining, and the
industrial sector. The term “social” infrastructure that is of public service is used
in contrast to “economic” infrastructure that has revenue generating potential.
Economic infrastructure generally includes transportation and utilities (energy,
renewable energy, water, waste management, etc.).
Transportation Sector:
• Surface: Roads, Bridges, Tunnels, Railroads, Parking
• Public Transit: Urban Rail, Bus Rapid Transit
• Air: Airports, Navigation Aid Systems
• Sea: Seaports, Canals
Water/Environmental Sector:
• Water Supply and Treatment (drinking)
• Wastewater Treatment (sewerage)
• Solid Waste Treatment
Social infrastructure Sector:
• Schools and Educational Facilities
• Healthcare Facilities
Box 1: Representative Infrastructure Sectors
electricity, telecommunications, roads,
public transit, sewage system, schools,
hospitals, to name a few—to support
the growth and basic livelihood of their
citizens and businesses (see Box 1). Unlike
the digital world that defines our ethos
today, however, infrastructure embodies
hard, fixed assets that are least of all
agile or robust—and the services do not
come cheap.
20
Handbook on Urban Infrastructure Finance
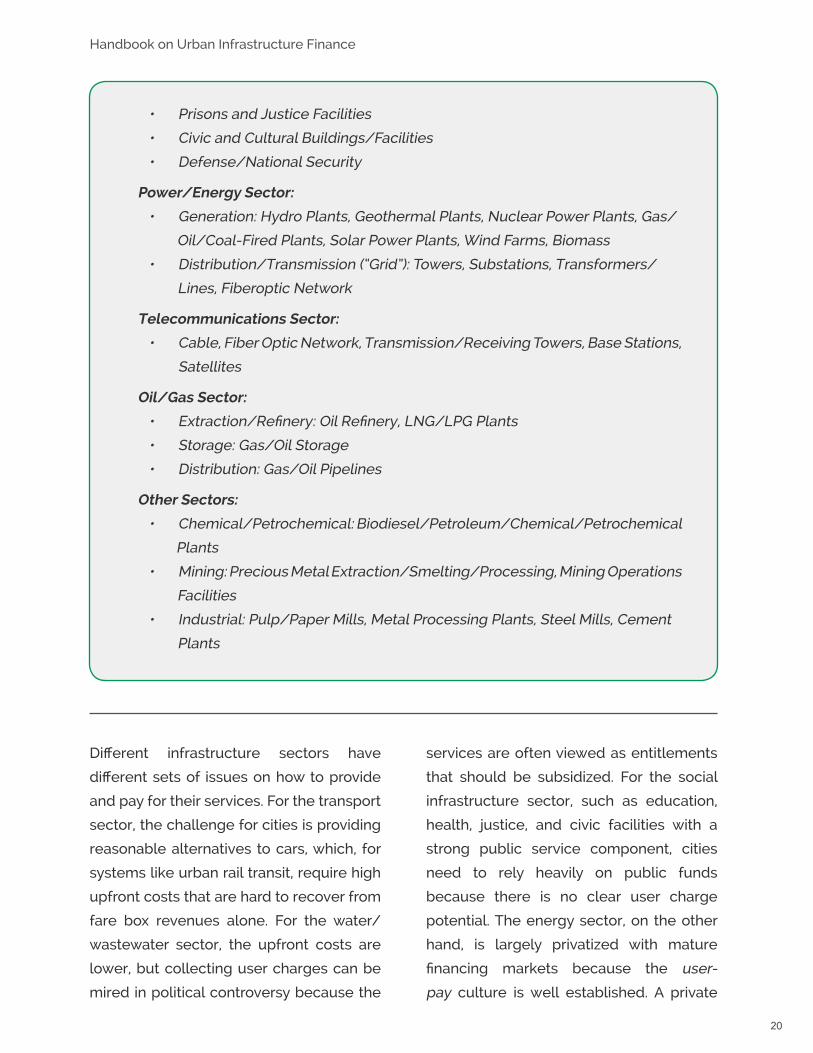
• Prisons and Justice Facilities
• Civic and Cultural Buildings/Facilities
• Defense/National Security
Power/Energy Sector:
• Generation: Hydro Plants, Geothermal Plants, Nuclear Power Plants, Gas/
Oil/Coal-Fired Plants, Solar Power Plants, Wind Farms, Biomass
• Distribution/Transmission (“Grid”): Towers, Substations, Transformers/
Lines, Fiberoptic Network
Telecommunications Sector:
• Cable, Fiber Optic Network, Transmission/Receiving Towers, Base Stations,
Satellites
Oil/Gas Sector:
• Extraction/Refinery: Oil Refinery, LNG/LPG Plants
• Storage: Gas/Oil Storage
• Distribution: Gas/Oil Pipelines
Other Sectors:
• Chemical/Petrochemical: Biodiesel/Petroleum/Chemical/Petrochemical
Plants
• Mining: Precious Metal Extraction/Smelting/Processing, Mining Operations
Facilities
• Industrial: Pulp/Paper Mills, Metal Processing Plants, Steel Mills, Cement
Plants
Different infrastructure sectors have
different sets of issues on how to provide
and pay for their services. For the transport
sector, the challenge for cities is providing
reasonable alternatives to cars, which, for
systems like urban rail transit, require high
upfront costs that are hard to recover from
fare box revenues alone. For the water/
wastewater sector, the upfront costs are
lower, but collecting user charges can be
mired in political controversy because the
services are often viewed as entitlements
that should be subsidized. For the social
infrastructure sector, such as education,
health, justice, and civic facilities with a
strong public service component, cities
need to rely heavily on public funds
because there is no clear user charge
potential. The energy sector, on the other
hand, is largely privatized with mature
financing markets because the user-
pay culture is well established. A private

21
Introduction
operator-government regulator is the
model used successfully in many countries
for this sector.
With rapid urbanization, we are currently
facing a global infrastructure financing
crisis. On the demand side, various sources
indicate that we need between $57 to
$67 trillion in infrastructure spending
worldwide—almost 5 percent of gross world
product every year from now until 2030.3
This amount reflects a 60 percent increase
over and above historical spending levels.
In addition, almost half the total spending
needs represent a funding shortage and
75 percent of the total needs is for cities
and urban areas. Not all of this spending
need is in new construction. In many
developed economies with mature but
aging infrastructure systems, a significant
amount is in operations and maintenance
costs needed to barely maintain current
levels of service.4 An added challenge for
cities is the shifting of funding responsibility
away from national government to local
and regional governments, due in part to
the declining fiscal health of many national
governments in the lingering post-2008
crisis environment.
On the supply side, the irony is there is plenty
of money, especially in the private sector.
There is currently an oversupply of private
capital. There is also an unprecedented
appetite for infrastructure assets from the
private investment community—in part
because the asset class has performed
consistently well in recent years often with
above-par returns. Institutional investors,
such as pension funds that are particularly
suited for infrastructure assets with their
“long-termism,” have been increasing
their allocations steadily in infrastructure
investment in recent years. Especially in
the developing world, international financial
institutions and development banks are also
becoming much more active in financing
infrastructure projects—and, increasingly,
their activities are at sub-sovereign, local
levels. The issue at hand hence is not
a lack of money, but rather insufficient
infrastructure projects in the pipeline to
keep up with the money supply.
The real problem, however, is that the
money is not free. According to a recent
joint study by the Organization for Economic
Co-operation and Development (OECD) and
G20 countries,5 the levers that can reduce
the global infrastructure financing gap not
only include robust financing strategies but,
more importantly, sufficient and sustained
revenue funding sources that can ultimately
pay for the financing.
There is an important distinction between
financing and funding. Falling short of direct
grants or subsidies, infrastructure financing,
3 See MGI/MIP (2013) for more detailed discussion on global infrastructure spending estimates and gap.4 See ASCE (2013) and NSTPRSC (2007) for more detailed discussion on the operations and maintenance needs
for the U.S.5 See WEF (2014) for more detailed description the ongoing efforts by OECD-G20 and the infrastructure and
investment task force office of the B20 Australia 2014. For additional discussion on infrastructure financing
challenges in general, see World Bank (2014).

22
Handbook on Urban Infrastructure Finance
in essence, is raising the high upfront costs
to build the infrastructure when and where
needed by leveraging future revenues that
can repay the upfront costs. For a project to
be financeable now, it needs clear revenue
streams in the future. Financing is the
raising of this upfront capital to expedite the
process. Funding is the revenue streams in
the future to repay the financing. The lack
of projects in the pipeline is due in reality
to many projects that are not financeable
because of the lack of clear revenue
sources. What is in short supply thus is not
financing, but the revenue funding sources.
In the end, these revenues come from
either taxes or user charges, both of which
are generally considered to be in the public
and civic domain.
In addition to smart financing and sufficient
revenue sources, the OECD-G20 study also
identified the need for smart institutions
as the third important lever in reducing
the global infrastructure financing gap.
Infrastructure development is a long-term
endeavor and getting the financing and
revenue streams in place is only part of the
equation. Cities need policies, regulations,
enabling institutions, processes, resources,
and other basic institutional building blocks
that ensure that the financing terms are
honored so that investors can keep coming
back over the long term. Cities must have
institutional know-how to secure the best
financing deal possible. They must also
have management know-how to operate
their infrastructure efficiently over the entire
project lifecycle to ensure their services are
sustainable over the long term.
1.3 Handbook Objective and Organization
In early 2015, New Cities Foundation
launched the Financing Urban
Infrastructure Initiative to address these
and other critical infrastructure financing
issues facing cities today. This handbook
provides a set of practical tools and
guidelines that will help cities become
smarter in the urban infrastructure
finance space. With better knowledge, the
handbook is intended to help cities respond
more effectively and timely to the basic
infrastructure needs of their citizens and
businesses.
Chapter 2 of the handbook provides an
overview of urban infrastructure financing
instruments that are available to cities
today. Chapter 3 discusses various ways
of dealing with the sustainable revenue
funding issues described above. Chapter
4 provides an overview of innovations in
urban infrastructure finance observed
around the world presently. Chapter 5
concludes with afterthoughts that may
have broader policy implications for key
stakeholders, including local and national
governments, IFIs, and the global investment
community. Institutional requisites for cities
in infrastructure financing, the third lever
identified above, are presented in Appendix
A. As smart city concepts are becoming an
integral part of modern cities, Appendix B
provides financing approaches to several
key smart city applications that exist today.

23
Handbook on Urban Infrastructure Finance
2.1 Basic Concepts and Underlying
Issues
Infrastructure financing can be likened
to getting a mortgage to buy a house. In
countries where the housing market is
mature, we can pay a down payment of 20
percent of the total housing cost to get a
mortgage loan of the remaining 80 percent.
The bank, the financier, provides the loan at
a specific interest rate, that is, the financing
cost. The interest rate we pay depends on
our credit history and the down payment
amount, both of which represent the overall
credit risk we present to the bank. The
mortgage from the bank together with the
down payment we raise provide the initial
upfront cost needed to purchase the house
from the seller. Ultimately, however, we are
responsible for paying off the mortgage to
the bank over the term of the loan—and at a
cost commensurate with the interest rate. In
order for us to qualify for the loan, we need to
demonstrate a sufficient source of revenue
for the repayment, which generally comes
from our annual earnings. The amount of
the down payment we must provide also
depends on our earning capacity and our
ability to repay.
Equity and debt are two generic financing
instruments that cities can use to secure
infrastructure financing. In the housing
example, the down payment represents
“equity” financing and the mortgage
loan represents “debt” financing.
Equity financing entitles us to the ownership
of the underlying asset (in this case, the
house) and is the leverage we use to raise
the debt. It is “at-risk” capital we lose if we
default on the debt. In the housing example,
the at-risk down payment can come from
many different sources. It can come from our
own savings or from generous gifts offered
by our family members with no repayment
obligation. From the infrastructure
financing perspective, for cities, such gifts
can be likened to a direct grant or subsidy
from IFIs and/or higher-tier governments,
such as their national or state/provincial
governments. The at-risk down payment
can also come from a third party source,
which sometimes comes with a steep price.
Because it is at-risk capital, from a financing
perspective, the cost of the equity capital
(i.e., the return requirement of the investors
that provide equity capital) is generally much
higher than the cost of the debt capital.
Debt financing is borrowing money without
giving up ownership. It is associated with
clear repayment conditions (“covenants”)
that include, at minimum, paying interest
and the principal at specified dates. From
the investors’ standpoint, compared to
Chapter 2 Urban Infrastructure Financing Instruments

24
Urban Infrastructure Financing Instruments
equity financing, it is much less risky and
the interest rate (i.e., the return expectations
from the debt investors) is generally much
lower. Typically, debt financing can take
the form of either a bank loan or a bond.
A bond, also referred to as “fixed income”
security, is a form of loan or IOU. Instead of
obtaining a loan from a bank, companies
and governments can choose to issue
bonds directly to investors (bond buyers) to
raise the needed capital. They can use the
capital thus raised to finance new projects,
maintain ongoing operations, or refinance
existing debts. The indebted entity (“the
issuer,” i.e., a company or a government
entity) issues a bond that contractually
specifies the interest rate or yield
(“coupon”) that will be paid and the time at
which the loaned funds (“bond principal”)
must be returned (“maturity date”).
Infrastructure can be financed completely
by the public sector or can involve the private
sector. In most countries in the last several
decades, a more traditional approach has
been for the governments to assume full
financing responsibility. Since the late 1980s,
however, the role of the private sector in
infrastructure financing has been increasing
steadily—but not without controversy.
Public sector financing is almost always
100 percent debt financing (i.e., fully
leveraged with no owner equity capital at
risk). In general, the cost of debt financing
by the public sector is significantly lower
than that of the private sector because of
governments’ ability to borrow cheaply.6
The cheap borrowing costs are due largely
to taxes and other public assets that
effectively serve as a collateral on the debt.
Taxpayers can thus be considered de facto
equity holders of government investments.7
Any risks associated with these investments
are ultimately borne by the taxpayers,
but are not reflected in public sector
financing costs per se because they are
considered risk free. Risk free also implies
taxpayers have greater liability—than, say,
private equity holders—because they are
obligated to make debt holders whole.
Private sector financing becomes attractive
when the public sector is fiscally constrained
and facing serious debt capacity issues.
Infrastructure financing by the private
sector is generally perceived to be more
expensive because it almost always
involves at-risk equity capital.8 Unlike public
sector financing, the underlying risks of
investments, represented as a risk premium,
are fully manifested in the financing
cost of both the equity and debt capital.
When private sector financing is involved,
it is also generally combined with the
delivery of infrastructure projects.9
Historically, relative to the public sector,
it has been shown that the private sector
can be much more cost effective in the
6 See McKinsey (2015) for additional discussion on hidden costs of public sector financing. 7 For countries where tax revenues are limited, accumulated sovereign wealth would be beholden to the
investment risks.8 At-risk equity capital represents the private sector’s skin in the game and a safety margin for the debt investors.9 “Delivery” here can be any combination of design, construction, operations, and maintenance.
25
Handbook on Urban Infrastructure Finance
delivery, but their financing can be more
expensive. Private sector participation thus
makes more sense when (a) the overall
cost of providing infrastructure is non-
recourse in nature, i.e., the private sector
takes on most of the risks by not adding any
significant new debt to the public sector’s
balance sheet, and (b) financing costs can
be minimized, especially to the extent that
the cost savings from efficiency gains in
the delivery surpass the higher financing
costs associated with private financing.
Regardless of whether infrastructure
projects are publicly or privately financed,
cities should strive to minimize non-
productive10 financing costs as much as
possible. Reducing financing costs is mostly
about reducing the overall project risks
through proper risk allocations. When the
private sector is involved, it is about sharing
the risks through a proper balancing of
the risks between the private and public
sectors and allocating specific risks to those
parties that are best able to bear them. The
overall project risks can also be reduced
by using various credit enhancement
tools—such as guarantees, insurance
products, or low-interest subordinated
debt—which, for cities, are often provided
by IFIs and/or higher-tier governments on
their behalf. Providing the right incentives
for investors, such as tax-exemptions, can
also reduce financing costs. All of these
basic financing concepts and issues are
further elaborated in the following sections.
2.2 Public Sector Financing
Basic infrastructure financing needs come
from either (1) building new infrastructure
(often referred to as “greenfield”) to
support new demand or (2) operating,
maintaining, and rehabilitating11 existing
infrastructure (often referred to as
“brownfield”12) to support existing demand.
Under the traditional approach where
the public sector is fully responsible for
financing infrastructure projects, the typical
delivery model consists of (a) hiring a design
team to develop design specifications, (b)
procuring a construction team separately
to build according to the specifications, and
(c) once built, taking on the responsibility
of operating and maintaining the facilities
themselves. Under this traditional model,
the operations and maintenance (O&M)
costs are generally embedded within
the public sector’s operating budget.
For design and construction services
provided by outside contractors, the
simplest way for the public sector to pay
for their services is on a pay-as-you go
basis. The pay-as-you-go option does not
require any special financing arrangements
because funding and financing are one
10 Non-productive financing costs are loosely defined here as those transaction and financing costs that are over
and above those that can result from exercising prudent risk allocations.11 Rehabilitation involves major reconstruction of existing facilities and is differentiated from routine maintenance
activities.12 Not to be confused with environmentally contaminated sites.

26
Urban Infrastructure Financing Instruments
and the same. Its use, however, is very
limited—such as, for example, when public
sector funds are plentiful (which is rarely
the case nowadays) or if projects can
be delayed until sufficient public funds
are accumulated (which is not desirable
under the rapid growth scenario). For those
projects that require large upfront capital
expenditures—for example, large-scale
greenfield projects or major rehabilitation
of existing facilities—cities do need special
financing arrangements. Urbanization
often necessitates large upfront capital
expenditures to keep up with the rapid rise
in demand and to provide infrastructure
services when and where needed.
2.2.1 Intergovernmental Transfers from National and State/Provincial Governments
For fully publicly financed projects, first and
foremost, cities can rely on their national
and state/provincial governments for
financing. Financing support from higher
tier governments are intergovernmental
transfers that normally take the form
of direct grants, subsidies, low-interest
loans, and/or credit enhancements.
Although the terms are often used
interchangeably, grants and subsidies
are two different types of funding that do
not have to be repaid. In general, grants
are used for defined purposes whereas
subsidies represent special assistance (e.g.,
tax breaks) over a time period. Relative
to direct grants and subsidies, low-
interest loans (sometimes referred to as
“concessional” or “soft” loans) are used by
national and state/provincial governments
to further leverage their existing resources
while posing less impact on their public
budget. These low-interest loans help cities
get better access to financing by providing
the capital necessary to proceed with a
project (for example, a “gap” financing) or by
reducing the amount of capital borrowed
from other more expensive sources.
Low interest loans are often subordinated
to other loans on the project and also
function as a credit enhancement tool
by reducing the risk borne by other debt
investors. Subordinated loans are ranked
below other debts so that repayments are
made after all other debts are paid off. Cities
can also receive direct credit enhancement
support on a contingent or standby credit
basis. Credit enhancements help reduce
risk to investors and thus allow project
sponsors to borrow at lower interest rates.
These intergovernmental transfers
can be made to cities either as direct
disbursements or through a revolving fund.
National and state/provincial governments,
for example, can treat the direct grants as
an initial capital injection into a revolving
fund, which can then be leveraged to
issue low-interest loans to cities. Loans are
repaid back into the revolving fund, which
enable new loans to be issued for new
recipients allowing the funds to “revolve”
over time. The Clean Water State Revolving
Fund (CWSRF) in the U.S. is a good example
of an established, well-functioning
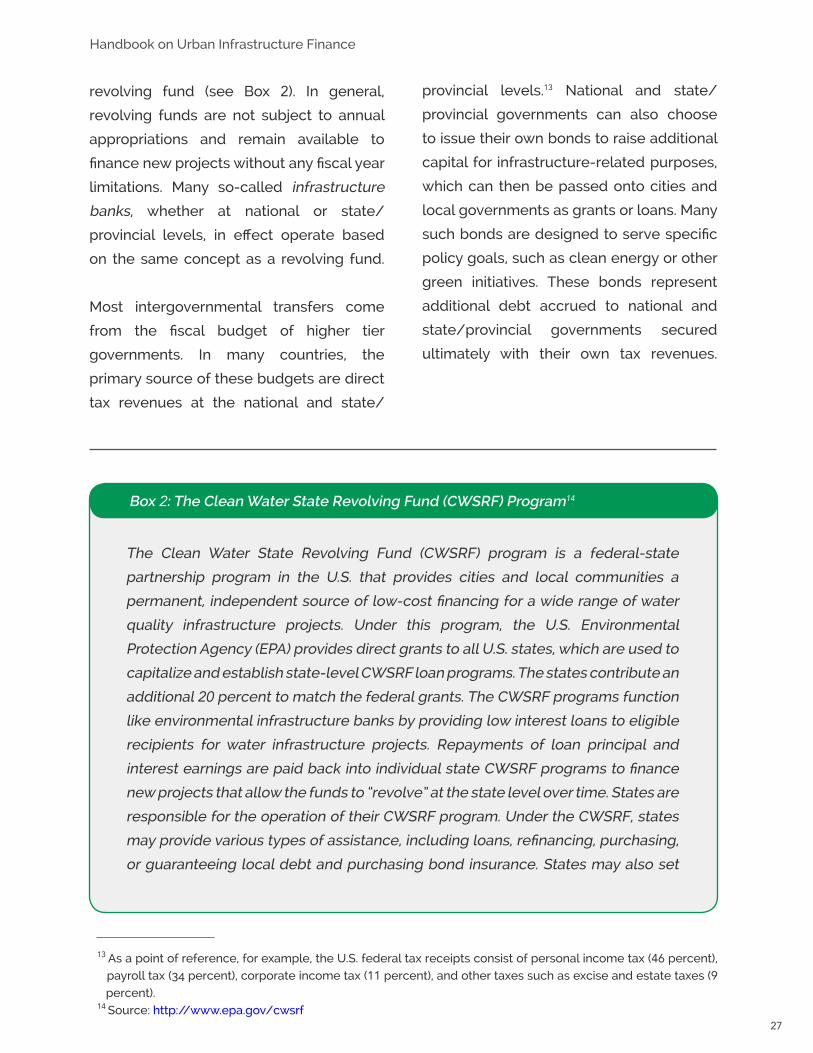
27
Handbook on Urban Infrastructure Finance
revolving fund (see Box 2). In general,
revolving funds are not subject to annual
appropriations and remain available to
finance new projects without any fiscal year
limitations. Many so-called infrastructure
banks, whether at national or state/
provincial levels, in effect operate based
on the same concept as a revolving fund.
Most intergovernmental transfers come
from the fiscal budget of higher tier
governments. In many countries, the
primary source of these budgets are direct
tax revenues at the national and state/
provincial levels.13 National and state/
provincial governments can also choose
to issue their own bonds to raise additional
capital for infrastructure-related purposes,
which can then be passed onto cities and
local governments as grants or loans. Many
such bonds are designed to serve specific
policy goals, such as clean energy or other
green initiatives. These bonds represent
additional debt accrued to national and
state/provincial governments secured
ultimately with their own tax revenues.
The Clean Water State Revolving Fund (CWSRF) program is a federal-state
partnership program in the U.S. that provides cities and local communities a
permanent, independent source of low-cost financing for a wide range of water
quality infrastructure projects. Under this program, the U.S. Environmental
Protection Agency (EPA) provides direct grants to all U.S. states, which are used to
capitalize and establish state-level CWSRF loan programs. The states contribute an
additional 20 percent to match the federal grants. The CWSRF programs function
like environmental infrastructure banks by providing low interest loans to eligible
recipients for water infrastructure projects. Repayments of loan principal and
interest earnings are paid back into individual state CWSRF programs to finance
new projects that allow the funds to “revolve” at the state level over time. States are
responsible for the operation of their CWSRF program. Under the CWSRF, states
may provide various types of assistance, including loans, refinancing, purchasing,
or guaranteeing local debt and purchasing bond insurance. States may also set
13 As a point of reference, for example, the U.S. federal tax receipts consist of personal income tax (46 percent),
payroll tax (34 percent), corporate income tax (11 percent), and other taxes such as excise and estate taxes (9
percent). 14 Source: http://www.epa.gov/cwsrf
Box 2: The Clean Water State Revolving Fund (CWSRF) Program14

28
Urban Infrastructure Financing Instruments
2.2.2 Municipal Financing Instruments15
In conjunction with higher tier government
support, cities can seek their own financing
options. Most city governments around the
world are well informed of the local funding
situations that pertain to grants, subsidies,
intergovernmental transfers, and other
subsidy-like funding. In this handbook, we
focus less on these subsidy-like funding
and more on financing instruments that help
cities become more self-sustainable in the
long run. Because most of these financing
instruments are more developed in the
advanced economies, the case examples
we present in the following tend to weigh
in their favor.
In most countries, together with higher
tier government support, cities commonly
rely on short or long-term notes and
loans to finance their activities, including
infrastructure projects, either through
commercial banks or public banks—e.g.,
landesbanks or sparkassen in Germany or
the Public Works Loan Board in the U.K.—
that serve local needs. One of the most
robust financing instrument available at
city level, however, is municipal bond
financing—variably referred to as municipal
bond, local authority bond, or public (or
public sector issued) bond.
In general, a municipal bond (more simply
muni bond) is issued by a public entity
at a lower level of government than the
sovereign. Potential issuers of muni bonds
can include states/provinces, counties,
cities, redevelopment agencies, districts
(such as school, public utility, or special
purpose or assessment districts), publicly
owned airports or seaports, or any other
non-sovereign governmental entities or
a group of entities.16 Typically, the issuing
entity holds one or more of the following
powers: taxation, eminent domain, or
policing.
The U.S. has by far the largest and the
most mature muni bond markets in the
specific loan terms, including interest rates from zero percent to market rate and
repayment periods of up to 30 years. States have the flexibility to target financial
resources to their specific community and environmental needs. States may also
customize loan terms to meet the needs of small and disadvantaged communities,
or to provide incentives for certain types of projects.
15 For more general discussion about various financing tools available at city level, see OECD (2007b).16 In the U.S., for example, there are over 80,000 issuers of municipal bonds (see http://www.municipalbonds.
com/education/read/67/understanding-bond-ratings/).

29
Handbook on Urban Infrastructure Finance
world.17 For state and local governments
in the U.S., for example, muni bonds have
played a critical role in their ability to self-
finance major infrastructure projects, either
partially or fully. For the bond buyers, the
interest income earned from muni bonds
is exempt from federal tax and, if issued in
the bond buyer’s state of residence, from
state and local taxes as well. These tax
savings—coupled with very low default
rates associated with muni bonds—have
afforded low interest coupon rates on the
bonds, allowing the government issuers
to borrow very cheaply. For state and
local governments, issuing bonds yields
immediate capital they need for timely
construction of infrastructure while their
repayments can be spread out over a long
period.
There are many different types of muni
bonds. They can be short or long-term,
ranging from a few months to 40 years.
Most importantly, muni bonds can vary
depending on how the debt service on
the bond is secured, whether by the full-
faith-and-credit of the issuer or only from
specific project revenues or special tax
assessments. Some require full voter
approval whereas others only require an
establishment of a special agency with
well-defined authority. They can also have
various tax incentives that benefit issuers
and investors differently. Muni bonds also
vary in terms of their prevalent use, whether
by sector or type of projects.
Exhibit 1 provides a summary of major
categories of muni bonds and their key
characteristics. Although the nomenclature
used in Exhibit 1 is U.S.-specific, many
different variations of muni bonds that
exist today or that can be developed in the
future fall into one or more of the following
categories:
General obligation (GO) bond is an all-
purpose debt instrument that cities can use
for general purposes. For infrastructure, GO
bonds can be issued for projects that do
not generate revenues. For investors, they
are backed by the full-faith-and-credit of
the issuer and also often come with the
added security that the issuer can raise
property taxes to assure repayment. This
guarantee is of an unlimited nature. If the
property tax is not paid, the property can
be sold at auction giving the bondholder
a superior claim above mortgages and
other liens and encumbrances. For fiscally
constrained cities, issuing GO bonds to pay
for infrastructure could impact their overall
debt capacity and credit rating, which could
potentially make future borrowing more
difficult and expensive. For these and other
reasons, GO bonds often require full voter
approval.
17 In the U.S., for example, municipal bonds have been around since early 1800s. Its market size in 2014 was
estimated at $3.7 trillion (see http://www.reuters.com/article/us-usa-municipals-idUSKBN0JP24R20141211).

30
Urban Infrastructure Financing Instruments
Revenue bonds have historically been the
key debt instrument available for cities
to finance major infrastructure projects,
especially those that generate revenues.
Revenues generally come from direct
sources, such as tolls on highways or
passenger charges in airports, but can
also come from more indirect sources,
Exhibit 1: Major Municipal Bond Categories and Key Characteristics
Category Debt service secured by
Special requirements
Tax incentive General uses/specific case examples
General Obligation (GO) Bonds
Full faith credit of issuer, unlimited guarantee with tax revenue
Voter approval Tax-exemption on interest income to investors
Any projects that do not generate revenues (e.g., city hall, library, public school, park, prison)
Revenue Bonds
Revenues from service charges; savings from efficiency upgrades
Creation of special entity with authority to levy service charges
Tax-exemption on interest income to investors
Any projects that generate revenues (e.g., toll roads, airports, parking garages, energy efficiency upgrades)
Special or Limited Tax Bonds
Limited to specific tax proceeds (e.g., gas tax, special assessment, incremental sales, ad valorem property tax)
Special enabling legislation
Tax-exemption on interest income to investors
Los Angeles Country Metropolitan Transportation Authority (LA Metro) Measure R (half-cent 30-year incremental sales tax)
Anticipated Notes (e.g., GARVEE bonds)
Anticipated proceeds, e.g., expected future federal grant disbursements
Special enabling legislation; eligible for tax-exempt investors
Tax-exemption on interest income to investors
Grant Anticipation Revenue Vehicle (GARVEE, highways), Grant Anticipation Notes (GAN, transit)
Tax Credit Bonds (e.g., BAB bonds)
Full faith credit of issuer, guaranteed with tax revenue
Special enabling legislation; allows tax-exempt investors
Direct tax credit to investors or direct payment to state/local governments
School modernization program, renewable energy, surface transportation, and other infrastructure projects
Certificates of Participation (COP)
Revenues from leasing facilities or equipment
Creation of special entity with authority to collect lease revenues
Tax-exemption on interest income to investors
Public transit, water/wastewater treatment, prisons, office buildings, parks
31
Handbook on Urban Infrastructure Finance
such as savings that can be derived from
energy efficiency upgrades in schools.18
These revenues are the primary means
to make interest and principal payments
to the bondholders. Often, these bonds
require the creation of a special agency
that is given the authority to levy charges
and fees on facilities and manage them.
Because taxes that secure GO bonds
are less risky than most project revenue
sources that secure revenue bonds, their
yield is higher for investors and thus more
expensive for issuers than GO bonds. When
the government’s fiscal health is sound,
revenue bonds are the best financing
instrument available all around for revenue-
generating infrastructure.19
Special or limited tax bonds are another
debt instrument that can be used
successfully in infrastructure. These bonds
are secured with the proceeds against a
specific tax, which can include gasoline tax,
a special assessment, incremental sales
tax, or ad valorem property tax levied at a
fixed level. Unlike GO bonds with unlimited
tax liability, under these bonds, the issuer is
limited by the specific tax revenue source. In
the U.S., for example, sales tax bonds have
been issued by several local transportation
authorities in recent years, which differed
from a more traditional approach that relied
on transportation revenues. This type of
financing may require special enabling
legislation, which facilitates the direct
disbursement of tax revenues from the
general tax collecting entity to the trustee
of the bond issuance. Such legislation
ensures the proper pledge of the specific
tax revenue sources for infrastructure use.
Anticipation notes can come from different
sources, but their general revenue sources
are anticipated public grants. In the U.S., for
example, the Grant Anticipation Revenue
Vehicle (or GARVEE bond) is a debt
financing instrument that has a pledge of
future federal-aid grant. This type of bond
is authorized to use federal reimbursement
for debt service and related financing costs.
GARVEE bonds generate upfront capital for
major highway projects that state or local
governments may not be able to construct
in a timely manner using traditional pay-
as-you-go funding approaches. Likewise,
Grant Anticipation Notes (GANs), similar to
GARVEE for highways, are used by public
transit agencies in the U.S. to borrow against
future federal grant funding.
Certificates of Participation (COPs) are
tax-exempt bonds issued by a specially
purposed public entity to raise capital
for their equipment or facilities. COPs are
secured by revenues from leasing the
equipment or facilities. The bonds generally
have maturities that match the lease term
of underlying assets (whether equipment
18 New Mexico, for example, schools raised $20 million for energy efficiency upgrades through revenue bonds that
were secured with expected energy savings. See Smart Cities Council (2014) for additional discussion of this
case.19 This is also true for privately financed projects. Revenue generation through user charges is one of the keys to
attracting private sector financing.

32
Urban Infrastructure Financing Instruments
or facilities), which are purchased with
the bond proceeds. In the case of transit
assets such as rolling stocks, for example,
the special purpose entity can then lease
the equipment to one or more local
transit agencies. The underlying lease or
installation sale agreement furnishes the
revenue stream necessary to secure the
bond. The resulting lease payments, often
made in combination with grants and local
matching share, are then passed through
to the bondholders by the special purpose
entity. COPs enable the government to
finance capital projects without technically
issuing long-term debt that are subject to
voter approval and other constitutional and
statutory requirements. Municipalities have
used COPs to pay for transit vehicles, water/
wastewater treatment facilities, prisons,
office buildings, and even parks.
Most muni bonds are tax-exempt bonds.
The yields bondholders earn from tax-
exempt bonds are not subject to federal or
state income taxes. They reduce the issuer’s
borrowing costs because bond buyers are
willing to accept a lower rate of interest
(yield) in exchange for the tax relief. Several
recent studies20 indicate that a tax-exempt
bond subsidy is less efficient because the
foregone federal tax revenues in most cases
exceed the value of the subsidy passed on
to state and local governments.
Tax credit bonds are taxable bonds where
the tax subsidy (of the amount equivalent
to tax-exempt bonds) is disbursed directly,
either to the investors (bond buyers) as a
tax credit or to state/local governments
(issuers/borrowers) as a direct subsidy.
Tax credit bonds are considered more
cost effective because every dollar of
government revenue foregone as a result
of tax subsidy is transferred directly to
borrowers. In the U.S., tax credit bonds
were first authorized in 1997 to subsidize
a school modernization program, but have
since been expanded to support renewable
energy projects and the Hurricane Katrina
recovery program. More recently, as part of
the American Recovery and Reinvestment
Act passed in February 2009, tax credit
bonds called Build American Bonds (BABs)
became available to surface transportation
projects.21 BABs provided wider capital
market access for state/local governments
and became quite successful as an effective
infrastructure financing tool. Being taxable
bonds, they also appealed to investors that
have no in-country tax liability, such as
pension funds and foreign investors, who
do not benefit from the tax-exempt bond
market. For them, BABs provided a better
alternative to taxable corporate bonds with
higher yields, lower default rates, and an
opportunity to diversify.22
20 For more detailed discussions, see U.S. Treasury (2011), CBO/JCT (2009), and JCT (2012).21 BAB bonds were only effective through 2010.22 For more detailed discussions on the comparison between BABs and corporate bonds, see Minred et al. (2014)
and BlackRock (2009).

33
Handbook on Urban Infrastructure Finance
2.2.3 Other Public Sector Financing
Considerations
There are many other public sector debt
financing instruments with varying forms of
bank loans, revolving credits, and variations
of publicly issued bonds, including those
issued at national and state/provincial
levels for the benefit of cities and local
governments. Some financing instruments,
such as industrial revenue bonds or
energy efficiency loans, are public sector
sponsored small-scale debt instruments
that benefit individual businesses or
homeowners directly. Many others, such
as green bonds or social impact bonds,
are innovative variations of publicly issued
bonds intended to have greater impacts
with specific public policy goals in mind, be
they clean power, carbon reduction, energy
efficiency/conservation, or social benefit/
equity concerns. Where municipal bonding
capability does not exist, many cities are
getting together to form a joint financing
authority to issue bonds jointly. For these
and other more innovative urban financing
instruments, more detailed discussion will
be provided in Chapter 4 of this handbook.
Municipal bonds are a robust urban
financing instrument that have proven
to be effective for cities in gaining some
degree of fiscal self-reliance. Although
the municipal bond market is not yet well
developed outside the U.S., many cities
around the world are beginning to explore
it as a viable financing option. Some cities
have already issued bonds, e.g. Ahmedabad
and Bangalore in India and Johannesburg
and Kigali in Africa. Others that are new
to the municipal bond market, however,
must ensure basic building blocks are in
place before they venture into this new
territory. For cities in the developing world,
these building blocks should include,
among others, basic institutional requisites
(discussed in Appendix A), support of one or
more IFIs, establishment of their own credit
rating where possible, and full buy-in of the
higher tier governments. As experienced
recently by the City of Dakar in Senegal,23
the national versus city government
dichotomy can be particularly sensitive
in issuing municipal bonds in some cases.
This sensitivity can stem from politically
driven motivations but, more substantively,
from the real concern that the national
government may ultimately be held
responsible for the city’s bond obligations
in case of default. In this regard, cities must
ensure their infrastructure programs are
fully integrated and coordinated with the
overall infrastructure development plans
at the national and state/provincial levels—
which, surprisingly, is often not the case.
2.3 Private Sector Financing
Although the concept has been around
for a long time, there was a distinct shift
in the mid-1980s towards private sector
participation in infrastructure delivery and
23 See Swope (2015): http://citiscope.org/story/2015/how-dakar-almost-got-its-first-municipal-bond-market

34
Urban Infrastructure Financing Instruments
financing.24 Exhibit 2 provides a current
picture of private sector participation in
the infrastructure space globally and
the corresponding level of maturity
as presented in a recent OECD study.
According to the study, Australia, the U.K.
and Canada have been the leaders in this
space, well ahead of other advanced and
emerging economies. In general, the level
of maturity would have material bearing on
the effectiveness of private sector financing
as a viable and sustainable infrastructure
financing solution.
Generally, private sector participation in
infrastructure can be defined as the act of
reducing the traditional role of government
and increasing the role of private institutions
in providing the necessary infrastructure
to serve the public interest. There are
numerous forms of private participation
in infrastructure with varying financing
implications, but they generally fall into
two major categories: delegation and
divestment.
Source: OECD (2007); includes power and telecomm sectors. Maturity based on country risk (legal, regulatory, political, economic, and financial) and a measure of funded projects as a percentage of GDP.
0
2
4
6
8
10
12
14
1610 20 30 40 50 60 70 80 90
Degree of Maturity
Ran
kin
g
Weak or nascent property rights regime with little private ownership of Infrastructure and/or low number/value of deals
Strong property rights with evolving legal regime for private ownership of infrastructure and/or moderate number/value of deals
Well-established legal regime for private ownership of infrastructure and/or significant number/value of deals
Maturing Matured
Exhibit 2: Degree of Maturity in Private Sector Participation in Infrastructure by Country
24 See, for example, Kessides (2004), Kikeri et. al. (2004), and OECD (2007a) for an overview of global experience
in private sector participation since mid-1980s.
100
Emerging
35
Handbook on Urban Infrastructure Finance
Under delegation, the government
continues to own its infrastructure assets
and play an active oversight role,
but delegates its service delivery
responsibilities, in part or in whole, to the
private sector. There are two basic ways
to delegate: (1) outsourcing of the O&M
responsibilities, which have traditionally
resided with the public sector25 and (2)
public-private partnership (P3) through a
long-term concession where all delivery
responsibilities over the infrastructure
lifecycle is delegated.
Divestment (also referred to as
privatization), is the most complete form
of private sector participation. It involves
the sale of state-owned enterprises and/
or assets to the private sector in whole or
in part. Most divestments are one-time
transactions in which the government
relinquishes its responsibility to the private
sector commensurate with the shares sold.
As shown in Exhibit 3, infrastructure assets
can either be in the public domain where
the public sector is responsible for owning
and operating the assets or in the private
domain where the private sector owns
and operates the assets. For those assets
in the public domain, an infrastructure
project is publicly financed when the
public sector is ultimately responsible for
financing the project undertaking (public
sector financing as discussed in Section
2.2). Although private sector businesses
are involved, outsourcing O&M services or
procuring design/construction contracts in
the traditional delivery described earlier is
publicly financed because the public sector
is responsible for paying for their services/
contracts. An infrastructure project is
privately financed when the private sector
is directly and actively responsible for
financing the projects (private sector
financing), as is the case for P3 and
privatization. The discussion on private
sector financing in this section focuses on
P3 and privatization financing models.
Much of the existing discussion about
infrastructure financing pertains to
infrastructure assets in the private domain.
This handbook focuses primarily on
infrastructure assets that currently belong
in the public domain, where infrastructure
financing challenges are most critical (see
Exhibit 3). It also focuses on infrastructure
financing challenges from the perspective
of cities and local governments that are
facing rapid urbanization and growth.
Although not covered in this handbook, a
brief overview of infrastructure assets in
the private domain is helpful (see Exhibit
3). Infrastructure assets in the private
domain are generally those that belonged
to the public domain previously, but were
transferred to the private sector either by
privatization through direct sales or by P3 through long-term leases or concessions
(dotted line in Exhibit 3). Energy utilities
25 Except for limited circumstances, many governments already contract out most of the design and construction
work to the private sector.
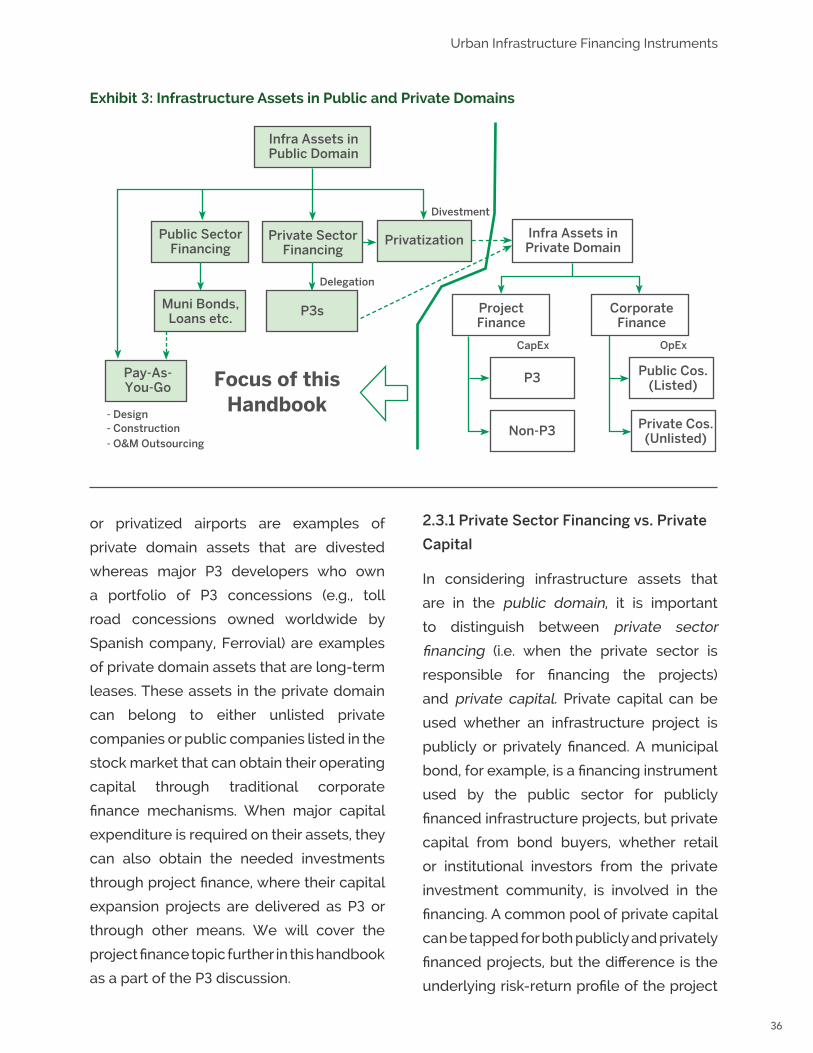
36
Urban Infrastructure Financing Instruments
or privatized airports are examples of
private domain assets that are divested
whereas major P3 developers who own
a portfolio of P3 concessions (e.g., toll
road concessions owned worldwide by
Spanish company, Ferrovial) are examples
of private domain assets that are long-term
leases. These assets in the private domain
can belong to either unlisted private
companies or public companies listed in the
stock market that can obtain their operating
capital through traditional corporate
finance mechanisms. When major capital
expenditure is required on their assets, they
can also obtain the needed investments
through project finance, where their capital
expansion projects are delivered as P3 or
through other means. We will cover the
project finance topic further in this handbook
as a part of the P3 discussion.
2.3.1 Private Sector Financing vs. Private
Capital
In considering infrastructure assets that
are in the public domain, it is important
to distinguish between private sector
financing (i.e. when the private sector is
responsible for financing the projects)
and private capital. Private capital can be
used whether an infrastructure project is
publicly or privately financed. A municipal
bond, for example, is a financing instrument
used by the public sector for publicly
financed infrastructure projects, but private
capital from bond buyers, whether retail
or institutional investors from the private
investment community, is involved in the
financing. A common pool of private capital
can be tapped for both publicly and privately
financed projects, but the difference is the
underlying risk-return profile of the project
Focus of thisHandbook
P3
Non-P3
Public Cos.(Listed)
Private Cos.(Unlisted)
CorporateFinance
ProjectFinance
Infra Assets in Private Domain
PrivatizationPrivate Sector Financing
Public Sector Financing
Muni Bonds,Loans etc.
Pay-As-You-Go
P3s
Infra Assets in Public Domain
Divestment
Delegation
CapEx OpEx
- Design- Construction- O&M Outsourcing
Exhibit 3: Infrastructure Assets in Public and Private Domains
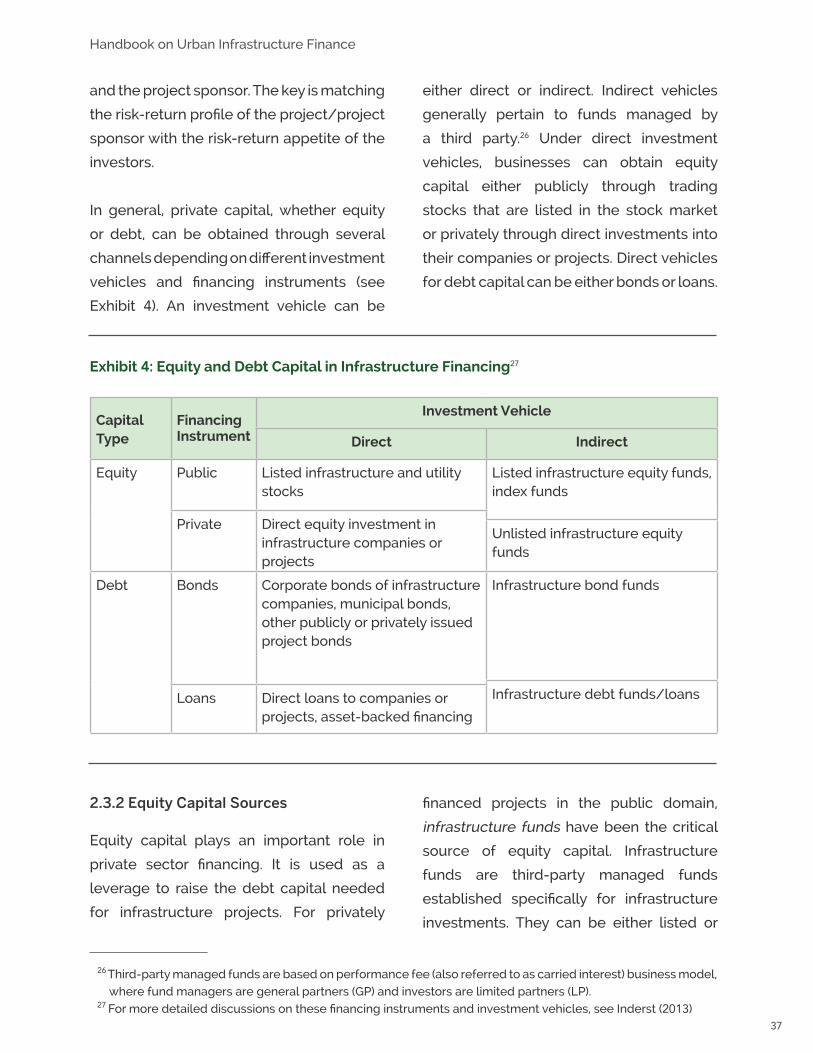
37
Handbook on Urban Infrastructure Finance
and the project sponsor. The key is matching
the risk-return profile of the project/project
sponsor with the risk-return appetite of the
investors.
In general, private capital, whether equity
or debt, can be obtained through several
channels depending on different investment
vehicles and financing instruments (see
Exhibit 4). An investment vehicle can be
either direct or indirect. Indirect vehicles
generally pertain to funds managed by
a third party.26 Under direct investment
vehicles, businesses can obtain equity
capital either publicly through trading
stocks that are listed in the stock market
or privately through direct investments into
their companies or projects. Direct vehicles
for debt capital can be either bonds or loans.
CapitalType
Financing Instrument
Investment Vehicle
Direct Indirect
Equity Public Listed infrastructure and utility stocks
Listed infrastructure equity funds, index funds
Private Direct equity investment in infrastructure companies or projects
Unlisted infrastructure equity funds
Debt Bonds Corporate bonds of infrastructure companies, municipal bonds, other publicly or privately issued project bonds
Infrastructure bond funds
Infrastructure debt funds/loansLoans Direct loans to companies or projects, asset-backed financing
Exhibit 4: Equity and Debt Capital in Infrastructure Financing27
26 Third-party managed funds are based on performance fee (also referred to as carried interest) business model,
where fund managers are general partners (GP) and investors are limited partners (LP).27 For more detailed discussions on these financing instruments and investment vehicles, see Inderst (2013)
2.3.2 Equity Capital Sources
Equity capital plays an important role in
private sector financing. It is used as a
leverage to raise the debt capital needed
for infrastructure projects. For privately
financed projects in the public domain,
infrastructure funds have been the critical
source of equity capital. Infrastructure
funds are third-party managed funds
established specifically for infrastructure
investments. They can be either listed or

38
Urban Infrastructure Financing Instruments
Exhibit 5: Top 20 Infrastructure Funds for Equity Capital
Rank Infrastructure Fund Headquarters5-Year Capital
Raised ($B)
1 Macquarie Infrastructure and Real Assets Australia $27.42 Brookfield Asset Management Canada $12.93 Global Infrastructure Partners United States $10.84 Energy Capital Partners United States $9.95 IFM Investors Australia $8.26 Borealis Infrastructure Canada $6.97 Colonial First State Global Asset Management Australia $6.48 Korea Infrastructure Investments South Korea $5.39 Caixa Economica Federal Brazil $4.9
10 InfraRed Capital Partners United Kingdom $4.611 Alinda Capital Partners United States $4.412 Antin Infrastructure Partners France $4.213 First Reserve United States $3.814 Goldman Sachs Infrastructure Investment Group United States $3.715 EnerVest United States $3.516 Hastings Fund Management Australia $3.317 Kohlberg Kravis Roberts (KKR) United States $3.318 Meridiam Infrastructure France $2.919 Ardian France $2.920 EQT Sweden $2.6
unlisted and have dedicated staff that has
the expertise and knowledge in investing
in infrastructure assets. Especially since
the 2008 financial crisis, these funds have
enjoyed significant success in raising capital
from the global investment community. As
a point of reference, Exhibit 5 provides the
top 20 infrastructure funds that exist today
ranked in the order of capital raised over the
last 5-year period.
By some measure, it is estimated that
infrastructure funds collectively have raised
about $300 billion of equity capital over the
decade ending in 2014.28 Equity capital is
typically leveraged to secure larger debt
28 See Poole (2015) for more detailed discussion on infrastructure equity and debt funds and their recent trends.
Source: Infrastructure Investor, November 2014.

39
Handbook on Urban Infrastructure Finance
financing. As an example, on a privately
financed infrastructure project in the public
domain, equity capital normally represents
about 20 to 30 percent of the overall project
cost (depending on the perceived risks),
which is leveraged to raise the remaining
70 to 80 percent of the cost as debt capital.
Based on this leveraging, the $300 billion in
equity capital could potentially mean $1 to
$1.5 trillion of financing available to support
infrastructure projects. Historically, these
infrastructure funds have shown strong
interest in projects that are in energy and
power, transportation, water and waste
management, and renewable energy
sectors.
The sources of equity capital for
infrastructure funds are largely institutional
investors. Institutional investors are
long-term asset owners that include, for
example, pension funds, sovereign wealth
funds, insurance companies, endowments,
and family offices. According to the latest
estimate by OECD, they oversee over $100
trillion in investment assets globally.29
Institutional investors provide long-term
patient capital. Their risk-return appetite
matches well with the risk-return profile
of infrastructure assets—i.e., long-term
low-risk investment opportunities with a
reasonable return and stable cash flow
that provides an inflation hedge. For
these investors, other characteristics of
infrastructure assets are also in their favor
because of the size of the assets they
manage and their ability to engage outside
expertise. For example, the infrastructure
market is monopolistic and there are
high barriers to entry due to the very high
initial fixed cost and significant expertise
requirements, which many investors cannot
meet. Infrastructure assets are considered
hybrid in nature providing natural
opportunities to diversify within the asset
class. For example, the infrastructure asset
class currently includes many different
assets with traits that can be aligned with
fixed income (e.g., utility), real estate (e.g.,
greenfield project), and private equity (e.g.,
airport).
Despite these aligned interests, the level of
investment in infrastructure by institutional
investors has been slow in growing.
According to OECD, large pension funds
worldwide currently allocate less than one
percent of their portfolios in infrastructure
on average.30 Nevertheless, several
Australian and Canadian pension funds
more experienced in the infrastructure
space allocate as much as 5 percent in
infrastructure—and their allocations are
growing. The asset class is also getting
more visibility. Over half of institutional
investors now have separate allocations for
infrastructure. A recent study by S&P Rating
Service31 highlights the growing trend and
critical role of institutional investors in
29 See, for example, Swiss Re (2014) and Wyman (2013) for discussion on infrastructure investing by insurance
companies.30 For a recent survey of pension funds and their infrastructure investments, see OECD (2011).31 See Poole (2015) for additional discussion on S&P study.

40
Urban Infrastructure Financing Instruments
helping to close the global infrastructure
financing gap by as much as 20 percent.
As equity investors, both institutional
investors and infrastructure funds have
access to different infrastructure investment
opportunities. Exhibit 6 depicts a somewhat
simplified version of how they access
different infrastructure assets and how their
equity capitals flow in the infrastructure
investment space in general. For cities and
local governments, their direct interface
with these sources of equity capital would
be through infrastructure projects that are
privately financed.
Institutional investors are the primary
originators of infrastructure equity capital.
Traditionally, they have relied primarily on
the expertise of their fund managers to
invest in infrastructure assets. On behalf
of institutional investors, infrastructure
equity funds (both listed and unlisted)
have provided direct equity capital to
infrastructure projects that are privately
financed.
Infrastructure Projects (e.g, P3)
Infrastructure Equity Funds (Listed/Unlisted)
Infrastructure Stocks/Securities (Listed/Unlisted)
Infrastructure Companies (Public/Private)
Broad Core Pure Play
- Engineering & Construction- Timber- Diversified Operations- Power Generation- Shipping
- Infrastructure Services- Intergrated Utilities- Rail- Diversified Utilities- Diversified Infrastructure
- Power Transmission/ Distribution- Oil/Gas Storage/ Transport- Toll Roads- Seaports- Airports- Communications- Water
Exhibit 6: Equity Capital Flow from Institutional Investors and Infrastructure Funds
Institutional Investors
- Pension Funds- SWFs- Insurance Cos- Endowments- Family Office- etc.

41
Handbook on Urban Infrastructure Finance
The long-term interest of institutional
investors, however, has sometimes been
at odds with the more short-term, high
turnover, and high return interest of their
fund managers. As shown by the dotted line
in Exhibit 6, for those institutional investors
with high infrastructure allocations, more
have been shifting to direct investing in
infrastructure projects through in-sourcing
and building their own in-house capabilities
as opposed to relying on fund managers.32
For others, as their infrastructure allocations
increase, more are choosing to co-invest by
collaborating directly with their peers using
a common investment platform.33 For cities
and public sector sponsors, these trends
essentially mean more direct interface with
institutional investors, which help to reduce
overall financing costs. When institutions
such as public pension funds are involved,
these trends help mitigate political
resistance to private sector involvement.
A significant part of institutional investor
capital also gets invested into infrastructure
securities through their fund managers
for infrastructure companies (public
or private) whose primary business is
infrastructure. These companies and
securities fall into three basic categories:
broad (e.g., construction and engineering
companies), core (e.g., utilities), and pure
play (e.g., toll roads, airports, and seaports).34
Collectively representing about $3 trillion in
market capitalization, Exhibit 6 shows those
companies and securities that are listed
and publicly traded.
Investing in infrastructure projects provides
direct financing for designing, building,
operating and maintaining infrastructure
facilities that enable cities to provide basic
infrastructure services for their citizens
and businesses. Investing in infrastructure
securities provides financing of ongoing
operations and management of companies
that are in the infrastructure business, be
they construction companies, regulated
utilities, or privatized airports.
From the perspective of cities and local
governments, investments in infrastructure
securities can represent direct and indirect
benefits for their citizens and businesses in
providing needed services. For privatized
airports and regulated utilities, for example,
although the assets belong in the private
domain, the capital raised through the
infrastructure securities market can be
used directly to improve their services—
whether for day-to-day operations or major
capital expansions—thus providing direct
32 See Knight et. al. (2013) for more information on in-sourcing.33 For example, Borealis, ranked 6th in Exhibit 5, is an infrastructure fund established in 1999 in Canada to invest
in infrastructure assets on behalf of OMERS, one of Canada’s largest pension plans. OMERS investment strategy
since 2003 has been to increase its infrastructure allocation to 15 percent. In 2012, Borealis helped to form a
new infrastructure investment platform called the Global Strategic Investment Alliance (GSIA) to bring together
like-minded, long term, global institutional investors. GSIA have been able to raise $12.8 billion in 2014, the
largest single amount raised that year. 34 See Mansour et. al. (2006, 2007) and RREEF (2011) for more discussion on various infrastructure security types.

42
Urban Infrastructure Financing Instruments
benefits to local citizens and businesses.
For construction companies, on the other
hand, the capital raised can be used as their
own working capital to minimize potential
default situations on their construction
work, thereby maximizing the probability of
successful construction completions and
providing indirect benefits.
2.3.3 Debt Capital Sources
Until recently, the long-term debt capital
for private sector financing in the public
infrastructure domain was secured through
syndicated commercial bank loans or
issuing project bonds through private
placements (see Exhibit 7).35 For brownfield
projects, long-term debt capital was
generally secured at project inception. For
greenfield projects, to get the best long-
term financing possible, construction work
and the ramp-up phase were financed
first through short- to medium-term loans
(sometimes referred to as mini-perms) and
subsequently refinanced and replaced
with cheaper long-term debt capital for
the project after early phase risks were
eliminated. In addition, there were a handful
of infrastructure funds that specialized
in debt, targeting sub-investment grade
assets and taking up the slack left by the
demise of monoline insurance companies.36
Using institutional investors as the primary
capital source, these debt funds tried to
exploit the lower default rates and higher
recovery rates of infrastructure debts
relative to corporate bonds and private
loans in the non-infrastructure space.
Risk, Yield
Leveraged Loans(Institutional Funds)
Construction Loans/‘‘Mini-Perms’’
(Banks)
Traditional Project Finance(Banks)
Private Placements/Bonds(Insurance Cos)
Tenor
Hi Risk/HiYield(Sub-InvestGrade)
Lo Risk/LoYield(InvestGrade)
Exhibit 7: Infrastructure Debt Space, Privately Financed Projects Funds
35 See, for example, EPEC (2012) for issuing project bonds for P3 projects in Europe.36 Monoline insurers who provided guarantees on municipal bonds’ debt obligations that impact the bond ratings
collapsed with the 2007 financial crisis because of their investments in subprime mortgages and other derivative
markets. See, for example, WFAF (2008) for more detailed discussion.
Short to Medium Term(3 to 8 Years)
Long Term(8 to 30 Years)
43
Handbook on Urban Infrastructure Finance
The 2008 global financial crisis triggered
major reforms in international financial
regulatory standards—e.g., Basel II/III
Accord and Solvency II Directive—resulting
in more stringent liquidity and leveraging
requirements for banking and insurance
industries. For infrastructure financing, these
reforms have left a void in the long-term
debt market. Banks have been less willing
to provide long-term lending and insurance
companies’ desire for investments that tie
up their capital for the long term has also
been dwindling.
As a result, a new infrastructure debt
market took off in 2012. There has been
increasing interest from institutional
investors, especially pension funds and
sovereign wealth funds, to fill the void
left by commercial banks and insurance
companies in the low-risk, long-term
infrastructure debt space. In addition,
they have been accessing the debt space
through infrastructure debt funds. Since
2012, the number of infrastructure debt
funds has been increasing significantly
with several major ones emerging in 2014.
Products offered in the debt fund space
have also been wide ranging, from bond-
oriented to subordinated debt, with varying
terms and risk-return profiles. Whether
through managed debt funds or working
jointly with banks and insurance companies,
institutional investors are positioned
to be important players in the overall
infrastructure debt space.
2.3.4 Public-Private Partnership Models
The term “public-private partnership” is
often used to describe many different forms
of partnership between the public and
the private sector, whether contractually
or otherwise. Outsourcing of municipal
services described earlier, for example, is
sometimes considered as a form of public-
private partnership. Outsourcing is often
used by government to contract with private
firms, sometimes in a deliberate effort to
introduce competition and reduce the costs
of ongoing O&M services such as solid-
waste collection, street repair and cleaning,
snow removal, tree maintenance, day-to-
day operations of prisons, etc.37 Managed
competition is an alternative to outsourcing
and sometimes used by cities as a means
to introduce competition by encouraging
government’s own workers to compete
for contracts with the private sector.
Under the threat of private participation,
managed competition has proven to be a
powerful incentive for public agencies to
improve their performance. Regardless,
it is the public sector that finances and
pays for these outsourced and managed
competition contracts.
Public-private partnerships or P3
discussed in this section is a specific
infrastructure delivery model where the
primary financing responsibility resides
with the private sector. Under P3, the
government awards a private entity (called
a concessionaire) an exclusive right in the
37 In the U.S., for example, local governments outsource well above a quarter of their ongoing O&M services to
the private sector.

44
Urban Infrastructure Financing Instruments
form of a long-term franchise or a lease
(called a concession) to provide specific
infrastructure services to the public.
The private sector arranges financing in
exchange for the use of the public property
(for example, airwaves, airspace, streets,
right-of-ways, or underground) for their
own commercial purposes (respectively,
broadcasting, airline flights, bus/taxi
services, tolled roads, or utilities such as
electricity, water, gas, or telephone).
Because a P3 preplanning and procurement
process can be long, complex, and costly
regardless of project size, the private
sector’s preference for P3 is generally for
large-scale, capital intensive, and long-term
projects. In addition to financing, P3 offers a
number of advantages over the traditional
approach to delivering infrastructure.38
First and foremost, in addition to direct
financing, the greatest value P3 brings is
the opportunities for the public sector to
transfer some or all of the risks, financial or
otherwise, inherent in infrastructure projects
to the private sector. It offers opportunities
for innovations and for achieving cost and
operational efficiencies over the entire
project lifecycle. It also enables accelerated
implementation of critical infrastructure
projects and bundling of multiple projects
across multiple jurisdictions to gain
economies of scale.
In general, the private sector can take
on some or all of the risks associated
with designing (D), building (B), financing
(F), operating (O) and/or maintaining (M)
infrastructure facilities in exchange for a
future revenue stream. Many P3 models
exist that represent different combinations
of D, B, F, O, and M. This handbook focuses
on those where the private sector takes on
a significant role in financing (F).
P3 models can be categorized into three
basic types: (1) demand-risk, (2) availability
payment (AP), and (3) shadow-price (or
more specifically to the U.K. market, Private
Finance Initiative or PFI). Broadly, the private
sector takes on the brunt of the overall
financial risks under the demand risk model,
whereas the public sector has the ultimate
financial liability in the long run under the
AP and PFI models. The demand-risk model
(also referred to as revenue-risk model)
represents the case where P3 financing is
secured with the future revenue streams
from user charges and where the private
concessionaire takes on the overall financial
risks associated with potential fluctuations
in future user demand. Demand-risk P3s
are typically used when there is sufficient
revenue stream from user charges—and
where, preferably, a user-pay culture
already exists.
From the investor standpoint, because
the private concessionaire takes on the
demand—and hence future revenue—risk,
the overall project risk is perceived to be
high. For this reason, the equity requirement
38 See, for example ACG (2007) for a comparison between P3 and traditional delivery approach in Australia.
45
Handbook on Urban Infrastructure Finance
on a demand risk model (i.e., the private
concessionaire’s skin in the game) is
significantly higher (say, 30 to 40 percent of
overall project cost) than that of AP or PFI
model (say, around 15 to 20 percent). As a
result, the overall financing costs are higher
under this model. It is important to note,
however, because most of the financial risks
are borne by the private concessionaire,
very little is passed on to the public sector
as additional financial obligations. Most
private concessionaires shy away from
participating in demand risk P3 because of
the higher risks, while those few39 who are
experienced in risk management prefer it
because of their high-return potential.
Compared to demand-risk, the AP or PFI P3
model is less risky and the overall financing
costs are generally cheaper because the
public sector effectively takes on the long-
term financial liability. Under AP and PFI,
the private concessionaire provides the
P3 financing initially, but it is secured with
annual payment commitments from the
public sector over the concession term.
These payments can come from either
taxes or user charges, but the long-term
financial liability effectively resides with the
public sector. For both, the annual payments
by the government are conditional upon
the private sector meeting pre-specified
performance requirements. For AP,
the payments are conditional upon the
availability of facilities at pre-agreed
service levels whereas, for PFI, they are
conditional upon achieving a pre-specified
user demand level.
Because of the private sector’s reluctance
to take on the higher risks under a new
market situation, the demand-risk model
never really took off in the early P3 years.
PFI, for example, has been the predominant
P3 model used in the U.K. and many other
countries for a long time.40 However, the
AP and PFI P3 liabilities are no longer
considered non-recourse and they are
seeping into the public sector’s balance
sheets. In several U.S. states such as
Florida and North Carolina, for example,
the AP P3 liabilities now count against the
states’ bonding capacity and are treated
no differently than direct public debt.
Many governments are also questioning
the merits of the AP or PFI P3 model in
its raw form in solving their fundamental
infrastructure funding and debt capacity
problems.
Whether it is the demand-risk, AP, or PFI
model, the basic financing instrument
underlying P3 is one of project finance,
where the financing for the long-term P3
39 In the U.S., for example, there has been general preference for AP-based P3s by P3 developers in recent
years because of their fixed-income like characteristics. Cintra, one of the largest P3 developers of transport
infrastructure in the world whose parent organization is Ferrovial, however, has been targeting demand-
risk P3 projects and committing high at-risk capital (as much as 40% in some cases) with innovative financing
approaches. Such at-risk commitment has often been matched by the public sector with large subordinated
low-interest federal loans and guarantees from the local government sponsors.40 See, for example, HMT (2003, 2006, 2008, 2011) for PFI experience in the U.K.
46
Urban Infrastructure Financing Instruments
concession is arranged through a special
purpose vehicle (SPV). As assured by the
underlying SPV structure, the project
finance is based on a non-recourse or
limited recourse financing structure, where
the debt and equity capitals used to finance
the project are secured only by the cash
flow generated by the project rather than
the balance sheets of its project owners
and investors. The financial obligations of
the SPV are thus walled off from general
assets of the project owners and investors.
The expected rate of return on P3 project
investments is generally determined
through the competitive P3 procurement
bid practice prevalent in the industry. In
general, significant efforts are made by
the public sector sponsors throughout the
procurement process to determine the
merits of P3 as compared to traditional
and other alternative financing/delivery
methods. By far, the most common
analytical approach used to compare
various alternatives is Value-for-Money
(VfM). VfM, a globally accepted decision
support tool used by the industry, allows
the comparative analyses based on net
present value of different alternatives.
P3 project finance can be quite complex
with many different investors and
stakeholders. For a better understanding,
Exhibit 8 presents notionally the basic
structure of SPVs, how equity and debt
capital flow into the SPV, and the role
of various investors and stakeholders in
securing the overall financing. The diagram
is also intended to help demonstrate
the basic private sector financing and P3
concepts described above.
A P3 project is carried out by a private
concessionaire through an SPV. This SPV
can be made up of two or more private
companies that are “equity owners” of the
project. These owners have an inherent
stake in the project and often include
companies that specialize in construction,
operation, and/or financing.41 Through
the SPV, these companies own the long-
term concession and they are responsible
for securing the at-risk equity finance
(shown notionally in Exhibit 8 as 20 percent
of the total project costs). Each owner’s
equity contribution would determine
their respective ownership levels (shown
notionally here as 10, 45, and 45 percent,
respectively, for the construction contractor,
operator and financier). These equity
owners (collectively, the P3 concessionaire)
can choose to provide their share of equity
capital either from their own sources or
seek equity financing from, for example,
infrastructure funds.
41 Over the course of the project lifecycle, the equity ownership structure generally changes, especially around
key project milestones. During construction and ramp-up phases, there may be strong construction contractor
participation, which may be replaced by strong operator participation during initial operations phase. Over the
long run once the operations are stabilized, long-term investors such as pension funds may step in to relieve
the remaining equity shares from operators and contractors.

47
Handbook on Urban Infrastructure Finance
With this equity as a collateral, and using
the SPV and expected cash flow from
the P3 project, the concessionaire can
then secure the remaining 80 percent as
debt. The debt financing can be secured
generally by issuing long-term bonds in the
capital market through private placements
(typically used for the AP or PFI P3 model) or
getting syndicated loans from commercial
banks (usually used for the demand-risk
P3 model). Managed infrastructure funds
play an increasingly important role and
the concessionaire can look to them as a
potential source of debt financing as well.
When the project does not have sufficient
revenues sources, IFIs and/or governments
can provide additional financial support,
which is shown in Exhibit 8 as a low-interest
loan (notionally 30 percent) subordinated to
other senior debt on the project. These loans
can be further supplemented by additional
public sector support to fill the remaining
financing gap. In Exhibit 8, this gap financing
is shown as a direct grant (notionally 10 percent) coming from the government
sponsor, which could be the city itself.
Investor returns expectations (or financing
costs) are different depending on the
National/State or
IFIs
InstitutionalInvestors
P3 Concession(SPV)
Grant (10%)Debt/Subord. (30%)Credit Enhancements
Equity Finance (20%)
Contractor Operator Financier
Debt Finance/Senior (40%)
Bonds Syndicated Bank Loan
OR
ProjectSponsor
(City)
Commer.Banks
Infra.Fund
(Debt)Debt
CapitalMarket
InfraFund
(Equity)
Infrastructure Securities
EnergyUtility
RailroadCompany
TollroadOperator
Eng/ConstCompany etc.
Legend
P3 Financing
P3 Stakeholder
5%Interest rate/ expected return
5-6%
~2-3% 0%
~12-14% (Construct)~10-12% (Ramp-up)~8-10% (Operations)
- Pension Funds- SWFs- Insurance Cos.- Private Equity Funds- Endowments- Foundations- Family Offices, etc.
Infra asset owners/operators/service provider ($3T for listed)
Exhibit 8: P3 SPV Structure and Capital Flow (Notional)
(10%) (45%) (45%)

48
Urban Infrastructure Financing Instruments
underlying risks. The percentages shown in
italics in Exhibit 8 represent nominal return/
interest rates intended to demonstrate
notionally the relative scale. Because
of its risky nature, equity capital is more
expensive compared to debt, and there
is a significant difference before and after
construction because of the perceived
risk (shown notionally as 12-14 percent
for construction, 10-12 percent during the
ramp-up phase following the construction,
and 8-10 percent once operations are
stabilized). Greenfield projects are often
refinanced after construction is complete
with cheaper long-term financing for this
reason.
In the end, most of the money is sourced
from institutional investors. They invest in
managed infrastructure funds (equity and
debt), capital markets, commercial banks,
and, increasingly, invest directly into the
projects as an equity owner. For cities, a
basic understanding of these investors and
their risk-return expectations would help
them navigate the complex private sector
financing space. It would also help in better
preparing and designing bankable projects.
2.3.5 Privatization through Divestments
Privatization, also referred to as asset sale
or asset transfer, is another way where
private sector financing can play a critical
role in providing basic infrastructure
services. Privatization is generally achieved
by divesting—i.e., transfer of the ownership
by selling—fully operating infrastructure
assets that are in the public domain to the
private sector. There are four common ways
for privatization to take place:
• One-time private sale to a single
buyer or a consortium of buyers
(also referred to as a trade sale)
• Issuing and selling shares publicly
in the stock market through an IPO
(also referred to as flotation)
• Selling to employees42
• Selling to users or customers43
The most recent wave of privatization of
public infrastructure started as early as the
mid-1980s. The real momentum, however,
was not built up until the mid-1990s when
the EU Convergence Criteria imposed a
significant limit on the public debt carried
by its member countries. This limit triggered
many governments to target and sell off
their infrastructure assets and remove
them from their balance sheets as quickly
as possible.44 This trend spread outside
the EU in countries such as Australia and
Canada. In part because initial motivations
were driven by these short-term fixes,
privatization transactions have often been
mired in political controversy. Selling to
42 As was the case for the sale of Associated British Ports (ABP) in the U.K. in the early 1980s
under the Thatcher administration, where 3 percent of the total shares were sold to their employees and the
remaining shares were sold to the public through the stock market. 43 As is often done with rural electricity or water systems sold to a cooperative of local users.44 See, for example, Baird et. al. (2007) for divestments of seaport assets in U.K. and the resulting impacts.

49
Handbook on Urban Infrastructure Finance
employees or users/customers are options
that can sometimes mitigate the political
sensitivity.
Privatization is essentially a brownfield
transaction where the public sector receives
capital from the sales proceeds of existing
facilities. Unlike P3, there are no repayment
obligations associated with such capital.
From a purely financing perspective, these
proceeds can be considered as close to free
unencumbered money as possible for the
public sector with no repayment burdens
attached.45 Privatization transactions have
the dual benefit of the private sector taking
over all the upkeep associated with the
existing facilities and providing additional
capital for the public sector’s disposal. In
general, the size of the proceeds tend to be
quite high and, coupled with no repayment
obligations, privatization is one of few
potential options that can begin to address
the sheer magnitude of the infrastructure
funding gap discussed earlier.
For these and other reasons, there has been
a significant increase in privatization
activities in recent years, particularly in
Australia. Australia has enjoyed more
success with privatization with less
political controversy in part because the
government has been able to engage
major public pension funds on the private
investor side. The government has been
able to establish a clear objective of using
the proceeds from brownfield privatization
to fund new greenfield projects (referred
to as “brownfield recycling”). The use
of brownfield recycling as a potential
infrastructure funding revenue source is
discussed in Chapter 3 as part of the funding
discussion.
Often, the first step in privatization involves
corporatization where, from fully opera-
ting infrastructure assets (say, a major air-
port), the operations and/or assets to be
privatized (say, a terminal building within
the airport) are separated out and an inde-
pendent state-owned enterprise (SOE) is
established in the process with a separate
balance sheet. Privatization is the sale of
such an SOE in part or in whole. In the eyes
of the private investment community, this
step allows transparency in the financial
and operational performance of the SOE to
be privatized. In many countries, there are
already well-established SOEs in the public
infrastructure domain under government
oversight with proven performance track
records. These SOEs represent prime can-
didates for potential privatization.
The first step in privatization can also
involve the decoupling of vertically
integrated sectors such as utilities or
railroads. For energy utilities, for example,
distribution and retailing are often privatized
first by decoupling from power generation
(power stations/plants) and transmission.
45 One obvious caveat is the loss of future revenues if privatization was carried out for assets that are already
generating revenues for the public sector, such as utilities. The privatization proceeds have often exceeded
the government’s expected retention value and, when coupled with the private sector efficiency gains, they
have more often than not made up for the potential revenue loss.

50
Urban Infrastructure Financing Instruments
Likewise, for water utilities, distribution and
retailing (pipeline network) are generally
decoupled from bulk water supply and
treatment (reservoirs, water/wastewater
treatment plants) with different privatization
approaches. For railroads, decoupling
“above” rail assets (trains) from “below” rail
assets (tracks) enables the privatization of
above-rail train operations.
Decoupling generally helps to separate
out those operations/assets that are more
amenable to competition (and thus benefit
from privatization) from those that are more
monopolistic in nature better left in public
hands. The amenability is also related
to user proximity and the ability to tie
specific usage to specific users who would
ultimately benefit and pay for the services.
Decoupling also helps defray the conflict
of interest situation often facing vertically
integrated sectors, where the government
plays both the owner and regulator roles. For
those assets/operations that are privatized
through decoupling, the private sector can
take on the service provider role subject to
regulatory oversight by the public sector.
The transfer of ownership can be either
partial or full. Under partial transfer, the
resulting ownership structure can become
an important issue. For example, the private
sector can take on either a minority stake
(in which government has the controlling
interest) or a majority stake (in which the
private sector has the controlling interest).
There have been conflicting conclusions
about the impact of ownership structure
on infrastructure performance. For cases
involving airport privatization, for example,
one study found that little de facto
difference exists between different
ownership models because: (a) private
sector participants can bring an
entrepreneurial and commercial orientation
whether or not they had majority ownership
and (b) through regulation and oversight,
governments can also exercise significant
influence and impose constraint, whether or
not they have majority ownership.46 Another
study, however, concluded there is about
an 80 percent probability that airports in
which the private sector has the majority
controlling interest achieve higher efficiency
than those in which government has the
majority controlling interest.47 Regardless,
it has been found that the political climate
of local jurisdiction generally has significant
bearing on the overall performance of
privatized airports.
Another important aspect to privatization
is asset valuation, which has been evolving
in recent years. Most recently in 2012,
the Australian government performed a
comprehensive assessment of the potential
value of transferring the ownership of their
remaining infrastructure assets to the
46 See Gillen (2008) and Gillen et. al. (2006) for additional discussions on global airport privatization experience
and the effect of regulation. 47 Oum et. al. (2008) for additional discussions on the impact of ownership structure on the effectiveness of
privatization.

51
Handbook on Urban Infrastructure Finance
private sector. Their approach reflected
generally accepted market-based
valuation metrics that varied with different
type of assets—a multiple of asset base for
regulated assets (e.g., energy transmission
and water), a multiple of earnings for
non-regulated assets (e.g., energy retail,
airports, ports), and discounted cash flow on
annual accounts for others (e.g., freight rail,
forestry).48 The multiples and discount rates
were based on comparable listed assets in
the private sector. These approaches are
proving to be on the underestimated side
judging from the recent transactions in
Australia where the actual bids consistently
exceeded valuations based on these
methods.
Sometimes it is difficult to distinguish
between privatization and brownfield P3
concessions, especially if the term of the
P3 concession is very long (for example,
99 years). From a financing standpoint, the
fundamental difference is that P3 is based
on project finance with specific time frame
and performance specifications, whereas
privatization is based on corporate finance
of an operating entity in perpetuity (likened
to private equity investment). In this regard,
certain sectors are more amenable to
privatization than P3. For example, P3 has
been the primary private sector financing
model for roads whereas divestment (either
partial or full) has been generally adopted
for airports by many governments around
the world.
In many countries, such as the U.S.,
privatization is not a viable solution currently
due to strong political opposition. A major
political issue for privatization is the loss
of control and genuine public concerns
about the private sector controlling assets
that have long been in public hands.
Privatization can be more acceptable
politically when the public is informed of
the rationale behind the sale, there is early
and clear delineation of the specific uses
of the proceeds (preferably, reinvesting in
infrastructure), and an effective regulatory
regime is established to protect broader
social objectives. A set of effective
regulations has sometimes proved to be
as good as owning the assets themselves
and the key to serving the best interests of
both the general public and private sector
businesses. Given that many governments
are seriously resource-constrained, many
cities may need to explore the privatization
option while finding ways to deal with
underlying political sensitivities.
2.3.6 Other Private Sector Financing
Considerations
It is now generally recognized that the
biggest potential threat to private sector
participation in infrastructure financing may
be not financial, but political. Public
48 See, for example, NSW State (2011) and Infrastructure Australia (2012, 2013) for current infrastructure asset
valuation practices in Australia. More general discussion of public sector asset valuation, see Brealey et. al.
(1997), FER (2012), Lucas (2012, 2014), and Lucas et. al. (2010a, 2010b).
52
Urban Infrastructure Financing Instruments
discontent is fueled by price increases,
job losses, and perceived high profits
for the private sector firms, but also by
macroeconomic and political events
that are not directly attributed to the
private sector. Historically, for example,
global financial crises have tended to
further trigger high levels of public,
political, and media scrutiny and
opposition to private sector involvement.49
Some of the underlying causes, political or
otherwise, that have made private sector
financing less than effective in the past have
included: (a) industry-wide misconceptions
about private sector investments and
financing, (b) poor understanding of
risk factors across different sectors, (c)
misaligned incentives and interests of
major stakeholders, (d) public expectation
for below-cost prices and government
subsidies, (e) increased mobilization of
civil society and interest groups, (f) lack of
credibility in government commitments,
often resulting from the lack of consensus
within governments, (g) corruption and
imbalance in deal structure and equity
distribution, often in favor of the private
investor, and (h) inflated needs assessment
for new infrastructure (“white elephant
syndrome”). Cities who are exploring
private sector financing should be sensitive
to these and other potential pitfalls.
In the past when private sector financing was
involved, there was a strong preference for
brownfield rather than greenfield projects.
This is because brownfield represents
mature operating assets where the investors
can (a) forego the construction risks
associated with large initial capital injection,
(b) focus on O&M with less extensive
capital requirements, and (c) also have the
advantage of steady cash flow from ongoing
operations. Brownfield projects have also
been prone to public criticisms—especially
when the government’s motivations stem
primarily from solving its fiscal problems—
because they often do not add new
infrastructure capacity. In recent years, a
majority of large infrastructure funds have
started to seek a mix of both brownfield and
greenfield projects. This is a positive trend
given most of the critical infrastructure
needs associated with rapid urbanization
are in the new greenfield space.
There are important sources of private
sector financing that seek more socially
responsible investments and address
some of the shortfalls associated with
private sector financing, including the
political and greenfield issues discussed
above. There is a growing interest among
philanthropic organizations, private
foundations, and a range of non-profit
organizations to participate in investments
that help achieve more sustainable cities.
In addition, crowdfunding is emerging as an
important source of funding, especially for
smaller scale infrastructure projects such
as bike paths or local parks, where citizen
49 See, for example, Kim (2012) and Orr et. al. (2005) for additional discussions on political risks associated with
private sector financing.

53
Handbook on Urban Infrastructure Finance
participation is essential and encouraged.
All these sources can supplement the
private sector financing sources identified
earlier and used to address social equity,
environmental, and other larger public
policy issues beyond those that are purely
economically motivated.
2.4 Financing Support from
International Financial Institutions50
International financial institutions and
development banks, collectively known as
IFIs, are public sector development banks
and development finance institutions
that are owned by one or more national
governments. The fundamental role
of IFIs is to provide long-term, large-
scale development finance, of which
infrastructure plays a large part, to
meet national or international economic,
developmental, and social priorities.
Operating at international, regional, and
national levels, IFIs provide a critical
nexus between the public policy goals of
governments and the international capital
markets that allocate financial resources
on a global scale. Collectively, IFIs provide
both mobilization of significant capital and,
perhaps as importantly, knowledge on
institution-building, policy development,
and the blending of financial instruments
for investing in urban infrastructure.
Broadly, IFIs can be categorized into:
• Multilateral development banks
(MDBs) that are created by multiple
countries for the purpose of
development in both OECD and
non-OECD countries. The capital is
provided through multi-year donor
cycles agreed upon by the member
nations. MDBs fund their operating
costs from money earned on non-
concessional loans to borrowers,
where the capital for the loans
themselves are obtained by
borrowing money from international
capital markets. MDBs tend to have
a separate Board of Governors
and Board of Directors that
represent members in decision-
making.
• Regional and sub-regional
multilateral development banks
whose membership is usually
limited to borrowing nations in
the local region. Lending is
typically made possible by
borrowing on international capital
markets, for which members
effectively share repayment
responsibility and associated risks.
These regional banks tend to be
more flexible because the decision-
making committee generally
50 This handbook focuses on IFI programs at sub-sovereign level. In general, IFI websites provide a
wealth of information on lessons learned, best practices, and other policy discussions, especially at the
sovereign level. For an excellent overview of the role of IFIs in urban investment, see Future Cities Catapult
(2014). In addition to direct interviews with IFI representatives, this section relied largely on that report.

54
Urban Infrastructure Financing Instruments
consists of national ministers rather
than separate boards.
• Bilateral development banks,
development finance institutions,
and agencies that are established
by one OECD country to help finance
development projects in non-OECD
partner countries, that often include
private sector development. As
national organizations, these
institutions are, in effect, a branch
of national development policy and
their activity takes the form of
bilateral partnerships or projects
with public or private sector partners.
A select list of representative IFIs within
each category is provided in the following
along with their head office locations.
Exhibit 9 also depicts the respective scope
of these IFIs along the public and private
sector financing spectrum.
Global Multilateral Development Banks/
IFIs:
• Asian Development Bank (ADB,
Manila)
• Council of Europe Development
Bank (CEB, Paris)
• European Bank of Reconstruction
and Development (EBRD, London)
• European Investment Bank (EIB,
Luxembourg)
Source: Future Cities Catapult (2014)
Global Multilateral
IFIs
RegionalMultilateral DBs
(Non-OECD)
Bilateral DBs(Non-OECD)
Bilateral DBs(OECD)
Public Sector Financing (Sovereign/Sub-Sovereign) Private Sector Financing
World Bank
CEB ADB laDB
EIB
EBRD
CAFIsDBAfDB
DBSA
KFW AFD
IFC
ADB PrivateSector Ops Dpt
AFD Proparco
KFW DEG
CDC
Exhibit 9: IFI Typology along Public vs. Private Sector Financing

55
Handbook on Urban Infrastructure Finance
• Inter-American Development Bank
(IaDB, Washington DC)
• World Bank (WB, Washington DC);
International Finance Corporation
(IFC)
Regional Multilateral Development Banks:
• African Development Bank (AfDB,
Abidjan)
• Islamic Development Bank (IsDB,
Jeddah)
• Development Bank of Latin America
(CAF, Caracas)
Bilateral Development Banks/Institutions:
• Agence Francaise de
Developpement (AFD, Paris)
• CDC Group (formerly
Commonwealth Development
Group, London)
• Development Bank of South Africa
(DBSA, Midrand)
• KfW Bankengruppe (KfW, Frankfurt)
Although IFIs vary in their regional focus,
they all adhere to sound banking practice
and have high credit rating. Secured by
sovereign guarantees, they can borrow
at very low rates rarely achievable with
commercial loans. Many IFIs have been
able to catalyze long-term finance to help
draw in private capital into infrastructure
projects in locations and sectors where the
perceived risks are higher.
Many IFIs have also developed new
instruments to specifically address urban
infrastructure investment challenges.
Though limited, some IFIs can now supply
capital to municipal governments directly
without a state guarantee. They have also
developed other investment mechanisms
such as municipal funds, risk-sharing
facilities, or specialized financial instruments
that support urban development rather
than national development processes.51
The pace of urban investments has picked
up in nearly all IFIs. It is estimated that
total annual direct urban lending by all 13 institutions identified above is $25 to 30
billion, with an additional $100 billion in
indirect funding from non-urban lending
programs. Today, IFIs typically earmark
10 to 15 percent of their total portfolio for
urban programs. Much more is earmarked
for infrastructure projects that ultimately
impact cities. By some estimates, as much
as 60 percent of total IFI lending has some
impact on cities and urban areas around the
world.
Exhibit 10 provides a summary of urban
infrastructure programs for those IFIs
identified in Exhibit 9, including their
organizational capacity, direct and indirect
funding levels, overall credit rating, regions
of focus, and engagement levels in different
infrastructure sectors.
51 See, for example, ADB (2013) for a comprehensive urban investment strategy established by ADB.

56
Urban Infrastructure Financing Instruments
IFIs provide financing to city infrastructure
projects in numerous ways, which generally
include:
• Debt capital to sovereign states.
IFIs allocate loan financing to
national governments on the basis
of an agreement to disburse to
local authorities according to
specified conditions. It is common
for projects to be delegated to
the city authority while the funds
are managed by the central
government. Cities in low-income
countries often receive non-
repayable grants via their national
governments. For cities in
creditworthy middle-income
countries, IFIs offer a wide range of
sovereign loans tailor-made for
each project.
• Municipal lending.
Several IFIs are working on offering
sub-sovereign loans directly to
municipalities. Direct municipal
loans have become harder since the
global financial crisis. ADB, for
example, has seen a 10 percent
decrease in their direct sub-
sovereign lending since 2008.
For most IFIs, sub-sovereign
lending is relatively low compared
to the overall lending portfolio in
part because most cities in
non-OECD countries are not
creditworthy.52 Municipal lending
can also be provided by helping
local banks to take and manage
municipal credit risk or by
creating intermediary municipal
development funds. These are
useful for smaller and mid-sized
cities, which otherwise would have
limited access to commercial
bank funding for their
infrastructure projects. Often such
intermediated loans are combined
with local capacity building
programs.
• Private sector lending for Public-
Private Partnerships (P3s).
P3s form an important part of the
urban investment strategy for IFIs.
Although P3s are not yet used
as a matter of course in all
development contexts, many IFIs
have P3-specific departments to
manage the role of the private
sector in municipal service delivery.
Since 2011, a range of new
strategies led by national
governments and supported by IFIs
have been developed to
strengthen the financial viability of
P3s in African, Asian and Latin
American cities. P3 support is
provided by IFIs in a number of
ways, including (a) helping improve
the legal/regulatory framework
and political/business environment
52 Only 4 and 20 percent, respectively, of the largest cities in non-OECD countries are creditworthy in
international and local financial markets.
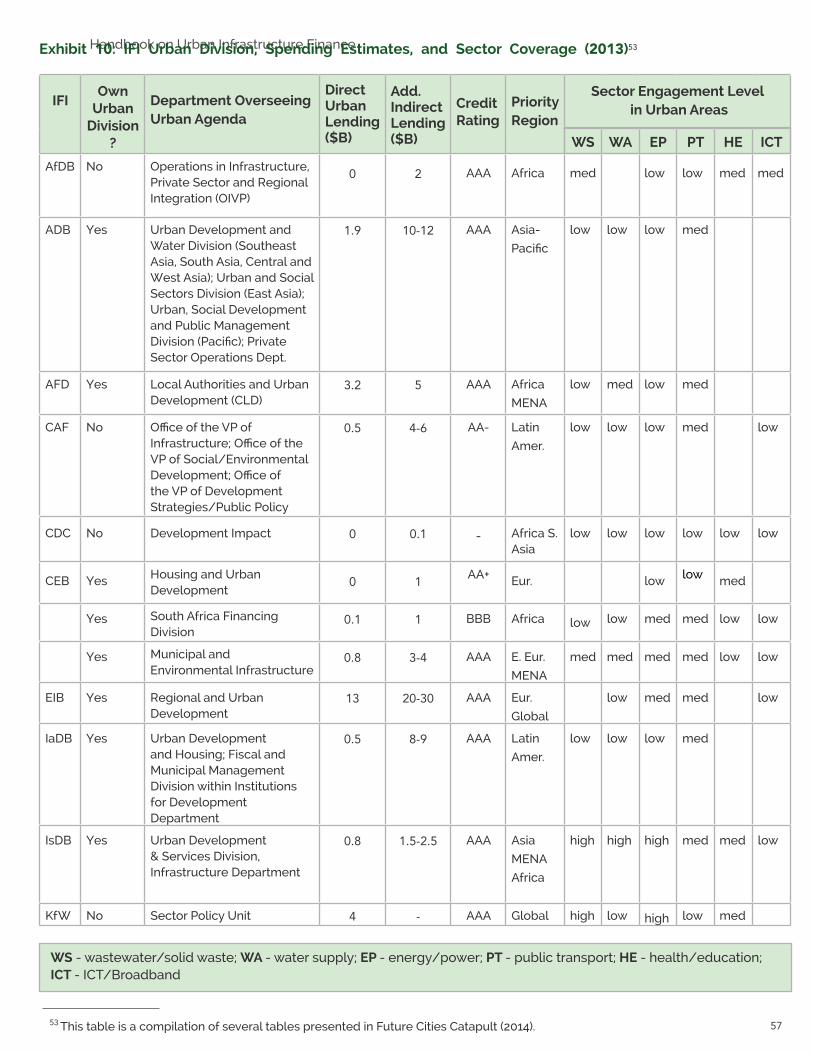
57
Handbook on Urban Infrastructure FinanceExhibit 10: IFI Urban Division, Spending Estimates, and Sector Coverage (2013)53
IFIOwn
Urban Division
?
Department Overseeing Urban Agenda
Direct Urban Lending ($B)
Add. Indirect Lending ($B)
Credit Rating
Priority Region
Sector Engagement Level in Urban Areas
WS WA EP PT HE ICT
AfDB No Operations in Infrastructure, Private Sector and Regional Integration (OIVP)
0 2 AAA Africa med low low med med
ADB Yes Urban Development and Water Division (Southeast Asia, South Asia, Central and West Asia); Urban and Social Sectors Division (East Asia); Urban, Social Development and Public Management Division (Pacific); Private Sector Operations Dept.
1.9 10-12 AAA Asia-
Pacific
low low low med
AFD Yes Local Authorities and Urban Development (CLD)
3.2 5 AAA Africa
MENA
low med low med
CAF No Office of the VP of Infrastructure; Office of the VP of Social/Environmental Development; Office of the VP of Development Strategies/Public Policy
0.5 4-6 AA- Latin
Amer.
low low low med low
CDC No Development Impact 0 0.1 - Africa S. Asia
low low low low low low
CEB Yes Housing and Urban Development
0 1 AA+ Eur. low low med
Yes South Africa Financing Division
0.1 1 BBB Africa low low med med low low
Yes Municipal and Environmental Infrastructure
0.8 3-4 AAA E. Eur.
MENA
med med med med low low
EIB Yes Regional and Urban Development
13 20-30 AAA Eur.
Global
low med med low
IaDB Yes Urban Development and Housing; Fiscal and Municipal Management Division within Institutions for Development Department
0.5 8-9 AAA Latin
Amer.
low low low med
IsDB Yes Urban Development & Services Division, Infrastructure Department
0.8 1.5-2.5 AAA Asia
MENA
Africa
high high high med med low
KfW No Sector Policy Unit 4 - AAA Global high low high low med
WS - wastewater/solid waste; WA - water supply; EP - energy/power; PT - public transport; HE - health/education; ICT - ICT/Broadband
53 This table is a compilation of several tables presented in Future Cities Catapult (2014).

58
to demonstrate the city or country
is P3-ready, (b) helping understand
the P3 process within the city or
municipal government, including
aspects of risk allocation and
incentive structures, (c) playing an
advisory/brokerage role on
individual P3 projects, identifying
potential equity investors and
technical partners, developing
clear project specifications, and
making them more bankable,
and (d) leading the structuring,
negotiation, and implementation to
ensure that the P3s meet
local industry best practices.
IFIs work closely with local and regional
banks and financial intermediaries for urban
investments. To further stimulate the flow of
capital, IFIs also work in close partnership
with sovereign wealth funds (SWFs),
including China-Africa Development
Fund (CAD Fund; a subsidiary of the China
Development Bank), Norway’s Norfund,
Qatar Investment Authority, Abu Dhabi
Investment Authority, and Angola’s Fundo
Soberano Angolano.
IFIs such as ADB work closely with large
multinational corporations to address
their growing interest to invest in inclusive
economic and social development in
cities. For example, in 2013, Goldman
Sachs launched a $250 million social
impact fund54 with returns indexed to the
success of projects in American cities.
Morgan Stanley has also established the
Morgan Stanley Institute for Sustainable
Investing with an aspiration for $10
billion of client funds. IFIs offer technical
assistance and share their knowledge
in urban investments with these corporate
investors to explore different forms of
co-investment and collaboration to solve
shared concerns.
2.5 Credit Enhancements and Other
Financial Leveraging Tools
Whether public or private sector financing,
the basic goal of infrastructure financing is to
get as much money as cheaply as possible.
There are many credit enhancement and
other financial leveraging tools that help
to achieve this goal, especially on the debt
financing side. Most of these tools are
intended to decrease the risk and increase
the liquidity on the overall investments.
Low-interest subordinated loans and
standby contingent credits are often
provided by national and state/provincial
governments or by IFIs to help reduce risks
to investors and allow cities and project
sponsors to borrow at lower interest rates.
In the U.S., for example, the Transport
Infrastructure Finance and Innovation Act
(TIFIA) enabled the federal government to
provide subordinated loans to state and
local agencies charged with implementing
P3 projects. The Project Bond Credit
Enhancement Facility, provided jointly by the
EU and EIB, is a similar program designed to
support private financing in infrastructure
projects in emerging countries. These
subordinated debts have been targeted
for large strategic infrastructure projects to
54 More detailed discussion of social impact bonds and related financing activities are provided in Chapter 4.

59
leverage significant private sector financing
in the form of senior debt.
Subordinate debt financing (sometimes
called mezzanine financing) refers to
capital that sits in-between senior debt
and equity. Subordinated debt helps to
generate liquidity and reduce risk to senior
debt lenders, ultimately helping to improve
the project credit rating. Normally, this type
of capital is provided directly by insurance
companies, subordinated debt funds, or
specialized finance companies.55
Tax exemptions and other tax incentives
are another leveraging tool that enables
higher-tier governments to engage private
capital and help reduce borrowing costs
for cities. These tools sometimes play a
critical role in raising the necessary capital
for infrastructure. In the case of muni
bonds, for example, tax incentives were the
primary reasons why the muni bond market
took off in the U.S., allowing states and
local governments to raise the money they
needed. As a result, muni bonds have now
become one of the most versatile financing
tools available for cities.
Credit enhancements can also be
provided as various forms of insurance
products and guarantees. For example,
the Multilateral Investment Guarantee
Agency (MIGA), a member of the World
Bank group, helps to attract infrastructure
investments in emerging markets by
providing political risk insurance products.
These products help protect investors
and lenders against potential losses from
risks relating to currency convertibility/
transfer, expropriation, war, terrorism and
civil disturbances, breach of contract, and
financial obligations that are not honored.
This is an important tool for cities in the
developing world where basic institutional
requisites are lacking.
Often, national governments sponsor
guarantees as a way to support investment in
infrastructure (e.g. HM Treasury Guarantee
in the U.K.) or at the request of MDBs on
sub-sovereign loans. Public guarantees add
risks to government balance sheets and
should be targeted where they can most
effectively support private sector financing
of infrastructure projects.
For P3, there are a number of government
guarantees that, when used appropriately,
can serve as an effective tool to improve the
P3 financing structure.56 These guarantees,
for example, can help to avoid potential
defaults on debt financing for demand-risk
P3 models. The guarantees can be provided
directly to P3 concessionaires (e.g., as
minimum demand, revenue, or availability
payment guarantees, or guarantees to
assume debt obligations or residual values
upon contract termination or expiration) or
aimed directly at P3 lenders (e.g., as loan
guarantees or refinancing guarantees if P3 concessionaires fail to service the debt or
cannot refinance it close to its maturity).
The P3 guarantees can be provided at a
55 See Long Finance (2015) for more additional discussion on subordinated debt, credit enhancements, and other
financial leveraging tools.56 See, for example, EPEC (2011) for examples of P3 guarantees provided in European countries.
60
Urban Infrastructure Financing Instruments
programmatic level as was the case, for
example, for the Loan Guarantee Instrument
for the Trans-European Transport Network
Projects (LGTT) established jointly by the EIB
and the EC. LGTT was set up as a stand-by
credit line to be drawn by P3 concessionaires
in the event of unexpected situations such
as traffic revenues shortfalls. The LGTT
credit line proceeds can be used to service
P3 senior debts to prevent potential default
situations. These guarantees are especially
useful in weathering major macro-economic
fluctuations that can occur on long-term
projects that are often beyond the control
of project stakeholders.
There are endless opportunities to
improve the project capital efficiency over
the project lifecycle by recapitalization
through refinancing. This is one of the
important lessons learned from private
sector involvement in infrastructure delivery
in the last three decades. Refinancing and
recapitalization through secondary equity
and debt markets involves replacing short-
term, high risk, expensive capital with
longer term, lower risk, lower cost capital,
thus improving the overall cost of capital on
the project. On the equity side, an example
of interest was the deep and competitive
secondary equity market that developed
in the U.K. PFI market, where investors
were willing to pay a premium for projects
that passed a risk-reduction threshold, i.e.,
successful construction completion. On
the debt side, various post-construction
refinancing instruments have emerged
in recent years in the form of securitized
debt—in particular asset-backed securities
(ABS) in the energy sector—with long-term,
low-volatility yields that match well with
institutional investors’ portfolio criteria.
In general, debt-refinancing instruments
are important mechanisms to generate
additional liquidity for infrastructure
assets over long-term life cycles. These
refinancing instruments are primarily used
in developed countries and emerging
economies with advanced financial system
and institutions. Debt refinancing consists of
pooling of illiquid infrastructure assets and
securitizing these assets into ABS that can
be issued and traded on capital markets.
Securitization differs from other debt
instruments in that the original loans are
sold to a third party (typically an SPV) which
in turn issues debt instruments (e.g. bonds),
whose interest and principal payments are
dependent on the cash flows coming from
the pooled assets collectively.57
These secondary refinancing markets
provide additional liquidity for early-
phase investors to further leverage
their investments into new project
opportunities, thus improving the overall
infrastructure funding picture. Through
secondary markets, the overall private
sector investments in infrastructure can be
expanded with more diversified portfolios
and reduced risks.58
57 See Long Finance (2015) for additional discussion on ABS and recapitalizations.58 ABS is a derivative product which includes mortgage-backed securities that received much attention in
2007-financial crisis. It is generally perceived to be risky in the current climate but can be an effective tool in
infrastructure financing space if used correctly.
61
Handbook on Urban Infrastructure Finance
There is an important distinction between
funding and financing. Financing is the
leveraging of future funding (i.e., revenue)
sources to raise the high level of upfront
capital needed to expedite and deliver
infrastructure when and where needed.
In one form or another, financing is always
tied to repayment obligations and does not
address per se the fundamental problem of
reducing the infrastructure funding gap. To
effectively reduce the funding gap, we need
to address the revenue issue and make more
transparent where the buck really stops.
Historically, many cities around the world
have relied on direct grants and subsidies
from IFIs and/or their national and state/
provincial governments as the primary
funding sources. These funds in turn come
from taxes that are levied at national and
state/provincial levels and, where available,
from sovereign wealth reserves tied directly
to publicly owned commodities and assets.
Although limited, direct grants and subsidies
from philanthropic sources can also be
an important funding source for cities.
These direct grants and subsidies have no
repayment obligations and can be leveraged
to secure additional infrastructure financing.
Outside direct grants and subsidies, the
two prevalent funding sources available
currently for infrastructure are taxes and
user charges. Compared to taxes, user
charges are still limited as a significant
funding source for infrastructure, especially
for non-utility sectors where the user-
pay culture is yet to be established.
Increasingly, however, taxes need to be
supplemented with user charges and
striking the right balance between the two
sources will be critical in addressing the
impending infrastructure funding crisis.
In addition to national and state/provincial
taxes, cities can increase their self-
reliance by enhancing their own local
taxing authority. Regardless of who levies
the taxes, the basic approach to taxing for
infrastructure should be closely tied to the
wear-and-tear of facilities and the actual
cost of producing infrastructure services
to make funding more sustainable in the
long run. For cities specifically, the value
capture approach has proven a particularly
effective tool where the value of improved
infrastructure is captured by monetizing
the resulting increase in property
values through various taxing schemes.
Compared to taxes, it is generally easier
to tie user charges directly to the cost
of producing services so the perpetual
funding shortage can be avoided. They are
Chapter 3Funding Considerations and Sustainable Revenue Sources

62
Funding Considerations and Sustainable Revenue Sources
thus more self-sustaining sources in the
long run. Imposing user charges can be
politically sensitive, especially for sectors
such as water supply where the services
are often viewed as entitlements that
should be subsidized.59 Despite potential
public hostility, user charges can be the
key to unlocking private sector capital
and attracting innovative, self-sustaining
financing solutions in the long run.
In addition to taxes and user charges,
an indirect approach to dealing with the
infrastructure funding issue is by reducing
overall funding needs. Several indirect
options are currently available to reduce
the funding needs. One option is to
increase the overall project efficiency and
minimize the total project costs through a
lifecycle approach that integrates design
and construction with operations and
maintenance (O&M). The P3 delivery model
is the primary mechanism that utilizes this
lifecycle approach. Because O&M costs are
often a large part of infrastructure funding
needs, another way is to increase O&M
efficiency through various conservation and
efficiency measures, demand management,
and congestion pricing strategies that are
aimed at maximizing the use of existing
facilities. Most sustainability initiatives and
smart city concepts serve this purpose.
Reducing non-productive financing
costs is another indirect way to reduce
funding needs, which can be achieved by
various credit enhancements tools that
ultimately reduce overall project risks.
Given the sheer size of the funding needs,
business-as-usual will not solve the problem.
We need big ideas to tackle the problem.
The brownfield recycling approach used
in Australia can potentially offer one big
idea that can provide a substantial funding
source for new infrastructure spending
needs. Although brownfield transactions
can often be mired in political controversy,
there is sufficient evidence to prove that
wider public acceptance is possible if
the transactions are well managed and
effectively communicated, and credible
institutions such as public pensions are
involved on the private investor side.
3.1 Taxes and Other Related Revenue
Sources
Where user-pay culture is not well
established, such as in some transportation
and social infrastructure sectors, most
infrastructure funding generally comes
from tax revenues. In the U.S., for example,
more than 90 percent of the annual funding
for the surface transportation sector (roads
and bridges) comes from various taxes and
other public funding sources at the federal,
state and local levels. Due in part to global
urbanization coupled with the declining
fiscal health of national governments,
infrastructure funding responsibilities
59 See Pigeon et. al. (2012) for political sensitivities associated with water sector.

63
Handbook on Urban Infrastructure Finance
have also been shifting from national to
state/provincial and local governments.
Cities can sometimes expand their local
tax revenues within the current tax regime.
In most cases, however, cities must be
formally empowered by their national
and/or state/provincial governments
for the enhanced taxing authority.
Exhibit 11 summarizes a representative
list of infrastructure funding sources
for cities that are derived from tax
revenues and other funding sources.
Tax revenues can come from general tax
bases, such as income, sales, or property
tax, or from those bases designated
specifically for infrastructure purposes
such as, for example, motor fuel taxes or
vehicle registration fees in the case of the
surface transportation sector. All levels
of governments can draw from these
sources for infrastructure funding needs.
For local governments, sales and
property taxes are two primary taxing
mechanisms used to generate local tax
revenues. Authorized by state/provincial
governments, cities can levy local
options sales taxes, which are becoming
increasingly important local revenue
sources, especially for urban transit
projects. In many cases, imposing a sales
tax surcharge for infrastructure purposes
may also require local voter approval. Other
than sales tax, many local tax revenues
are generated by levying various forms of
property taxes for the value capture option.
In many countries, motor fuel taxes—per
gallon excise tax on the sale of fuels—and
vehicle registration fees are the two most
common infrastructure specific tax revenue
sources for surface transportation. Cities
can levy their own local option fuel taxes
and vehicles fees, as authorized by their
higher-tier governments, which are often
used to supplement other funding sources.
Due to increasing fuel efficiency, per gallon
fuel tax revenues have been decreasing
steadily in recent years. To overcome this
trend, vehicle-miles-traveled (VMT) taxes
have been emerging as a new taxing regime
to either replace or supplement fuel taxes in
several countries.60 VMT taxes are mileage-
based fees that can be levied either as a
flat fee (e.g., a fixed fee per mile, regardless
of where or when) or a variable fee (e.g.,
based on time of travel, congestion levels,
type of road, type and weight of the vehicle,
emission levels, or a combination thereof).
Compared to the flat fee, variable fees are
closely tied to wear-and-tear of facilities
and designed to make the VMT a more
sustainable funding source in the long run.
Value capture and developer exaction
in Exhibit 11 are robust and substantive
funding tools available at the city level.
Although both concepts are based on
60 For example, Germany, Austria, Slovakia, the Czech Republic, Poland, Hungary, Switzerland and New Zealand
have implemented various forms of VMT fees, but they have largely been limited to trucks, heavy vehicles
and/or diesel-powered cars. Truck based VMT systems are also under development in France, Belgium and
Russia.

64
Exhibit 11: Taxes and Other Related Infrastructure Funding Revenue Sources
Funding
Category
Representa-tive Funding Instrument
One time or Long-Term
DescriptionSector
Application
General Income Tax LT National, state/provincial, and/or local income taxes can be used
by cities as general fund appropriations for infrastructure use
Various
Sales Tax LT Cities can be authorized for local option sales tax dedicated to
specific infrastructure projects; requires voter approval
Various
Property Tax LT Property tax is cities’ primary tool for obtaining infrastructure
related tax revenues, including value capture approach
Various
Infra-
structure
Specific
Motor Fuel Tax LT Per gallon excise tax levied on motor fuels collected at national,
state/provincial, and local levels; administered through escrow
account
Transport
Vehicle Fees LT Vehicle registration fee levied as a flat fee, by weight, by age, and/
or by value generally collected at state/provincial or local levels
Transport
Vehicle-Mile-
Traveled
(VMT)
LT Mileage-based fees levied either as a flat or variable fee; tied more
to wear-&-tear compared to per gallon fuel tax
Transport
Value
Capture
Tax Increment
Financing (TIF)
LT Income, property, or sales tax increments from infrastructure
improvements into a separate escrow account to retire existing
debt, fund improvements, or use as a pledge to secure a new debt
Transit/
Housing/
Urban Dev.
Special
Assessments
LT Property tax increase applied only to specific districts that benefit
from infrastructure investments
Roads/Public
Transit
Land Value
Tax
LT Tax assessed on land value rather than property value (e.g.,
building); better incentive for development than property tax
Various
Betterment
Tax
LT Benefit assessment or betterment levy imposed on beneficiaries of
infrastructure investments
Water/
Sewer/
Transport
Joint
Developments
LT Cost sharing between public operator (e.g., rail transit) and private
developer; both benefit from property value increases
Rail/Public
Transit
Lease or
Sale
Land Lease or
Sale
OT/LT Publicly-owned land with enhanced value can be leased or sold
with proceeds that can be reinvested into infrastructure
Various
Air Rights
Lease or Sale
OT/LT Air rights above/below the permitted land use (e.g., increased FAR)
can be leased or sold as monetized development rights
Various
Developer
Exaction
Impact Fees OT Impact fees on developers to fund additional service capacity; can
be conditioned on project approval
Roads/
Safety/
Schools
Negotiated
Exactions
OT Developers donate land or build facilities for public use as condition
for development approval
Sidewalk/
Park
& Open
Space
Tap Fees OT Utility connection fees on developers to recover cost of integrating
new development with existing infrastructure
Water/
Sewage
Linkage Fees OT Fees on developers for secondary effects, e.g., traffic increases Road/
Housing
Utility
Surcharge
Public Benefit
Funds (PBF)
LT Funds are collected either through a small surcharge on electric
bills or through contributions from utilities
Renewable
Energy/R&D
65
Funding Considerations and Sustainable Revenue Sources
capitalizing on the incremental value that
infrastructure enhancements provide, value
capture is targeted at property owners
drawing primarily from property and other
taxes whereas developer exaction is
targeted at developers paying one time
fees to mitigate development impacts.
Extensive evidence since the 1980s
indicates that investment in transportation
infrastructure—especially heavy urban rail,
light rail, and rapid bus transit—can bring
measurable increases in property values
in surrounding areas.61 As demonstrated
by numerous examples from Europe,
North America, and East Asia, the increase
in property values is manifested as
positive impacts on residential property
prices, office rents and retailing, number
of shoppers in city centers, retail
structures, parking requirements, and
other building and development patterns
that result from urban metro systems.
As shown in Exhibit 11, several value
capture (VC) tools are currently available.
Tax increment financing (TIF) and special
assessments are the two most common
VC approaches. Used extensively in the
U.S., TIF allows cities to create special
redevelopment districts (e.g., transportation
reinvestment zone) and make public
improvements in those areas to spur further
development. Using TIF, cities can capture
value by earmarking any increase in property
tax revenues over the “base” attributable to
new developments into an escrow account
separate from general fund revenues (see
Exhibit 12). These revenues can be used
to retire existing infrastructure debts or
provide improvements associated with the
new development. These revenues can also
be further leveraged to secure new debt by
using them as a pledge to issue bonds. In
addition to property tax, potential increases
in local sales and income tax revenues
can be also used for TIF value capture.
Special assessments are based on creating
special tax districts to finance infrastructure
improvements. Unlike TIF where there is no
change in tax rate, special assessments levy
a tax surcharge on businesses and property
owners within the designated district who
are the beneficiaries of the improvements.
The surcharge can be used to finance bonds
that pay for the improvements. Where there
is shortfall especially in early years, the
debt service on the bonds can sometimes
be supported by financial support from the
national and state/provincial governments.
This approach is fast becoming a critical
tool for many cities to finance their urban
public transit systems including, for
example, London’s new CrossRail line.
Land value and betterment tax systems
represent a more generalized value capture
taxing concept. Land value tax (LVT),
sometimes proposed as a better alternative
to property tax, is an assessment based
on land value rather than property value
61 See WEF (2014) and Rybeck (2015) for additional discussion on value capture approach.

66
Handbook on Urban Infrastructure Finance
that includes buildings and other property
improvements on the land. Property tax
is considered inefficient because it taxes
the value of improvements and penalizes
development whereas LVT provides an
incentive for development. Betterment
tax, also referred to as benefit assessment
or betterment levy, is a one-time
assessment imposed on the beneficiary
of the land value gain resulting from
infrastructure improvements. Compared
to the other VC tools, betterment tax
allows early capture of the value created
from the development through a one-
time assessment upfront (see Exhibit 13).
The joint development approach is a form
of public-private partnership that has
been used most successfully by Hong
Kong’s Mass Transit Railway Corporation
(MTR).63 At no cost to the public purse, the
funding mechanism here is through a cost-
sharing arrangement between the public
operator and private developer to pay
for initial infrastructure improvements—a
riskier part of investments that is critical
for property developments, but that has
resided traditionally with the public sector.
Ultimately, private developers benefit
from better accessibility, more customers,
and increase in property value and the
public operator benefits from the sharing
of construction costs while securing
increased patronage for their transit system.
Long-term lease or sale of land or air rights
is another way for cities to capture value.
One-time proceeds can be obtained by
Tax Increment Base = Appraised Value in Base Year
Captured Appraised Value
Tax Increment Account
General Fund
AppraisedProperty Value
BaseYear
YearN
Exhibit 12: Tax Increment Financing Value Capture Mechanism62
62 See TxDOT (2013) and Farmer (2015) for specific value capture experience in Texas and Virginia, U.S. 63 See WEF (2014) for more detailed description of HKG MTR’s joint venture experience.
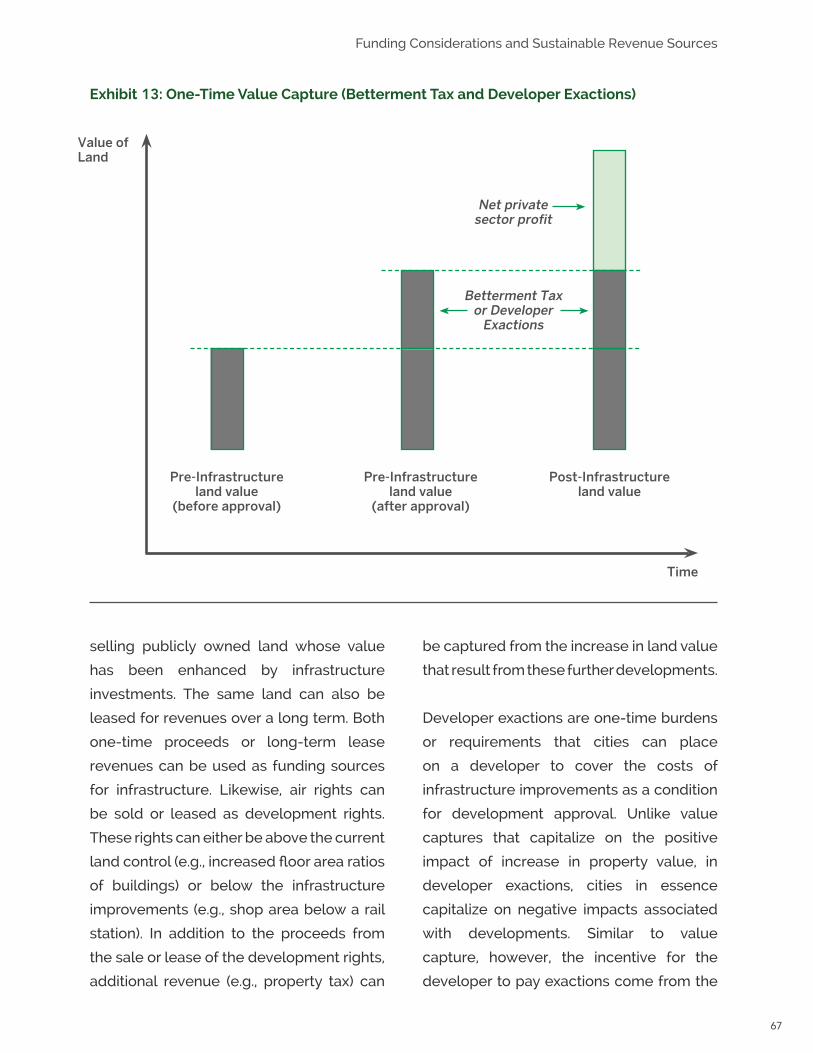
67
Funding Considerations and Sustainable Revenue Sources
Exhibit 13: One-Time Value Capture (Betterment Tax and Developer Exactions)
selling publicly owned land whose value
has been enhanced by infrastructure
investments. The same land can also be
leased for revenues over a long term. Both
one-time proceeds or long-term lease
revenues can be used as funding sources
for infrastructure. Likewise, air rights can
be sold or leased as development rights.
These rights can either be above the current
land control (e.g., increased floor area ratios
of buildings) or below the infrastructure
improvements (e.g., shop area below a rail
station). In addition to the proceeds from
the sale or lease of the development rights,
additional revenue (e.g., property tax) can
be captured from the increase in land value
that result from these further developments.
Developer exactions are one-time burdens
or requirements that cities can place
on a developer to cover the costs of
infrastructure improvements as a condition
for development approval. Unlike value
captures that capitalize on the positive
impact of increase in property value, in
developer exactions, cities in essence
capitalize on negative impacts associated
with developments. Similar to value
capture, however, the incentive for the
developer to pay exactions come from the
Post-Infrastructure land value
Pre-Infrastructure land value
(after approval)
Pre-Infrastructure land value
(before approval)
Time
Value of Land
Net privatesector profit
Betterment Taxor Developer
Exactions

68
Handbook on Urban Infrastructure Finance
potential increase in the property value. Like
the betterment tax, developer exactions
also force upfront payment and enable
cities to capture early on the value created
from the use of the exactions (Exhibit 13).
As listed in Exhibit 11, several developer
exactions tools are currently available.
Initially designed to offset environmental
costs associated with new development,
impact fees impose a fee on developers
to pay for additional service capacity—
e.g., sewer capacity, storm water runoff—
required by the development. Over time,
their use has been expanded to cover
non-environmental costs such as new
roads, schools, affordable housing, etc.64
Negotiated exactions, variously referred
to as developer dedication or contribution,
are often required by city ordinances on
land use or zoning regulations for new
developments. These ordinances require
developers to donate land and/or facilities
for public use or provide cash in lieu of
the costs, which can include, for example,
a new park, dedicated open space,
sidewalks, etc. Cash-in-lieu payments
can also be used for other infrastructure
needs for the new development.
Used primarily for water and sewer facilities,
tap fees are utility connection fees used
to recover the cost of integrating new
development into existing infrastructure
or fund other infrastructure improvements.
For example, the fees can cover the cost
of tying water meters for new connections
to existing lines or sewer line inspections.
Linkage fees, usually associated with
large-scale commercial, industrial, and
multi-family housing developments, are
designed to cover secondary effects of
development, e.g., traffic increase resulting
from housing developments or lack of
affordable housing for workers from
commercial developments.
Originating from the restructuring of the
electric power industry in the U.S. in the
late 1990s, public benefit funds (PBF) are
a dedicated fund designed to support
energy efficiency and renewable energy
programs. The funds are collected either
through a small charge on the electricity
bill of all customers or through specified
contributions from utilities themselves.
Sometimes referred to as a system
benefits charge (SBC), PBFs are state-level
programs that can be passed onto cities
through rebate programs that support
renewable energy systems, loan programs,
research and development, and energy
education programs. The utility surcharge
is a concept that can be used outside the
utility sector. Transportation utility fees, for
example, combine value capture with utility
surcharge where fees are imposed based
on increased number of trips generated
from the development rather than the
resulting increase in property value.
64 See Smart Cities Council (2014) for additional discussion on developer impact fees.

69
Funding Considerations and Sustainable Revenue Sources
There are many tax revenue generating
tools available for cities’ perusal. The use
of these tools is not without its challenges.
Value capture methods, for example,
must be anchored in well functioning
and transparent property markets, a
mature approach to taxation, and the
ability to measure and use property value
improvements. These requisites are in
addition to obtaining necessary political
approval from the government and the
property owners. Similarly, PBFs have
suffered in the past from raids by state
legislators and governors who used the
funds to fill their budget gaps unrelated
to infrastructure. There are no standard
models for these tools. Cities must consider
a full range of options before deciding
on a specific tool most appropriate for
their city or the specific project at hand.
3.2 User Charges
User charges are fees that are paid by users
who are individual people and businesses
that use infrastructure facilities and
services provided by cities that are distinct
from taxes. Depending on the infrastructure
sector, user charges can take many different
forms. In the utility sector, for example,
user charges are the monthly bills people
and businesses pay for their electricity, TV,
telephone, and water. In transportation,
user charges can be manifested variously
in airline landing fees, airport passenger
facility charges (PFC), parking fees, highway
tolls, fares paid for bus or rail public transit,
or shipping service charges paid by shipping
lines or terminal operators for ports. For the
social infrastructure sector, user charges
may be limited to, for example, entrance
fees for public museums or fees patients
pay for health care services in public clinics.
Compared to taxes, it is generally easier
to tie user charges directly to the cost of
producing infrastructure services and avoid
perpetual funding shortages. They are thus
more sustainable funding sources in the
long run. Utility sectors—i.e., electricity,
telecommunications, water—are more
amenable to user charges because it
is easier to assign specific benefits and
costs to specific users. Where the degree
of externality65 is greater, such as in major
highways, user charges are more difficult
to implement, except for situations like toll
roads where the effective user area can
be defined with clear physical boundaries.
Ironically, if political sensitivity about user
charges can be overcome, the water sector
can deploy a more sustainable financial
model compared to the transportation
sector.
In most utility sectors, user charge
regimes are well established through a
public regulator-private operator model.
Using various pricing strategies, constant
refinements can be made to make
funding more sustainable in the long run.
65 In economics, externality is associated with public goods and services and defined as the cost or benefit that
affects a party who did not choose to incur that cost or benefit.
70
Handbook on Urban Infrastructure Finance
User charges can potentially add most
value in surface transportation and other
sectors that currently rely heavily on
taxes, subsidies, and other public funds.
There has been an ongoing debate about
the viability of user fees in these sectors
as a legitimate and substantive solution
to the infrastructure funding problem.
Estimates have varied widely, but for the
U.S. surface transportation sector, for
example, the most optimistic forecasts
project that revenues from user charges
would make up less than 10 percent of
the total investments needed nationally in
the future.66
Two notable shifts in the infrastructure
industry at this juncture, however, may
trigger a more user charge-friendly funding
regime in the future. First, as the funding
responsibility shifts from federal to state/
provincial and local governments and as
infrastructure facility provisions become
more localized, it could become easier to
assign specific benefits to specific users.
For example, in the case of toll roads,
because toll facilities are by nature local,
public acceptance of tolling can vary
widely by location and national tolling
policy can have limited local impact.
Decisions about tolling thus could be
made more effectively at the local level.
Second, as the role of private sector
capital continues to feature prominently,
it is important to recognize that the user
charge funding regime is the preferred and
more sustainable model in the long run to
engage the private sector more effectively.
User charges can attract P3 and other
private sector financing opportunities that
are innovative and self-sustaining. User
charges often represent new revenue
sources and, especially under the demand-
risk P3 model, the financing can be
non-recourse with no future liability or
repayment obligations to the public sector.
The private sector is considered to be
better positioned for a user charge funding
regime because their incentives are better
aligned to achieve higher operational
efficiency that specifically cater to user
needs. Finally, user charges and rate
increases implemented by the private sector
are sometimes less likely to be subject to
political pressures because they are viewed
as a legitimate business undertaking
rather than having public service goals.
The full potential for user charges has yet to
be explored. Our collective challenge is to
unleash this source of funding by creating a
new value paradigm for infrastructure that
incentivizes users and their willingness to
pay. Working jointly with the public sector,
the private sector can add significant value
in this regard. The key would be to create
a new value paradigm by providing quality
service and convenience for users with
more service options, and targeting different
user groups with innovative fee structures.
Users also need to be directly incentivized
66 See Kirk et. al. (2013) and Samuel (2007) for more detailed discussion on user charge as a viable and substantive
funding source for surface transportation.
71
Funding Considerations and Sustainable Revenue Sources
to increase their willingness to pay. For toll
road P3 concessions, for example, some
level of government subsidies should be
set aside for user vouchers that can benefit
users directly. These vouchers can be
used toward paying user charges during
the interim period for users to get used to
paying tolls until charges catch up to the
required level. Relative to a one-time, lump-
sum subsidy to the private concessionaire,
this type of subsidy could be more effective
in generating a steady stream of revenues
over the long term and also overcoming
the initial resistance to user charges.
It has been proven that user charge
collection mechanisms can sometimes be
as important as the charges themselves.
As evidenced by experiences from utility
bills and airport PFCs embedded in airline
tickets, it is easier to mitigate the
general public’s resistance to user
charges if the collection system
provides user convenience. For example,
a collection system that is more
automated and embedded within the
legacy collection system has a higher
chance of being accepted by users.
There can be significant political obstacles
and public hostility surrounding user
charges. The public hostility is built around
two main concerns: (a) perception of
double taxation where users pay both
taxes and user charges for infrastructure
improvements and (b) inadequate provision
for charge-free facilities for those who are
unwilling or cannot pay the user charges.
When the private sector gets involved,
there is concern about the need to pay
back the sunken investments already
made by the public sector on the existing
facilities. There is also a community of
stakeholders, e.g., labor unions, who are
negatively impacted or whose interests
are misaligned with private sector
involvement and a user charge regime.
It is essential to overcome these political
challenges associated with user charges.
Many view user charges as unnecessary,
whereas others view them as a necessary
evil. The choice ultimately comes down to
the following: in the absence of new funding
sources, if we cannot impose user charges,
then we must impose additional taxes, or
no infrastructure service can be provided.
Taxes have the advantage of being able
to spread out the cost to many, but the
benefits are confined to a few and non-
benefiting taxpayers are unfairly penalized.
With user charges, in contrast, only those
who benefit pay, but the burden on users
(and thus on local communities) is much
higher compared to the paying regime that
is largely subsidized by national and state/
provincial governments. User charges
can also create social inequity situations
for the poor who cannot afford to pay.
The challenge is to reach a proper balance
between these two sources—with the
72
Handbook on Urban Infrastructure Finance
broad view that, effectively, taxes can help
address the broad social equity issues and
user charges address the efficiency and
financial sustainability issues. Instead of
being viewed as an additional burden, with
the help of the private sector, user charges
can be viewed as providing a natural
opportunity to monetize the beneficial side
of externality. They can help recover some of
the past investments made with the public
tax money for more efficient future use. With
proper asset valuation, brownfield recycling
could potentially present one way to recover
the sunken public sector investments.
3.3 Revenues from Brownfield Recycling
There is a limit to how much taxpayers and
users can take on to pay for infrastructure.
Brownfield recycling is one of a few options
that begins to address the sheer magnitude
of the funding gap at hand.67 Currently,
several converging circumstances are
placing brownfield recycling in a
favorable light:
• There is unprecedented private-
sector appetite for infrastructure
assets from a global investment
community with more money than
could be handled by the
current project pipeline.
• Institutional investors—with over
$100 trillion of assets under
management and particularly suited
for infrastructure investments—are
continuing to increase their
infrastructure asset allocations,
some choosing to invest directly
and/or co-invest with their peers.
• Recent infrastructure brownfield
transactions indicate a strong
seller’s market climate with
valuations consistently exceeding
expectations, many also involving
major public pension funds and
achieving political buy-in from
local communities.
• Many governments in the developed
world with public pension systems
are facing rising costs of unfunded
pension liabilities (UPL) and other
post-employment benefits, which
are crowding out critical
infrastructure spending needs.68
Brownfield transactions involving
public pension funds have been
shown to successfully solve both the
UPL and infrastructure funding
issues.
Brownfield recycling, alternatively referred
to as social privatization, has already had
a healthy set of successful precedents
in recent years, especially in Australia.
Recent transactions involving several
67 In the U.S., for example, a conservative estimate indicates that the potential value of brownfield recycling can
be more than a half-trillion dollars if we consider existing publicly operated airports, ports, and toll roads and
bridges. See Schmidt (2015) for additional discussion.68 See Pew (2014) for increasing public sector liability resulting from UPL.

73
Funding Considerations and Sustainable Revenue Sources
ports in New South Wales and a major toll
road in Queensland are notable examples
where public sponsors were able to fetch
brownfield proceeds that far exceeded
their expectations, sometimes by as much
as A$2 billion (see Box 3).69 These state-
level transactions were supported by
additional incentives by the Australian
government to enhance the states’ ability to
recycle assets to pay for new infrastructure
demands. These federal incentives
included A$5 billion in asset recycling
funds to pay the states direct incentives for
selling their existing assets and
reinvesting the sales proceeds into
new infrastructure. Furthermore,
additional tax incentives were introduced
whereby the corporate tax charged
to the private buyers went back to the
state rather than federal government.
69 See three IIWIR articles in 2014 and SMH (2015) for additional information on brownfield recycling experience
in Australia.
Australia has been leading the charge in successful brownfield recycling
involving major public pension funds. Most notable recent examples included
the transactions in New South Wales (NSW) and Queensland. In 2013, NSW
closed a 99-year lease on Ports of Botany and Kembla in Sydney at A$5.1 billion—
much higher than the budgeted A$3 billion. The lease was awarded to a private
consortium led by Industry Fund Management (IFM; a global infrastructure fund
manager owned by Australian public pension funds), AustraliaSuper (AusSuper;
Australia’s biggest pension fund), and Abu Dhabi Investment Authority (ADIA;
a major sovereign wealth fund). NSW repeated their success in 2014 with the
98-year lease of Port of New Castle at A$1.75 billion—again far exceeding the
budgeted A$0.7 billion. In both cases, the proceeds were reinvested to revitalize
statewide infrastructure.
Queensland followed suit in 2014 with the sale of Queensland Motorways to
a private consortium made up of Transurban (the largest Australian toll road
developer), AusSuper, and ADIA. The asset was sold for A$7.1 billion, compared
with the pre-sale estimate of A$5 to 6.5 billion. Earlier in 2011, the Queensland state
government provided in-kind ownership transfer of the motorway to Queensland
Investment Corporation (QIC), a government-owned enterprise and Australia’s
Box 3: Brownfield Recycling—The Australia Case
74
Handbook on Urban Infrastructure Finance
second largest pension fund manager responsible for the state’s Defined Benefit
Fund (DBF). The net proceeds from the 2014 sale were a significant growth from
the market value of A$3.1B in 2011 when QIC took over. The 2014 proceeds are to
remain in the DBF to meet the public pension liabilities to existing members.
In addition to ports and motorways, there were successful examples involving
other sectors. In December 2007, for example, Hobart Airport in Tasmania was sold
to a consortium of Macquarie Bank and the Tasmanian Retirement Benefits Fund
for over A$350 million. The high sale price, much above the state’s expectations,
was due in part to the large parcel of land attached to the airport to be redeveloped
with retail projects for additional revenues. It was unlikely that the state could
have undertaken such major retail developments themselves had the airport
remained in their hands. Similarly, in May 2012, NSW entered into a 50-year water
supply agreement for the Sydney Desalination Plant with a consortium of Ontario
Teachers Pension Plan and a Hastings-managed infrastructure fund. Part of the
agreement was for water prices to be regulated by the Independent Pricing and
Regulatory Tribunal (IPART). The transaction raised A$2.3 billion, A$300 million
more than the cost of constructing the plant. After repaying the debt incurred in
building the plant, the increment was put aside for new infrastructure projects,
including roads, hospitals, and schools across the state.
Despite these successes, however, brownfield recycling in Australia has not
been without political controversies. The government of Victoria, for example,
has been facing significant political resistance on the proposed sale of Port of
Melbourne, currently valued at A$5 to 6 billion. The opposition has been primarily
from the Labor Party members, labor unions, and incumbent port operators. The
underlying issues have included concerns over selling off the publicly owned
assets, job losses, and potential hikes in port facility rental rates. NSW also faced
staunch resistance initially with their much-touted sale of NSW’s electricity
networks, currently valued at A$20 billion. NSW received a green light recently
from its legislature despite the strong initial voter oppositions to the proposed
privatization.

75
Funding Considerations and Sustainable Revenue Sources
Infrastructure Australia, a federal
government agency responsible for
planning and coordinating infrastructure
projects across Australia, recently
developed a set of criteria to identify a
number of infrastructure asset classes
appropriate for brownfield recycling.70
These criteria, listed in the following,
serve as useful guidelines for cities
interested in exploring brownfield
recycling options with their national
and state/provincial governments:
• Appropriate asset classes
include those in energy,
water, and transport sectors
• Assets must be owned,
or partly owned, by federal,
state or local governments
• Assets must be applying or have
the potential to apply a user-pay
framework, or already have a non-
government earnings stream with
the potential to cover operating costs
• Assets have limited or defined public
policy benefits, which can be
obtained by way of
regulation, sale conditions, or
community service obligations.
Further, Infrastructure Australia
designated the asset classes according
to the following categories for
potential implementation and phasing
considerations:
• Those that already have competitive
markets where the remaining
publicly owned assets are suitable
candidates for transfer to the
private sector.
• Those that are not competitive
or have significant non-competitive
segments, but in which current
regulatory frameworks apply,
making them suitable candidates
for transfer to the private sector.
• Those that are not competitive
or have significant non-competitive
segments and where the regulatory
framework is not yet suitably
developed to allow privatization,
but where this can be achieved with
structural and/or regulatory
changes.
• Those that are unsuitable for
transfer to the private sector, either
because of significant structural or
regulatory impediments, or sectors
that are unlikely to yield upfront
revenues because they do not have
sufficient non-government earnings
and/or they carry a very large
community service obligation
component.
70 See Infrastructure Australia (2012, 2013) for more detailed discussion.

76
Handbook on Urban Infrastructure Finance
Many publicly owned infrastructure
assets are monopolies or have monopoly
characteristics. Historically, the rationale
behind government ownership has
stemmed from concerns that private
ownership would increase prices and
earn monopoly profits. Experience has
shown that regulatory regimes can
provide protection against the misuse
of such monopoly power.71 In particular,
independent regulators setting prices
based on efficient costs and market
returns provide similar incentives to deliver
the outcomes achieved in competitive
markets. In order for regulation to continue
to drive efficient outcomes, it is important
for the regulatory framework to evolve
over time where important lessons
learned are continuously incorporated into
developing an effective regulatory regime.
In addition to pricing, governments also
need to be mindful of protecting the public’s
interest on a range of issues, including, for
example, maintenance of service quality
standards, provision for a range of non-
commercial services which may have
been undertaken under public sector
ownership, environmental protection,
public safety and noise management.
These additional issues can be handled
through general industry-level regulatory
compliance or asset-specific requirements
that the new owner must comply with,
whether through their management plans
or licensing requirements. For a range
of non-commercial activities, an explicit
community service obligation contract has
proven effective, where the private sector
owner is compensated for undertaking
these activities.
The suitability of these assets for
brownfield recycling would vary
depending on different governments,
their regulatory and governance
structures, and the overall commitment
to user-pay principles. Brownfield
recycling should also only occur where
the proceeds from the transactions
exceed the retention value of the asset.
71 See Infrastructure Australia (2012, 2013) for more detailed discussion.

77
Handbook on Urban Infrastructure Finance
Dealing with the magnitude of
infrastructure spending needs in the
coming decades is daunting, but the issue
is much more serious for cities that must
take on the brunt of the responsibilities.
Innovations in urban infrastructure
financing are thus much needed, especially
along the dimensions that can mitigate the
critical funding and financing challenges
discussed earlier in this handbook.
On the funding side, tax revenues will
continue to be the primary funding sources
in the foreseeable future and innovative
approaches to draw upon these sources,
whether from value capture or developer
exactions, will be especially beneficial. In
addition, because user charges will play an
increasingly important role to supplement
tax revenues, cities need to rethink
innovative ways to engage users more
effectively in both defining and financing
the infrastructure needs. On the financing
side, the critical role of institutional investors
is now generally recognized and we need
innovative financing models to involve
them more directly and actively, especially
in greenfield projects. For smaller mid-
sized cities, their financing challenge will
be in establishing their own credibility in the
global marketplace. Their added challenge
would also be having projects of sufficient
size to warrant and attract substantive
investments. For them, working jointly with
other like-minded cities across multiple
jurisdictions will help build the credibility
they need. At a larger public policy
level, we also need innovative financing
approaches that are not all about financial
returns, but also address important issues
such as sustainability and social equity.
Innovative urban infrastructure
financing approaches identified below
are case examples that address
each of the above dimensions:
• Innovative value capture/developer
revenue approach: CEPAC bonds
(Brazil)
• User participation and user-investor
approach: Crowdfunding (various)
• Direct institutional investor
engagement in a greenfield project:
N-33 Road Project (Netherlands)
• Multi-jurisdictional and pooled
approach for mid-size cities: Local
Government Funding Agencies
(LGFA) (Scandinavian and other
countries)
• Socially responsible financing
approach: Green Bonds, Social
Impact Bonds, Carbon Tax/Cap-
and-Trade (various)
Chapter 4Innovations in Urban Infrastructure Funding and Financing

78
Innovations in Urban Infrastructure Funding and Financing
4.1 CEPAC Bonds: Additional
Revenue Source72
CEPAC (Certificados de Potencial
Adicional de Construção, or Certificates
for Additional Construction Potential) is
an innovative urban financing instrument
with features that combine value capture,
development exaction, and air right sale
approaches. CEPACs are bonds that are
issued by municipal governments for a
specific area within their cities designated
for redevelopment. The bonds are
targeted at developers (bond buyers)
and provide additional development
rights that entitle them to build above
the density limit specified by the current
zoning regulations (sometimes referred
to as “up-zoning”) for the designated area.
For cities, the proceeds from the bond
sales provide upfront funding to build
specific improvements, generally in the
transportation and affordable housing
sectors, in the designated area without
creating additional public debt. For
developers, CEPAC bonds provide
additional building licenses with guaranteed
improvements and flexibility to launch their
individual development projects according
to their own perception of the market.
Master planning for the designated area
is used to determine the improvements
needed and establish the upper limit of
the additional development density, e.g.,
in terms of floor area ratio (FAR), for both
residential and non-residential uses. Each
designated area is also subdivided into
smaller zones with their own FAR ceilings.
Offered in the stock market, CEPACs are
sold electronically through public auctions.
For a designated area, the number of
CEPACs offered has a maximum limit
commensurate with the upper limit on the
additional development density. On a given
auction, CEPACs have the same minimum
face value initially, but the final price is largely
determined by the supply and demand of
the market at the time of the auction. CEPAC
bonds are also tradable openly in secondary
markets as dictated by market demand.
CEPACs can be sold in private auctions,
which are targeted at contractors and
vendors in transportation, affordable
housing, and other infrastructure service
sectors. Effectively, the bonds sold
privately are used by cities as non-
budgetary funding to pay for contractors
and vendors that provide goods and
services associated with the improvements
in designated areas, be they to build or
renew infrastructure or build affordable
housing to remove or urbanize slums.
Because of the smaller subdivisions with
their own FAR ceilings, each purchased
CEPAC must be designated to a specific
plot of land where the additional building
right will be used. Once the FAR ceiling is
reached within the subdivision, a developer
72 For additional discussions on CEPAC bonds, see Sandroni (2010), Serva (2014), and WEF (2014).

79
Handbook on Urban Infrastructure Finance
cannot use their CEPACs in that zone
even if they are entitled to additional
development rights in the larger area.
The unit area of development associated
with each CEPAC bond may also vary
depending on the value of the land in each
subdivision. For example, where the land
is cheaper, a CEPAC may correspond to 3
square meters whereas, in more expensive
areas, it may be 1.5 square meters.
The concept behind CEPAC was developed
as early as in 1995 in Sao Paulo, Brazil, but
its use as a formal municipal infrastructure
funding tool was delayed until appropriate
federal law was passed in 2004. The tool
has since been used successfully by the
municipal governments of Sao Paulo, Rio de
Janeiro, and Curitiba. Over the last decade,
these three cities have been able to raise
almost $4 billion in bond proceeds to pay
for their urban redevelopment projects.
In Sao Paulo, CEPACs are tied to urban
redevelopment areas known as “urban
operations” or “UO.” A UO is a tool used by
the city government to effect a structural
transformation of a large urban area within
the city through a partnership between
public authorities and private developers.
It also involves the participation of
landowners, investors, residents, and other
stakeholders and has to be approved by
the city council. A critical element of UO is
incentive payments, established in the city
statute, that are directly tied to changes in
zoning indices, such as FAR, land use, and
footprints. These incentive payments are
used to pay for the needed infrastructure
and other public “interventions” that
trigger the transformation in the UO.
In 2004, the city government in Sao Paulo
approved the use of CEPAC bonds as the
incentive payment mechanism for two
of the five approved UOs, Faria Lima and
Agua Espraiada. Through multiple public
and private CEPAC auctions, these two
UOs were able to raise over R$1.6 billion
(US $800 million) in the first five years (see
Exhibit 14).73 The CEPAC revenues from
the two UOs were almost 60 percent of
the annual property tax revenues for the
city as a whole. The new residential and
commercial developments built with the
rights provided by CEPACs also contributed
to additional increment in property
revenue taxes for the city. Preliminary
estimates indicated that, in some cases,
the property tax revenue increment
could be as much as 4.4 times per square
meter when compared to the base case.
Building institutional capacity to administer
CEPAC bonds more efficiently was critical
to their success. For the two Sao Paulo
UOs, CEPACs were issued by a city agency
called EMURB (Empresa Municipal de
Urbanização). EMURB was in charge
of the overall management inside the
UOs, including setting the priorities for
investments in infrastructure and affordable
73 See Sandroni (2010) for more detailed discussion on Sao Paolo CEPAC auctions.

80
Innovations in Urban Infrastructure Funding and Financing
Exhibit 14: CEPAC Auction Results for Faria Lima and Agua Espraida UOs
Year
Faria Lima UO Agua Espraiada UO
Offered (No.
CEPACs)
Sold
(R$)
Price
(R$)Revenue
(R$)Offered
(No. CEPACs)
Sold (R$)
Price (R$)
Revenue(R$)
2004-Public-Private
90,000-
9,09124,991
1,1001,100
10,000,10027,490,100
100,00070,000
100,00016,899
300310
30,000,0005,238,690
2005-Public-Private
n.o.-
n.o.9,778
n.o.1,100
n.o.10,755,800
56,500n.o.
56,500n.o.
371n.o.
20,961,500n.o.
2006-Public-Private
10,000-
2,7296,241
1,1001,100
3,001,9006,865,100
180,000-
152,96922,657
370371
56,598,5308,405,747
2007-Public(1)-Public(2)-Public(3)-Private
156,730n.o.n.o.
-
156,730n.o.n.o.
72,942
1,240n.o.n.o.
1,240
194,345,200n.o.n.o.
90,448,080
50,000100,000167,781
-
50,000100,000158,773
77,330
411411411411
20,550,00041,100,00065,255,70331,782,630
2008-Public(1)-Public(2)-Private
83,788n.o.
-
83,788n.o.
2,500
1,538n.o.
1,725
128,865,944n.o.
4,312,500
186,740650,000
-
186,740379,650
36,113
1,100535411
205,414,000203,112,750
14,842,443
2009-Public(1)-Public(2)-Public(3)
-Private
100,00030,000
120,000n.o.
55,6121,521
120,000n.o.
1,7001,7152,100
n.o.
94,540,4002,608,515
252,000,000n.o.
73,500175,000
n.o.n.o.
73,50072,270
n.o.n.o.
616700n.o.n.o.
45,239,25050,589,000
n.o.n.o.
Total 545,923 825,233,639 1,483,401 799,090,243
n.o.: not offered.

81
Handbook on Urban Infrastructure Finance
housing linked to each CEPAC auction.
Banco do Brasil and Caixa Economia Federal,
the two largest federal banks in Brazil, were
in charge of preparing and executing the
auctions. Because CEPAC was a new financial
instrument, the involvement of these two
federal institutions made the auctions more
reliable and credible in the marketplace.
For cities that are interested in exploring
CEPAC as a potential funding instrument,
the actual CEPAC bond experience from
Faria Lima and Agua Espraiada UOs could
be useful. As shown in Exhibit 14, for
example, the success of CEPAC auctions
varied widely in issues sold in comparison
to issues offered. The timing of the auctions
and the amount auctioned have strategic
significance and a close examination of
real estate market conditions is important
to extract the maximum value from each
auction. In the first 5 years, the management
of the CEPAC auctions did not appear to
have been following a general strategic
plan as shown, for example, by an excessive
amount of bonds in the 2004 Faria Lima
auctions or by too few in the 2008 auctions
for both UOs. Although the initial prices for
CEPAC were fixed by law for each auction,
the prices also varied widely according
to the supply and demand at the time
of the auctions. These variations were
due to reasons that ranged from initial
market adjustments to a new product to
fluctuations in the real estate business
cycle.
4.2 Crowdfunding: Small Projects and P3 Equity Capital74
Coined by Michael Sullivan in 2006, the
term “crowdfunding” has evolved to refer to
the act of raising capital for a project from
individual investors (the crowd) through an
intermediary online platform. It is a concept
at the intersection of crowdsourcing75 and
microfinance.76 Crowdsourcing enables
firms to solicit the collective interests of
the crowd through an open call over the
Internet and utilize this wisdom to achieve
solutions to problems or outsource work.
Microfinancing instruments issue small,
unsecured loans to individuals for starting
or expanding businesses. Combining
aspects of these two concepts yields
crowdfunding—a method to establish the
connection between entrepreneurs, who
aim to raise capital, and novel investors,
who form an emerging source of capital
and are willing to invest small amounts,
through Internet-based intermediaries.
While concepts may differ slightly, all
crowdfunding models incorporate three
basic components: (1) the entrepreneurs
(the fundraisers), (2) the investors (the
crowd), and (3) the intermediaries (the
online platforms).
74 For overview and more detailed discussions on crowdfunding, see, for example, Gasparro (2015) and Farrajian
et. al. (2015).75 See Brabham (2008) for an overview and case examples of crowdsourcing. 76 See Manchanda et. al. for additional discussion on use of microfinance and crowdfunding for start-up financing
(2014).
82
Innovations in Urban Infrastructure Funding and Financing
Crowdfunding platforms vary greatly and
offer different opportunities. Whereas more
established platforms such as Kickstarter
and Indiegogo cater to a broad range of
projects, many new platforms, such as ioby,
Citizinvestor, Spacehive, and neighbor.ly,
are focused on crowdfunding initiatives
in the civic domain that cater to serving
the broader public good, including such
projects as parks, gardens, transportation
infrastructure, waste management, etc.77
Other platforms, such as Propellr,
CityShares, and Fundrise, cater to real
estate developments. All these platforms
vary greatly in their functionality, from those
that allow open posting to others that are
restricted to government entities. Some
provide flexible funding options while others
enforce stringent funding requirements.
For small municipal infrastructure
projects, civic crowdfunding platforms
have been especially useful as
demonstrated by the following examples:
• Transformation of an abandoned
train station into an underground
public park in New York
($150,000 raised on Kickstarter)
• Replacement of a community
center in Glyncoch, Wales
($66,000 raised on SpaceHive)
• Downtown bicycle-sharing program
in Kansas City, MO (over $400,000
raised on Neighbor.ly)
• Arapahoe Protected Bike Lane
project in City of Denver, CO
($36,100 raised on Ioby)
• The Hampline bike lane project in
Memphis, TN ($68,600 raised on
Ioby)
• The Liverpool Flyover urban
park in Liverpool, England
(£44,000 raised on Spacehive)
In the U.S., for example, more than 1200
civic crowdfunding campaigns have
been launched since 2010, raising over
$10.5 million. Of the campaigns that
were launched, 63 percent have been
successful at reaching or exceeding their
target amount. A majority of these projects
have been small with almost 80 percent
being under $10,000. Due to their small
size, these civic crowdfunding initiatives
have been most effective as a strategic
financing option for infrastructure projects.
For example, they have often been used as
a “last mile funding” for helping a mature
initiative reach its implementation stage.
Other strategic uses have included serving
as seed funding to create momentum
for the remaining fund to be secured or
as a matching fund to fulfill specific grant
requirements. For the City of Denver, for
example, crowdfunding was used as seed
funding to kick-start a mini-bond initiative,
which became a significant funding source
for over 300 projects in the city (see Box 4).78
For this initiative, the city built its own online
platform to administer the bond sales.
77 See Davies (2014) for more discussion on civic crowdfunding.78 See, for example, Reed (2014) and Stephens (2014) for additional discussion on mini bonds.

83
Handbook on Urban Infrastructure Finance
Denver caught the attention of the municipal funding world in 2014 when a $12
million public offering of “mini-bonds” were sold out within a single hour. The
sale was supposed to run for 5 days. The demand was so high and the cap was
reached so quickly that the city had to refund 375 orders.
The mini-bonds were tied to the $550 million municipal bond program called
“Better Denver.” The Better Denver Bond Program was passed by Denver citizens
as a ballot initiative in 2007 to invest in over 319 infrastructure projects that
improve, preserve, renovate, and build new roads, libraries, parks, city offices, and
other facilities related to health and human services, public safety, and culture.
The remaining $538 million in bonds was sold through traditional markets.
Recent financial policies have made it more difficult for banks to buy and sell
municipal bonds. In the U.S., FDIC regulations have been requiring big banks to
increase liquidity making them move away from municipal bonds in favor of more
liquid assets. As banking and financial regulations became more stringent for
buying and selling municipal bonds, Denver decided to offer a new type of bond
to attract investors.
Municipal bonds have traditionally been sold for $20,000, but Denver decided
to sell mini-bonds for $500 each. Two types of mini-bonds were sold: a 9-year
bond with a 50% maturity rate to yield $750 (4.26% return) and a 14-year bond
with a 100% maturity rate to yield $1,000 (4.8% return). Although the city is paying
more interest on these mini-bonds than traditional bonds by providing returns at
three times the typical bank rate (1.5%), the goal was to involve more residents in
infrastructure development, generate community enthusiasm about infrastructure
improvements, and demonstrate to the market that there is demand.
The sale of mini-bonds was limited to Colorado residents and, though the bonds
could be transferred to other owners, they could not be resold on other financial
markets. These measures were to ensure that the bonds, instead of going to
bankers on Wall Street, would be purchased by members of the community,
keeping the business local to the project.
Box 4: Denver’s Mini-Bonds Initiative and Crowdfunding Platform

84
Innovations in Urban Infrastructure Funding and Financing
This was not the first time that Denver used crowdfunding. Outside the Better
Denver program, the city had used crowdfunding platforms previously to fund
small infrastructure projects such as the Araphoe protected bike lane project.
Also, the sale of the mini-bonds in 2014 was not the first time for Denver. When
Better Denver passed in 2007, the city sold $8 million in mini-bonds over the
course of a week. In 2007, there was no on-line capacity and people had to visit
their banks or mail in their orders. The feverish excitement of the 2014 sales had
to do with the online ordering platform set up by the city. People were sitting at
home on their computer from 8 a.m. and the orders were processed very quickly.
Denver is also not the first city to offer mini-bonds, but the practice is still very
rare. Whereas other cities have used similar mechanisms to raise funds, the
Better Denver program is specific to public-focused assets. The 2014 mini-bond
program has been especially successful because local publicity and new financial
policies are forcing cities to think differently about traditional municipal bonds,
which was further enhanced by an efficient crowdfunding platform. The success
experienced by Denver demonstrate that mini-bonds through crowdfunding are
ripe to be replicated elsewhere.
Crowdfunding business models vary
widely from being a philanthropic source
of capital on one end of the spectrum to a
securities-based equity and debt source of
fundraising on the other. A diverse range
of funding and financing techniques have
been employed for different platforms,
including patronage donations, reward
based donations, pre-sales, traditional
lending, social-lending (lending without
interest), peer-to-peer lending (lower
interest rate), peer-to-business lending,
and equity crowdfunding (business
angels).79 Thus far, the predominant model
has been a patronage model, where
individuals donate into specific projects
without a financial return expectation.
For the most part, this model has been
successful in attracting larger donors and
political support for municipal projects, but
it is not necessarily a sustainable model.
A more sustainable alternative to the
patronage model is to implement a peer-
to-business model for both debt and equity
(similar to the Denver mini-bond initiative
on the debt side). In this case, the crowd
becomes a conglomerate of investors
79 See De Freitas et. al. for additional discussion on alternative crowdfunding platforms (2013).
85
Handbook on Urban Infrastructure Finance
and can reap the benefits of being an
equity or debt investor throughout project
implementation.80 Under this model,
crowdfunding can be an important source
of P3 equity capital that can help broaden
the pool of potential P3 equity investors. In
addition to the social and political benefits
of using crowdfunding, it allows the P3
concessionaires to increase their return by
reducing their common equity contribution,
which would free up their equity capital to
deploy across a broader portfolio of projects.
There are several other advantages
associated with using crowdfunded P3
equity. Because the crowdfunding is
provided by investors with social as well as
financial motivations, they may be willing
to accept a slightly lower rate of return
than institutional sources of capital. Also,
depending on the method of crowdfunding
employed, the securities offered would
not be restricted for re-sale, removing
liquidity risk and further reducing the rate
of return required on the equity. Because
crowdfunding offers investment to a
broad base of retail and small institutional
investors, the increased competition
puts further downward pressure on the
return required. These factors combine
to lower the overall cost of capital for the
P3 developer, which can then be passed
on to the public sponsor in the form of
lower availability payments or to the
public with reduced toll/fee structures.
One of the essential ingredients to make
crowdfunding successful in the P3 space is
the online platform that serves as the key
intermediary. Infrashares is an example of
such a P3 platform that exists today.81 An
online P3 crowdfunding platform must be
capable of managing all the transactions
accurately and efficiently, including pre-
qualifying investors, sharing project
information, performing transactions, and
keeping track of investment documents.
In addition to these basic functions,
as dictated by the new crowdfunding
regime, the online platform can be used
to disclose additional information beyond
what is currently necessary including
Public Offering Statements, Official
Statements for bonds, traffic and revenue
studies, audited financial statements,
and quarterly performance reports. The
online platform can also help facilitate
various offering strategies, including
multi-stage offerings—for example, first
to people who are users of the asset
followed by progressive offers to people
locally, nationally, and internationally.
Whether it is a small project or P3 equity,
the success of crowdfunding depends on
the timing and extent of citizen participation.
Crowdfunding has extensive reach because
it depends upon community engagement
and participation during the early stages of
infrastructure development. In a politically
stagnant environment, crowdfunding has
80 This approach is sometimes referred to as crowd-financing to distinguish from the patronage model.81 See: https://www.infrashares.com. Also, see Ross (2015) for more detailed discussion on using crowdfunding
platform for securing P3 equity capital.

86
Innovations in Urban Infrastructure Funding and Financing
the potential to increase political will to
support infrastructure development. Time
and again, citizen participation has been
used as a means to increase sustainable civic
decision-making. Individuals who provide
initial funding are in some ways “voting with
their dollar.” Also, because the majority of
funders are located within close vicinity
to the project, they have a vested interest
in the project as future users, thus helping
reduce the demand risks. Crowdfunding
can be used to engage and educate local
constituents throughout the infrastructure
development process. In short, social media
has created a new platform for individuals
and groups to communicate and organize
around causes. Capturing this collective
energy effectively would help implement
policies, strategies, and tools that can
achieve long term sustainable solutions
for the infrastructure funding problem.
4.3 Pension Funds in the Greenfield Space: N-33 Project in the Netherlands82
Infrastructure assets are well suited to
match long-term liabilities of institutional
investors, such as pension funds and
insurance companies. Once operational
stability is achieved, most infrastructure
assets generate stable, long-term cash
flows—some even inflation-linked83—
which are particularly attractive in
meeting their long dated liabilities.
Brownfield assets are often considered to
be more attractive than greenfield assets
because their maturity and operational
track record reduce many of the
uncertainties and key risks associated
with greenfield investments. Many of
the greenfield risks are perceived to be
construction related—for example, cost
overruns and delays and the political
and regulatory risks associated with new
construction. The risk of construction
cost overruns and delays has been
widely documented and researched for
publicly financed projects, but similar
research has not been available for
privately financed projects. A recent
study, however, found statistically lower
risk of construction cost overruns for P3
projects than for traditional procurement.84
There is an abundance of greenfield
projects in the marketplace because what
governments really need is new, growth-
stage, and major rehabilitation projects
involving new construction work. The
supply of brownfield projects, however, is
much more limited. The mismatch between
limited brownfield projects and the
high demand for brownfield assets
has been driving up brownfield prices,
exerting pressure on the returns
available for brownfield investors.
82 See Bennon et. al. (2015) for more detailed description of the N-33 case example.83 For example, rates on toll road concessions are often indexed to inflation and regulated electrical utility returns
are often inflation-linked.84 See Blanc-Brude et. al. for additional discussion on construction risks associated with P3 projects (2013).
87
Handbook on Urban Infrastructure Finance
While greenfield investments mean higher
risks, they also offer the potential for higher
growth and return. As with construction
risks, increasingly, additional research
and performance records in greenfield
investments are becoming available,
which can help investors more accurately
assess the risks and reduce uncertainty.
Recognizing the need to attract additional
private capital to new infrastructure
development, governments globally are
experimenting with policies to reduce
uncertainty and make investors more
comfortable with greenfield projects—and
many are targeting institutional investors
in particular.85
A case in point is a recent P3 project in
Netherlands that involved two large Dutch
pension funds, PGGM and APG, which
provided both the equity and debt capital
for a greenfield/growth infrastructure
project—and they did so directly without
going through financial intermediaries. The
project, called the N-33 road-widening
project, was specifically designed by the
Dutch government to be a pilot project
for institutional investors to provide senior
debt financing for an infrastructure project.
Dutch pension funds are among the largest
in the world. Today, there are 382 Dutch
pension funds with a total invested capital
of €950 billion, close to 170% of the Dutch
GDP. A large part of this amount is under
the oversight of only a few large pension
funds. In 2013, the Netherlands was the
fourth largest P3 market in Europe with
a total value of €1.2 billion. After having
weathered numerous elections and
changes in government, its P3 market now
enjoys broad political support and P3 is
seen as a viable infrastructure delivery tool.
A joint venture (JV) between Dutch
construction company, BAM, and Dutch
pension fund, PGGM, was awarded the N-33 P3 concession in August 2012, to design,
build, finance, and maintain the project
through an SPV. With €120 million (∼US$170
million) of capital value, the concession
was allowed for 2.5 years of construction
and 20 years of operation. The project
achieved financial close in November 2012.
The project was highly leveraged, with
a 91:9 debt–to-equity ratio. BAM and
PGGM together brought 9% of equity. The
remaining 91% was a construction loan
divided equally among three commercial
banks: Rabobank, KfW, and Bank of Tokyo-
Mitsubishi UFJ (BMTU). The construction
loan, however, was to be refinanced after
approximately three years, with the Dutch
pension fund, APG, buying 70% of the long-
term debt and the three banks retaining
30% of the debt refinanced as a long-
term project loan. The capital structure
of the N-33 project during and post-
construction are depicted in Exhibit 15.
85 See Della Croce et. al. for additional discussion on investment trends of large pension funds (2011).

88
Innovations in Urban Infrastructure Funding and Financing
160
140
120
100
80
60
40
20
0
180
$ M
ILLI
ON
30.3%
30.3%
30.3%
4.5%4.5%
3-Year Construction Loan ($M) 20-Year Take Back Loan ($M)
63.6%
9.1%
9.1%
9.1%
4.5%
4.5%
KfW, 51.2
Rabobank, 51.2
Bank of Tokyo -
Mitsubishi, 51.2
Equity - PGGM, 7.68
Equity - BAM, 7.68
Senior Debt - APG,
107.52
KfW, 15.36
Rabobank, 15.36
Bank of Tokyo
Mitsubishi, 15.36
Equity - PGGM, 7.68
Equity - PGGM, 7.68
Source: Bennon et al.
Exhibit 15: Capital Structure of N-33 P3 Project
The N-33 P3 concession was unique in the
sense that, in close coordination with the
government, pension funds were directly
and actively engaged in both the equity and
debt financing from the get-go. The pension
funds were the main driver in securing the
overall financing package for the project.
Their active engagement had direct bearing
on improving the overall efficiency of the
capital used on the project. In addition,
there were three key aspects of the P3
transaction that contributed to its success.
First, on the equity side, success was
attributed to the unique synergy between
BAM and PGGM. The BAM-PGGM JV was
formally created in 2011 as a longer-
term endeavor specifically to pursue P3
infrastructure projects in Europe. The JV
brought together the financing power of
PGGM and BAM’s expertise in building and
managing P3 projects in Europe. As of March
2014, the JV held investments in 10 P3 projects, including 4 in the Netherlands. The
forming of the JV was facilitated by BAM’s
lack of equity capital that was hindering the
growth of their P3 construction business
and PGGM’s ability to provide a stable
source of equity. For PGGM, the JV provided
a platform for direct project investments
that aligned with the environmental,
social, and governance (ESG) criteria of

89
Handbook on Urban Infrastructure Finance
their investment policy, while mitigating
construction risks by making BAM
financially responsible for construction
delays and overruns. The overall ownership
structure of the JV was 50-50 between
BAM and PGGM, but the revenues
from projects transferred to the JV
were shared 80% PGGM and 20% BAM.
Additional revenues BAM receives from
the construction on the projects are to
counterbalance BAM’s lower share of
concession revenues.
Second, on the debt side, APG’s early
involvement helped streamline both the
short-term and long-term capital structure
of the project. In the project-shaping phase
long before the procurement phase started,
the Rijkswaterstaat (executive agency of
the Dutch Ministry of Infrastructure and
the Environment in charge of roads and
waterways) closely coordinated several
Dutch pension funds, including APG, to
define terms that would incentivize them to
provide debt for an infrastructure project.
Among others, APG’s term included that
the availability payment from the Dutch
government be indexed to the country’s
CPI over the 20-year concession term.86
This essentially meant that the debt service
for APG’s long-term loan was inflation
linked, which helped APG to bypass using
such tools as interest-rate swap with very
high transaction costs. This term afforded
APG to offer long-term debt at a fixed rate
that was much lower than those offered
by commercial banks. In addition, APG’s
early commitment eliminated refinancing
risks, further reducing the interest rate.
Finally, all of these factors combined
effectively helped formulate an optimal
risk allocation strategy where specific risks
were allocated to those that were best able
to bear them. For example, APG took away
the refinancing risk from commercial banks,
the government took away the inflation risk
from APG, BAM took away the construction
risks, PGGM took away the early equity
risks, and commercial banks took away
greenfield risk through equity bridge
loans. In the end, such risk allocations
had the effect of reducing overall project
risk and hence the total project costs,
ultimately easing the burden on taxpayers.
4.4 Local Government Funding Agencies:
Multi-City Pooled Approach87
With urbanization and the declining fiscal
conditions of many national governments,
some level of decentralization in
infrastructure financing is necessary and
perhaps inevitable. For local governments,
there are several real challenges to this
decentralization. Local governments are
small entities and a large part of the
financial markets are closed to them. Many
cities lack financial expertise and discipline
in financial management. They also lack
86 The remaining 30% debt financing retained by the three commercial banks post-construction and the equity
payments were not inflation-linked.87 For more detailed discussions of LGFA, see Andersson (2014a, 2014b, 2014c).

90
Innovations in Urban Infrastructure Funding and Financing
creditworthiness because they have very
limited power to introduce and maintain
their own source of revenues, be they
taxes, user charges, or otherwise. In
many countries, the system of collecting
local taxes and charges are inefficient
and in need of improvement. There are
also issues of long-term predictability
and stability when it comes to transfers
from their national and state/provincial
governments, which is becoming
increasingly serious in many countries.
A Local Government Funding Agency
(LGFA) is an emerging concept that
addresses all of the above challenges. An
LGFA is a conduit for financial cooperation
between local governments. It is an agency
jointly owned by member cities, sometimes
with a minority ownership stake by the
national government. An LGFA’s primary
mission is to pool the borrowing needs of local
authorities and to issue bonds in the
capital markets. The proceeds of these
bonds are then on-lent to member cities’
local governments. An LGFA is in essence
a public benefit corporation created to
benefit member cities, and does not seek
to make profits. The process leading to
the creation of an LGFA supports the
building of local creditworthiness, helps
create local markets, and increases
transparency in local decision-making. It
has the potential to reduce financing costs,
transaction costs, and also risk exposure
resulting from increased diversification.
An LGFA is furthermore a self-regulating
entity in that it prohibits the individual
members from excessive borrowing.
LGFA is a proven concept in Scandinavian
countries and the Netherlands. The
idea is now spreading in other parts
of Europe and a growing number of
countries outside Europe are exploring
its applicability to their own needs.
Examples of existing LGFAs include:
• Kommunekredit in Denmark,
created in 1898, which all local
authorities have now voluntarily
joined, issues bonds routinely in
various capital markets and
now dominates the local
government credit market
• Kommuninvest in Sweden, created
in 1986 and in which over 90% of
all regional and local authorities are
members, has radically changed
the loan market for local
authorities, transforming it from
the former oligopoly system of
the past that was largely ineffective
• Munifin in Finland, created
in 1990 and guaranteed by the
Municipal Guarantee Board (MGB)
representing 99.95% of the
population, is a joint-stock company
where member municipalities
hold the majority ownership with
other shareholders that include
a local pension fund (31%) and
the national government (16%)
• Bank Nederlandse Gemeenten
(BNG) in the Netherlands, established

91
Handbook on Urban Infrastructure Finance
in 1914 as a specialized financial
institution owned by 406 municipalities (with 46.4%
stake), has 60% market share
of the Dutch municipal sector
Most of these existing LGFAs operate with
joint guarantee from its members, but
such guarantee has never been invoked
to date. In addition, all of them are AAA-
rated. In 2012, collectively, they were
able to issue bonds in a total amount
of over €70 billion in various capital.
In a number of countries in Europe and
elsewhere, the establishment of LGFAs is in
varying stages of development. In France,
Agence France Locale was created in late
2014 and the first bond issuance has been
planned since. In the U.K., the English Local
Government Association (LGA), together
with the Welsh LGA, is currently studying
the possibility of establishing an LGFA.
Beyond Europe, the New Zealand Local
Government Funding Agency (NZLGFA)
was established following a proposal at
the 2009 Jobs Summit for a collective
borrowing vehicle for the local government
sector. With the enactment of the Local
Government Borrowing Act 2011, the
NZLGFA has since been incorporated as a
limited liability company with an ownership
structure comprising the New Zealand
Government (20%) and 30 local councils
(80%). In Australia, the Municipal Association
of Victoria has taken an initiative to create
a funding vehicle for cities and local
governments within the state of Victoria.
A Local Government Funding Vehicle
(LGFV) has since been established with
the participation of 30 local councils. The
IFC has recently commissioned a pre-
feasibility study for similar pooled local
financing mechanisms in South Africa.
Local authorities lack financial expertise
in many countries because their primary
focus is often on providing basic services
to the public. In addition to direct financing
benefits, an LGFA can play an important role
in the transfer of knowledge in the areas of
financing, legal matters, and other general
administrative issues related to financing
and financial management. Communication
is one of the most important functions of an
LGFA because of its role as the interpreter
between international financial markets
and local authorities. Knowledge transfer
can often be accomplished effectively
through the LGFA’s governance structure
that combines financial expertise with
a thorough understanding of the local
governments and their political culture.
For both Kommuninvest in Sweden and
Agence France Locale in France, the
governance structure is organized in
two separate levels. The upper level
represents the parent company where
local authorities are shareholders and
where local politicians serve on the Board.
The lower level is structured as a limited
company where all financial transactions
are carried out and where professionals
with financial and public sector experience
sit on the Board. To encourage knowledge
92
Innovations in Urban Infrastructure Funding and Financing
transfer, continuous dialogues between
the two levels are carried out through both
formal and informal means. Kommuninvest,
for example, works actively to promote
knowledge transfer using training programs
for local politicians, annual seminars,
member consultation conferences, and
other events and activities designed for
exchange of information about financial
market conditions and trends, best market
practices, etc. Kommuninvest also has a
Credit Research & Financial Committee
responsible not only for monitoring the
financial status of member municipalities,
but also for spreading awareness of
critical urban financing issues of the day.
The establishment of an LGFA can occur
over time and can be formulated in multiple,
progressive stages. As a start, a group
of cities can coordinate their borrowing
activities and exchange best practices.
This can include using similar procurement
processes in relation to banks and other
creditors or having a joint head of finance to
further coordinate their financial activities.
The next step, which was used prior to
the creation of Agence France Locale in
France, can be a “club” deal where a bond is
issued jointly by two or more cities without a
formal vehicle where each participating city
is responsible for their part of the payment.
Finally, the last step is to formally create a
special purpose vehicle (SPV) to serve as
an intermediary between the cities and the
capital market. The SPV can employ financial
experts to run operations and further
reduce risk. The big advantage with an SPV
is that it can reach sufficient volumes to
diversify its funding operations and achieve
cost-efficient pricing in the capital markets,
not relying on one source of funding or
one market. To be effective and credible
in the marketplace, such SPVs must have
the financial strength and creditworthiness
supported by capitalization and reinforced
by guarantees. The guarantors can either be
the participating cities, central government,
a third party (e.g. public sector pension
funds), or any combination of these entities.
The advantage of having a guarantee from
the participating cities is that it reinforces
the local responsibility for the SPV.
For those cities interested in exploring
the LGFA concept, especially in the
developing world, consideration should
be given to the following factors that are
vital to creating a well-functioning LGFA:
• Relationship between local
authorities and national government,
both legally and financially
• Flow of income (e.g., taxes) and
issues related to stability,
predictability, diversification, trends,
system for collection, collection
rates, and possibilities to
tap into new local taxes
• Local budget and cost structure and
issues related to management and
control

93
Handbook on Urban Infrastructure Finance
• Current debt level, interest
payments, maturities, payment
record, and national government
restrictions
• Institutional considerations such
as responsible organizations,
accounting system, audit, and
level of knowledge and skills
4.5 Socially Responsible Financing
4.5.1 Green Bonds88
A green bond, like any other bond, is
a fixed income debt instrument where
capital is raised through the debt capital
market. The key difference between
a “green” bond and a regular bond is
that the issuer publicly states that the
bond proceeds are used to fund “green”
projects, assets, or business activities with
an environmental benefit, be it renewable
energy, low carbon transport, forestry,
or others that mitigate climate change.
The first green bond was issued as the
Climate Awareness Bond in 2007 by EIB,
followed closely by the World Bank’s
Green Bond in 2008. From 2007 to 2012,
all green bonds issued were by IFIs or
national governments in the public sector,
which collectively raised US $10.4 billion
over that period. The green bond market
more than tripled between 2013 and 2014
from $11 billion to almost $37 billion, in
part due to the sharp increase in private
sector issuers. In 2014, corporate green
bonds issued by companies in energy and
utilities, consumer goods, and real estate
sectors accounted for a third of the market.
The market size was projected to increase
even further to $100 billion in 2015.
Green bonds offer a number of benefits.
They can give issuers access to a broader
range of investors than regular bonds or
other asset classes, including institutional
and other investors with ESG investment
policy requirements. The repayment of the
bonds is tied to the issuer rather than the
success of the green projects, which may
be perceived to have higher risk of non-
repayment. Increasing demand for the
bonds is also likely to drive increasingly
favorable terms and a better price for
the issuer, compared to a regular bond.
Green bonds can enhance an issuer’s
reputation and can serve as an effective
way to demonstrate its commitment
to the environment and to improve
its own environmental performance.
These benefits need to be weighed
against potential drawbacks. The
processing and other administrative costs
associated with a green bond could be
greater, which could include additional
tracking, monitoring and reporting
processes, as well as up-front cost to define
the bond’s green criteria and sustainability
88 For more detailed discussion of green bonds, see KPMG International (2015) and Smart City Council (2014). In
addition, see Long Finance (2015) and Von Gutten et. al. (2014) for discussions focused on sustainable financing
approaches.

94
Innovations in Urban Infrastructure Funding and Financing
objectives. Investors may also seek penalties
for a default, whereby a bond is paid in full,
but the issuer breaks agreed-upon green
clauses. Because there are currently no
standardized criteria for what makes a
bond “green” and no strict requirements
for tracking or reporting on proceeds,
many issuers are subjected to criticism for
“greenwashing” and accessing the green
bond market without proper credentials.
In the public sector, green bonds have been
used predominantly by IFIs and national
governments, where bond proceeds are
passed onto finance projects at state/
provincial and local government levels.
The World Bank, for example, has thus far
issued about $8.5 billion, some of which are
used to support local projects that address
climate change. The State of California
purchased $300 million of World Bank
green bonds in 2009 not only to support its
commitment to climate change, but also as
a sound investment strategy for the state.
Although still rare, some state/provincial
and local governments are beginning to
issue green bonds to secure the financing
they need, including infrastructure. In 2013,
for example, the State of Massachusetts
became the first U.S. state to issue green
bonds to fund many of their energy
efficiency projects. Interestingly, the state
issued both regular and green bonds at the
same time with the same price, yet the green
bond was oversubscribed by 30% whereas
the regular bond was undersubscribed.
At the local level, Gothenburg, the second
largest city in Sweden, became the first
city in 2013 to pioneer the use of green
bonds in the Nordic region to support
various environmental projects in public
transport, water management, energy,
and waste management sectors. The city
was supported by Skandinaviska Enskilda
Banken (SEB), which facilitated the bond
issuance. SEB also helped design the World
Bank Green Bond. More recently, the City of
Johannesburg issued the first green bond
in South Africa to raise R1.5 billion (US$143 million).89 The bond was priced higher than
their regular bond and was oversubscribed
by 50%. The proceeds are to be used to
fund their Bio Gas to Energy project, Solar
Geyser Initiative, dual-fuel buses, and many
other projects that are critical to reducing
the city’s greenhouse gas emissions.
4.5.2 Social Impact Bonds90
A social impact bond (SIB), also referred to
as Pay for Success or Social Benefit Bond, is
an innovative performance-based financing
tool that enables governments to pay for
only those programs that deliver. In an SIB
agreement, the government sets a specific,
measurable outcome that it wants achieved
(typically of social benefits in nature)
89 See, for example, Kidney (2014) and C40 Cities (June 12, 2014 blog) for additional information on Johannesburg
green bond issuance.90 For additional discussion of social impact bonds or pay-for-success approach, see Macomber (2016), Smart
Cities Council (2014), and social impact bond series by Center for American Progress available at:
https://www.americanprogress.org/series/social-impact-bonds/view/.

95
Handbook on Urban Infrastructure Finance
for a given population (beneficiary) and
promises to pay an external organization
(intermediary) if, and only if, the organization
delivers the outcome. Investors provide the
working capital for the intermediary to hire
and manage service providers. A third-party
independent evaluator determines whether
the beneficiary population has achieved
the outcome. If the performance outcome
is achieved as agreed, the government
releases an agreed-upon sum of money
to the intermediary, which then repays its
investors with a return for taking on the
upfront risk. If the outcome is not met, the
government is not on the hook, and the
investors do not get repaid (see Exhibit 16).
$
$
Beneficiaries
Service Providers
Intermediary
Government Agency
IndependantEvaluator
Investors
Exhibit 16: Social Impact Bond Structure
SIBs are a type of bond that is not a fixed-
income debt instrument like a regular
bond because they do not offer a fixed
rate of return even though they operate
over a fixed period of time. Because the
repayment to investors is “at risk” contingent
upon specific outcomes being achieved,
they work more as an equity instrument.
A development impact bond (DIB) is a
variation of SIB used in developing countries
to achieve improved social outcomes using
a similar financing approach, where the
investors are either donors like IFIs, host
governments, or a combination of the two.
Because of their at-risk nature, SIBs are
not for all investors. They have been used
primarily to address social issues and fund

96
Innovations in Urban Infrastructure Funding and Financing
programs such as public safety, prison
rehabilitation, homelessness, workforce
development, and preventive healthcare
programs. They are most appropriate for
projects where (a) outcomes can be clearly
defined and historical data are available,
(b) preventive interventions exist that cost
less to administer than remedial services,
(c) some interventions with high levels of
evidence already exist, and (d) political will
for traditional direct funding is difficult to
sustain.
The SIB concept is still new, but beginning
to generate significant interest from
countries like the U.K., U.S., Australia,
and Canada. Although national or state/
provincial governments have led most SIB
programs, there are some that have been
led by city governments. In 2012, for
example, the City of New York issued
$9.6 million in SIBs for a prisoner
rehabilitation program. While the city did
not put up the up-front capital, Goldman
Sachs bought the bond (investor) and
Manpower Demonstration Research
Corporation (MDRC) was chosen to run
the program (intermediary). The Osborne
Association was selected as the service
provider with independent evaluation
to be performed by the Vera Institute of
Justice. If the goal of reducing recidivism
was met, the city would repay Goldman
Sachs, presumably from the savings
associated with the reduced recidivism.
The use of SIBs to finance “hard”
infrastructure projects have been limited
thus far, often only as a part of a larger
social program. In 2013, for example, the
U.S. Department of Housing and Urban
Development (HUD) encouraged the use of
Pay for Success when it provided $5 billion
in grants to assist post-Katrina rebuilding
efforts. The State of Massachusetts also
used Pay for Success to address its larger
homelessness issues, where a small part was
dedicated to providing additional housing.
Although its use is still largely in the testing
phase, SIBs can potentially be a powerful
tool to finance infrastructure projects, in
particular, social infrastructure, such as
prisons and public healthcare facilities, or
to improve infrastructure services in the
operations and maintenance phase. Some
industry experts suggest a broader use of
SIBs in infrastructure financing, where a
risk bearing financial arrangement between
public, private, and non-profit organizations
can be established to unlock foundation,
philanthropic, and NGO investments.91 Such
arrangements could potentially unleash
$18 trillion of cash reserves currently
held by corporations that are sitting on
the sideline. Recently, for example, the
Indian government passed legislation
requiring large companies to spend at
least 2% of their annual profits on corporate
social responsibility. In lieu of financial
returns, a broader application of SIBs in
91 See Macomber (2016) for additional discussion on unlocking philanthropic and other non-profit funds.

97
Handbook on Urban Infrastructure Finance
infrastructure financing can target specific
performance outcomes—such as reduction
in commuting time, reduction in the rate of
urban pollution per unit of GDP, or increase
in uptime for electricity in urban areas—
that are much more meaningful to cities.
4.5.3 Carbon Tax and Cap-and-Trade
Carbon tax and cap-and-trade are two
funding mechanisms that specifically
address pollution and global warming.
The revenues therefrom are used to fund
energy, transport, and other infrastructure
projects that address greenhouse gas
emissions and other related environmental
issues. In some cases, the aim is to create a
revenue-neutral situation where revenues
are returned back to the taxpayers,
or used to reduce other discretionary
taxes to improve overall tax efficiency.92
Compared to cap-and-trade, carbon tax
is more straightforward and is a tax on
the emissions caused by the burning
of coal, gas, and oil aimed at reducing
the production of greenhouse gases.
A variation on carbon tax is an energy
tax, which is charged directly on energy
commodities and effectively increases
the energy price uniformly regardless
of the emissions produced. Carbon and
energy taxes started to take effect as a
result of the United Nations Framework
Conventions on Climate Change in 2001.93
Although many countries have explored
implementation of carbon taxes with
much political debate, only a handful of
countries—e.g., India, Japan, Australia94 —
have been able to adopt the tax scheme
as a matter of national policy. In Europe,
several countries introduced energy taxes—
e.g., Germany, the U.K.—but all failed to
introduce uniform carbon taxes. In the U.S.
and Canada, the implementation has been
at state/provincial and local levels. In the
U.S., for example, the City of Boulder was
able to pass the first municipal carbon tax in
2006.95 The tax was manifested in electricity
utility bills with deduction for using
electricity from renewable energy sources.
The revenues were used for citywide
programs that reduced greenhouse gas
emissions. The nine-county San Francisco
Bay Area in California was also able to
pass a carbon tax measure in 2008, as was
Montgomery County in Maryland in 2010.96
A cap-and-trade program97 is a
government-mandated, market-based
approach used to control pollution
by providing economic incentives for
achieving reductions in the emissions
of pollutants. A “cap” sets a maximum
92 See Smith (2008) for additional discussion on carbon and other environmentally related taxes.93 See Bashmakov et. al. (2001) for additional discussion of the 2001 UN Framework Conventions on Climate
Change.94 In Australia, federal carbon tax was introduced in 2012 but it has since been repealed and abolished in 2014.95 See, for example, http://www.nytimes.com/2006/11/18/us/18carbon.html?_r=0. Also, see Climate Action
Plan Tax, City of Boulder, Colorado96 See, for example, San Francisco Chronical May 22, 2008, article on ‘‘Air Quality Board to Fine Bay Are Polluters.’’97 See AASHTO, Lazo (2014), and C40 (2013, 2014) for additional discussion of cap-and-trade programs.

98
Innovations in Urban Infrastructure Funding and Financing
allowable level of pollution and penalizes
companies that exceed their emission
allowance. The allowances are based on a
finite number of permits for emissions that
government issues. Some companies can
choose to reduce their pollution to match
their number of permits whereas others
may find it more difficult. “Trading” lets
companies buy and sell allowances, leading
to more cost-effective pollution cuts, and
incentive to invest in cleaner technology.
Since 2005, the European Union (EU)
has operated the largest cap-and-trade
program, but the program has struggled
as the auction prices of the permits have
fluctuated widely and crashed on more than
one occasion. This has led to an oversupply
of permits and few incentives for companies
to alter their behavior. At a regional level,
the Regional Greenhouse Gas Initiative in
the northeast region of the U.S. covering
nine states has a more limited cap-and-
trade program focused on the power sector.
At the city level, the Tokyo Metropolitan
Government (TMG) was the first city in the
world to launch a municipal cap-and-trade
program in 2010.98 The program was focused
on CO2 reductions in large commercial,
government, and industrial buildings in
Tokyo. With the active engagement of
building management and tenants, the
city was able to find solutions that reduced
energy use and carbon emissions. The
city was able to achieve its commitment
to ambitious emission reduction targets
within a short period of time, with over
90% of the buildings meeting the target
well ahead of time. In China, the City of
Shenzhen also launched its own carbon
trading market in 2013 under the Chinese
Certified Emission Reduction (CCER)
program.99 The program involved 635 key
companies (representing 26% of the city’s
GDP) and 197 large public infrastructure
facilities committed to reducing carbon
emissions from their operations.
Besides meeting the carbon emission
reduction goals, a long timeframe is
generally required for collection of
any revenues from the cap-and-trade
system. The State of California has been
unique in this regard. The state has been
able to set up a working cap-and trade
auction program that not only targets
emission reductions, but has already
collected $2.3 billion in revenue, $250 million of which is specifically earmarked
for the state’s high-speed rail project.
California has long been an environmental
leader and, as early as 2006, adopted
legislation that required a massive
reduction in greenhouse-gas emissions.
It chose a cap-and-trade system because
it was more effective, but also because
the alternative, a carbon tax, would have
required a two-thirds vote in the legislature.
Large businesses in the state—those that
emit more than 25,000 tons of CO2 a year
98 See, for example, C40 Cities (2014) for additional discussion of Tokyo cap-and-trade program.99 See, for example, C40 Cities (2013) for additional discussion Shenzhen cap-and-trade program.

99
Handbook on Urban Infrastructure Finance
covering nearly every industry, including
refineries, food processors, manufacturers,
and utilities—have to get permits from the
state for those emissions, a majority of
which are given out free. To distribute the
rest, the state has been able to develop a
working auction system, including setting
a minimum price to avoid the collapsing
of the auction as experienced in the EU.
Since November 2012, there have been
eight quarterly auctions. At each auction,
two pools of allowances have been sold,
one controlled by the utilities (which get all
of their allowances for free) and the other by
the state. About 10% of the state-controlled
allowances are sold directly to businesses
that need them, while the rest are given
away. The $2.3 billion of allowances that the
state has been able to sell thus far goes into
its Greenhouse Gas Reduction Fund, which
supports projects that reduce pollution,
including the $68 billion high-speed rail
system currently underway. A quarter of
all future revenue from the fund is also
earmarked for the high-speed rail project,
with the rest going toward a variety of
legislative priorities that include affordable
housing, public transit, water conservation,
and other infrastructure projects. The
utilities are required to spend their
proceeds on things like alternative or
renewable fuels, or by giving relief
to their customers.

100
Handbook on Urban Infrastructure Finance
This handbook is the culmination of the
Financing Urban Infrastructure Initiative
launched by the New Cities Foundation in
2015. The primary aim of the initiative was
to address critical infrastructure financing
issues and challenges facing cities today as
they undergo rapid urbanization. Through
this handbook, we aimed to provide a set
of practical guidelines that can help cities
become smarter in the urban infrastructure
finance space and respond more effectively
and timely to the basic infrastructure service
needs of their citizens and businesses.
At its best, infrastructure serves
communities at large and embodies
public goods and services. In this regard,
this handbook was written for the public
sector. Many infrastructure assets such
as energy utilities are already in private
hands and, though continuously evolving,
their financing market is mature and less
problematic. The most critical infrastructure
financing challenges in cities are those
assets in the public domain. The financing
approach here largely relies on grants,
subsidies, transfers, taxes, and other sources
that are unsustainable in the long run.
This handbook was written primarily for
mid-size cities in the emerging world where
most of the urbanization and growth are
taking place and where infrastructure
financing challenges are most daunting.
Most likely, these mid-size cities and local
governments have limited financial savvy
and knowledge in what is available in
the marketplace. Rather than providing a
laundry list of the state-of-the-art
financing tools and instruments or
detailed case studies of a select few,
this handbook focused on the basic
concepts underlying the myriad financing
vehicles available today so that they are
understood in proper context. These basic
concepts are intended to help cities and
local governments better navigate the
complex world of infrastructure financing.
In explaining the basic concepts, we
emphasized the important distinction
between financing vs. funding.
Infrastructure financing in essence is
raising the high upfront costs to build the
infrastructure when and where needed by
leveraging future revenue streams that can
repay the upfront costs. Financing is the
raising of this upfront capital to expedite
the process. Funding is the revenue
streams in the future to repay the financing.
On the financing side, focusing on
infrastructure assets in the public domain,
we provided two broad categories of
financing: public sector vs. private sector
financing (Chapter 2). Among others, the
most prevalent financing vehicles available
for cities for public and private sector
Chapter 5 Summary, Conclusions, and Afterthoughts

101
Summary, Conclusions, and Afterthoughts
financing, respectively, are municipal
bonds and public-private partnerships
(P3). Although less prevalent outside the
U.S., municipal bonds are a robust urban
financing tool that should be considered
more seriously by cities around the world.
Likewise, although at times subject to
political controversy, P3 is continuously
evolving and can be an effective tool in
engaging large private sector capital,
especially for major infrastructure projects
that are complex and require innovations.
Whether publicly or privately financed, we
emphasized the increasing and critical role
of institutional investors in infrastructure
financing with their patient and long-
term capital. We also emphasized the
importance of support from national/
state governments, international financial
institutions and development banks (so
called IFIs), especially in providing credit
enhancements and financial leveraging tools
that help reduce financing costs for cities.
On the funding side, there is no free
money and the buck ultimately stops with
taxpayers and users. Cities must rely on
tax revenues and user charges as the two
primary funding sources they can leverage
to secure financing (Chapter 3). For tax
revenues, value capture and developer
exactions are two effective taxing
approaches that can be used by cities. For
many cities in the developed world, these
two approaches are largely within their
current taxing authority without requiring
major tax reforms. Increasingly, tax
revenues must be supplemented with user
charges, especially for infrastructure assets
in the public domain. User charges are a
much more sustainable funding source
and are the key to unlocking private capital.
Better quality service, more service options
catered to specific users, user vouchers,
and automated payment collection
systems are potential solutions that help
incentivize users and their willingness to pay.
There is, however, a limit to how much
taxpayers and users can take on to pay
for infrastructure. In this handbook, we
presented brownfield recycling as a
potential solution to addressing the daunting
funding gap issue. Brownfield recycling is
the leveraging and monetization of existing
brownfield assets through long-term
leases or asset sales that use the proceeds
therefrom to fulfill infrastructure funding
needs. This is one of a few options that begins
to address the sheer magnitude of the
funding gap and as close to unencumbered
funding as possible without repayment
obligations. Although brownfield recycling
can sometimes be mired in political
controversy, there is sufficient evidence
to prove that wider public acceptance
is possible if there is a clear mandate on
the use of the proceeds to reinvest in
infrastructure, credible institutions such
as public pensions are involved on the
buyer side, and a clear regulatory regime
is established to protect social objectives.
Infrastructure development is a long-
term endeavor and addressing funding

102
Handbook on Urban Infrastructure Finance
and financing issues is only a part of the
equation. They must be accompanied
by institutional know-how and proper
governance structures to carry the efforts
to fruition (Appendix A). Cities need the
basic institutional building blocks—
policies, regulations, enabling institutions,
procedures and guidelines, and resources—
to ensure that financing terms are honored
so that investors can keep coming back. In
particular, cities need the most help in the
early project preparation stage where their
visions are translated into specific projects
they can take to the investors. IFIs and NGOs
have been playing a critical role in providing
the necessary support in this regard.
When private sector financing is involved,
especially for P3 undertakings that are
often complex, cities also need P3 capacity
building at multiple levels of governments.
With the changing urban landscape, new
urban governance forms are also emerging
that can facilitate infrastructure delivery
and financing. The “smart city” is one such
emerging form which is propelled by
technology, but with the larger goals of
enhancing the quality of urban services,
reducing resource consumption, and
engaging more effectively and actively
with citizens. Smart city concepts are fast
becoming a requisite to critical urbanization
policy discussions and no conversation
about cities can now takes place without
considering their “smartness” in one form or
another. Much of the dialogues have been
focused on technology. This handbook also
offers potential financing approaches to
key smart city concepts being considered
by many cities today (Appendix B).
With infrastructure spending needs almost
at 5 percent of gross world product every
year from now to 2030, we are facing a
global infrastructure financing crisis. This
is a big problem that cannot be solved by
business-as-usual. We need a collective
effort to solve the big problem and each
stakeholder plays an important role.
The most critical gap at this juncture is in
“development financing,” i.e., financing
greenfield projects that stimulate new
growth and new developments, which
have generally been perceived to be
risky in the financial community. Some
countries, such as Singapore, have made
an effective use of their sovereign wealth
funds in the past to carry out their critical
national development agenda, but such
efforts have been limited.100 IFIs, national
governments, and institutional investors
need to work together to streamline this
development finance. More specifically,
IFIs and national governments need to
provide short-term early risk capital and
institutional investors need to commit their
stable low-cost capital for the long-term
from the project get-go. For cities and local
project sponsors, such streamlining would
reduce overall financing costs significantly.
100 See Dixon et. al. (2014) for the emerging role of sovereign development funds.

103
Summary, Conclusions, and Afterthoughts
Direct and active engagement of public
pensions and other key institutional
investors cannot be stressed enough,
especially for major strategic infrastructure
projects that have larger economic and
social impacts. This view is consistent with
the current global trend where, instead of
going through third-party fund managers,
institutional investors, in particular public
pensions, are intersecting more directly
with local infrastructure financing activities.
Shared liabilities in these situations have
proven to create inherent synergies between
the governments and public pensions
for the greater benefit of the public, as
demonstrated by the N-33 Road Project in
the Netherlands. Public pensions are better
positioned to mitigate some of the political
concerns about private investor involvement
because their interests are considered
better aligned with those of the public.
From the standpoint of the global
investment community, infrastructure
investments currently lack proper
benchmarking. The infrastructure asset
class is all over the map in terms of risk-
return profiles. It is a hybrid class where
assets that behave like fixed income (e.g.,
energy utilities) are lumped together with
those that behave like private equity (e.g.,
privatized airports) or like real estate (e.g.,
new greenfield toll roads) into a single
asset class. Too many benchmarks – or
a lack thereof – sometimes create ill-
founded return expectations from private
investors and their fund managers trying
to meet those expectations. Through
better and proper benchmarking, where
appropriate, private investors need
to temper their return expectations in
the infrastructure investment space.101
National and state/provincial governments
need to embrace the global urbanization
trend fully. They need to help establish
coordinated inter-urban growth strategies
with specific incentives that are designed
to facilitate and encourage decentralization
and fiscal self-reliance of the cities.
Where appropriate, national and state/
provincial governments should also
explore using cities and urban settings as
venues to test key national infrastructure
reform strategies that are more difficult
to implement at the national scale.
To the extent feasible, local governments
need to become more self-reliant fiscally.
Moreover, they need to become smarter and
more financially savvy. This handbook offers
some of the means that can help cities do so.
Instead of relying on national governments
and private sector experts, cities need to
be at the forefront in developing their own
infrastructure financing solutions. They
101 As part of a new OECD-G20 Initiative, EDHEC Risk Institute in France is developing a new method of
benchmarking infrastructure assets, which will including identifying sub-categories, standardizing data
collection and performance reporting system, and developing valuation and risk measurement benchmarks
for these subcategories for better decision-making. See Blanc-Brude et. al. (2013) for additional discussion of
the new benchmarking methodology.

104
Handbook on Urban Infrastructure Finance
need to be proactive in involving multiple
stakeholders early on, coming up with
creative and innovative ideas themselves,
designing projects that are bankable, and
marketing them actively and globally.
Cities interface directly with taxpayers and
users. As the local infrastructure project
sponsors and service providers, they also
have a better understanding of the risks
involved in delivering infrastructure projects
and services on the ground. When the
private sector is directly involved in financing
and delivering infrastructure facilities and
services, such as in the P3 model, it too
has the opportunity to interact closely and
directly with the user community, be they
individuals or businesses. Along with local
governments, the private sector must
strive to better understand user needs
and develop innovative approaches to
improve the service quality that caters to
these needs. Together, they must create
a new infrastructure value paradigm for
users and cultivate the user-paying culture
and users’ willingness to pay. They need
to jointly develop sustainable financing
strategies that balance tax revenues with
user charges and address both economic
efficiency and social equity issues.
Most importantly, taxpayers and users
must recognize that, like everything else,
they are the ones who will have to pay for
the infrastructure in the end. They have
to recognize that the choices ultimately
come down to these: either they pay taxes
or user charges or they will get no service
at all. Taxpayers and users need to be
better informed about the infrastructure
financing and funding pictures of their
cities. They must be actively engaged in
the civic decision-making process. Their
inputs will provide essential ingredients
not only in developing well-functioning
infrastructure facilities that are sustainable
in the long run, but also in envisioning next
generation infrastructure systems that are
robust, agile, and that fit our modern ethos.
Moving forward, cities would be better
served knowing global best practices
and emerging new ideas. Innovations in
urban infrastructure financing are much
needed, especially for cities that must
take on the brunt of the infrastructure
provision responsibilities. We identified
several innovative urban financing
models that specifically mitigate the
critical funding and financing challenges
discussed in this handbook (Chapter 4).
Notably, CEPAC bonds used prevalently by
cities in Brazil provide innovative means to
obtain additional revenue sources, where
future development rights are traded as
options in the capital market. Crowdfunding
encourages civic engagement through a
user-investor approach and provides much
needed funding for small civic-oriented
projects, such as bike lanes and urban
parks. It is also emerging as an additional
source of P3 equity capital with lower return
requirements, savings of which can be
passed onto the users. Local Government
Funding Agency (LGFA) is a multi-city pooled

105
Summary, Conclusions, and Afterthoughts
approach proven effective in Scandinavian
countries that enables cooperation between
cities to build their own financial credibility
in the global marketplace and increase
their borrowing capacity. Many other
socially responsible financing approaches
have been emerging in recent years. Select
cities around the world are using green
bonds, carbon tax, and cap-and-trade to
fund infrastructure projects that address
climate change, global warming, and other
sustainability issues. Social impact bonds
are an innovative financing instrument that
relies on performance rather than financial
returns to address critical social issues that
cities face, such as public safety, affordable
housing, work force development, and
public healthcare. Although still new,
they offer a potential venue to unleash
the large pool of philanthropic funds for
infrastructure purposes. Through an N-33
road project example in the Netherlands, this
handbook demonstrated an effective way
to directly engage institutional investor to
improve infrastructure financing efficiency.
These and other emerging and innovative
financing models, along with the solid
understanding of the basic concepts
underlying them as presented in this
handbook, are at cities’ disposal to tackle
the infrastructure financing challenges
they face today and in the future.

106
Handbook on Urban Infrastructure Finance
Institutions and governance matter when
it comes to infrastructure financing,
especially when private investments are
involved. According to the World Bank,
there are six key governance indicators:
voice and accountability, political stability
and absence of violence, government
effectiveness, regulatory quality, rule
of law, and control of corruption.102
As a point of reference, two are depicted in
Exhibit A.1 for different countries across the
world. Though indirectly, these indicators
have some bearing on the cost of capital
when cities try to secure infrastructure
financing from the global marketplace.
Infrastructure development is a long-term
endeavor and addressing funding and
financing issues is only a part of the equation.
They must be accompanied by institutional
know-how to carry the efforts to fruition.
Cities need the basic institutional building
blocks—policies, regulations, enabling
institutions, procedures and guidelines, and
resources—to ensure that financing terms
are honored so that investors keep coming
-2.50 -2.00 -1.50 -1.00 -0.50 0 0.50 1.00 1.50 2.002.50
Governance Score
GovernmentEffectiveness
Control of Corruption
NigeriaCambodia
Bangladesh
Uganda
IndiaZambia
Source: World Bank (2011)
Ghana S.Korea PortugalU.S. U.K.
Chile Canada Australia
NigeriaBangladesh
CambodiaZambia
Uganda
Ghana
India PortugalChileS.Korea
U.S.
U.K.
AustraliaCanada
Exhibit A.1: Governance Indicator for Different Countries
Appendix AInstitutional and Governance Dimensions toUrban Financing
102 See Kaufmann et. al. (2006) for additional discussion on governance indices.

107
Appendix A: Institutional and Governance Dimensions to Urban Financing
back. For cities, most help is needed in the
early project prioritization and preparation
stage where their visions are translated into
specific projects they can take to investors.
IFIs and NGOs have been playing a critical
role in providing the necessary support in
this regard. When private sector financing
is involved, cities also need support in
the overall procurement process. Due to
their complexity, P3 implementation often
requires institutional capacity building at
multiple levels of government. Furthermore,
with rapid urbanization, new urban
governance forms are also emerging that
can facilitate infrastructure delivery and
financing. These institutional and governance
dimensions are further elaborated below.
A.1 Institutional Capacity Building: IFI and
NGO Support
The role of IFIs has been increasing in
infrastructure financing, especially for the
developing world. In addition to direct
financing support, IFIs’ support comes as
technical assistance by engaging outside
consultants and providing their own expert
resources. Many IFIs have established
additional programs to focus on cities and
their need to build capacity in infrastructure
financing. These additional resources help
fill the critical knowledge gap, especially
in early project preparation stages. Project
preparation includes institutional, legal,
social, environmental, financial, regulatory
and engineering work that is needed to take
a project from concept to financial closure,
with clear identification and allocation
of risks.
Cities Development Initiative for Asia
(CDIA) is a flagship project developed by
ADB to target medium size cities in the
Asia-Pacific region and focus entirely on
the early preparation stage to enhance
linkage to financing.103 CDIA helps bridge
the gap between strategic development
plans, which typically present a wish list of
projects, and the requirements of financiers
for well-formulated infrastructure projects.
CDIA focuses on four areas of support: (a)
infrastructure investment programming
and prioritization, (b) pre-feasibility studies,
(c) linking cities to finance, and (d) city-
level capacity development. CDIA initially
started as a joint initiative between ADB
and the governments of Austria, Germany,
Spain, Sweden and Switzerland, the Nordic
Development Fund, and the Shanghai
Municipal Government, with additional
funding from Germany’s KfW. Under ADB’s
overall coordination and administration,
CDIA has since evolved into a major IFI-led
international partnership focused on cities.
EBRD has been active in the municipal
space since the mid-1990s, financing over
300 projects, with 55 percent of all financing
made at sub-sovereign levels and another
20 percent involving the private sector.
EBRD’s support at the municipal level has
focused on the water and urban transport
103 See, for example, KPMG (2010) for more information on CDIA activities.

108
Handbook on Urban Infrastructure Finance
sectors in emerging markets. Their support
in capacity building has been unique in that,
through standardized contracts with proper
incentive structures, they help enhance
self-funding capabilities and improve the
projects’ creditworthiness at the outset.
EBRD’s two-pronged approach is based
on a public-service contract (PSC), which
is between the service provider and the
municipality (owner), complemented and
reinforced by a project support agreement
(PSA, in the case of water) or municipal
support agreement (MSA, in the case of
urban transport), which is between EBRD
and the municipality. These contracts help to
create a stable and predictable operational
framework, management autonomy over
the revenue streams, and accountability
and incentives founded on performance
targets. Through standardization based
on best practices, EBRD’s approach
helps to shrink the overall time and effort
required in project preparation phases.
IFC InfraVentures, or the IFC Global
Infrastructure Project Development Fund,
focuses on private sector-led project
developments and covers the later phases
of project preparation. IFC was established in
part to address the lack of adequate funding
for project preparation, particularly in less
developed countries. IFC InfraVentures
is one of the few IFI-funded project
development vehicles that allocates
significant staff time to help private sectors
reach the financing phase. Specifically, their
support includes: (a) providing risk capital
in the early stages of project development,
generally through joint development
agreements (JDAs) based on a cost sharing
structure, and (b) allocating a team of
experienced IFC professionals to act as
co-developers to lead project preparation
activities such as financial and legal
structuring, environmental, social and other
impact assessments, and raising of capital
through the project’s financial closure.
In addition to IFIs, many other international
associations and non-governmental
organizations (NGOs) have been active
in providing valuable support for cities to
build capacity in infrastructure financing.
Since its founding in 1990, ICLEI
(International Council for Local
Environmental Initiatives), an international
association of local governments with a
network of over 1200 cities in 84 countries,
has been providing technical consulting,
training, and knowledge-sharing services
to cities around the world to build capacity
in sustainable development. ICLEI recently
launched Solutions Gateway, an online tool
to support cities in developing low-emission
strategies in the water, solid waste, transport,
buildings, and energy utility sectors. The
tool includes project feasibility assessment,
guidance on financing decision-making,
and a database on international and national
funding resources and their requirements,
and case studies documenting best
practices. As part of Solutions Gateway,
a Finance Tool is currently being

109
Appendix A: Institutional and Governance Dimensions to Urban Financing
developed to help cities identify possible
financing options to implement the low-
emission projects they have identified.
FMDV (Global Fund for Cities Development)
is created by Metropolis, UCLG, and 34
founding members that are cities and city
networks. 104 It is an international organization
whose aim is to create conditions that allow
local governments to stay in the driver’s
seat to define, implement, and manage their
urban development strategies, thereby
achieving effective decentralization of
competences and resources in urban
development. FMDV has a dual approach of
providing technical expertise and facilitating
financial engineering in the urban project
development process.105 The dual approach
allows local authorities, elected officials,
and technical teams to design, develop,
and appraise their own development
projects, in line with the best interest of
local communities and stakeholders.
Through its local offices, FMDV helps
develop a readily available network of
expert and committed international and
regional partners, comprising chief financial
officers, engineers, and technicians from
local authorities, universities, NGOs, private
groups, and international institutions.
These networks facilitate cities’ access
to financial resources, which match the
specific needs they themselves have
identified, be they guarantees, loans,
subsidies, grants, access to global financial
markets, or other endogenous solutions.
GIB (Global Infrastructure Basel) is
an international NGO whose aim is to
promote sustainable infrastructure
financing practices. GIB’s capacity building
program helps enable cities develop
their skills and knowledge regarding
the sustainability of infrastructure
projects, including the development of
voluntary standards, grading systems,
and measurement and backtracking of
performance indicators. Together with
capacity building workshops, they offer
technical support to municipalities and
their stakeholders in strategy development
and process support for infrastructure
projects, including pre-feasibility studies,
implementation, and business plans.
A.2 Institutional Requisite in P3
Implementation
Falling short of full privatization, P3 is
currently the primary mechanism to involve
private sector financing. Because of its
complexity, one of the essential ingredients
to successful P3 implementation for
the public sector is to build necessary
P3 capacity and knowledge. Such
capacity building would help achieve an
optimum and sustainable deal structure
that both the private and public sector
can commit to over the P3 lifecycle.
104 Metropolis is a global association of 130 major metropolises with more than 1 million inhabitants. United Cities
and Local Governments (UCLG) is an NGO representing interests of local governments and support
international cooperation between cities.105 See FMDV (2014) for examples of FMDV support for cities around the world.
110
Handbook on Urban Infrastructure Finance
When P3 options are explored, governments
need to begin by considering the basic P3
institutional framework, which includes:
• P3 visions, policies, and strategies
that are clearly articulated at
national, state/provincial, and local
levels to avoid premature P3
undertakings that can often
become costly.
• P3 enabling legislations that
carefully consider the use of
regulatory versus contractual
vehicles to balance enforcement
with flexibility in promoting efficient
business processes.
• P3 institutions and capacity
buildup in terms of organizational
responsibilities at different levels
of government and their interfaces.
• P3 procedures, guidelines, and
standards during different phases
of the P3 implementation lifecycle,
including the procurement phase.
Especially for those who are new to the
P3 market, P3 capacity building takes
a long time and must be established in
stages. The following UN-recommended
P3 development stages can serve
as a useful guideline in this regard:
Stage 1:
• Define policy framework
• Test legal viability
• Identify project pipeline
• Develop concept for project
evaluation and procurement
• Begin developing domestic P3
market
Stage 2:
• Establish dedicated P3 unit
• Consolidate legal framework and
publish implementation guidelines
• Continue to foster domestic P3
marketplace
• Expand P3 project pipeline
• Extend to new sectors
• Leverage new sources of funds
Stage 3:
• Continue to refine Stage 1 and 2
efforts to reach maturity
These basic institutional requisites
should be designed to balance the
varying interests of multiple stakeholders
involved in a P3 undertaking. Among
others, P3 stakeholders include:
• Governments
- Planning and budgeting (e.g.,
Ministry of Planning and Finance)
- Implementing (e.g., Ministry of
Public Works)
- Sector-specific (e.g., Ministries
of Energy, Transportation, Health,
Education, etc.)
- Coordinating/integrating (e.g.,
dedicated P3 units with specific
mandates)
- Project-specific (state/provincial,
regional, or local governments)
• IFIs and development banks
• Concessionaires (operator/

111
Appendix A: Institutional and Governance Dimensions to Urban Financing
developer, financier, and/or
constructor)
• Investment community (debt vs.
equity)
• Consultants/advisors
(financial, legal, technical)
• Infrastructure vendors (contractors,
material supplier, equipment
leasing, etc.)
• Local labor forces
• Local businesses
• Users and taxpayers
• NGOs and advocacy groups
When building institutional capacity for the
public sector, roles and responsibilities at
different levels of government should be
considered with respect to the essential
P3 implementation functions (Exhibit
A.2). Although cities need to rely on their
national and state/provincial governments
to build much of this capacity, they
can also take an active role from a P3 project implementation standpoint.
Being one of the leaders in P3
implementation with a mature P3 market,
Canada, for example, has been able to build
P3 deep and multi-layered institutional
capacity.106 At the federal level, under the
Ministry of Infrastructure, Communications,
and Intergovernmental Affairs, Infrastructure
Canada has the oversight responsibilities of
all major infrastructure implementations at
the national level, including P3. PPP Canada,
an independent federal Crown corporation
under the Ministry of Finance, coordinates
closely with Infrastructure Canada to
improve the delivery of public infrastructure
through P3. PPP Canada provides expertise
in assessing and executing P3 opportunities
at the federal level and, through P3 Canada
Fund, also helps leverage federal dollars
by supporting P3 projects at provincial and
municipal levels. At the provincial level,
reporting through their own designated
ministries, each province has their own P3
units with specific functional responsibilities.
These P3 units work directly with project
sponsors who are local, regional, or
provincial level agencies responsible for
implementing P3 projects (see Box A.1).
106 See, for example, Farrugia et. al. (2008), OECD (2010), and World Bank (2007) about P3 capacity building in
Canada and other countries.

112
Handbook on Urban Infrastructure Finance
Exhibit A.2: Aligning P3 Implementation Functions with Multi-Level Government
Institutions
P3 FunctionsP3 InstitutionsNational Level (‘‘Central’’)Set/provide P3 policy guidance
Promote & market P3 program (investment)
Coordinate P3 interagency interfaces
Approve/disapprove at P3 milestones
Provide technical assistance
Originate/identify P3 projects
Assess individual P3 projects
Manage P3 transaction during procurement
Manage P3 contract/monitor performance
P3 standardization/best practices
Communication/training
Finance and invest in P3 projects
Ministry of Planning
Ministry of Finance
Ministry of Public Works
Sector Ministry (e.g., Health)
Dedicated P3 Unit
- Public, Quasi-Public, or Private
State/Provincial Level (‘‘Regional’’)
States/provincial governments can lead P3 efforts and have similar arrangements as those shown at the national level, i.e., planning, budgeting, implementing, sector-specific, and/or dedicated units
Local Level (‘‘Nodal’’)
Project Sponsors

113
Appendix A: Institutional and Governance Dimensions to Urban Financing
Box A.1: Overview of P3 Institutional Setting in Canada
P3 Institutions at National and Provincial Levels:
National Government Provincial Government
Alberta
British Columbia
Ontario
Quebec
Treasury Board
Ministry of Finance
Ministry of Infrastructure
Dept of Treasury & Finance
P3 Units at
Provincial Level
PPP Quebec
InfrastructureOntario
Partnership BC
Alternative Capital Financing
(ACF) Office
Minister of Infrastructure, Communities &
IntergovernmentalAffairs
InfrastructureCanada
Building Canada Fund
Gateway/Border Crossing
PPP Fund
PPP CanadaInc.
Manage & Invest
Crown Corporation
P3 & Non-P3
Aligning P3 Institutions with P3 Functions:
Coordinate P3 interagency interfaces
Approve/disapprove at P3 milestones
Provide technical assistance
Originate/identify P3 projects
Assess individual P3 projects
Manage P3 transaction during procurement
Manage P3 contract/monitor performance
P3 standardization/best practices
Communication/training
Finance and invest in P3 projects
Set/provide P3 policy guidance
Promote & market P3 program (investment)
P3 Project Implementing
Agencies atLocal,
RegionalProvincial
Levels
Direct Responsibility
Indirect/Support Function
PPP Canada, Inc.
Alberta ACF Office
Partnership BC
Infrastructure Ontario
PPP Quebec
Federal Projects

114
Handbook on Urban Infrastructure Finance
P3 Units and Their Representative Organizational Structure:
Partnership BC (PBC) Infrastructure Ontario (IO)
Ministry of Finance
Board of Directors
Partnership BC
ServicesDevelopment
& DeliveryFinance &
Admin
Audit & RiskManagement Committee
Human Res &Governance Committee
Line ministriesCrown corporationsHealth authoritiesBoards of educationLocal/national govts
Registered Company
(SOE)
Funding sources: user fees for services rendered- work fees (sevices not related to milestones)- milestone fees (for achieving successful milestones)- annual provincial government service contract
Ministry of Infrastructure
Audit Committee
Credit RiskMgmt Comm
Governance & Compensation
Board of Directors
InfrastructureOntario
Line ministries
MandateCrown
Corporation(SOE)
OntarioInfrastructureProjectsCorporationAct 2006
ProjectDelivery
ProjectAssessmt
InfraLending HR & IT
NuclearProc
Projects
Funding sources from:- individual project budget where IO is involved- interest rate spread from lending- administrative cost from direct grant from Ministry of Public Infrastructure Renewal
Box A.1 continued:

115
Handbook on Urban Infrastructure Finance
Financing Smart City ConceptsAppendix B
No conversation about cities can now take
place without considering their “smartness”
in one form or another. The primary goals
of these smart concepts are to improve the
quality and performance of urban services,
reduce resource consumption, and engage
more effectively and actively with its
citizens. From an infrastructure financing
standpoint, these goals have important
bearing on increasing the operational
efficiency of existing facilities to help reduce
new funding needs in the long run. In most
cases, the benefits of smart city concepts
are well recognized. The challenge,
however, is figuring out how to pay for them,
especially for cities and local governments
facing fiscal constraints. This Appendix
is intended to provide a broad-brush
discussion on various financing approaches
to key smart city concepts, both in terms of
financing models that are currently being
used as well as potential models that
can help address future financing issues.
There are many smart city concepts with
varying degrees of cost and financing
implications. Some (e.g., BRT dynamic
scheduling) bring significant benefits
to citizens with little cost implications,
whereas others (e.g., LED lighting) require
a moderate capital investment with clear
and proven savings that can help pay for
itself. Some (e.g., operations or emergency
control centers) also provide services that
are primarily in the public domain where the
costs must be borne by the public sector,
while others are citywide “enterprise-
level’ applications that are costly, but with
significant potential benefits in the long run.
Many smart city concepts do not require
expensive sensors or sophisticated data
analytics. In 2013, for example, the Seoul
Metropolitan Government (SMG) was
able to provide a “smart” demand-based
nighttime bus service for low and medium-
income residents by analyzing citywide taxi
service calls and identifying high nighttime
demand areas. The data was provided
by taxi drivers from their credit card
transactions. In return for the data, taxi
drivers received a relief on extra service fees
charged on their credit card transactions.107
By using the data, SMG connected these
high demand areas and created new
nighttime bus routes (called “owl bus”).
Owl bus was voted the best public service
project of the year by citizens. The cost to
SMG was the nominal credit card service
fees that the city assumed on behalf of
credit card companies and minimal staff
time for coordination and data analysis.
For those concepts that do require
moderate capital investments such as LED
107 Based on an interview with Mr. In Dong Cho, Director General of Seoul Innovation Bureau. Also see Cho (2015)
for additional smart city services provided by Seoul Innovation Bureau with limited cost implications.

116
Appendix B: Financing Smart City Concepts
Exhibit B.1: Financing Approaches to Smart City Concepts Requiring Moderate Investments
Smart City
Concept
Upfront Financing Funding/Repayment Features/
Representative
Financing ExamplesResponsible
PartyFinancing
Instrument
Responsible Party
Repayment Source
LED Lighting
City Government
GO or Revenue Bonds, Loans, or Pay-as-You-Go
City Government
Cost Savings
LED lights with basic sensors; Los Angeles, Detroit, Asheville NC, etc.
Smart Parking
City Government
GO or Revenue Bonds, Loans, or Pay-as-You-Go
City Government
Increase in Parking Revenues
Generic financing model (see Exhibit B.2)
Service Provider or City Government
Credit Facility (Upfront Cost) City
Government
Increase in Parking Revenues(Pay-As-You-Go)
Citi-Streetline-IBM $25-Million Credit Facility; sensors/apps (Streetline), data analytics (IBM), financing (Citi)
Operations Center
City Government
Grant/Subsidy, GO Bonds or Loans
City Government
General City Funds (Tax)
Rio de Janeiro, Brazil
lighting, smart parking or operations centers,
Exhibit B.1 summarizes several potential
financing approaches. Due to its proven
record of savings, LED lighting is often the
first smart city concept cities implement.
Compared to legacy systems, LED lighting
with basic sensors uses less energy and
lasts longer with a smaller carbon footprint.
Past applications of LED lighting indicate
that cities can achieve as much as 50-70% savings in annual energy cost and
carbon emissions reduction, and 50-75%
savings in annual maintenance costs.108
The City of Los Angeles was one of the
first cities in the U.S. to successfully
retrofit their legacy street light system
with LED system, achieving almost 65%
savings in energy usage and triggering
many other cities to follow suit.109
As shown in Exhibit B.1, cities can use
multiple sources to finance the upfront cost
of LED system. Los Angeles used loan and
rebate funds from the city’s Department of
Water and Power for the upfront cost, but
was able to make the repayment within 7
108 Based on discussions with Cisco representatives. Also, see Whitehelm Capital (2016)109 For more detailed discussion on Los Angeles LED lighting system rollout, see O’Connor (2013), Gerdes (2013),
Hargreaves (2015).

117
Handbook on Urban Infrastructure Finance
years with no adverse impact on its General
Fund. Cities can pay the upfront cost from
their General Funds on a pay-as-you-go
basis or issue GO bonds. Given the proven
cost savings, cities can issue revenue bonds
for the upfront cost secured with anticipated
cost savings.110 Some cities also chose to
set up a separate capital improvement
account for any surplus savings beyond
the full repayment for use in financing
any future initiatives (e.g., Green Capital
Improvement Plan for Asheville, N.C.).111
In the LED system, the basic funding/
revenue model is one of cost savings.
In smart parking, the funding/revenue
model is based on revenue increases
resulting from higher usage, which is
further enhanced by dynamic pricing and
efficient enforcements.112, 113 Smart parking
mobile apps such as ParkerTM help
increase parking occupancy and overall
parking revenues for cities, which can be
leveraged to pay for the upfront cost of
the technology. As shown in Exhibit B.2, the
mobile apps provider can get their revenues
either directly from customers and/or, as in
the Uber model, from the service provider
(in this case, either the city or a third-party
parking service provider in contract with the
city). Similar to the LED system, cities can
raise the upfront cost either through GO or
revenue bonds. Financing of upfront costs
can be facilitated by a pre-established
credit line that multiple projects can access.
Recently, for example, in partnership with
Streetline and IBM, Citi created a $25-million
credit facility that can be accessed by
multiple cities for smart parking projects
that involve Streetline and IBM.114 Instead
of issuing bonds, cities can draw from the
credit line for the upfront cost and pay
back into the credit line on a pay-as-you-
go basis as the parking revenues come in.
For an operations center such as the one
provided by IBM in Rio de Janeiro, the basic
function of the center was to enhance
the command-control capacity of the
city to improve public safety, emergency
management, civil defense, and other
services that are considered in the public
domain.115 Because there are no apparent
cost savings or revenue generating
110 There are non-LED examples where revenue bonds were secured with energy savings, as mentioned earlier
for New Mexico schools revenue bonds for energy efficiency upgrades.111 For Detroit, see Reindl (2014). For Asheville, see Cleveland et. al. (2013)112 In addition to increase in parking fee revenues, efficient enforcements also produce substantial increase in
revenues from parking fines.113 In addition to the revenue increase, there are cost savings and carbon emission reductions associated with
smart parking concepts that cannot be monetized directly into financing. A UCLA study in 2007, for example,
indicated that motorists in a 15-block district in Los Angeles drove in excess of 950,000 miles, produced 730
tons of carbon dioxide, and used 47,000 gallons of gas searching for parking. See Shoup (2007) for more a
detailed discussion.114 Streetline provides mobile apps/sensors and IBM provides data analytic capability.
See http://www.thestreet.com/story/11488069/1/citi-partners-with-streetline-and-ibm-to-provide-25-
million-financing-for-cities-to-adopt-smart-parking-technology.html115 See Singer (2012) for additional discussion on the Rio operations center.

118
Appendix B: Financing Smart City Concepts
CityDataAnalytics
Parking Fees
App Usage Fee % Parking Fees
UpfrontCosts Increasing
ParkingRevenues
ParkingServiceProvider
SmartParkingSensors
SmartParking
Apps
SmartMobile
DevicesCustomer
Exhibit B.2: Smart Parking Funding/Revenue Model (Notional)
opportunities that could be capitalized to
help with the financing, the government
would be responsible for the financing
in this case. For city governments, they
can rely on grants or subsidies from their
higher tier governments and/or on GO
bonds or a bank loan that would be repaid
ultimately from the city’s General Fund.
There are smart city concepts that pertain
specifically to smart buildings (see Exhibit
B.3). Smart building concepts generally
encompass (a) systems such as building
management systems (BMS) or building
automation systems (BAS) that are focused
on energy savings and efficient building
operations and (b) more advanced service
platforms/applications that cater to the
specific needs of building occupants.
BMS is a smart building system that
centrally manages all equipment and
facilities in a building (e.g., ventilation,
lighting, power systems, fire systems, and
security systems) for improved energy
use, safety and security, and efficiency in
general building management, operations,
and maintenance activities. For existing
buildings, a prevalent financing model
has been for a third-party service provider
(such as energy service/savings company
or ESCo) to assume the upfront costs of its
services for a performance-based contract.
ESCos, for example, get paid a fee or
assume the utility bill for legacy systems
from the building owners for implementing
a broad range of energy savings solutions.
In all cases, energy savings are guaranteed
to exceed the fee or the legacy utility bills
so that the building owners in essence take

119
Handbook on Urban Infrastructure Finance
no risk. Service providers lease various
equipment they own (that are designed
to reduce energy costs) and get lease
payments from building owners to finance
the upfront costs. Financing the upfront
cost of smart building technologies can
be facilitated by a pre-established credit
line that multiple projects can access. In
partnership with Green Campus Partners
(GCP), for example, Citi recently launched
a $50-million warehouse funding facility
for use in building-related energy
efficiency and renewable energy projects.116
A smart building financing approach
for new buildings can differ
from those of existing buildings.
In the case of Songdo, for example, Gale
International, the city's master developer,
provided the latest and most advanced
BMS technologies for their buildings and
accounted for the upfront costs as part of
the final property sales price. In addition, via a
partnership with Gale International, POSCO,
LG-CNS and Cisco, a technology services
joint venture has been providing advanced
building service platforms and applications
that cater to the needs of building occupants
(e.g., video-based applications for remote
education or healthcare services). The
hardware required for these smart solutions
(e.g., video teleconferencing capability)
have already been embedded in the new
buildings, but Gale International and its
partners are continuing to develop new
platforms/applications (e.g., u-Healthcare,
distance learning programs) that can be
used by various service providers (e.g., in-
home healthcare consultation, language
classes). The basic financing approach for
these advanced applications are similar to
the smart parking funding/revenue model
presented in Exhibit B.2, where the costs of
providing the technologies are recovered
through usage fees from building occupants
(customers) and/or service providers.
The real benefits of smart city concepts are
considered to lie with the full integration
of the disparate concepts through a digital
Internet backbone/communications
network that enables enterprise-level
cloud applications and the use of big data.
The digital communications network is the
costlier item that is often thought to be
the roadblock to a full integration effort.
Jointly with Cisco, Whitehelm Capital
has recently developed a two-phased
financing approach that could potentially
help overcome such a roadblock.117
The Cisco-Whitehelm (C-W) approach is
based on Cisco’s Smart LED Solution that,
in addition to energy savings functions,
serves as a multi-sensor node network that
is capable of capturing and transmitting
real-time data for all other city services (e.g.
smart parking, smart traffic, smart waste
management, citywide Wi-Fi access). In
the first “core” phase, the LED solution is
combined with the Internet-of-Everything
(IoE) digital backbone that relies on wireless
116 See: http://www.prnewswire.com/news-releases/green-campus-partners-and-citi-launch-financing-
solution-to-fund-energy-efficiency-and-renewable-energy-projects-159455125.html117 See Whitehelm Capital (2016) for more detailed discussion.

120
Exhibit B.3: Financing Approaches to Smart Building Concepts (2004-2009)
Smart City Concept
Upfront Financing Funding/Repayment Features/Representative
Financing Examples
Responsible Party
Financing Instrument
Responsible Party
Repayment Source
BMS/BAS/Energy Savings
Existing Building
Service Provider (ESCos)
Various Various Utility Bill Payments/Cost Savings
Performance contracts; benefits of cost savings can be shared
Property Owner
Various Property Owner
Lease Payments
Equipment lease
Property Owner
Warehouse Credit Facility
Property Owner
Cost Savings Citi-GCP Warehouse Facility (Revolving Fund)
New Building
Developer Various Property Owner
One-Time Sales Price
Advanced BMS; Songdo (Gale)
Advanced Building Service Platforms/Applications
Developer Various Service Provider/Property Owner
Usage-Based Fees
Video-Based Education/Healthcare Services; Songdo (Gale)
mesh network (WMN) with the goal of
achieving energy savings as well as laying
out the foundation for a fully networked
and integrated system down the road. The
second “smart” phase entails the realization
of the full potential of the system and includes
all additional services that can emerge on
the IoE/WMN platform, including a myriad
yet-to-be-developed smart applications
that help enhance city services.118
In the C-W approach, financing of the first
phase is designed to be largely cost neutral
by capitalizing on the energy savings of the
Smart LED Solution. These energy savings,
estimated to provide 10-20% additional
savings beyond the 50-70% provided by the
basic LED system, are used to help offset
the cost of funding the IoE/WMN platform.
As covered in Chapter 2, the proposed C-W
financing approach for Phase 1 is structured
as a P3 concession with availability
payments that are inflation-linked. Exhibit
B.4 depicts a simplified version of the
C-W approach. The financing instrument
would be project finance where a project
company would be established as an SPV,
which will have a direct P3 concession
agreement with the city. The process
would be streamlined and replicable in
the sense that there will be (1) one or more
designated equity financiers who can
118 For example, smart phone apps increased from 550 in 2008 when they were first launched to about 3 million
apps that are active in the marketplace as of January 2016. See Whitehelm Capital (2016).
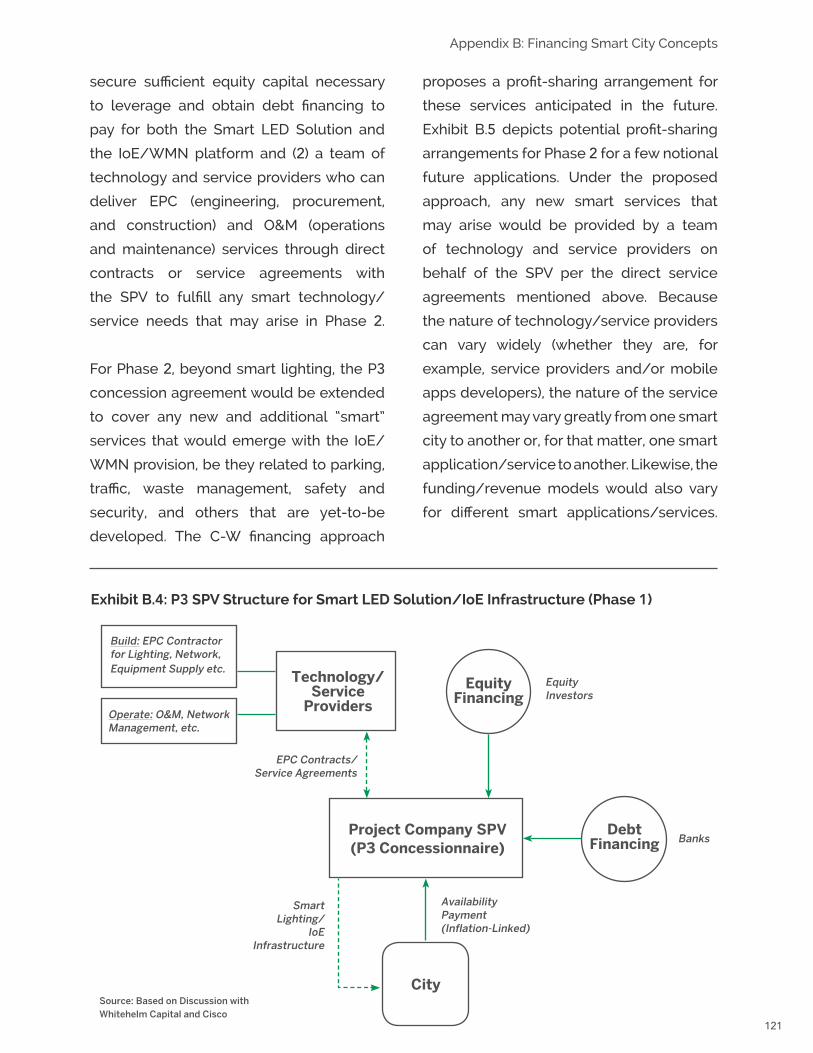
121
Appendix B: Financing Smart City Concepts
City
DebtFinancing
EquityFinancing
Technology/Service
Providers
Project Company SPV(P3 Concessionnaire)
Build: EPC Contractor for Lighting, Network, Equipment Supply etc.
Operate: O&M, Network Management, etc.
Banks
EquityInvestors
AvailabilityPayment(Inflation-Linked)
SmartLighting/
IoEInfrastructure
EPC Contracts/Service Agreements
Exhibit B.4: P3 SPV Structure for Smart LED Solution/IoE Infrastructure (Phase 1)
secure sufficient equity capital necessary
to leverage and obtain debt financing to
pay for both the Smart LED Solution and
the IoE/WMN platform and (2) a team of
technology and service providers who can
deliver EPC (engineering, procurement,
and construction) and O&M (operations
and maintenance) services through direct
contracts or service agreements with
the SPV to fulfill any smart technology/
service needs that may arise in Phase 2.
For Phase 2, beyond smart lighting, the P3
concession agreement would be extended
to cover any new and additional “smart”
services that would emerge with the IoE/
WMN provision, be they related to parking,
traffic, waste management, safety and
security, and others that are yet-to-be
developed. The C-W financing approach
proposes a profit-sharing arrangement for
these services anticipated in the future.
Exhibit B.5 depicts potential profit-sharing
arrangements for Phase 2 for a few notional
future applications. Under the proposed
approach, any new smart services that
may arise would be provided by a team
of technology and service providers on
behalf of the SPV per the direct service
agreements mentioned above. Because
the nature of technology/service providers
can vary widely (whether they are, for
example, service providers and/or mobile
apps developers), the nature of the service
agreement may vary greatly from one smart
city to another or, for that matter, one smart
application/service to another. Likewise, the
funding/revenue models would also vary
for different smart applications/services.
Source: Based on Discussion withWhitehelm Capital and Cisco

122
Handbook on Urban Infrastructure Finance
IoE
The BigData
Multi-Node Sensor/Mobile Device Data
Collection
Profit Sharing
PerServiceAgreement
CityProject
CompanySPV
Technology/ Service
Providers
Traffic
WasteMgmt
Safety & Security
Smart Traffic Funding/Revenue Model
Smart Waste Management Funding/Revenue Model
Smart Safety & Security Funding/Revenue Model
Customer ParkingSmart
LEDSensors
SmartParking
Apps
SmartMobile
Devices
Exhibit B.5: Potential Cost Sharing Arrangement for Future Smart Services (Phase 2; Notional)
In Exhibit B.5, the funding/revenue model
presented in Exhibit B.2 is shown for smart
parking but similar models need to be
developed for other applications. Ultimately,
any net revenue that flows out of various
service agreements to the SPV would be
shared with the city. As the services expand
and more data are accumulated, the
city would get the full benefit of big data
generated from the fully integrated system.
Many cities are evaluating the benefits
and potential implementation of the fully
networked system and the best strategy
to roll out different concepts. Barcelona,
for example, was one of the first cities that
deployed the IoE/WMN infrastructure
early and successfully. According to some
estimates, the city has generated as much
as $3 billion in value creation because of
this investment in smart technology.119
Other cities are following suit, including the
City of Busan in South Korea. Having already
gone through the market liberalization path
of import substitution economies, Busan
has been facing difficult challenges many
mature mid-size cities face in producing
next generation growth. Along with key
major economic initiatives, the smart city
program is serving as the basic foundation
for triggering this growth. Using some of
the financing approaches presented in this
Appendix, the city is planning to implement
25 potential applications in the areas of
tourism/transportation, safety/security,
energy/sustainability, and connected
community/citizen engagement (see
Box B.1 for more detailed discussion
of Busan’s smart city implementation).
119 See Whitehelm Capital (2016) for additional discussion on Barcelona case.
Data Analytics

123
Appendix B: Financing Smart City Concepts
With over 3.5 million in population, Busan is a quintessential “mature” mid-size
city. Globally, Busan is competing with the Emerging 440 and the rest of the
mature mid-size cities for investment capital and human and natural resources.
Nationally, Busan has to compete with Seoul and nearby cities like Songdo to
obtain the central government’s support and to attract major businesses, skilled
labor, and foreign investment capital. Locally, Busan’s economic sphere of
influence is not commensurate with the obsolete jurisdictional boundaries that
exist today. Helped along by past central government policies, some of the key
residential, commercial, and manufacturing centers that benefit directly from
Busan are placed beyond the city boundaries, imposing artificial constraints to
the city’s growth.
Busan has the same demographic concerns of many mature mid-size cities
around the world. The city lost more than 300,000 people to Seoul and other
cities in less than 10 years because companies in Busan could not compete with
the large “chaebol”120 companies—located primarily in those cities—preferred by
workers. As a result, the birth rate has been declining while the aging population
has been growing. The city currently spends more than 35 percent of its budget
on welfare, mostly for the elderly.
These challenges and constraints are equally matched by several opportunities
and assets working in Busan’s favor. Busan is the second largest city in South
Korea with a long history, rich and unique culture, and mature businesses.
Located at the southeastern tip of the Korean peninsula, the city has long been
a major tourist attraction, both domestically and internationally, with its natural
coastal terrain and seaside resorts. It also boasts the largest maritime gateway in
Korea. The Port of Busan is the fifth busiest container port in the world. The city
is also experienced in large-scale developments such as Centum City, an urban
enterprise zone converted from a former air base often cited as a successful
example of city-led mixed-use developments that generated growth.
120 “Chaebol” is a South Korean form of business conglomerate. They are typically global multinationals owning
numerous domestic and international enterprises, controlled by a chairman who has power over all the
operations.
Box B.1: A Smart City Case for Busan Metropolitan City, South Korea

124
Handbook on Urban Infrastructure Finance
An important asset for Busan of today is the newly elected mayor and his
administration that maintain a global vision with a can-do mindset. Under the
new mayor’s leadership, several new initiatives are currently underway to help
the city’s economy—among others, (a) making Busan an innovative city through
the establishment of a new startup ecosystem, (b) building a strong pool of talent
and technology base through a new program called TNT2030, (c) establishing
a regional R&D powerhouse through the strengthening of local academic
institutions, (d) establishing an aggressive global outreach program to create
new business ties globally, (e) creating new pillars of growth in six strategic
industries, and (f) developing a new airport to enhance global connectivity and
generate new investments and jobs.
At the foundation of these initiatives is building a global IoE-based smart city
program. A multi-phase rollout of comprehensive smart city programs is currently
planned throughout Busan to help facilitate a next generation growth strategy.
As a start, a major pilot program is currently underway in the aforementioned
Centum City area with 25 distinct smart city concepts under four major themes
(see Exhibit B.5).
The pilot program is to be rolled out in phases over a 4-year period from 2015
to 2018 (see Exhibit B.6). The total cost is estimated to be KW860 billion (US$
72 million), of which KW260 billion (US$22 million) and KW230 billion (US$19
million) are expected to come from the central government and Busan city,
respectively (together comprising about 57 percent of the total cost). About
KW220 billion (US$18 million) of the remaining (or about 26 percent of the total
cost) is expected to be funded through P3 concessions based on build-transfer-
lease/build-transfer operate (BTL/BTO) models, and the rest from direct private
investment (KW150 billion/US$12.5 million or 17 percent). The basic rationale
underlying the overall funding strategy is consistent with the overall financing
approach described in this Appendix. The public sector funding from the central
government and Busan City is to be used to support the initial capital investment
needed for IoE/WMN backbone and integrated operations center. Beyond the
public sector funding, a P3 concession model would be central to the delivery of
technologies and services and securing the necessary equity and debt capital.
P3 concession in turn would be supported by self-sustainable funding/revenue
models for specific applications presented in this Appendix, e.g., smart parking
and smart building, which in part can be used to repay the initial financing.

125
Appendix B: Financing Smart City Concepts
Exhibit B.5: Busan Centum City Area Pilot Program—Smart City Major Themes/Concepts
Major Theme Smart City Concept
Fun and Convenient Tourism/Transportation 1. Location Based Services (LBS) Tour Information2. Smart Parking3. Smart Public Transit4. Smart Event Info Poles 5. Intelligent Traffic Information6. Citywide Wifi Service for Tourists
Intelligent Safety and Security Infrastructure 7. Missing Children Prevention8. Smart Safety for Children/Aging9. Smart Crosswalk10. Smart LED Lighting11. Integrated Safety Operations Center12. Real-Time Evacuation13. Well-Care for Handicapped14. Smart LBS
Energy Savings/Smart Green City 15. Smart Home Energy Savings16. Real-Time Monitor of Water Leakage17. Smart Energy Management Center18. Smart Commercial Energy Savings19. Smart Shared Bikes
Citizen-Driven Leading IoT City 20. Sensor-Based Daily Life21. Remote Video Education22. Smart Kindergarten23. Connected Community24. Beacon Marketing Platform25. APT Digital Signage

126
Handbook on Urban Infrastructure Finance
Exhibit B.6: Busan Centum City Area Pilot Program—Smart City Phased Roll Out
2015 2016 2017 2018
Phased Smart City Concept Roll Out
Cloud Service Platform
Integrated Operations Center
Citywide Wifi/IoE Backbone (inc. Smart LED Lighting)
Service Applications
• Smart Parking• Missing Children Prevention• Smart Safety for Children/Aging• Real-Time Monitor of Water Leakage• Smart Commercial Energy Savings• Remote Video Education• Beacon Marketing Platform
• LBS Tour Information• Smart Event Info Poles• Intelligent Traffic Information• Smart Shared Bikes • Connected Community• APT Digital Signage
• Smart Crosswalk• Real-Time Evacuation• Well-Care for Handicapped• Sensor-Based Daily Life• Smart Kindergarten
• Smart Public Transit• Integrated Safety Operations Center• Smart Home Energy Savings• Smart Energy Management Center
Estimated Cost KW240 billion (US$20 million)
KW210 billion(US$17.5 million)
KW200 billion(US$17 million)
KW210 billion(US$17.5 million)
Proposed Funding Source
Public Funding: • KW60 billion (Central Govt)Direct Private:• KW20 billionP3 (BTL/BTO):• KW16 billion
Public Funding: • KW70 billion (Central Govt)• KW70 billion (Busan City)Direct Private:• KW30 billionP3 (BTL/BTO):• KW40 billion
Public Funding: • KW70 billion (Central Govt)• KW8 billion (Busan City)Direct Private:• KW5 billion
Public Funding: • KW60 billion (Central Govt)• KW80 billion (Busan City)Direct Private:• KW50 billionP3 (BTL/BTO):• KW20 billion

127
Handbook on Urban Infrastructure Finance
References
1. AASHTO. “Transportation Funding & Financing.” American Association of State Highway
and Transportation Officials (AASHTO) Transportation Finance Clearing House. Available
at: http://www.transportation-finance.org/funding_financing/.
2. ACG. “Performance of PPPs and Traditional Procurement in Australia, Final Report: Report
to Infrastructure Partnerships Australia.” The Allen Consulting Group (ACG), November 30,
2007.
3. ADB. “Urban Operational Plan 2012-2020.” Asian Development Bank (ADB), 2013
4. Andersson, L. “Finance Cooperation Between Local Authorities in Developing Countries.”
AB Marten Andersson Productions, 2014a.
5. Andersson, L. “Local Government Finance in Europe—Trends to Create Local Government
Funding Agencies.” AB Marten Andersson Productions, 2014b.
6. Andersson, L. “What the World Needs Now...is Local Infrastructure Investments: Challenges
and Solutions with a Focus on Finance.” AB Marten Andersson Productions, 2014c.
7. ASCE, “2013 Report Card for America's Infrastructure.” American Society of Civil Engineers
(ASCE), 2013. Available at: http://www.infrastructurereportcard.org/.
8. Baird, A.J. and V. Valentine, “Port Privatization in the United Kingdom: Devolution, Port
Governance and Port Performance.” Research in Transportation Economics, Vol. 17, p. 55-
84, 2007.
9. Barber, B. R., “If Mayors Ruled the World: Dysfunctional Nations, Rising Cities.” Yale
University Press, 2013.
10. Bashmakov, I. et. al. "Policies, Measures, and Instruments.” Climate Change 2001: Mitigation,
Contribution of Working Group III to the Third Assessment Report of the Intergovernmental
Panel on Climate Change, ed. B. Metz; et al. Cambridge University Press, 2001.
11. Bennon, M., A. Monk, and C. Nowacki, “Dutch Pensions Paving the Way for Infrastructure
Development.” The Journal of Structured Finance, Summer 2015, Vol. 21, No. 2: pp. 45-54.
12. BlackRock, “Build America Bond Special Report.”, July 2009.
13. Blanc-Brude, F. “Benchmarking Long-Term Investment in Infrastructure: Objectives,
Roadmaps and Recent Progress.” EDHEC Risk Institute, June 2014.
14. Blanc-Brude, F., and D. Makovsek. “Construction Risk in Infrastructure Project Finance.”
Research, EDHEC Risk Institute, February 2013. Available at http://chaire-eppp.org/files_
chaire/blanc-brude-makovsek.pdf.
15. Brabham, D. C. “Crowdsourcing as a Model for Problem Solving: An Introduction and Cases.”
Convergence: The International Journal of Research into New Media Technologies, 2008.

128
References
16. Brealey, R., I. Cooper, and M. Habib. “Investment Appraisal in the Public Sector.” Oxford
Review of Economic Policy, Vol. 13, No. 4, Oxford University Press and the Oxford Review
of Economic Policy Limited, 1997.
17. C40 Cities. “Tokyo: City Cap-and-Trade Program.” 2013 Climate Leadership Awards, 2013.
Available at: http://www.c40.org/2013-close-up/tokyo-closeup.pdf
18. C40 Cities “Shenzhen: Construction of the Carbon Trading Market in Shenzhen.” 2014
Climate Leadership Awards, 2014. Available at: http://www.c40.org/profiles/2014-
shenzhen-finance
19. C40 Cities. “Johannesburg the First C40 City to Issue Green City Bond.” C40 Blog, June 12,
2014. Available at: http://www.c40.org/blog_posts/johannesburg-the-first-c40-city-to-
issue-green-city-bond
20. CBO/JCT, “Subsidizing Infrastructure Investment with Tax-Preferred Bonds.” A Joint
Congressional Budget Office/Joint Committee on Taxation (CB)/JCT) Study, October
2009.
21. Center for American Progress. Social Impact Bond Series. Available at: https://www.
americanprogress.org/series/social-impact-bonds/view/.
22. Cleveland, C. and M. Ullman. “LED Streetlights Make Dollars and Sense, Asheville, NC.”
Asheville LED Street Light Case Study, prepared by USDN Innovation Working Group and
City of Asheville Sustainability Program, May 31, 2013.
23. Cho, I. D. “ICT Changes the Ways We Can Deliver Welfare Services.” New Cities Foundation
blog posted in June 4, 2015. Available at: http://www.newcitiesfoundation.org/ict-
changes-the-ways-we-can-deliver-welfare-services/
24. Davies, Rodrigo. “Civic Crowdfunding: Participatory Communities, Entrepreneurs and the
Political Economy of Place.” 2014.
25. De Freitas, J C. and M. Amado. “Crowdfunding in Urban Planning: Opportunities and
Obstacles.” At home on the housing market: RC43 conference book of proceedings, ed. R
Ronald. Centre for Urban Studies, University of Amsterdam, 2013.
26. Della Croce, R. “Trends in Large Pension Fund Investment in Infrastructure.” OECD Working
Papers on Finance, Insurance and Private Pensions, No. 29, Organization for Economic
Cooperation and Development (OECD), November 2012.
27. Dixon, A. and A. Monk. “Financializing Development: Toward a Sympathetic Critique of
Sovereign Development Funds.” August 2014.
28. Dobbs, R., J. Remes, and J. R. Woetzel, “Strengthening the foundations of emerging cities.”
McKinsey on Society, McKinsey & Company, 2012.
29. Economist. “Urban Infrastructure Insights 2015." The Economist Intelligent Unit, sponsored
by FCC Citizen Services, 2015.
30. EPEC. “State Guarantees in PPPs: A Guide to Better Evaluation, Design, Iplemetation and
Management.” European PPP Expertise Center (EPEC), May 2011.

129
Handbook on Urban Infrastructure Finance
31. EPEC. “Financing PPPs with Project Bonds: Issues for Public Procuring Authorities.”
European PPP Expertise Center (EPEC), October 2012.
32. Farajian, M., A. Lauzon, and Q. Cui. “An Introduction to a Crowdfunded Public-Private
Partnership Model in the U.S.” Transportation Research Record: Journal of the
Transportation Research Board, No. 2530, Transportation Research Board, Washington D.
C., 2015.
33. Farmer, L. “Value Capture: Route 28 Transportation Improvement District.” Virginia
Department of Transportation Financial Planning Division, January 2015.
34. Farrugia, C., T. Reynolds, R. Orr, “Public-Private Partnership Agencies: A Global Perspective.”
Collaboratory For Research in Global Projects (CRGP) Working Paper No. 39, Stanford
University, August 2008.
35. FER, “Statement on Accounting for the Cost of Government Credit Assistance.” Financial
Economic Roundtable (FER), Wharton Financial Institutions Center, University of
Pennsylvania, October 16, 2012.
36. FMDV. “Resolutions Europe: Local Innovations to Finance Cities and Regions.” Regional
Publications Context and Case Studies, Fonds Mondial pour le Développement des Villes
(FMDV, Global Fund for Cities Development), July 2014.
37. Future Cities Catapult. “Urban Innovation and Investment: The Role of International
Financial Institutions and Development Banks.” December 2014.
38. Gasparro, K. “Funding Municipal Infrastructure: Integrating Project Finance and
Crowdfunding.” Stanford University Global Project Center, Research funded by National
Science Foundation Graduate Research Fellowship Program (Grant No. DGE-114747), 2015.
39. Gerdes, J. “Los Angeles Completes World’s Largest LED Street Light Retrofit.” Forbes/Green
Tech, July 31, 2013. Available at: http://www.forbes.com/sites/justingerdes/2013/07/31/
los-angeles-completes-worlds-largest-led-street-light-retrofit/#29f2e08b4b54
40. Gillen, D., “Airport Governance and Regulation: the Evolution over Three Decades of
Aviation System Reform.” Sauder School of Business, University of British Columbia,
October 2008.
41. Gillen, D. and H.M. Niemeier. “Airport Economics, Policy and Management: The European
Union.” Comparative Political Economy and Infrastructure Performance : The Case of
Airports, Madrid, September 18-19, 2006.
42. Hargreaves, S. “L.A. to control its street lights with a single laptop.” CNN Money, April 10,
2015. Available at: http://money.cnn.com/2015/04/10/technology/l-a-lights/
43. HMT, “PFI: Meeting the Investment Challenge,” The U.K. Her Majesty’s Treasury (HMT),
July 2003.
44. HMT. “PFI: Strengthening Long-Term Partnership,” The U.K. Her Majesty’s Treasury (HMT),
March 2006.
45. HMT. “Infrastructure Procurement: Delivering Long-Term Value.” Her Majesty’s Treasury
(HMT), March 2008.

130
References
46. HMT, “Reforms of the Private Finance Initiative,” The U.K. Her Majesty’s Treasury (HMT),
December 2011.
47. IIWIR, “Sold to the Highest Bidder.” Infrastructure Investor Week In Review (IIWIR), May 1,
2014.
48. IIWIR, “Take Nothing for Granted.” Infrastructure Investor Week In Review (IIWIR), July 24,
2014.
49. IIWIR, “Australia Recycled.” Infrastructure Investor Week In Review (IIWIR), August 1, 2014.
50. Inderst, G. “Private Infrastructure Finance and Investment in Europe.” European Investment
Bank (EIB) Working Paper, 2013.
51. Infrastructure Australia. “Australia’s Public Infrastructure—Part of the Answer to Removing
the Infrastructure Deficit.” Infrastructure Australia, Australian Government, December 2012.
52. Infrastructure Australia. “Australia’s Public Infrastructure—Update Paper: Balance Sheet
Impacts of Sell to Build.” Infrastructure Australia, Australian Government, December 2013.
53. JCT, “The Federal Revenue Effects of Tax-Exempt and Direct-Pay Tax Credit Bond Provisions.”
Prepared by the Staff of the Joint Committee on Taxation (JCT), JCX-60-12, July 16, 2012.
54. Kaufmann, D. Kraay, and M. Mastruzzi. “Governance Matters V: Aggregate and Individual
Governance Indicators for 1996-2005.” The World Bank, September 2006.
55. Kessides, I.N. “Reforming Infrastructure: Privatization, Regulation, and Competition.” A World
Bank Policy Research Report, 2004 (co-publication with Oxford University Press).
56. Kidney, S. “Just Out: First emerging market green city bond...City of Johannesburg Green
Bond, approx R1.5bn ($139m), 1.5x oversubscribed.” Climate Bonds Initiative, June 5, 2014.
Available at: https://www.climatebonds.net/2014/06/just-out-first-emerging-market-
green-city-bond-city-johannesburg-green-bond-approx-r15bn
57. Kikeri, S. and J. Nellis. “An Assessment of Privatization.” The World Bank Research Observer,
Vol. 19, No. 1, Spring 2004.
58. Kim, J. “Understanding and Mitigating Political Risks of Public-Private Partnerships in U.S.
Infrastructure.” Working Paper, Stanford Global Projects Center, May 2014. Available at:
http://papers.ssrn.com/sol3/papers.cfm?abstract_id=2431915.
59. Kirk, R.S., and W. J. Mallet. “Funding and Financing Highways and Public Transportation.”
Congressional Research Service (CRS) Report, September 23, 2013.
60. Knight, E. and R. Sharma. “Retooling In-House Investment Team Inside Institutional Investors.”
What a CAIA Member Should Know, Alternative Investment Analyst Review, 2013.
61. KPMG International. “Sustainable Insight: Gearing up for green bonds.” 2015.
Available at: https://www.kpmg.com/Global/en/IssuesAndInsights/ArticlesPublications/
sustainable-insight/Documents/gearing-up-for-green-bonds-v2.pdf
62. KPMG, “Linking Cities to Finance: Overcoming Bottlenecks to Financing Strategic Urban
Infastructure Investments.” commissioned by Cities Development Initiative for Asia (CDIA)
and InWent, September 27-28, 2010, Shanghai, China.
63. Lazo, A. “How Cap-and-Trade Is Working in California.” The Wall Street Journal, September

131
Handbook on Urban Infrastructure Finance
28, 2014. Avaliable at: http://www.wsj.com/articles/how-cap-and-trade-is-working-in-
california-1411937795.
64. Long Finance. “Financing the Transition: Sustainable Infrastructure in Cities.” A Long
Finance report prepared by Z/Yen Group and commissioned by WWF, March 2015.
65. Lucas, D., “Valuation of Government Policies and Projects.” Annual Review of Financial
Economics, Vol. 4, 2012.
66. Lucas, D., “Evaluating the Cost of Government Credit Support: The OECD Context.”
Economic Policy, July 2014. Printed in Great Britain,
67. Lucas, D., and D. Moore, “Guaranteed versus Direct Lending: The Case of Student Loans
(Chapter 7).” Measuring and Managing Federal Financial Risk, University of Chicago Press,
February 2010a, ISBN 0-226-49658-9. Available at http://www.nber.org/chapters/c3038.
68. Lucas, D., and M. Phaup, “The Cost of Risk to the Government and Its Implications for
Federal Budgeting (Chapter 3).” Measuring and Managing Federal Financial Risk, University
of Chicago Press, February 2010b, ISBN 0-226-49658-9. Available at http://www.nber.
org/chapters/c3039.
69. Macomber, J.D. “The Future of Cities Depends on Innovative Financing.” Havard Business
Review, January 11, 2016. Available at: https://hbr.org/2016/01/the-future-of-cities-
depends-on-innovative-financing
70. Manchanda, K., and P. Muralidharan, P. “Crowdfunding: A New Paradigm in Start-Up
Financing.” Global Conference on Business and Finance Proceedings, Volume 9, Number
1, 2014.
71. Mansour, A. and H. Nadji. “U.S. Infrastructure Privatization and Public Policy Issues.” RREEF
Research, September 2006.
72. Mansour, A. and H. Nadji. “Performing Characteristics of Infrastructure Investment,” RREEF
Research, August 2007.
73. McKinsey, “A Hidden Roadblock in Public Infrastructure Projects.” Corporate Finance
Practice, McKinsey & Company, 2015.
74. MGI, “Urban World: Mapping the Economic Power of Cities.” McKinsey Global Institute
(MGI), McKinsey & Company, March 2011.
75. MGI, “Urban World: Cities and the Rise of the Consuming Class.” McKinsey Global Institute
(MGI), McKinsey & Company, June 2012.
76. MGI/MIP, “Infrastructure Productivity: How to Save $1 Trillion a Year.” McKinsey Global
Institute/McKinsey Infrastructure Practice (MGI/MIP), McKinsey & Company, January
2013.
77. Minred, B.S., A.B. Walsh, J. Pass, A. Li, C. Randall, D.A. Stone, and P. Hollowell. “Finance::
Relative Value and Tight Supply.” Municipal Market Outlook, Guggenheim Investments,
May 2014. Available at https://issuu.com/guggenheimpartners/docs/may_2014_
municipal_market_outlook

132
References
78. NSTPRSC. “Transportation for Tomorrow.” Report of the U.S. National Surface
Transportation Policy and Revenue Study Commission (NSTPRSC) (per Section 1909 of
SAFETEA-LU), December 2007.
79. NSW State. “Final Report of the Special Commission of Inquiry into the Electricity
Transactions.” With a recommendation under s. 10(3) of the Special Commissions of
Inquiry Act 1983 that the report be made public, State of New South Wales (NSW) through
the Special Commission, October 2011.
80. O’Connor, W. “Los Angeles Has Swapped Out 140,000 Street Lights for Highly Efficient
LEDS.” The Daily Beast/Light Switch, June 20, 2013. Available at: http://www.thedailybeast.
com/articles/2013/06/20/los-angeles-has-swapped-out-140-000-street-lights-for-
highly-efficient-leds.html
81. OECD. “Infrastructure to 2030, Mapping Policy for Electricity, Water and Transport (Volume
2).” Organization for Economic Cooperation and Development (OECD), 2007a.
82. OECD. “Investment Strategies and Financial Tools for Local Development.” Edited by Greg
Clark and Debra Mountford, Organization for Economic Cooperation and Development
(OECD), Local Economic and Employment Development (LEED), 2007b.
83. OECD. “Dedicated Public-Private Partnership Units: Survey of Institutional and Governance
Structure.” Organization for Economic Cooperation and Development (OECD), 2010.
84. OECD. “Pension Funds Investment in Infrastructure: A Survey.” International Futures
Programme—Project on Strategic transport Infrastructure to 2030, Organization for
Economic Cooperation and Development (OECD), September 2011.
85. Orr, R.J. and B. Metzger. “General Counsel’s Roundtable: Legacy of Failed Projects.” The
Collaboratory for Research on Global Projects (CRGP) Working Paper Series 1-49, Stanford
University, 2005.
86. Oum, T. H., J. Yun, and C. Yu. “Ownership Forms Matter for Airport Efficiency: A Stochastic
Frontier Investigation of Worldwide Airports.” Journal of Urban Economics 64, p. 422-435,
2008.
87. Pew, “The Fiscal Health of State Pension Plans: Funding Gap Continues to Grow.” A Fact
sheet from The Pew Charitable Trusts (Pew), March 2014.
88. Pigeon, M., D. McDonald, O. Hoedemand, and S. Kishimoto. “Remunicipalization: Putting
Water Back into Public Hands.” published by Transnational Institute, Amsterdam, March
2012. (ISBN 978-94-6190-831-5)
89. Poole, R.W. “Annual Privatization Report 2015: Transportation Finance.” Edited by Leonard
Gilroy, May 2015.
90. Reed, D. “US cities turn could turn to “community mini bonds” to fund
infrastructure projects.” CityMetric, September 29, 2014. Available at:
http://www.citymetric.com/politics/us-cities-turn-could-turn-community-mini-bonds-
fund-infrastructure-projects-341
91. Reindl, J.C. “Detroit streetlight repairs ahead of schedule.” Detroit Free Press,
133
Handbook on Urban Infrastructure Finance
December 4, 2014. Available at: http://www.freep.com/story/news/local/michigan/
detroit/2014/12/04/new-streetlights-detroit-progress/19866749/
92. Ross, B. :Financial Benefits of Using Crod-financing for a P3.” December 20 2015. Available at:
https://www.linkedin.com/pulse/financial-benefits-using-crowd-financing-p3-brian-
ross
93. RREEF. “A Compelling Investment Opportunity: The Case for Global Listed Infrastructure
Revisited.” RREEF America LLC, July 2011.
94. Rybeck, R. “Just Economics—Value Capture Methods: Overview.” Transportation
Research Board (TRB) Annual Meeting, January 2015.
95. Samuel, P. “The Role of Tolls in Financing 21st Century Highways.” Policy Study 359,
Reason Foundation, May 2007.
96. Sandroni, P. “A New Financial Instrument of Value Capture in Sao Paulo: Certificates of
Additional Construction Potential.” Municipal Revenues and Land Policies, Proceedings
of the 2009 Land Policy Conference, edited by G. Ingram and Y. Hong, Lincoln Institute
of Land Policy, 2010.
97. Schmidt, J. “Opinion: A Sane Way to Upgrade Bridges, Ports and Transit.” The Wall Street
Journal, February 2, 2015.
98. Serva, L. “How Sao Paolo uses “value capture” to raise billions for infrastructure.”
Cityscope, May 22, 2014. Available at: http://citiscope.org/story/2014/how-sao-paulo-
uses-value-capture-raise-billions-infrastructure
99. Shoup, D. “Crusing for Parking.” University of California, Los Angeles (UCLA), 2007.
Available at: http://shoup.bol.ucla.edu/CruisingForParkingAccess.pdf
100. Singer, N. “Mission Control, Built for Cities.” The New York Times/Business Day, March
3, 2012. Available at: http://www.nytimes.com/2012/03/04/business/ibm-takes-
smarter-cities-concept-to-rio-de-janeiro.html
101. Smart Cities Council. “Smart Cities Financing Guide.” Expert analysis of 28 municipal
finance tools for city leaders investing in the future, Developed by the Center for Urban
Innovations at Arizona State University, 2014.
102. SMH, “Mike Baird’s Electricity Privatization Bills Pass NSW Parliament.” The Sydney
Morning Herald (SMH), June 3, 2015.
103. Smith, S. “Environmentally Related Taxes and Tradable Permit Systems in Practice.”
Center for Tax Policy and Administration, OECD Environment Directorate, June 11, 2008
104. Stephens, A. “Crowdfunding Fans Are Crazy About Denver’s Mini-Bonds.” Next City,
September 12, 2014. Available at: https://nextcity.org/daily/entry/denver-mini-
bonds-500-crowdfunding-cities.
105. Swiss Re. “Infrastructure Investing: It Matters.” published jointly by Swiss Re and
Institute of International Finance, 2014.
106. Swope C. and T. Kasse. “How Dakar (almost) got its first municipal bond to market.”

134
References
Cityscope, February 19, 2015. Available at: http://citiscope.org/story/2015/how-
dakar-almost-got-its-first-municipal-bond-market.
107. TxDOT. “Innovative Funding Strategies: How value capture methods have become part
of the strategy for innovative funding solutions.” Texas Depart of Transportation
(TxDOT), 2013 (?).
108. U.S. Treasury, “Treasury Analysis of Build America Bonds Issuance and Savings.” The
U.S. Depart of the Treasury, May 16, 2011.
109. Von Gunten, D. and S. Mills. “Fianancing Tomorrow’s Cities: Meta Analysis.” Z/Yen
Group and City of London Corporation, July 2014.
110. WEF. “Global Agenda—Accelerating Infrastructure Delivery: New Evidence from
International Financial Institutions.” World Economic Forum (WEF), April 2014.
111. WFAF. “Deterioration of Monoline Insurance Companies and the Repercussions for
Municipal Bonds.” Wells Fargo Advantage Funds (WFAF), 2008. Available at: https://
www.wellsfargofunds.com/pdf/whitepapers/monoline_insurance_muni_bonds.pdf.
112. Whitehelm Capital. “Smart Cities: The Cisco-Whitehelm Capital Financing Model.”
January 2016 (draft, unpublished).
113. The World Bank. “Public-Private Partnership Units: Lessons for Their Design and Use
in Infrastructure.” The World Bank Public-Private Infrastructure Advisory Facility
(PPIAF), October 2007.
114. The World Bank. “Overcoming Constraints to the Financing of Infrastructure—Success
Stories and Lessons Learned: Country, Sector and Project Examples of Overcoming
Constraints to the Financing of Infrastructure.” prepared by the Staff of the World Bank
Group for the G20 Investment and Infrastructure Working Group, February 2014.
115. Wyman, O. “Funding the Future: Insurers’ Role as Institutional Investors.” Insurance
Europe, June 2013.
135
Handbook on Urban Infrastructure Finance
Photo Credit: Pusan Centum City - Flickr © LY Yang Photo Credit: Pusan Centum City - Flickr © LY Yang Agua Espraiada - Photo Credit: © claudiamurray
WITH SUPPORT FROM: