Handbook & Industry Measures
58
Private Bag 4800, Christchurch 8140 • Phone (03) 364 2478 • Fax (03) 364 2069 • www.caenz.com New Zealand Centre for Advanced Engineering • Christchurch • New Zealand The New Zealand Construction Industry National Key Performance Indicators Handbook & Industry Measures 2006 Data
Transcript of Handbook & Industry Measures

Priv
ate
Bag
480
0, C
hris
tchu
rch
8140
• P
hone
(03
) 36
4 24
78 •
Fax
(03
) 36
4 20
69 •
ww
w.c
aenz
.com
New
Zea
land
Cen
tre
for Ad
vanc
ed E
ngin
eering
• C
hris
tchu
rch
• New
Zea
land
The New Zealand Construction IndustryNational Key Performance Indicators
Handbook &
Industry Measures2006 Data


NZ Construction Industry KPIs 1
Version: 2007-2, June 2007; revised October 2007
This third edition of the New Zealand Construction Industry Key Performance Indicators (KPIs)was produced as a CAENZ project. The New Zealand Centre for Advanced Engineering (CAENZ)thanks the many participants whose valuable contributions have been incorporated into thisyear’s publication.
It is important to recognise that this pilot project was developed in part to promote furtherdevelopment of industry statistics and analysis to enhance contractor performance in thiscountry.
The work reported here is thus the first step in this process. The 2006 project was sponsoredby Building Research and has been developed by CAENZ in partnership with Building Research,BRANZ Limited, Constructing Excellence in the UK, and an industry-wide KPI Steering Group.
All rights reserved. No part of this publication may be reproduced, stored in a retrieval system, transmitted, orotherwise disseminated, in any form or by any means, except for the purposes of research or private study, criticism orreview, without the prior permission of the Centre for Advanced Engineering.
Copyright
© 2007 New Zealand Centre for Advanced Engineering
Contact Details
New Zealand Centre for Advanced Engineering Phone: +64 3 364 2478University of Canterbury Campus Fax: +64 3 364 2069Private Bag 4800 e-mail: [email protected] 8140 www.caenz.comNew Zealand
CAENZ is an independent-think tank and research facilitator funded bygrants and sponsorships. CAENZ’s mission is to advance social progress and
economic growth for New Zealand through broadening national understandingof emerging technologies and facilitating early adoption of advanced
technology solutions.
www.caenz.com

NZ Construction Industry KPIs2

NZ Construction Industry KPIs 3
Contents
Part 1Part 1Part 1Part 1Part 1 ................................................................................................................................................................................................................................................................................................................................................................................................................................................................................................................................................................................ 55555
1 1 1 1 1 Background to the KPI ProjectBackground to the KPI ProjectBackground to the KPI ProjectBackground to the KPI ProjectBackground to the KPI Project .................................................................................................................................................................................................................................................................................................................................................................................................................................................................. 7 7 7 7 7
1.1 The construction Industry today ................................................................................... 7
1.2 Performance Improvement ........................................................................................... 7
1.3 Performance Measurement ........................................................................................... 7
2 2 2 2 2 Introduction to KPIsIntroduction to KPIsIntroduction to KPIsIntroduction to KPIsIntroduction to KPIs .................................................................................................................................................................................................................................................................................................................................................................................................................................................................................................................................................. 9 9 9 9 9
2.1 The Purpose of the KPIs .............................................................................................. 9
2.2 Terminology ................................................................................................................. 9
2.3 KPIs in use .................................................................................................................. 10
2.4 Benefits of using measurement .................................................................................. 10
3 3 3 3 3 The MeasuresThe MeasuresThe MeasuresThe MeasuresThe Measures ............................................................................................................................................................................................................................................................................................................................................................................................................................................................................................................................................................................................... 13 13 13 13 13
3.1 Construction Industry KPIs and APIs ........................................................................... 13
3.2 Headline Indicators – KPIs .......................................................................................... 13
3.3 Additional Indicators – APIs ........................................................................................ 14
3.4 The ‘All Construction’ Wallchart .................................................................................. 15
4 4 4 4 4 Using the KPIsUsing the KPIsUsing the KPIsUsing the KPIsUsing the KPIs .......................................................................................................................................................................................................................................................................................................................................................................................................................................................................................................................................................................................... 15 15 15 15 15
4.1 Collecting Data ............................................................................................................ 15
4.2 Deciding what to benchmark against ......................................................................... 16
4.3 Measuring the Project or Company Benchmark score ................................................ 16
4.4 Reporting the Results ................................................................................................. 18
4.5 Analyse the Results .................................................................................................... 19
4.6 Take action.................................................................................................................. 19
4.7 Measure Again ............................................................................................................ 19
5 5 5 5 5 Methods of MeasurementMethods of MeasurementMethods of MeasurementMethods of MeasurementMethods of Measurement ................................................................................................................................................................................................................................................................................................................................................................................................................................................................................................ 21 21 21 21 21
5.1 Client Satisfaction family of measures ........................................................................ 21
5.2 Defects ....................................................................................................................... 23
5.3 Cost Predictability family of measures ...................................................................... 24
5.4 Time Predictability family of measures ...................................................................... 26
5.5 Safety (LTI) ................................................................................................................. 28
5.6 Profitability ................................................................................................................ 29
5.7 APIs - Safety Family of measures .............................................................................. 30
5.8 Profitability API – By Size Band ................................................................................. 34
Part 2Part 2Part 2Part 2Part 2 ............................................................................................................................................................................................................................................................................................................................................................................................................................................................................................................................................................ 35 35 35 35 35
6 6 6 6 6 Industry Report – The ResultsIndustry Report – The ResultsIndustry Report – The ResultsIndustry Report – The ResultsIndustry Report – The Results ............................................................................................................................................................................................................................................................................................................................................................................................................................................................. 37 37 37 37 37
6.1 Industry Average (Median) results ............................................................................. 37
6.2 The percentage of the industry reaching a ‘best practice’ target ............................. 38
6.3 KPI and API individual graphs ................................................................................... 39

NZ Construction Industry KPIs4
7 7 7 7 7 Appendix A KPI data sources ........................................................................................... 45 45 45 45 45
8 8 8 8 8 Appendix B – Sample Client Survey Questionnaire ......................................................... 47 47 47 47 47
9 9 9 9 9 Appendix C – Sample Contractor Safety Questionnaire .................................................. 53 53 53 53 53

NZ Construction Industry KPIs 5
Part I

NZ Construction Industry KPIs6

NZ Construction Industry KPIs 7
1.11.11.11.11.1 The construction Industry todayThe construction Industry todayThe construction Industry todayThe construction Industry todayThe construction Industry today
New Zealand’s built infrastructure underpins the country’s economic activity. The transportationnetwork enables people to be mobile. Housing and buildings give people their living and workspace. Water supply, sewage and refuse disposal systems support a healthy lifestyle. All NewZealanders benefit from a robust and cost effective built infrastructure.
The main contributor to infrastructure development and maintenance is the construction indus-try which accounts for around 15% of GDP and employs an estimated 14% of the NZ workforce1.
The construction industry in New Zealand at its best can compete with any in the world,however, there are a number of fundamental concerns:
1 The industry as a whole suffers from poor image, poor commercial performance, lack ofcustomer and quality focus.
2 There is a national skills shortage with young people turning to other industries for theircareer development.
3 The performance of the industry is inconsistent, some projects return world class results,whilst others fail completely and a whole range in between.
4 Most importantly, the evidence for all of the above is anecdotal. New Zealand does nothave a formal methodology in place to enable companies to measure and benchmark theirperformance.
The combination of these issues forces clients and the industry towards a ‘lowest price’ culture.Clients can only differentiate on price as there is no comparable trustworthy evidence onperformance. This leads to cost cutting in order to win work, adversarial relationships, andpoor commercial performance which negates investment in the people and technology of theindustry.
The whole represents a downward spiral which points to increasing costs and less value formoney for the delivery of NZ infrastructure.
1.21.21.21.21.2 Performance ImprovementPerformance ImprovementPerformance ImprovementPerformance ImprovementPerformance Improvement
Results from UK’s Constructing Excellence and Australia’s Construction Innovation programmeshow that significant improvements in economic performance can be achieved through innova-tion and sharing of best practice. Looking at just one recent study1 which applies the UK’s fouryear average performance improvement to New Zealand’s construction industry, there is apotential to realise a saving of some $600m1.
1.31.31.31.31.3 Performance MeasurementPerformance MeasurementPerformance MeasurementPerformance MeasurementPerformance Measurement
A fundamental component of any improvement programme in New Zealand relies on having anational performance measurement system in place.
Clients need a means of differentiating the better performing players.
The better performing players need a means of tangibly demonstrating their performance todifferentiate themselves from the poorer performers who rely on lowest price to win the job,
1 Background to theKPI Project
1 Clement Toh An Analysis of the Contribution of NZ’s Construction Sector to the National Economy, CAE 2004

NZ Construction Industry KPIs8
but are then unable to deliver.
All industry players need a means to measure their current performance and gain feedback onwhat needs to be improved to enable them to perform better.
Internationally, countries such as the UK have been able to demonstrate their year on yearindustry performance via a set of nationally recognised and supported Key Performance Indica-tors (KPIs). Figure 1 represents just one of a set of ten nationally recognised KPIs.
1999 2000 2001 2002 2003 2004
100.0 108.6 108.6112.1
122.4127.6
Client Satisfaction — Service200
180
160
140
120
100
80
60
40
Figure 1.1: One of UK’s ten KPIs demonstrating year-on-year industry improvement
Over the last few years, many NZ projects have established partnering/alliance and other bestpractices. Whilst benchmarking has been used in CAE’s demonstration Project Programme forthe last two years, and some companies measure certain indicators such as customer satisfac-tion, the results have been patchy and difficult to obtain. The complaint is that there is no‘national standard’ to enable:
a) the comparison of ‘apples to apples’; and
b) clear guidance on how to measure performance.
This project has seen the development and launch of a national set of KPIs for the NewZealand Construction Industry.

NZ Construction Industry KPIs 9
2 Introduction to KPIs
2.12.12.12.12.1 The Purpose of the KPIsThe Purpose of the KPIsThe Purpose of the KPIsThe Purpose of the KPIsThe Purpose of the KPIs
Worldwide, the annual publication of KPIs has been shown to stimulate a significant number ofconstruction industry clients and their suppliers to assess their performance critically, and totake positive action to instil a culture of continuous improvement.
Now, in line with a nationwide push towards innovation and world-class delivery, New Zealandis being measured and the results made publicly available. The measures will be carried outyear on year to demonstrate the trend and highlight opportunities for improvements in per-formance.
The premise on which these KPIs are published is that clients of the construction industry wanttheir projects delivered:
• On time
• Safely
• Free from defects
• On budget
• Efficiently By profitable companies
and those regular clients expect continuous improvement from their construction team toachieve year-on-year:
• Reductions in project costs
• Reductions in project times
With the publication of Construction Industry KPIs, it is anticipated that working groups repre-senting various parts of the construction industry will produce sets of KPIs which addresspeople management and environmental issues. These, together with the above largely eco-nomic performance indicators begin to address the whole sustainability agenda.
KPIs can be used to establish a basic system of measurement for these critical issues, forbenchmarking performance against the national levels of achievement, and for setting im-provement targets.
This first set has enabled a benchmark comparison to be made with the performance of the UKconstruction industry. It is hoped that the future will see more countries adopting these KPIsto enable wider international benchmarking.
2.22.22.22.22.2 TerminologyTerminologyTerminologyTerminologyTerminology
For the purposes of this handbook, the following definitions are used:
Performance IndicatorPerformance IndicatorPerformance IndicatorPerformance IndicatorPerformance Indicator: a measure of a factor critical to success
Benchmark: Benchmark: Benchmark: Benchmark: Benchmark: the best performance achieved
BenchmarkingBenchmarkingBenchmarkingBenchmarkingBenchmarking: comparing performance against others, and using lessons from the best tomake targeted improvements

NZ Construction Industry KPIs10
2.32.32.32.32.3 KPIs in useKPIs in useKPIs in useKPIs in useKPIs in use
KPIs provide a simple means of assessing performance against the range of performancecurrently being achieved in the NZ construction industry. The main ways that KPIs can be usedin the industry are:
• To provide a measurement framework for partnering and framework contracts
• To provide evidence of best value in public procurement
• To provide measures other than price to support procurement decisions
• As a marketing tool
• To meet the requirements of ISO 9001 quality management systems
• To provide a health check as part of a continuous improvement programme.
2.42.42.42.42.4 Benefits of using measurementBenefits of using measurementBenefits of using measurementBenefits of using measurementBenefits of using measurement
When used well, as part of a consistent improvement programme, KPIs can offer significantbenefits including:
• Targets can be realistically set based on national performance data.
• Improvement efforts are focussed on issues that show poorer performance and are criticalto success.
• Improvement targets are based on what has been achieved in practice, which removes thetemptation to say ‘it can’t be done’.
• Benchmarking provides confidence that your organisation’s performance compares favour-ably with best practice.
• For organisations in the public sector, benchmarking provides an assurance that ‘BestValue’ is being achieved.
Specific benefits can be achieved by the industry at various levels such as:
Industry and Government• Demonstrate how we perform nationally and internationally as an industry.
• Find out “Who performs better?” “Why are they better?” “What actions do we need to takein order to improve our performance?”
• Set policy to encourage improved performance.
Individual Companies, Contractors, Consultants, material suppliers etc• Benchmark against industry performance, use lessons learned from the best to make tar-
geted improvements.
• The better players are able to demonstrate that they can differentiate on performance, notjust price, developing a barrier to poorer performers in the market place.
Client Organisations• Benchmark against the industry and other client organisations whether they have a repeat
portfolio of ongoing projects such as retail organisations, developers and local governmentor clients with one-off projects.
• Choose the better performers using informed information
• Build contracts around incentives based on performance targets

NZ Construction Industry KPIs 11
Industry Bodies• A set of national KPIs will enable the various industry bodies to adapt and develop ‘2nd tier’
KPIs specific to their discipline or sector which will support the performance and improve-ment efforts of their members
Evidence from ‘best practice’ company’s shows that performance measurement and benchmarkingcan yield real benefit to companies by shining a spotlight on their performance and showingwhere action is needed to improve. However to be of value, the measurement system needs tobe founded on the correct principles.

NZ Construction Industry KPIs12

NZ Construction Industry KPIs 13
3.13.13.13.13.1 Construction Industry KPIs and APIsConstruction Industry KPIs and APIsConstruction Industry KPIs and APIsConstruction Industry KPIs and APIsConstruction Industry KPIs and APIs
The Construction Industry measures are predominantly concerned with economic issues. Thereare two levels of measure, KPIs and APIs.
At the highest level are the Headline or Key Performance Indicators (KPIs). These KPIs arerepresented in Section 3.2 and also on the ‘All Construction’ wallchart which includes data fromall the major construction industry sectors excluding material suppliers.
At the second level are the Additional Performance Indicators (APIs) for those wanting a slightlydifferent measure or more detail looking at one sector or type of construction. No APIs havebeen produced for 2006 at this time, except for profitability. It is envisaged that further APIswill be added or subtracted year on year as demand dictates.
3.23.23.23.23.2 Headline Indicators – KPIsHeadline Indicators – KPIsHeadline Indicators – KPIsHeadline Indicators – KPIsHeadline Indicators – KPIs
The headline KPIs comprise eleven measures in six families of measures:
1 Client Satisfaction
— Product
— Service
2 Quality - Defects
3 Predictability Cost
— Construction cost
— Design cost
— Project cost
4 Predictability Time
— Construction time
— Design time
— Project time
5 Safety (LTI)
6 Profitability
The Latter two measure Company performance, whilst the former measure project perform-ance.
Each graph shows the range of performance being achieved currently across the whole NewZealand construction industry.
Each KPI graph is derived from a representative sample of data obtained from surveys of theindustry (see page 47) which is arranged in a cumulative frequency graph from worst to bestperformance. The data are then divided into one hundred percentiles to allow the benchmarkscore to be calculated.
A note of cautionThe KPIs are produced from the best data available at the time of publication. Users shouldensure that they are comparing themselves against appropriate performance indicators. The
3 The Measures
NZ Construction Industry KPIs14
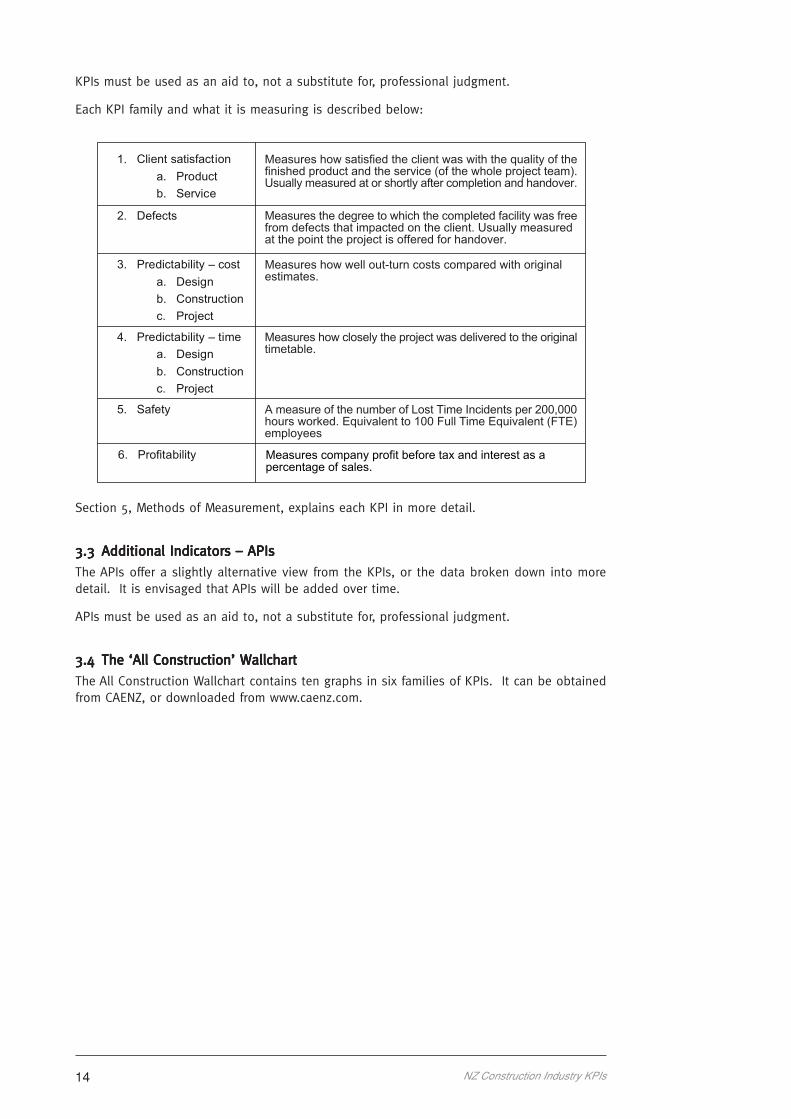
KPIs must be used as an aid to, not a substitute for, professional judgment.
Each KPI family and what it is measuring is described below:
on
me
on
Measures company profit before tax and interest as apercentage of sales.
Measures how satisfied the client was with the quality of thefinished product and the service (of the whole project team).Usually measured at or shortly after completion and handover.
Measures the degree to which the completed facility was freefrom defects that impacted on the client. Usually measuredat the point the project is offered for handover.
Measures how well out-turn costs compared with originalestimates.
Measures how closely the project was delivered to the originaltimetable.
A measure of the number of Lost Time Incidents per 200,000hours worked. Equivalent to 100 Full Time Equivalent (FTE)employees
cost
1.
2. Defects
3. Predictability –
a. Design
b. Constructi
c. Project
4. Predictability – ti
a. Design
b. Constructi
c. Project
5. Safety
6. Profitability
Client satisfaction
a. Product
b. Service
Section 5, Methods of Measurement, explains each KPI in more detail.
3.33.33.33.33.3 Additional Indicators – APIsAdditional Indicators – APIsAdditional Indicators – APIsAdditional Indicators – APIsAdditional Indicators – APIs
The APIs offer a slightly alternative view from the KPIs, or the data broken down into moredetail. It is envisaged that APIs will be added over time.
APIs must be used as an aid to, not a substitute for, professional judgment.
3.43.43.43.43.4 The ‘All Construction’ WallchartThe ‘All Construction’ WallchartThe ‘All Construction’ WallchartThe ‘All Construction’ WallchartThe ‘All Construction’ Wallchart
The All Construction Wallchart contains ten graphs in six families of KPIs. It can be obtainedfrom CAENZ, or downloaded from www.caenz.com.

NZ Construction Industry KPIs 15
To use the KPIs, you will need to firstly collect your own data and analyse it to compare it tothe National measures and obtain your benchmark scores. After that, there are a number ofuseful steps to go through. These are:
• Collecting Data
• Deciding what to benchmark against
• Measuring the Project or Company benchmark score
• Reporting the Results
• Analysing the Results
• Taking Action
• Remeasuring
Each of these stages above are described in more detail in this section.
4.14.14.14.14.1 Collecting DataCollecting DataCollecting DataCollecting DataCollecting Data
Normally, data will have to be collected from 2 sources - existing records and new surveys. Theresponsibility for providing data for the KPIs rests with both client and suppliers.
A contractor will normally be able to provide information on predictability of cost and time forthe construction phase, and safety, but will have to go to the client to get data on clientsatisfaction and defects. On the other hand, a client will know results for satisfaction anddefects, but will have to obtain information from their suppliers on the company measuressuch as profitability and safety.
A basic data collection form which can be copied is included in the Appendix on page 49.
Remember:
• Keep data collected from different projects separate.
• Record honestly. Some problems may be outside your direct control, but if the problemcannot be identified it cannot be solved!
• Maintain a simple audit trail - you may be asked to show where your data came from.
You will need to understand the Key Project Stages (detailed below) in order to collect theappropriate data.
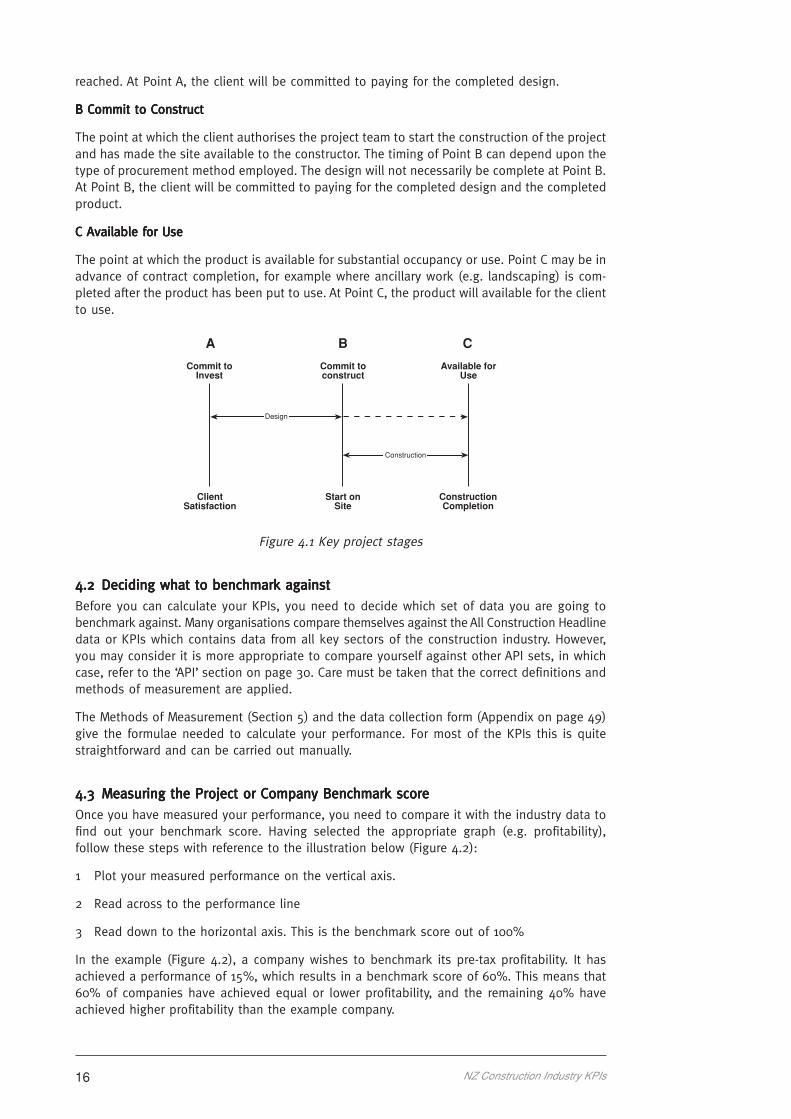
The Key Project StagesIn order to collect data and use the KPIs, three project stages have been identified. Thesestages are described below and shown diagrammatically in Figure 4.1.
A Commit to InvestA Commit to InvestA Commit to InvestA Commit to InvestA Commit to Invest
The point at which the client decides to invest in a project for an agreed budget, sets out thebusiness requirements in a client’s brief and appoints and authorises the project team tocomplete the design. Early cost advice, feasibility studies, outline planning permission, plan-ning appeals, land bank appraisals, etc would normally be carried out before Point A was
4 Using the KPIs
NZ Construction Industry KPIs16
reached. At Point A, the client will be committed to paying for the completed design.
B Commit to ConstructB Commit to ConstructB Commit to ConstructB Commit to ConstructB Commit to Construct
The point at which the client authorises the project team to start the construction of the projectand has made the site available to the constructor. The timing of Point B can depend upon thetype of procurement method employed. The design will not necessarily be complete at Point B.At Point B, the client will be committed to paying for the completed design and the completedproduct.
C Available for UseC Available for UseC Available for UseC Available for UseC Available for Use
The point at which the product is available for substantial occupancy or use. Point C may be inadvance of contract completion, for example where ancillary work (e.g. landscaping) is com-pleted after the product has been put to use. At Point C, the product will available for the clientto use.
A B C
Commit toInvest
Commit toconstruct
Available forUse
ClientSatisfaction
Start onSite
ConstructionCompletion
Construction
Design
Figure 4.1 Key project stages
4.24.24.24.24.2 Deciding what to benchmark againstDeciding what to benchmark againstDeciding what to benchmark againstDeciding what to benchmark againstDeciding what to benchmark against
Before you can calculate your KPIs, you need to decide which set of data you are going tobenchmark against. Many organisations compare themselves against the All Construction Headlinedata or KPIs which contains data from all key sectors of the construction industry. However,you may consider it is more appropriate to compare yourself against other API sets, in whichcase, refer to the ‘API’ section on page 30. Care must be taken that the correct definitions andmethods of measurement are applied.
The Methods of Measurement (Section 5) and the data collection form (Appendix on page 49)give the formulae needed to calculate your performance. For most of the KPIs this is quitestraightforward and can be carried out manually.
4.34.34.34.34.3 Measuring the Project or Company Benchmark scoreMeasuring the Project or Company Benchmark scoreMeasuring the Project or Company Benchmark scoreMeasuring the Project or Company Benchmark scoreMeasuring the Project or Company Benchmark score
Once you have measured your performance, you need to compare it with the industry data tofind out your benchmark score. Having selected the appropriate graph (e.g. profitability),follow these steps with reference to the illustration below (Figure 4.2):
1 Plot your measured performance on the vertical axis.
2 Read across to the performance line
3 Read down to the horizontal axis. This is the benchmark score out of 100%
In the example (Figure 4.2), a company wishes to benchmark its pre-tax profitability. It hasachieved a performance of 15%, which results in a benchmark score of 60%. This means that60% of companies have achieved equal or lower profitability, and the remaining 40% haveachieved higher profitability than the example company.

NZ Construction Industry KPIs 17
Dealing with ‘flat’ sections on graphsDealing with ‘flat’ sections on graphsDealing with ‘flat’ sections on graphsDealing with ‘flat’ sections on graphsDealing with ‘flat’ sections on graphs
A number of KPI graphs have sections where the performance line runs horizontally. This isbecause the underlying data set contains a relatively large number of results of the same value.
To achieve a correct benchmark score in these cases follow these steps with reference to theillustration below (Figure 4.3):
1 Plot the measured benchmark score on the vertical axis (1).
2 Read across to the graph line (2).
3 If the graph line is intersected at a ‘flat’ zone, follow the graph line to the last point ofcontact (3).
4 Read down to the horizontal axis (4). This is the company/project benchmark score out of100%.
10%0% 20% 30% 40% 50% 60% 70% 80% 90% 100%
New Zealand KPIProfitability - All FTEs
Benchmark Score
Per
form
ance
Sco
re
0%
10%
20%
30%
40%
50%
-10%
-20%
-30%
-40%
-50%
Figure 4.2: Measuring the Project or Company Benchmark
-10%
10%0% 20% 30% 40% 50% 60% 70% 80% 90% 100%
New Zealand KPIPredictability Cost - Design
Benchmark Score
Per
form
ance
Sco
re
-20%
-30%
10%
0%
20%
30%
Figure 4.3: Dealing with ‘flat’ sections on graphs

NZ Construction Industry KPIs18
In the example (see Figure 4.3) a company wishes to benchmark its predictability of cost ofdesign.
It has achieved a performance of 0% which equates to a benchmark score of 82%. This meansthat 82% of projects have been delivered on cost, or at a higher design cost, than the exampleproject, and 18% have been delivered at a lower design cost than the example project.
4.44.44.44.44.4 Reporting the ResultsReporting the ResultsReporting the ResultsReporting the ResultsReporting the Results
Now you have your benchmark scores, you need to let someone know about them. A conven-ient way to do this is to plot them on the radar chart contained on each wallchart.
The radar chart gives a rapid picture of the organisation’s overall benchmark performance. Inorder to complete the radar chart, take the benchmark scores for each KPI, plot each result onthe appropriate axis of the radar chart, and join with a line (see Figure 4.4). In general, thenearer the plotted line is to the outer perimeter of the radar chart, the higher the overallperformance.
Client Satisfaction -Product
Client Satisfaction -Service
Defects
Predictability Cost -Design
Predictability Cost -Construction
Predictability Cost - Project
Predictability Time -Design
Predictability Time -Construction
Predictability Time -Project
Safety Lost TimeIncidents (LTI)
Profitability
65%
25%
60%
86%
51%
63%
43%77%
7%
13%
100%
80%
60%
40%
20%
Figure 4.4: Example of a completed Radar Chart
It is straightforward to make your own radar chart using a standard spreadsheet programme.To avoid confusion make it clear exactly what the results refer to (e.g. an individual project,several projects, or the average for your organisation over the past 12 months).
Averaging performanceAveraging performanceAveraging performanceAveraging performanceAveraging performance
A number of organisations gather data on several projects and wish to plot their averageperformance.
The correct way to do this is to calculate the benchmark score for each project separately, thenaverage the benchmark score. For example, an organisation completed 3 projects and meas-ured client satisfaction.
The results are shown in the following table.

NZ Construction Industry KPIs 19
Performance
(using the 1-10 scale)
Benchmark
Score
5 25%
8 65%
9 90%
The overall performance is the average benchmark score (i.e. (25+65+90)/3 = 60%). It wouldbe wrong to take the average performance (i.e. (5+8+9)/3 = 7.3) and use this to derive anoverall benchmark score.
4.54.54.54.54.5 Analyse the ResultsAnalyse the ResultsAnalyse the ResultsAnalyse the ResultsAnalyse the Results
The radar chart paints a broad picture of strengths and weaknesses. It is important that you letthe data ‘speak’ to you.
Look for links between different benchmark scores. For example, high benchmark scores fortime predictability linked with low scores for client satisfaction with the product may indicatethat corners are being cut to get the job done on time.
Set clear decision criteria to judge what action is needed. For example, some organisationsconsider that performance that is below the industry average is unacceptable and must befollowed up with corrective action.
4.64.64.64.64.6 Take actionTake actionTake actionTake actionTake action
Too many organisations stop at just reporting the results, so they never get the benefit of usingtheir performance data to make improvements. Action will be needed to maintain strengthsand to eliminate weaknesses.
The KPIs cannot themselves tell you what action you need to take.
Key points to think about are:
Avoid strategies that improve one aspect at the expense of another (e.g. improve profitabilityby cutting corners on the product and increasing defects).
Improvements will take time, and may involve joint action between clients and suppliers. Forthis reason KPIs are ideally suited to support partnering.
4.74.74.74.74.7 Measure AgainMeasure AgainMeasure AgainMeasure AgainMeasure Again
Now you have completed your first set of KPIs it is vital that you capitalise on the lessonslearned! There will be further improvements to be made, and you may need to review yourmeasurement system and adjust it in the light of your experience to make it work moreeffectively for you.
Remember, high performing athletes collect and analyse a whole range of data on their per-formance, looking for ways to stay ahead. You wouldn’t expect them to win one race and thenstop checking their performance, so don’t fall into the trap of using KPIs once and thenforgetting them. Keep them in the forefront of people’s minds by carrying out regular checksand performance reviews, and publicising the results widely.
There is no right answer to the question “How often should I measure my performance?” Thetable below gives some guidelines, but it is up to you to decide. Remember, too little sends outa signal that “This is not important” and too much can lead to overload and “analysis paraly-sis!”

NZ Construction Industry KPIs20

NZ Construction Industry KPIs 21
This section gives the methods of measurement for use with the All Construction Key Perform-ance Indicators (KPIs) and Additional Performance Indicators (APIs).
To use the Construction Industry KPIs correctly, it is vital that the correct definition and methodis used. This section provides the purpose, definition, method, formula and an example foreach of the 11 KPIs and 4 APIs. Note that, except for the Profitability API, no graphs areprovided for the Safety APIs. The Safety APIs are provided in this section as examples ofalternative measures that a company may decide to use for internal reporting.
The methods of measurement should be used in conjunction with the measurement processdescribed in Section 4.
KPIsKPIsKPIsKPIsKPIs
5.15.15.15.15.1 Client Satisfaction family of measuresClient Satisfaction family of measuresClient Satisfaction family of measuresClient Satisfaction family of measuresClient Satisfaction family of measures
1. Client Satisfaction Product
Purpose To determine the overall level of client satisfaction with the
completed product.
Definition How satisfied the client was with the finished product/facility,
using a 1 to 10 scale, where:
Method 1. On completion of each project, carry out a survey with the client
to determine how satisfied the client was with the finishedproduct/facility using the 1 to 10 scale above.
2. From the Client satisfaction - product KPI graph, measure the
benchmark score.
Formula The performance score for Client satisfaction - product is the rating
from the client survey.
Example During a post-project review, the client scores satisfaction with the
product at 8 out of 10. Using the Client’s satisfaction - product
graph to calculate a benchmark score, the rating of 8 equates to a
benchmark score of 55% on the All Construction chart.
Note This question may be asked as part of a more comprehensive
survey or post-project review.
10 = Totally satis ied
8 = Mostly Satisfied
5/6 = Neither satisfied nor dissatisfied
3 = Mostly dissatisfied
1 = Totally dissatisfied
f
5 Methods of Measurement

NZ Construction Industry KPIs22
2. Client Satisfaction Service
Purpose To determine the overall level of client satisfaction with the service
of the consultants and main contractor during the project.
Definition How satisfied the client was with the service of the consultants and
main contractor, using a 1 to 10 scale, where:
Method 1. On completion of each project, carry out a survey with the client
to determine how satisfied the client was with the service of theconsultants & the contractor using the 1 to 10 scale above.
2. From the Client satisfaction - service KPI graph, measure the
benchmark score.
Formula The performance score for Client satisfaction - service is the rating
from the client survey.
Example During a post-project review, the client scores satisfaction with the
product at 6 out of 10. Using the Client’s satisfaction - service
graph to calculate a benchmark score, the rating of 6 equates to a
benchmark score of 5% on the All Construction chart.
Note This question may be asked as part of a more comprehensive
survey or post-project review.
10 = Totally satisfied
8 = Mostly Satisfied
5/6 = Neither satisfied nor dissatisfied
3 = Mostly dissatisfied
1 = Totally dissatisfied

NZ Construction Industry KPIs 23
5.25.25.25.25.2 DefectsDefectsDefectsDefectsDefects
Purpose To assess the impact on the client of any defects at the point of
handover.
Definition The condition of the product/facility with respect to defects at the
time of handover, using a 1 to 10 where:
Method 1 On completion of the project
2 From the Defects KPI graph
Formula The performance score for defects is the rating from the client
survey.
Example During the inspection at the point of handover, a small number of
minor defects are discovered which can be corrected within the
first month of use with minor disruption to the facility. The client
scores the project 7 out of 10. Using the Defects graph to calculate
a benchmark score, the rating of 7 equates to a benchmark score of25% on the All Construction chart.
Note This question may be asked as part of a more comprehensive
survey or post-project review.
10 = Apparently defect free
8 = A few defects and no significant impact on the client
5/6 = Some defects and some impact on the client
3 = Major defects with a major impact on the client
1 = Totally defective

NZ Construction Industry KPIs24
5.35.35.35.35.3 Cost Predictability family of measuresCost Predictability family of measuresCost Predictability family of measuresCost Predictability family of measuresCost Predictability family of measures
There are three KPIs – one for design cost (A to C) and one for construction cost (B to C) andone for the overall project (A to C).
Cost Predictability – Design, Construction & Project
Purpose To measure the reliability of cost estimates for (i) Design, (ii) Construction & (iii) the Project overall
Definition i Design cost – actual cost at Available for Use (C) less the estimated cost at Commit to Invest (A), expressed as a percentage of the estimated cost at Commit to Invest (A).
ii Construction cost – actual cost at Available for Use (C) less the estimated cost at Commit to Construct (B), expressed as a percentage of the estimated cost at Commit to Construct (B).
iii Project cost – actual cost at Available for Use (C) less the estimated cost at Commit to Invest (A), expressed as a percentage of the estimated cost at Commit to Invest (A).
Method 1 Identify the estimated and actual cost of design at A and C or the estimated and actual cost of construction at B and C, or the estimated and actual coat of the whole project as applicable, for a completed project.
2 Calculate the percentage change between the later and the earlier cost.
3 From the Predictability-cost KPI graph for design, construction or project, measure the benchmark score.
Formula Performance (%) predictability cost - design =
Actual design cost at C – Estimated design cost at A x 100
Estimated design cost at A
Performance (%) predictability cost - construction =
Actual construction cost at C – Estimated construction cost at B x 100
Estimated construction cost at B
Performance (%) predictability cost - project =
(Actual design + construction cost at C) – (Estimated design + construction cost at A) x 100
(Estimated design + construction cost at A)
Example Using the following data for a project:
Estimated cost of design at A = $500k
Final cost of design at C = $490k
Estimated cost of construction at A
= $3,300k
Tendered cost of construction at B
= $3,400k
Final cost of construction at C = $3,475k
Predictability cost - design (A to C) = $490k – $500k x 100 = –2%
$500k

NZ Construction Industry KPIs 25
Using the Predictability - cost (Design) graph to calculate a benchmark score, minus 2% equates to a benchmark score of 72% on the All Construction chart.
Predictability cost - construction (B to C) =
$3,475k – $3,300k x 100 = +5.3%
$3,300k
Using the Predictability - cost (Construction) graph to calculate a benchmark score, plus 5.3% equates to a benchmark score of 31% on the All Construction chart.
Predictability cost - construction (A to C) = ($490k + $3,475k) – ($500k + $3,400k) x 100 = +1.7%
($500k + $3,400k)
Using the Predictability - cost (Project) graph to calculate a benchmark score, plus 1.7% equates to a benchmark score of 58% on the All Construction chart.

NZ Construction Industry KPIs26
5.45.45.45.45.4 Time Predictability family of measuresTime Predictability family of measuresTime Predictability family of measuresTime Predictability family of measuresTime Predictability family of measures
There are three indicators – one for the design phase (A to B), one for the construction phase(B to C) and one for the overall project (A to C).
Time Predictability – Design, Construction & Project
Purpose To measure the reliability of time estimates for (i) design, (ii) construction and (iii) the whole project.
Definition i Design time – actual duration at Commit to Construct (B) less the estimated duration at Commit to Invest (A), expressed as a percentage of the estimated duration at Commit to Invest (A).
ii Construction time – actual duration at Available for Use (C) less the estimated duration at Commit to Construct (B), expressed as a percentage of the estimated duration at Commit to Construct (B).
iii Project time – actual duration at Available for Use (C) less the estimated duration at Commit to Invest (A), expressed as a percentage of the estimated duration at Commit to Invest (A).
Method 1 Identify the estimated and actual time for design between A and B or the estimated and actual time for construction between B and C, or the estimated and actual time for the whole project between A and C as applicable, for a completed project.
2 Calculate the percentage change between the later and the earlier time.
3 From the Predictability-time, design, cost or project KPI graph, measure the benchmark score.
Formula Performance (%) predictability time - design =
Actual design time at B – Estimated design time at A x 100
Estimated design time at A
Formula Performance (%) predictability time - construction = Actual construction time at C – Estimated construction time at B x 100
Estimated construction time at B
Formula Performance (%) predictability cost - construction =
(Actual design + construction time at C) – (Estimated design + construction time at A) x 100
(Estimated design + construction time at A)
Example Using the following data for a project:
Estimated design time at A weeks = 60
Actual design time at B weeks = 68
Estimated construction period at A = 54 weeks
Construction contract period at B = 56 weeks
Actual construction period at C = 60 weeks
Predictability time - design (A to B) =
68 weeks – 60 weeks x 100 = +13%
60 weeks

NZ Construction Industry KPIs 27
Using the Predictability - time (Design) graph to calculate a benchmark score, plus 13% equates to a benchmark score of 50% on the All Construction chart.
Predictability time - construction (A to B) =
60 weeks – 56 weeks x 100 = +7%
56 weeks
Using the Predictability - time (Construction) graph to calculate a benchmark score, plus 7% equates to a benchmark score of 30% on the All Construction chart.
Predictability time - construction (A to C) =
(68 + 60 weeks) – (60 + 54 weeks) x 100 = +12.3%
(60 + 54 weeks)
Using the Predictability - time (Project) graph to calculate a benchmark score, plus 12.3% equates to a benchmark score of 50% on the All Construction chart.

NZ Construction Industry KPIs28
5.55.55.55.55.5 Safety (LTI)Safety (LTI)Safety (LTI)Safety (LTI)Safety (LTI)
This KPI has been chosen as most companies in New Zealand measure the number of Lost TimeIncidents per 200,000 man hours (equivalent to 100 FTEs per year. excluding subcontractors).It is a company measure not a project measure.
However, the APIs include measures which include 100,000 employed and other ways of meas-uring safety incidents such as 3 day injuries etc. It is important to choose a method which isright for your business and fits with the way you currently collect data if at all possible.
Purpose To measure the number of Lost Time Incidents per 200,000 man-hours worked.
Definition Lost Time Incidents (i.e. Lost Time injuries/fatalities which require time away from work).
Method 1 Identify the number of Lost Time Incidents in the year - on a
properly managed site, details of all accidents will be recorded in the accident book.
Note: There is a sample data collection form at Appendix C.
2 Identify the number of man hours worked in the year, for your company only.
3 Select the LTI Safety KPI graph and measure the benchmark
score.
Formula Performance (LTI) Safety = Number of Lost Time Injuries per year x 200,000
Number of man-hours worked in the year
Example Using the following data for a company
Number of Lost Time Incidents in the year
= 5
Number of Man-hours worked in the year
= 142,850
Performance (LTI) Safety =
5 x 200,000 = 7
142,850
Using the Safety KPI graph to calculate a benchmark score, the LTI of 7 equates to a benchmark score of 70%.
Note The above example uses a firm wishing to calculate its ‘company safety’ (LTI) over the period of a year. Organisations wishing to calculate safety LTI over a different period or at a project rather than company level can use exactly the same method, but use the data for the period chosen or the project.
Care should be taken when comparing project results against KPI
graphs of company performance as the results could be misleading.
Not all lost time incidents are recorded. The Safety (LTI) KPI graph has been adjusted to take account of this.
In this first year, the sample size of companies responding to the survey was small. Therefore, care should be taken in using this KPI & the Safety APIs.

NZ Construction Industry KPIs 29
5.65.65.65.65.6 ProfitabilityProfitabilityProfitabilityProfitabilityProfitability
Purpose To measure the profitability of a construction company before tax and interest.
Definition Company profit before tax and interest as a percentage of sales.
Method 1 Take the value of profit before tax and interest published in the annual accounts and express it as a percentage of the value of sales.
2 From the Profitability KPI graph, measure the benchmark score.
Formula Performance (%) profitability = Profit before tax and interest x 100
Value of Sales
Using the following data for a company:
Profit before tax and interest $210k
Example
Value of sales $3.0m
Performance (%) profitability = $0.21m x 100 = +7%
$3.0m
Using the Profitability graph to calculate a benchmark score, plus 7.0% equates to a benchmark score of 48% on the All Construction chart.
Note: Organisations wishing to calculate Profitability at a project rather than company level should use the formula:
Performance (%) profitability =
Project profit x 100
Project final account plus head office charges
Care should be taken when comparing project results against KPI graphs of company performance as the results could be misleading.

NZ Construction Industry KPIs30
5.75.75.75.75.7 APIs - Safety Family of MeasuresAPIs - Safety Family of MeasuresAPIs - Safety Family of MeasuresAPIs - Safety Family of MeasuresAPIs - Safety Family of Measures
These APIs have been chosen as some companies in New Zealand measure accidents in aslightly different way. This set should enable most companies in New Zealand to be able tointernally benchmark their performance without dramatically changing the way they currentlymeasure and report. All measures are company measures.
a. Safety LID – Lost Incident Days
Purpose To measure the number of Lost Incident Days per 200,000 man-hours worked.
Definition Lost Incident Days (i.e. Days where work is not performed due to a safety incident). For your company only.
1 Identify the number of Lost Incidents Days in the year - on a properly managed site, details of all accidents will be recorded in the accident book. A best practice site should also record the no. of Lost Incident Days.
Note: There is a sample data collection form at Appendix C.
2 Identify the number of man hours worked in the year by ftes, for your company only.
3 Calculate the rate of LIDs per 200,000 hours worked
Method
4 Select the LID Safety API graph and measure the benchmark score.
Formula Performance (LID) Safety = Number of Lost Incident Days per year x 200,000
Number of man-hours worked in the year
Using the following data for a company
Number of Lost Time Incidents in the year
= 15
Number of Man-hours worked in the year
= 142,850
Example
Performance (LID) Safety = 15 x 200,000 = 21
142,850
Notes Organisations wishing to calculate LID at a project rather than company level should use the formula:
Performance (LID) Safety = Number of Lost Incident Days during project x 200,000 x 52
Number of Man-hours worked during the project Duration (wks)
Care should be taken when comparing project results against KPI/API graphs of company performance as the results could be misleading. Not all incidents are recorded.

NZ Construction Industry KPIs 31
b. Safety MIR – Medical Injury Rate
Purpose To measure the number of medical injuries (any work related injury which requires professional medical treatment) per 200,000 hours worked (by full time equivalent employees in the company).
Definition Medical injuries per 200,000 hours worked..
1 Identify the number of Medical Injury Cases in the year - on a
properly managed site, details of all accidents will be recorded in the accident book. A best practice site should also record the no. of Medical Injury Cases.
Note: There is a sample data collection form at Appendix C.
2 Identify the number of man hours worked in the year, for your
company only.
3 Calculate the rate of MIRs per 200,000 hours worked
Method
4 Select the MIR Safety API graph and measure the benchmark
score.
Formula Performance (MIR) Safety = Number of Medical Injury Cases per year x 200,000
Number of man-hours worked in the year
Using the following data for a company
Number medical injuries in the year
= 22
Number of Man-hours worked in the year
= 142,850
Example
Performance (MIR) Safety =
22 x 200,000 = 30
142,850
Note Organisations wishing to calculate LDI at a project rather than company level should use the formula:
Performance (MIR) Safety =
Number of Medical Injuries during project x 200,000 x 52
Number of Man-hours worked during the project Duration (wks)
Care should be taken when comparing project results against
KPI/API graphs of company performance as the results could be misleading.
Not all incidents are recorded.

NZ Construction Industry KPIs32
c. Safety AIR – Accident Injury Rate
This is the measure used in the UK Safety KPI to track the UK company safety performance & enables direct comparison with performance in New Zealand companies if desired.
Purpose To measure the number of Over 3 Day Lost Time Incidents (i.e. lost time injuries/fatalities which require more than 3 days away from work) per 100,000 employed (i.e. full time equivalent employees in the company) in the year.
Definition Over 3 Day Lost Time Incidents per 100,000 employed per year.
1 Identify the number of Lost Time Injury Cases in the year requiring
more than 3 days off work- on a properly managed site, details of all accidents will be recorded in the accident book. A best practice site should also record the length of time that the person was away from work due to the injury.
Note: There is a sample data collection form at Appendix C.
2 Identify the average number of full time equivalent employed in the
year, for your company only.
3 Calculate the rate of LTIs per 100,000 employed in the year.
Method
4 Select the AIR Safety API graph and measure the benchmark score.
Formula Performance (AIR) Safety =
Number of 3 day injuries per year x 100,000
Average number of employed in the year
Using the following data for a company
Number of 3 day injuries in the year
= 3
Number of Man-hours worked in the year
= 71
Example
Performance (AIR) Safety = 3 x 100,000 = 4225
71
Notes To convert No. Man-hours worked to Average NO. employed =
Number of Man hours worked
2000
Organisations wishing to calculate AIR at a project rather than company level should use the formula:
Performance (AIR) Safety =
Number of 3-day injuries during project x 100,000 x 52
Average number of employed during the project Duration (wks)
Care should be taken when comparing project results against KPI/API
graphs of company performance as the results could be misleading.
Not all incidents are recorded.
NZ Construction Industry KPIs 33
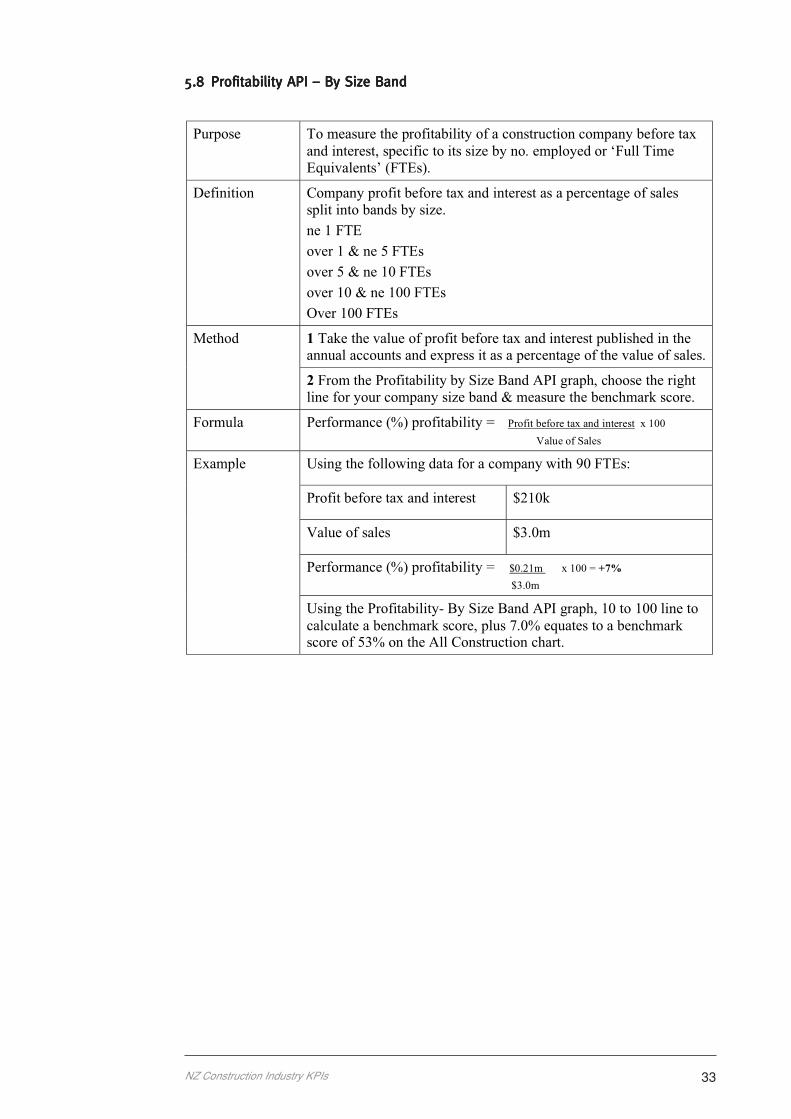
5.85.85.85.85.8 Profitability API – By Size BandProfitability API – By Size BandProfitability API – By Size BandProfitability API – By Size BandProfitability API – By Size Band
Purpose To measure the profitability of a construction company before tax and interest, specific to its size by no. employed or ‘Full Time Equivalents’ (FTEs).
Definition Company profit before tax and interest as a percentage of sales split into bands by size.
ne 1 FTE
over 1 & ne 5 FTEs
over 5 & ne 10 FTEs
over 10 & ne 100 FTEs
Over 100 FTEs
1 Take the value of profit before tax and interest published in the annual accounts and express it as a percentage of the value of sales.
Method
2 From the Profitability by Size Band API graph, choose the right line for your company size band & measure the benchmark score.
Formula Performance (%) profitability = Profit before tax and interest x 100
Value of Sales
Using the following data for a company with 90 FTEs:
Profit before tax and interest $210k
Value of sales $3.0m
Performance (%) profitability = $0.21m x 100 = +7%
$3.0m
Example
Using the Profitability- By Size Band API graph, 10 to 100 line to calculate a benchmark score, plus 7.0% equates to a benchmark score of 53% on the All Construction chart.

NZ Construction Industry KPIs34

NZ Construction Industry KPIs 35
Part 2

NZ Construction Industry KPIs36

NZ Construction Industry KPIs 37
This section sets out the 20065 results for New Zealand.
The results are shown in three different ways:
1 The industry average (or median) for each KPI and API
2 The % of the industry reaching a ‘best practice’ target2
3 A separate graph for each measure (the KPIs are also displayed on the Wallchart).
6.16.16.16.16.1 Industry Average (Median) results Industry Average (Median) results Industry Average (Median) results Industry Average (Median) results Industry Average (Median) results
The Industry Average Performance for ‘All Construction’ is shown below.
6 Industry Report— the Results
2 These targets have been adopted from UK Constructing Excellence.
KPI / API Measure 2004
Score
2005
Score
2006
Score
Gain/
Loss
KPI Client Satisfaction – Product 7.6 of 10 8.0 of 10
8.0 of 10 NC
KPI Client Satisfaction – Service
Median Score out of 10
7.3 of 10 7.8 of 10
7.7 of 10 -
KPI Defects Median Score out of
10
6.7 of 10 7.9 of
10
7.6 of 10 -
KPI Predictability Cost – Design (A to C) 0% 0% 0% NC
KPI Predictability Cost – Construction (B to C) +2% 0% +1.7% -
KPI Predictability Cost – Project (A to C)
Median % cost under
or over budget
+5% +1.5% +2.8% -
KPI Predictability Time – Design (A to B) +10% 0% +11.9% -
KPI Predictability Time – Construction (B to C) -1% 0% 0% NC
KPI Predictability Time – Project (A to C)
Median % time under
or over programme
+4% +1.2% +14.28% -
KPI Safety – Adjusted for Underreporting – Lost
Time Incidents per 200,000 hours worked (LTI)
Median LTIs 15 LTI’s 14 13 +
KPI Profitability Median profit % 10.1% 24% 7% -
NR means Not Reported
NC means No Change

NZ Construction Industry KPIs38
2 These targets have been adopted from UK Constructing Excellence.
6.26.26.26.26.2 The percentage of the surveyed industry reaching a ‘best practice’ target The percentage of the surveyed industry reaching a ‘best practice’ target The percentage of the surveyed industry reaching a ‘best practice’ target The percentage of the surveyed industry reaching a ‘best practice’ target The percentage of the surveyed industry reaching a ‘best practice’ target22222
KPI / API Measure 2004
Score
2005
Score
2006
Score
Gain/
Loss
KPI Client Satisfaction – Product % scoring 8/10 or better 72.5% 81.7% 87.8% +
KPI Client Satisfaction – Service 61.5% 79.0% 39.2% -
KPI Defects % scoring 8/10 or better 40.0% 78.0% 31.1% -
KPI Predictability Cost – Design (A to C) % on target or better 53.1% 54.8% 54.8% NC
KPI Predictability Cost – Construction (B to C) 41.6% 53.8% 39.1% -
KPI Predictability Cost – Project (A to C) 33.3% 48.0% 40.0% -
KPI Predictability Time – Design (A to B) % on target or better 37.8% 51.8% 22.2% -
KPI Predictability Time – Construction (B to C) 64.9% 72.5% 53.12% -
KPI Predictability Time – Project (A to C) 34.2% 50.0% 22.9% -
KPI Safety – Adjusted for Underreporting – Lost
Time Incidents per 200,000 hours worked (LTI)
% companies achieving
zero LTIs
3.7% 33% +
NR means Not Reported

NZ Construction Industry KPIs 39
6.36.36.36.36.3 KPI and API individual graphsKPI and API individual graphsKPI and API individual graphsKPI and API individual graphsKPI and API individual graphs
The following graphs represent the 2006 results for New Zealand.
1 Client Satisfaction - (a) ProductMeasures how satisfied the client was with the quality of the finished product on a scale of 1to 10. Usually measured at or shortly after completion and handover.
2 Client satisfaction - (b) ServiceMeasures how satisfied the client was with the quality of the service obtained from the con-struction consultancy team & the main contractor together on a scale of 1 to 10. Usuallymeasured at or shortly after completion and handover.
Benchmark ScoreBenchmark ScoreBenchmark ScoreBenchmark ScoreBenchmark Score
Per
form
ance
Sco
rePer
form
ance
Sco
rePer
form
ance
Sco
rePer
form
ance
Sco
rePer
form
ance
Sco
rePer
form
ance
Sco
rePer
form
ance
Sco
rePer
form
ance
Sco
rePer
form
ance
Sco
rePer
form
ance
Sco
re
Benchmark ScoreBenchmark ScoreBenchmark ScoreBenchmark ScoreBenchmark Score

NZ Construction Industry KPIs40
3 DefectsMeasures the degree to which the completed facility was free from defects that impacted onthe client on scale of 1 to 10. Usually measured at the point the project is offered for handover.
4 Cost Predictability
Measures how well out-turn costs compared with original estimates.
(i) Design
Per
form
ance
Sco
rePer
form
ance
Sco
rePer
form
ance
Sco
rePer
form
ance
Sco
rePer
form
ance
Sco
re
Benchmark ScoreBenchmark ScoreBenchmark ScoreBenchmark ScoreBenchmark Score
Per
form
ance
Sco
rePer
form
ance
Sco
rePer
form
ance
Sco
rePer
form
ance
Sco
rePer
form
ance
Sco
re
Benchmark ScoreBenchmark ScoreBenchmark ScoreBenchmark ScoreBenchmark Score

NZ Construction Industry KPIs 41
(ii) Construction
(iii) Project
Per
form
ance
Sco
rePer
form
ance
Sco
rePer
form
ance
Sco
rePer
form
ance
Sco
rePer
form
ance
Sco
re
Benchmark ScoreBenchmark ScoreBenchmark ScoreBenchmark ScoreBenchmark Score
Per
form
ance
Sco
rePer
form
ance
Sco
rePer
form
ance
Sco
rePer
form
ance
Sco
rePer
form
ance
Sco
re
Benchmark ScoreBenchmark ScoreBenchmark ScoreBenchmark ScoreBenchmark Score

NZ Construction Industry KPIs42
5 Time PredictabilityMeasures how closely the project was delivered to the original timetable.
(i) Design
(ii) Construction
Per
form
ance
Sco
rePer
form
ance
Sco
rePer
form
ance
Sco
rePer
form
ance
Sco
rePer
form
ance
Sco
re
Benchmark ScoreBenchmark ScoreBenchmark ScoreBenchmark ScoreBenchmark Score
Per
form
ance
Sco
rePer
form
ance
Sco
rePer
form
ance
Sco
rePer
form
ance
Sco
rePer
form
ance
Sco
re
Benchmark ScoreBenchmark ScoreBenchmark ScoreBenchmark ScoreBenchmark Score

NZ Construction Industry KPIs 43
(iii) Project
6 Safety LTI
Measures the number of Lost Time Incidents per 200,000 hours worked.
Per
form
ance
Sco
rePer
form
ance
Sco
rePer
form
ance
Sco
rePer
form
ance
Sco
rePer
form
ance
Sco
re
Benchmark ScoreBenchmark ScoreBenchmark ScoreBenchmark ScoreBenchmark Score
Per
form
ance
Sco
rePer
form
ance
Sco
rePer
form
ance
Sco
rePer
form
ance
Sco
rePer
form
ance
Sco
re
Benchmark ScoreBenchmark ScoreBenchmark ScoreBenchmark ScoreBenchmark Score

NZ Construction Industry KPIs44
7 Profitability
Measures company profit before tax and interest as a percentage of turnover.
APIsAPIsAPIsAPIsAPIs
Profitability – by Size
Measures company profit before tax and interest as a percentage of turnover split into sizebands of:
ne 1 RMEover 1 & ne 5 RMEsover 5 & ne 10 RMEsover 10 & ne 100 RMEsover 100 RMEs
NB: RMEs are equivalent to FTEs in previous data sets
Per
form
ance
Sco
rePer
form
ance
Sco
rePer
form
ance
Sco
rePer
form
ance
Sco
rePer
form
ance
Sco
re
Benchmark ScoreBenchmark ScoreBenchmark ScoreBenchmark ScoreBenchmark Score
Benchmark ScoreBenchmark ScoreBenchmark ScoreBenchmark ScoreBenchmark Score
Pro
fitab
ility
Pro
fitab
ility
Pro
fitab
ility
Pro
fitab
ility
Pro
fitab
ility

NZ Construction Industry KPIs 45
Appendix A: KPI data sources
KPIsKPIsKPIsKPIsKPIs Data SourcesData SourcesData SourcesData SourcesData Sources
Client Satisfaction – Product Client Survey carried out by CAENZ/BRANZ/The Property Council/Local Government New Zealand
Client Satisfaction – Service Client Survey carried out by CAENZ/BRANZ/The Property Council/Local Government New Zealand
Defects Client Survey carried out by CAENZ/BRANZ/The Property Council/Local Government New Zealand
Predictability Cost Client Survey carried out by CAENZ/BRANZ/The Property Council/Local Government New Zealand
Predictability Time Client Survey carried out by CAENZ/BRANZ/The Property Council/Local Government New Zealand
Safety Contractors Survey carried out by Site Safe New Zealand
Profitability Department of Statistics in a form that represents theoutputs
The data sources used in the preparation of these KPIs are shown below.

NZ Construction Industry KPIs46

NZ Construction Industry KPIs 47
Appendix B: Sample Client SurveyQuestionnaire
Sponsored by: Supported by
1
Construction Industry Key Performance Indicators Return Postal Address: New Zealand Centre for Advanced Engineering, Private Bag 4800, Christchurch 8140 Fax: 03 364 2069 Online form at http://www.caenz.com/KPI_Survey/KPI_Letter.html
Client Questionnaire Ideally, it would be a great help if you were able to complete a questionnaire for one finished project in each quarter of 2006 However, if this is not possible, please send details of your latest completed project. For additional copies of this questionnaire, please contact [email protected] or simply photocopy this form and complete for each project. The survey can also be filled out online at www.caenz.com .
1. Contact Name
2. Organisation
3. Address
Postcode Telephone Email
4. What type of organisation are you? (Please tick one box)
Central Government Local Government Other Public Sector
Private Sector Other: (please specify)
5. What is your approximate annual spend on? (exclusive of GST)
a) New build $ b) Refurbishment $ c) Repair & Maintenance $
6. Approximately how many new projects do you commission each year?
a) New build Nr. b) Refurbishment Nr. c) Repair & Maintenance Nr.
GENERAL
7. Were you involved with a provider of vertical building goods and/or services over the last 24 months?
Yes No If yes then please answer Question 8, or go on to Question 12;

NZ Construction Industry KPIs48
2
8. Thinking back over the last 24 months, do you think the quality of building work has got
better or worse over this time? (Please circle one number. Additional comment below)
9. Since 2004 there has been a new building regulatory regime, (Building Act 2004). Were you involved in building prior to this new regime?
Yes No If yes then please answer Question 10, or go on to Question 11;
10.Do you think the new regime has had an influence on the quality of new building works? (Please circle one number)
11.One of the reasons for setting up the new regulatory regime was to provide a balance
between the needs of practitioners (i.e. builders, architects, etc) and property owners. Do you think the new regulatory regime has achieved this?
Yes No (Please qualify your answer below – circle one number only)
Additional Comment
ABOUT THE PROJECT
12. Project Name/Reference
13. Project Classification (Please tick one box for predominant classification)
New Build Refurbishment Repair & Maintenance
14. Type of Project
(e.g. Road, Warehouse, Hospital etc.)
Much worse A little worse No real change A little better Much better
1 2 3 4 5 6 7 8 9 10
Strongly believe no influence
A small influence Moderate Influence
Considerable influence
Strongly believe a Major Influence
1 2 3 4 5 6 7 8 9 10
No effect Small effect Moderate effect Considerable effect
Achieved result
1 2 3 4 5 6 7 8 9 10

NZ Construction Industry KPIs 49
3
15. Project Sector (Please tick one box)
Housing: Public Private Office Private Industrial
Private Private Retail Private Commercial Other
Non-Housing Public Private Leisure Infrastructure
16. What Contract / Procurement system was used? (Please tick one box)
Traditional Lump Sum: without quantities Design and Build
with quantities Design Manage Construct
Management Contracting Other:
Construction Management (please specify)
17. Was the project let as a main contract or in packages? (Please tick one box)
Main Contract Packages
Note: If project was let in packages, please answer the following questions for the whole
project, not individual packages.
18. What was the contractor selection process? (Please tick one box)
Single Stage Tendering Two Stage Tendering Negotiated Partnering Other: (please specify)
Additional Comment
19. How have you found the statutory approval process in your project.
a) At Central Government Level (Circle one number) (If not applicable tick here)
Additional Comment
b) At Local Government Level (Circle one number) (If not applicable tick here)
Additional Comment
Totally dissatisfied
Mostly dissatisfied
Neither satisfied nor dissatisfied
Mostly satisfied
Totally satisfied
1 2 3 4 5 6 7 8 9 10
Totally dissatisfied
Mostly dissatisfied
Neither satisfied nor dissatisfied
Mostly satisfied
Totally satisfied
1 2 3 4 5 6 7 8 9 10

NZ Construction Industry KPIs50
4
Key Project Stages
A
Commit to
Invest
Client
Sanction
B
Commit to
Construct
C
Available
for use
Start on
Site
Construction
Completion
Design
Construction
Explanatory note for following questions.
A Commit to Invest The point at which the client decides to invest in a project for an agreed budget, sets out the business requirements in a client’s brief and appoints and authorises the project team to complete the design.
Early cost advice, feasibility studies, outline planning permission, planning appeals etc would normally be carried out before Point A was reached. At Point A, the client will be committed to paying for the completed design.
B Commit to Construct The point at which the client authorises the project team to start the construction of the project and has made the site available to the constructor.
The timing of Point B can depend upon the type of procurement method employed . The design will not necessarily be complete at Point B. At Point B, the client will be committed to paying for the completed design and the completed product.
C Available for Use The point at which the product is available for substantial occupancy or use.
Point C may be in advance of contract completion, for example where ancillary work (eg landscaping) is completed after the product has been put to use. At Point C, the product will available for the client to use.
1. Project Time and Cost Profile - see previous page for guidance (Please do not fill in shaded areas) Date Construction Consultants'
(dd,mm,yy) Cost Cost
$'000 $'000
Stage A: Commit to Invest
14.1 Date of decision for scheme to proceed, anticipated construction cost and anticipated fees A
14.2 Anticipated start on site date at A
14.3 Anticipated construction completion date at A
Stage B: Commit to Construct
14.4 Construction contract start on site date and construction contract sum B
14.5 Construction contract date for completion at B
Stage C: Available for Use
14.6 Actual construction completion date C, actual
construction cost, actual fees
14.7 Final certificate date (if known)
* If the actual figure is not known, please insert your best estimate.
NOTE :Estimated is a generic term for the time/cost value at the earlier point. It might be the tendered/contracted time/cost and not
actually an estimate. Depends upon the procurement type and contract procedures. Applies to both time and cost.

NZ Construction Industry KPIs 51
5
21. How satisfied were you with the finished product? (please circle one number)
Totally dissatisfied
Mostly dissatisfied
Neither satisfied nor dissatisfied
Mostly satisfied
Totally satisfied
1 2 3 4 5 6 7 8 9 10
22. At the time of handover, what was the condition of the facility with regard to defects? (please circle one number)
Totally defective
Major defects with a major impact on the client
Some defects and some impact
on the client
A few defects and no significant impact on the
client
Apparently defect free
1 2 3 4 5 6 7 8 9 10
23. How satisfied were you with the service obtained (i.e. how well they actually worked with you): on/from: (please circle one number)
a) the overall project (i.e. the construction consultancy team and the main contractor together)
Totally dissatisfied
Mostly dissatisfied
Neither satisfied nor dissatisfied
Mostly satisfied
Totally satisfied
1 2 3 4 5 6 7 8 9 10
b) the construction consultancy team?
Totally dissatisfied
Mostly dissatisfied
Neither satisfied nor dissatisfied
Mostly satisfied
Totally satisfied
1 2 3 4 5 6 7 8 9 10
c) the main contractor?
Totally dissatisfied
Mostly dissatisfied
Neither satisfied nor dissatisfied
Mostly satisfied
Totally satisfied
1 2 3 4 5 6 7 8 9 10
24. Would you use the construction consultancy team again? (Please tick one box)
Yes No
25. Would you use the main contractor again? (Please tick one box)
Yes No

NZ Construction Industry KPIs52

NZ Construction Industry KPIs 53
Appendix C: Sample contractor SafetyQuestionnaire
Sponsored by: Supported by
1
Construction Industry Key Performance Indicators - Safety
Return Postal Address: New Zealand Centre for Advanced Engineering, Private Bag 4800, Christchurch 8140 Fax: 03 364 2069 Online form at http://www.caenz.com/KPI_Survey/KPI_Letter.html
Contractor Safety Questionnaire
While we would appreciate your providing us with your company details, which, will be kept confidential, we are
comfortable with Questions 1through 3 being left blank.
1. Contact Name
2. Organisation
3. Address
Postcode Telephone Email
4. What type of contractor are you? (Principal activity only - Please tick one box)
General Construction Building Construction
House Construction Residential Building Construction Other
Non-Residential Building Construction Non-Building Construction
Road and Bridge Construction Non-Building Construction Other
Construction Trade Services Site Preparation Services
Building Structure Services Installation Trade Services
Building Completion Services Other Construction Services
Other: (please specify)
5. What was your companies annual turnover on all of its construction activity? $
GENERAL
6. Were you a provider of vertical building goods and/or services over the last 24 months?
Yes No If yes then please answer Question 8, or go on to Question 11;

NZ Construction Industry KPIs54
2
7. Thinking back over the last 24 months, do you think the quality of building work has got
better or worse over this time? (Please circle one number. Additional comment below)
8. Since 2004 there has been a new building regulatory regime, (Building Act 2004). Were
you involved in building prior to this new regime?
Yes No If yes then please answer Question 10, or go on to Question 11;
9. Do you think the new regime has had an influence on the quality of new building works?
(Please circle one number)
10.One of the reasons for setting up the new regulatory regime was to provide a balance between the needs of practitioners (i.e. builders, architects, etc) and property owners.
Do you think the new regulatory regime has achieved this?
Yes No (Please qualify your answer below – circle one number only)
Additional Comment
Safety – 1st January 2006 – 31st December 2006
11. Number of lost time injury cases / fatalities for the period
Lost time injury cases are any work related injury that require days away from work. Do not include the day of injury.
Include lost time injury cases / fatalities on all projects in progress in the period. (for your company only).
Please enter total number then break down into over 3 days and under 3 days:.
a) Total Number Nr
b) Cases over three days Nr c) Cases of three days or under Nr
12. Number of lost days for the period_______ Nr
Report the number of total lost days from the lost time cases reported above.(for your company only)
13. Number of medical Injury cases for the period_______ Nr
A medical injury is any work related injury that requires professional medical attention. This includes all lost time cases. (for your company only)
14. Man-hours worked for the period______ Hrs
Man-hours should include hours worked by all full time equivalent employed on site for your company. Include hours worked on all projects in progress in the period. (for your company only)
Much worse A little worse No real change A little better Much better
1 2 3 4 5 6 7 8 9 10
Strongly believe no influence
A small influence Moderate Influence
Considerable influence
Strongly believe a Major Influence
1 2 3 4 5 6 7 8 9 10
No effect Small effect Moderate effect Considerable effect
Achieved result
1 2 3 4 5 6 7 8 9 10

New Zealand National Construction Industry KPIs 2006
1 Select the appropriate graph.2 Plot the measured performance for the project or company under consideration
on the vertical axis (1).3 Read across to the performance line (2). If the graph line is intersected where it
runs horizontally, follow the graph line to the last point of contact.4 Read down to the horizontal axis (3). This is the company/project benchmark
score out of 100%.5 Plot the benchmark score on
the appropriate axis of theradar chart.
6 Join all plots on the radarchart with a line. In general,the nearer the plotted line isto the outer perimeter of thechart, the higher the overallperformance.
In this example, a performanceof 5 is achieved. This equatesto a benchmark score of 60%,meaning that 60% of projects or companies are achieving equal or lower performance,and 40% are achieving higher performance.
Client Satisfaction -Product
Client Satisfaction -Service
Defects
Predictability Cost -Design
Predictability Cost -Construction
Predictability Cost - Project
Predictability Time -Design
Predictability Time -Construction
Predictability Time -Project
Safety Lost TimeIncidents (LTI)
Profitability100%
80%
60%
40%
20%
New Zealand KPIPredictability Construction Costs - Design
New Zealand KPIPredictability Cost - Construction
New Zealand KPIPredictability Cost - Project
New Zealand KPIDefects
New Zealand KPIPredictability Time - Design
New Zealand KPIPredictability Time - Construction
New Zealand KPIPredictability Time - Project
New Zealand KPIProfitability - all FTEs
The Radar Chart
New Zealand KPISafety - Lost time incidents per 200,000 hours worked (LTI)
New Zealand KPIClient Satisfaction - Product & Service
To calculate the project or company benchmark score:
10
9
8
7
6
5
4
3
2
1
10%0% 20% 30% 40% 50% 60% 70% 80% 90% 100%
Benchmark Score
Per
form
ance
Sco
reExample
www.caenz.com/infrastructure/BP/wallchart.html
Benchmark Score
Per
form
ance
Sco
re
Benchmark Score
Per
form
ance
Sco
re
Benchmark Score
Per
form
ance
Sco
re
Benchmark Score
Per
form
ance
Sco
re
Benchmark Score
Per
form
ance
Sco
re
Benchmark Score
Per
form
ance
Sco
re
Benchmark Score
Per
form
ance
Sco
re
Benchmark Score
Per
form
ance
Sco
re
Benchmark Score
Per
form
ance
Sco
re
Benchmark Score
Per
form
ance
Sco
re

Clie
nt S
atis
fact
ion
-P
rodu
ct
Clie
nt S
atis
fact
ion
-S
ervi
ce
Def
ects
Pre
dict
abili
ty C
ost -
Des
ign
Pre
dict
abili
ty C
ost -
Con
stru
ctio
n
Pre
dict
abili
ty C
ost -
Pro
ject
Pre
dict
abili
ty T
ime
-D
esig
n
Pre
dict
abili
ty T
ime
-C
onst
ruct
ion
Pre
dict
abili
ty T
ime
-P
roje
ct
Saf
ety
Lost
Tim
eIn
cide
nts
(LT
I)
Pro
fitab
ility
100%
80%
60%
40%
20%
Priv
ate
Bag
480
0, C
hris
tchu
rch
8140
• P
hone
(03
) 36
4 24
78 •
Fax
(03
) 36
4 20
69 •
ww
w.c
aenz
.com
New
Zea
land
Cen
tre
for Ad
vanc
ed E
ngin
eering
• C
hris
tchu
rch
• New
Zea
land
The New Zealand Construction IndustryNational Key Performance Indicators
Wallchart2006 Data