Hancock Farmland Investorhancockagriculture.com/wp-content/uploads/sites/3/HFI-Q1-2017-1.pdf ·...
8
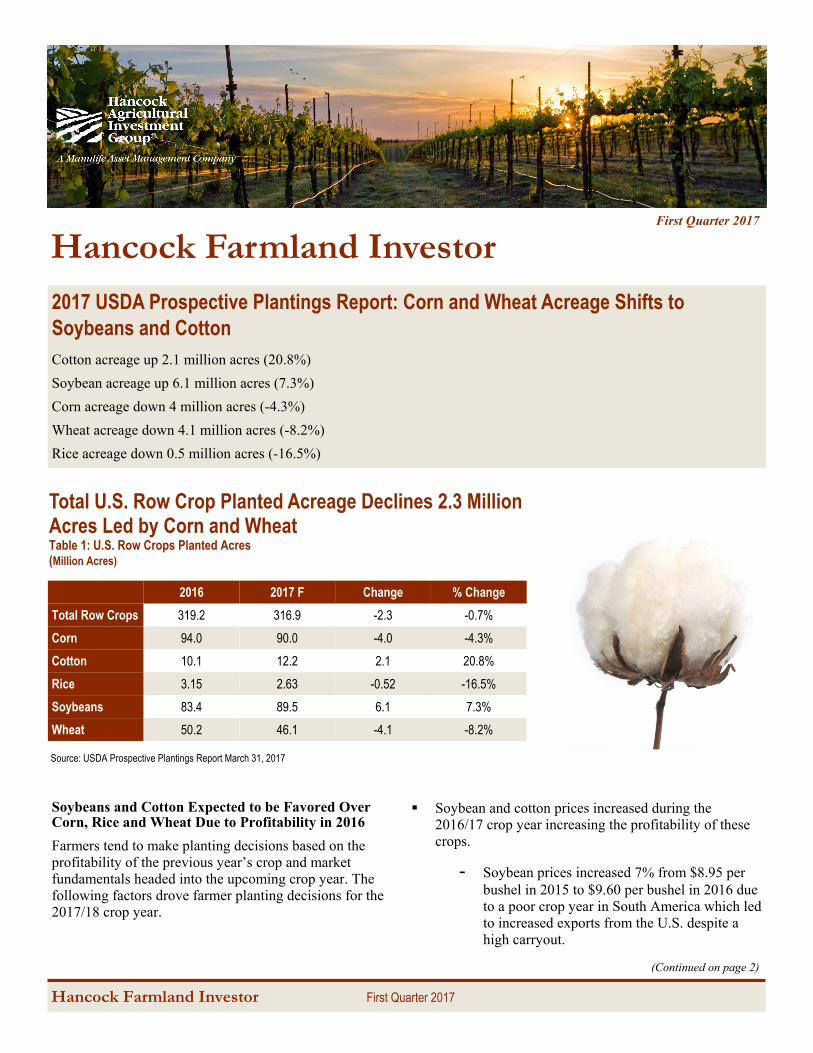
Hancock Farmland Investor First Quarter 2017 2017 USDA Prospective Plantings Report: Corn and Wheat Acreage Shifts to Soybeans and Cotton Cotton acreage up 2.1 million acres (20.8%) Soybean acreage up 6.1 million acres (7.3%) Corn acreage down 4 million acres (-4.3%) Wheat acreage down 4.1 million acres (-8.2%) Rice acreage down 0.5 million acres (-16.5%) Hancock Farmland Investor First Quarter 2017 (Continued on page 2) Total U.S. Row Crop Planted Acreage Declines 2.3 Million Acres Led by Corn and Wheat Table 1: U.S. Row Crops Planted Acres (Million Acres) Soybeans and Cotton Expected to be Favored Over Corn, Rice and Wheat Due to Profitability in 2016 Farmers tend to make planting decisions based on the profitability of the previous year’s crop and market fundamentals headed into the upcoming crop year. The following factors drove farmer planting decisions for the 2017/18 crop year. Soybean and cotton prices increased during the 2016/17 crop year increasing the profitability of these crops. - Soybean prices increased 7% from $8.95 per bushel in 2015 to $9.60 per bushel in 2016 due to a poor crop year in South America which led to increased exports from the U.S. despite a high carryout. Source: USDA Prospective Plantings Report March 31, 2017 Total Row Crops 319.2 316.9 -2.3 -0.7% Corn 94.0 90.0 -4.0 -4.3% Cotton 10.1 12.2 2.1 20.8% Rice 3.15 2.63 -0.52 -16.5% Soybeans 83.4 89.5 6.1 7.3% Wheat 50.2 46.1 -4.1 -8.2% 2016 2017 F Change % Change
Transcript of Hancock Farmland Investorhancockagriculture.com/wp-content/uploads/sites/3/HFI-Q1-2017-1.pdf ·...
Hancock Farmland Investor First Quarter 2017
2017 USDA Prospective Plantings Report: Corn and Wheat Acreage Shifts to Soybeans and Cotton Cotton acreage up 2.1 million acres (20.8%)
Soybean acreage up 6.1 million acres (7.3%)
Corn acreage down 4 million acres (-4.3%)
Wheat acreage down 4.1 million acres (-8.2%)
Rice acreage down 0.5 million acres (-16.5%)
Hancock Farmland Investor First Quarter 2017
(Continued on page 2)
Total U.S. Row Crop Planted Acreage Declines 2.3 Million Acres Led by Corn and Wheat Table 1: U.S. Row Crops Planted Acres (Million Acres)
Soybeans and Cotton Expected to be Favored Over Corn, Rice and Wheat Due to Profitability in 2016
Farmers tend to make planting decisions based on the profitability of the previous year’s crop and market fundamentals headed into the upcoming crop year. The following factors drove farmer planting decisions for the 2017/18 crop year.
Soybean and cotton prices increased during the 2016/17 crop year increasing the profitability of these crops.
- Soybean prices increased 7% from $8.95 per bushel in 2015 to $9.60 per bushel in 2016 due to a poor crop year in South America which led to increased exports from the U.S. despite a high carryout.
Source: USDA Prospective Plantings Report March 31, 2017
Total Row Crops 319.2 316.9 -2.3 -0.7%
Corn 94.0 90.0 -4.0 -4.3%
Cotton 10.1 12.2 2.1 20.8%
Rice 3.15 2.63 -0.52 -16.5%
Soybeans 83.4 89.5 6.1 7.3%
Wheat 50.2 46.1 -4.1 -8.2%
2016 2017 F Change % Change
Hancock Farmland Investor First Quarter 2017 2
- Cotton prices increased 8% from $0.63 per pound in 2015 to $0.68 per pound in 2016 due to strong exports to China and Southeast Asia and a relatively poor crop in India.
- As a result, cash receipts and profitability for these crops increased and USDA expects farmers to dedicate more acreage to these crops in the 2017/18 crop year.
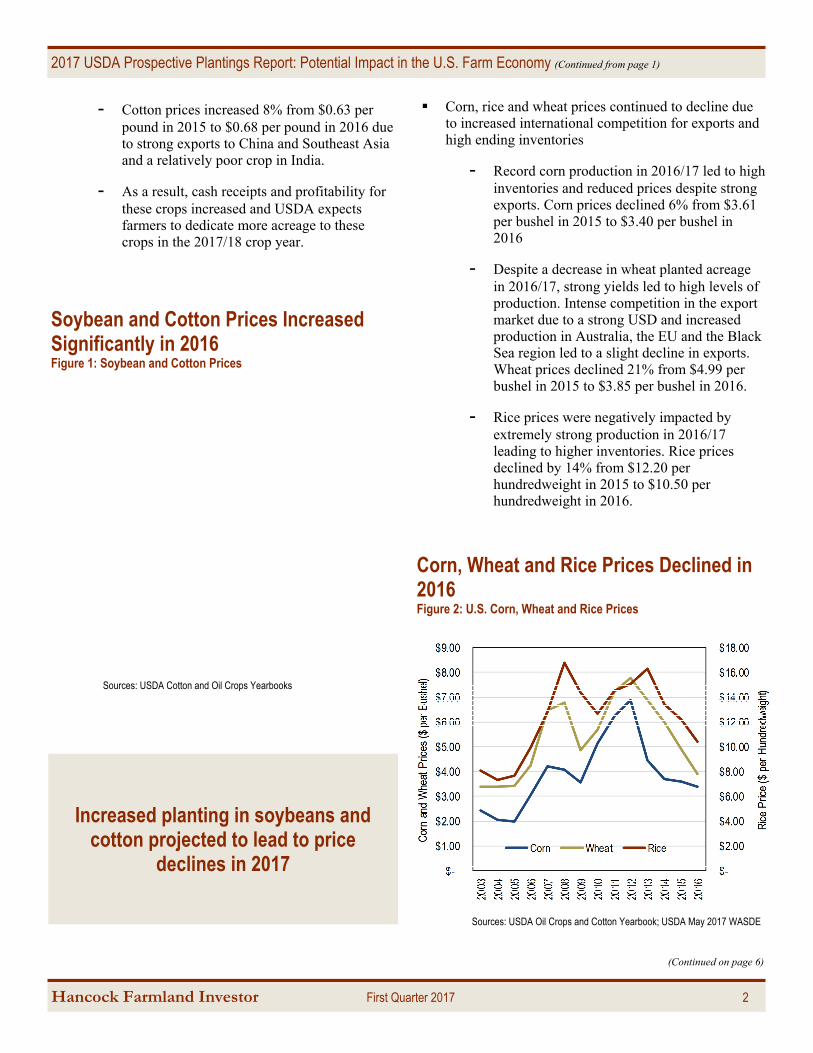
Corn, rice and wheat prices continued to decline due to increased international competition for exports and high ending inventories
- Record corn production in 2016/17 led to high inventories and reduced prices despite strong exports. Corn prices declined 6% from $3.61 per bushel in 2015 to $3.40 per bushel in 2016
- Despite a decrease in wheat planted acreage in 2016/17, strong yields led to high levels of production. Intense competition in the export market due to a strong USD and increased production in Australia, the EU and the Black Sea region led to a slight decline in exports. Wheat prices declined 21% from $4.99 per bushel in 2015 to $3.85 per bushel in 2016.
- Rice prices were negatively impacted by extremely strong production in 2016/17 leading to higher inventories. Rice prices declined by 14% from $12.20 per hundredweight in 2015 to $10.50 per hundredweight in 2016.
2017 USDA Prospective Plantings Report: Potential Impact in the U.S. Farm Economy (Continued from page 1)
(Continued on page 6)
Increased planting in soybeans and cotton projected to lead to price
declines in 2017
Sources: USDA Cotton and Oil Crops Yearbooks
Sources: USDA Oil Crops and Cotton Yearbook; USDA May 2017 WASDE
Corn, Wheat and Rice Prices Declined in 2016 Figure 2: U.S. Corn, Wheat and Rice Prices
Soybean and Cotton Prices Increased Significantly in 2016 Figure 1: Soybean and Cotton Prices
Hancock Farmland Investor First Quarter 2017 3
What Does the Prospective Plantings Report Mean for Prices in the 2017/18 Crop Year
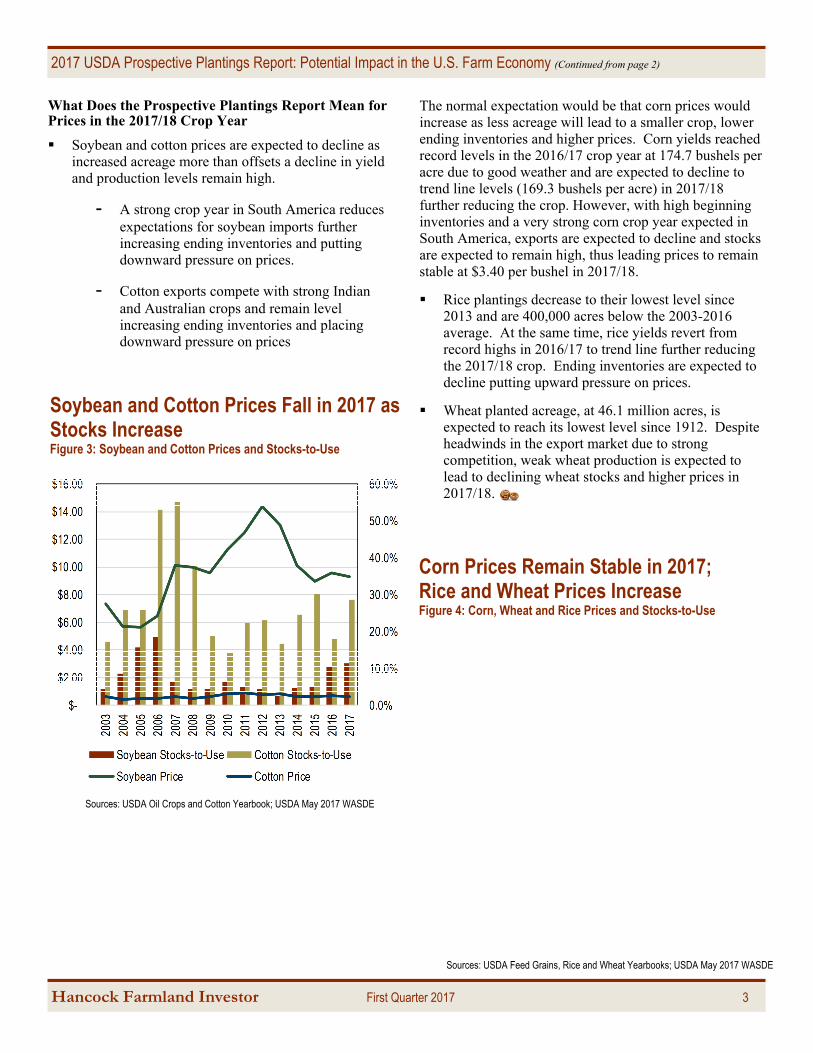
Soybean and cotton prices are expected to decline as increased acreage more than offsets a decline in yield and production levels remain high.
- A strong crop year in South America reduces expectations for soybean imports further increasing ending inventories and putting downward pressure on prices.
- Cotton exports compete with strong Indian and Australian crops and remain level increasing ending inventories and placing downward pressure on prices
The normal expectation would be that corn prices would increase as less acreage will lead to a smaller crop, lower ending inventories and higher prices. Corn yields reached record levels in the 2016/17 crop year at 174.7 bushels per acre due to good weather and are expected to decline to trend line levels (169.3 bushels per acre) in 2017/18 further reducing the crop. However, with high beginning inventories and a very strong corn crop year expected in South America, exports are expected to decline and stocks are expected to remain high, thus leading prices to remain stable at $3.40 per bushel in 2017/18.
Rice plantings decrease to their lowest level since 2013 and are 400,000 acres below the 2003-2016 average. At the same time, rice yields revert from record highs in 2016/17 to trend line further reducing the 2017/18 crop. Ending inventories are expected to decline putting upward pressure on prices.
Wheat planted acreage, at 46.1 million acres, is expected to reach its lowest level since 1912. Despite headwinds in the export market due to strong competition, weak wheat production is expected to lead to declining wheat stocks and higher prices in 2017/18.
Corn Prices Remain Stable in 2017; Rice and Wheat Prices Increase Figure 4: Corn, Wheat and Rice Prices and Stocks-to-Use
2017 USDA Prospective Plantings Report: Potential Impact in the U.S. Farm Economy (Continued from page 2)
Soybean and Cotton Prices Fall in 2017 as Stocks Increase Figure 3: Soybean and Cotton Prices and Stocks-to-Use
Sources: USDA Oil Crops and Cotton Yearbook; USDA May 2017 WASDE
Sources: USDA Feed Grains, Rice and Wheat Yearbooks; USDA May 2017 WASDE
Hancock Farmland Investor First Quarter 2017 4
Record Level of World Corn Production This Year Expected to Ease Next Year Figure 1: Quarterly Corn Production Estimates, Major Producers (Million Metric Tons)
Record Level of World Soybean Production This Year Expected to Moderate Next Year Figure 2: Quarterly Soybean Production Estimates, Major Producers (Million Metric Tons)
2016/17 global corn production, projected to reach 1.065 billion MT, is a 10% increase over 2015/2016, driven by Brazil (+43%), US (+11%), Argentina (+38%) and South Africa (+86%). 2017/18 global corn production is expected to decrease slightly from 2016/17 driven by U.S. farmers switching to more profitable soybeans, and China production falling as price supports are removed.
Global soybean production is expected to increase by 11% in 2016/17 to 348 MMT with increases in Brazil and the U.S. The U.S. and Brazil are expected to achieve record production levels, at 117 MMT and 112 MMT respectively. Argentina’s 2016/17 soybean production is expected to remain stable at 57 MMT as elimination of corn export taxes has made soybean production less attractive. In 2017/2018, global soybean production is expected to decrease slightly, in the U.S. and Brazil, as the extremely strong yields from 2016/17 are expected to revert to trend.
Sources: RISI, U.S. Bureau of Census
Sources: Australia Bureau of Statistics, KPMG and Indufor Timber Market Survey
Hancock Farmland Investor First Quarter 2017 5
Source: Pacific Exchange Rate Service
U.S. Corn Exports Strong in Q1 2017 Figure 4: Four Quarter Moving Average Corn Exports, Major Producers (Million Metric Tons)
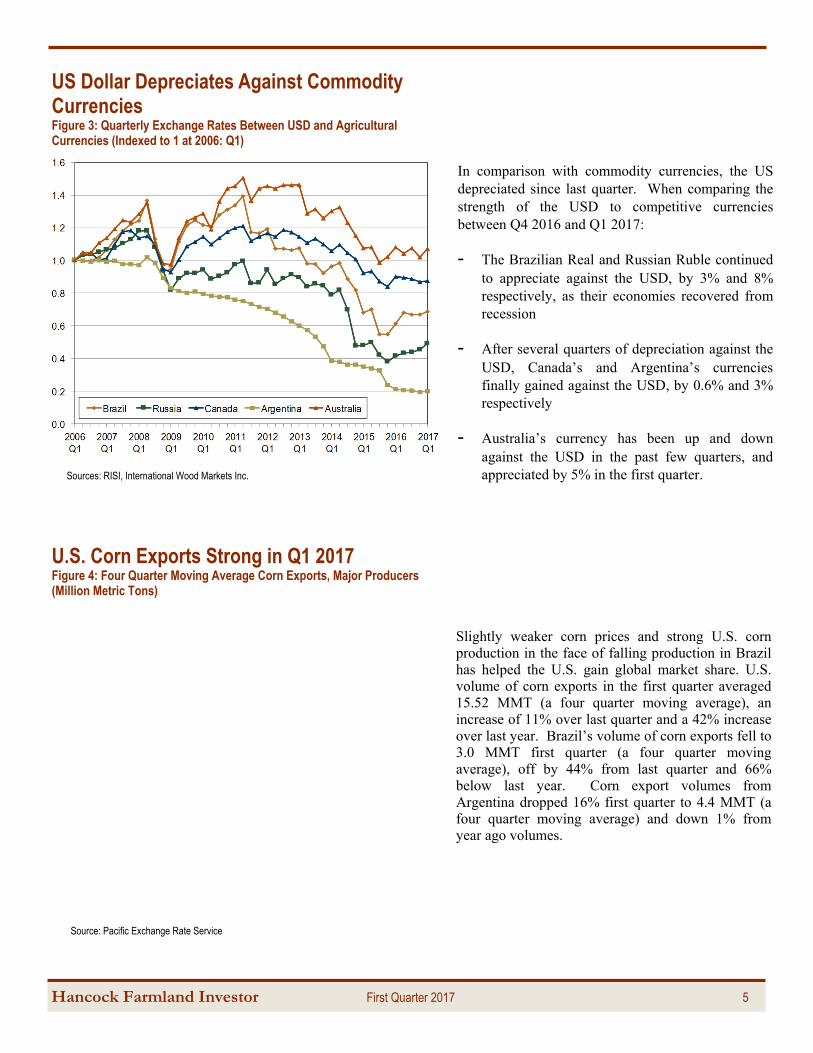
US Dollar Depreciates Against Commodity Currencies Figure 3: Quarterly Exchange Rates Between USD and Agricultural Currencies (Indexed to 1 at 2006: Q1)
Slightly weaker corn prices and strong U.S. corn production in the face of falling production in Brazil has helped the U.S. gain global market share. U.S. volume of corn exports in the first quarter averaged 15.52 MMT (a four quarter moving average), an increase of 11% over last quarter and a 42% increase over last year. Brazil’s volume of corn exports fell to 3.0 MMT first quarter (a four quarter moving average), off by 44% from last quarter and 66% below last year. Corn export volumes from Argentina dropped 16% first quarter to 4.4 MMT (a four quarter moving average) and down 1% from year ago volumes.
In comparison with commodity currencies, the US depreciated since last quarter. When comparing the strength of the USD to competitive currencies between Q4 2016 and Q1 2017:
- The Brazilian Real and Russian Ruble continued to appreciate against the USD, by 3% and 8% respectively, as their economies recovered from recession
- After several quarters of depreciation against the USD, Canada’s and Argentina’s currencies finally gained against the USD, by 0.6% and 3% respectively
- Australia’s currency has been up and down against the USD in the past few quarters, and appreciated by 5% in the first quarter. Sources: RISI, International Wood Markets Inc.
Hancock Farmland Investor First Quarter 2017 6
Argentina and Brazil export sales fell due to lower production, allowing the U.S. to gain soybean market share. Soybean exports volumes from the U.S. reached 14.6 MMT (a four quarter moving average), 1% over last quarter and 21% above volumes last year. Brazil exported 13.5 MMT of soybeans (a four quarter moving average), an increase of 5% from last quarter, yet down 8% from last year. Soybean exports from Argentina, at 2MMT (a four quarter moving average) a 1% increase from last quarter, yet volumes down 20% from last year.
Sources: Log Lines, Timber Mart-South, NZMPI, and KPMG
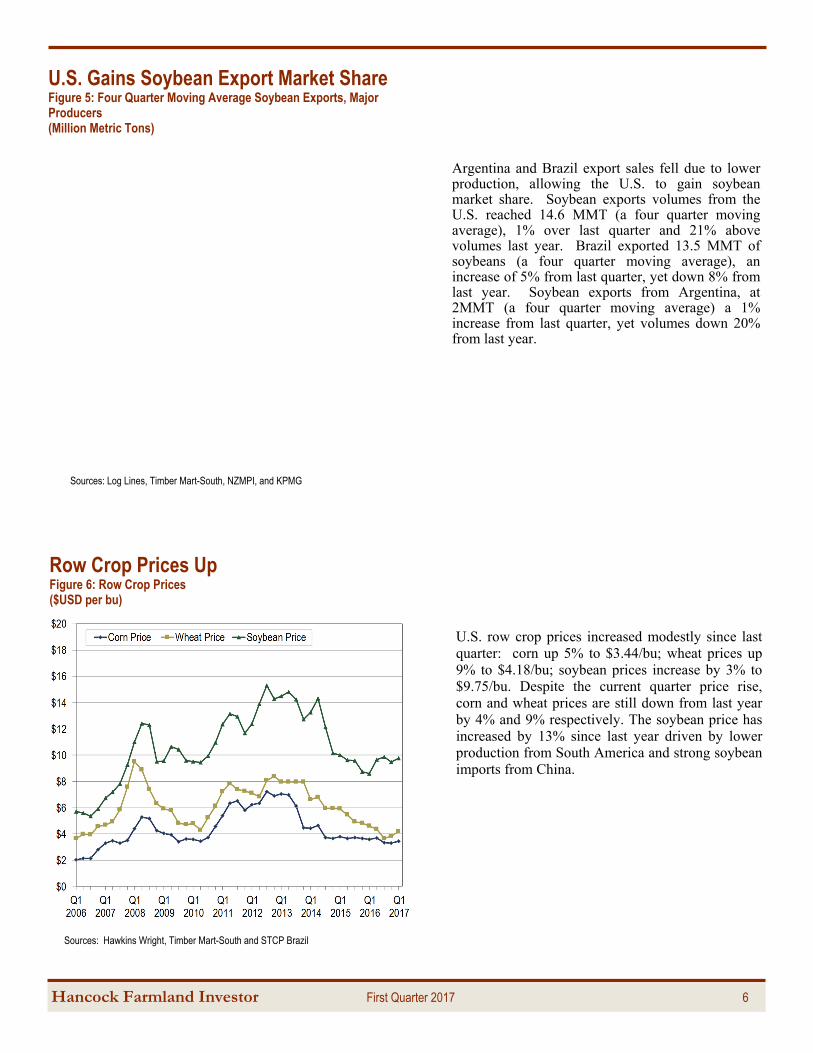
Row Crop Prices Up Figure 6: Row Crop Prices ($USD per bu)
Sources: Hawkins Wright, Timber Mart-South and STCP Brazil
U.S. Gains Soybean Export Market Share Figure 5: Four Quarter Moving Average Soybean Exports, Major Producers (Million Metric Tons)
U.S. row crop prices increased modestly since last quarter: corn up 5% to $3.44/bu; wheat prices up 9% to $4.18/bu; soybean prices increase by 3% to $9.75/bu. Despite the current quarter price rise, corn and wheat prices are still down from last year by 4% and 9% respectively. The soybean price has increased by 13% since last year driven by lower production from South America and strong soybean imports from China.
Hancock Farmland Investor First Quarter 2017 7
Gains in U.S. Row Crop Cash Receipts Only Temporary Figure 8:NCREIF Row Crops Total Return (percent per year) and USDA Row Crops Cash Receipts (y/o/y percent change)
Sources: NCREIF and HTRG Research
Sources: NCREIF and HTRG Research
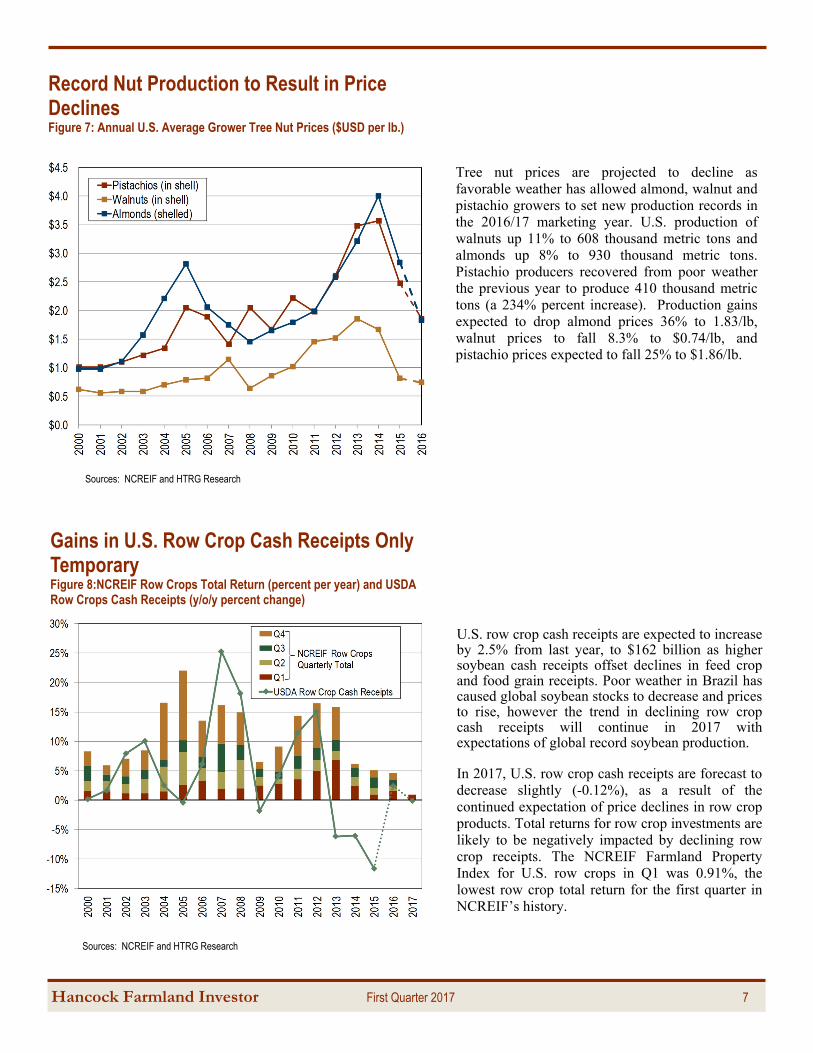
Record Nut Production to Result in Price Declines Figure 7: Annual U.S. Average Grower Tree Nut Prices ($USD per lb.)
Tree nut prices are projected to decline as favorable weather has allowed almond, walnut and pistachio growers to set new production records in the 2016/17 marketing year. U.S. production of walnuts up 11% to 608 thousand metric tons and almonds up 8% to 930 thousand metric tons. Pistachio producers recovered from poor weather the previous year to produce 410 thousand metric tons (a 234% percent increase). Production gains expected to drop almond prices 36% to 1.83/lb, walnut prices to fall 8.3% to $0.74/lb, and pistachio prices expected to fall 25% to $1.86/lb.
U.S. row crop cash receipts are expected to increase by 2.5% from last year, to $162 billion as higher soybean cash receipts offset declines in feed crop and food grain receipts. Poor weather in Brazil has caused global soybean stocks to decrease and prices to rise, however the trend in declining row crop cash receipts will continue in 2017 with expectations of global record soybean production. In 2017, U.S. row crop cash receipts are forecast to decrease slightly (-0.12%), as a result of the continued expectation of price declines in row crop products. Total returns for row crop investments are likely to be negatively impacted by declining row crop receipts. The NCREIF Farmland Property Index for U.S. row crops in Q1 was 0.91%, the lowest row crop total return for the first quarter in NCREIF’s history.
Hancock Farmland Investor First Quarter 2017 8
Court Washburn Managing Director and Chief Investment Officer [email protected] Keith Balter Director of Economic Research [email protected] Mary Ellen Aronow Senior Forest Economist [email protected] Bill Devens Senior Agricultural Economist [email protected] Elizabeth Shestakova Economic Research Analyst [email protected] Keith Goplerud Economic Research Analyst [email protected]
HNRG Research Team
NOTES: Figure 1. Corn production is charted on a calendar year basis and updated on a marketing year basis. The corn marketing year is from September to August for the U.S., from May to April for South Africa, and from October to September for China. The corn marketing year is from March to February in Argentina and Brazil. Corn Production data and forecasts are updated on a monthly basis by the USDA World Agricultural Supply and Demand Estimates Report (WASDE). Figure 2. Soybean production is charted on a calendar year basis and updated on a marketing year basis. The soybean marketing year is from September to August for the U.S., from February to January for Brazil and for April to March for Argenti-na. Soybean Production data and forecasts are updated on a monthly basis by the USDA World Agricultural Supply and Demand Estimates Report (WASDE). Figure 3. Exchanges rates are updated on a daily basis by Macrobond Financial AB. Figure 4. Argentina’s agricultural exports are published on a monthly basis by the Argentinian Ministry of Agroindustry. Brazil export data is published on a monthly basis by Aliceweb. U.S. exports are published on a monthly basis by the U.S. Census Bureau. Export data is reported on a 4 quarter moving average to adjust for seasonality. Figure 5. Argentina’s agricultural exports are published on a monthly basis by the Argentinian Ministry of Agroindustry. Brazil export data is published on a monthly basis by Aliceweb. U.S. exports are published on a monthly basis by the U.S. Census Bureau. Export data is reported on a 4 quarter moving average to adjust for seasonality.
Figure 6. Row Crop Prices are published on a monthly basis by the USDA National Agricultural Statistics Service (USDA NASS). Figure 7. Permanent Crop Prices are published on a annual basis by the USDA National Agricultural Statistics Service (USDA NASS). Walnuts price estimates for the current year are calculated by using the percent annual changes for the crop year in the Producer Price Index for walnuts, published by the Bureau of Labor Statistics on a monthly basis. Annual estimates for pistachios are calculated by using the percent annual changes for the crop year in the prices published in the Market Reports from Nichols Farms. Almond price estimates for the current year are calculated by using the percent annual changes for the crop year in the prices from HNRG sources. Figure 8. USDA Cash Crop Receipts data is published three times a year in February, August and November by the USDA’s Department of Agriculture Eco-nomic Research Service. The U.S. level calendar-year forecast is first published in February. The August release converts the previous year’s forecast to estimates and the November release updates the current year forecast. NCREIF Farmland Total Return data is published on a quarterly basis. NCREIF quarterly total row crops returns are aggregated to form the total return for the year. The total return as seen on the bar chart may not equal the annual total return as reported by NCREIF, because the NCREIF annual return is calculated by multiplying instead of adding quarterly returns together.
Farmland returns depicted in this material do not represent the investment performance or the actual accounts of any investors or any funds of Hancock Natural Resource Group, Inc. There is no guarantee that market forecasts discussed will be realized or that these trends will continue. These views are subject to change at any time based on market and other conditions and there can be no assurances that countries, markets or sectors will perform as expected. Hancock Agricultural Investment Group is a division of Hancock Natural Resource Group, Inc., a registered investment advisor and wholly owned subsidiary of Manulife Financial Corporation. © Hancock Natural Resource Group, Inc.