Han eldery overview 3 24-2011
13
Elderly Housing Demographic Trends City of Franklin & Simpson County Prepared for: Franklin Affordable Housing, Inc. February 1 st 2012
Transcript of Han eldery overview 3 24-2011
Elderly Housing Demographic Trends
City of Franklin & Simpson County
Prepared for:Franklin Affordable Housing, Inc.
February 1st 2012

• Positive elderly population growth for the City of Franklin and Simpson County—despite overall population declines
• Growth segments are younger elderly 55 to 59 and 60 to 64 years of age (Franklin), and 55 to 59 and 65 to 74 in Simpson County
• Elderly growth is in City of Franklin is clustered in the Hillside area
• The growth of the Hillside’s 75 to 84 age cohort is an indicator that the population is aging in-place. The same trend is true in Simpson County
• The City of Franklin is unique in that it has key retail and services that are easily accessible—and this is a competitive advantage when compared to other riverfront cities in the immediate area.
• This includes employment and purchasing of goods and services.
• The “university site” located in Simpson County has a similar cluster of retail and services, and is located near Northern Kentucky University.
• Elderly developments near college campuses increase marketability and market rents.
Key Demographic Trends
2Consulting Team: Merusi Partners, Inc.February 1st 2012

• Niche and market the development—independent senior households 55-64 and 65-74 years of age.
• “Younger” seniors will have cars and parking must be factored into planning (at least 1:1)• Mini-rise elevator buildings would be recommended to avoid accessibility issues which could
lead to vacancy problems during lease-up and in the future• Both sites have abundant amenities in close proximity to the sites• Work with local transit to connect development to the sites • Do not re-create commercial common space that is not leasable, create common area space
that is flexible and used for on-site visits by doctors, etc. • Scale: 45 to 65 units per phase (30+ ACC units). Build-out the City site, and do not phase, too
much disruption for neighbors and residents.• Development scale may be too large for a 9% LIHTC allocation—typical KHC 9% development
15 to 25 units.• Development scale may be more in line for a 4% LIHTC bond development. The only
drawback with this is less equity.
Development Trends
3Consulting Team: Merusi Partners, Inc.February 1st 2012

City of Franklin Overview• Use FY 2000 Census and FY 2010
Census to compare elderly population trends
• Elderly growth trends were compared by age cohort
• Compare City of Franklin by Basin and Hillside
• Basin Area Census Tracts: 501, 502, 503, 504, 505, and 506
• Hillside Area Census Tracts: 524 and 525
• Hillside Area includes all of Census Tracts 524 and 525
4Consulting Team: Merusi Partners, Inc.February 1st 2012

Franklin Demographic TrendsTotal elderly population in the City of Franklin FY 2010 is estimated to be 3,545
and this is an increased of 291 persons from FY 2000
Source: 2000 Census and 2010 Census
5Consulting Team: Merusi Partners, Inc.February 1st 2012
3,545
3,254
3,100
3,150
3,200
3,250
3,300
3,350
3,400
3,450
3,500
3,550
3,600
FY 2010 FY 2000
Year
To
tal E
lder
ly P
op
ula
tio
n
Series1
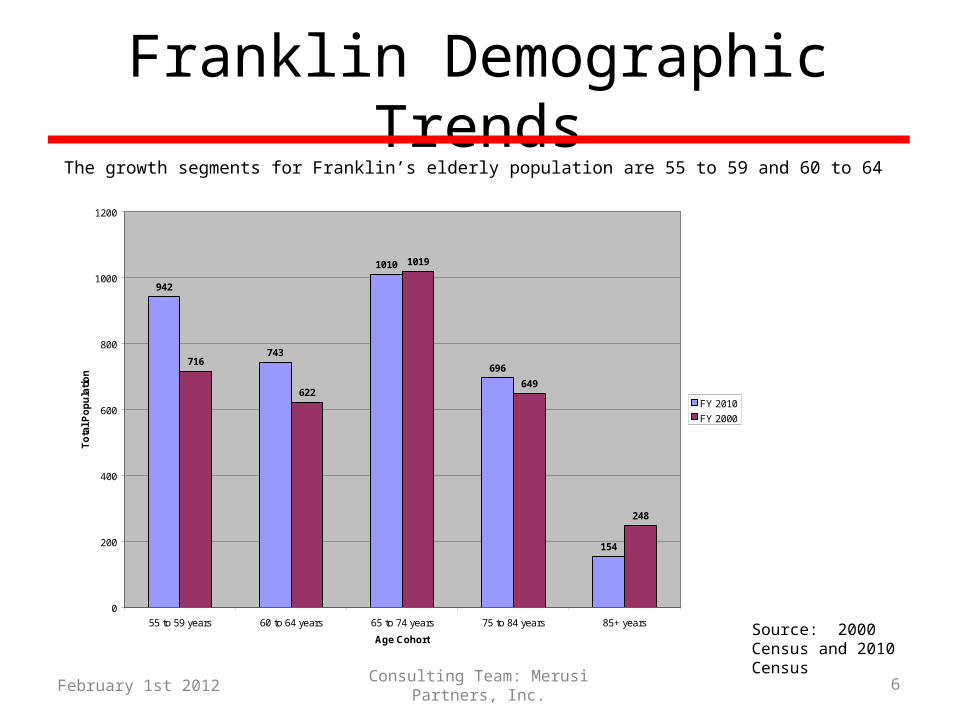
Franklin Demographic TrendsThe growth segments for Franklin’s elderly population are 55 to 59 and 60 to 64
Source: 2000 Census and 2010 Census
6Consulting Team: Merusi Partners, Inc.February 1st 2012
942
743
1010
696
154
716
622
1019
649
248
0
200
400
600
800
1000
1200
55 to 59 years 60 to 64 years 65 to 74 years 75 to 84 years 85+ years
Age Cohort
To
tal P
op
ula
tio
n
FY 2010
FY 2000
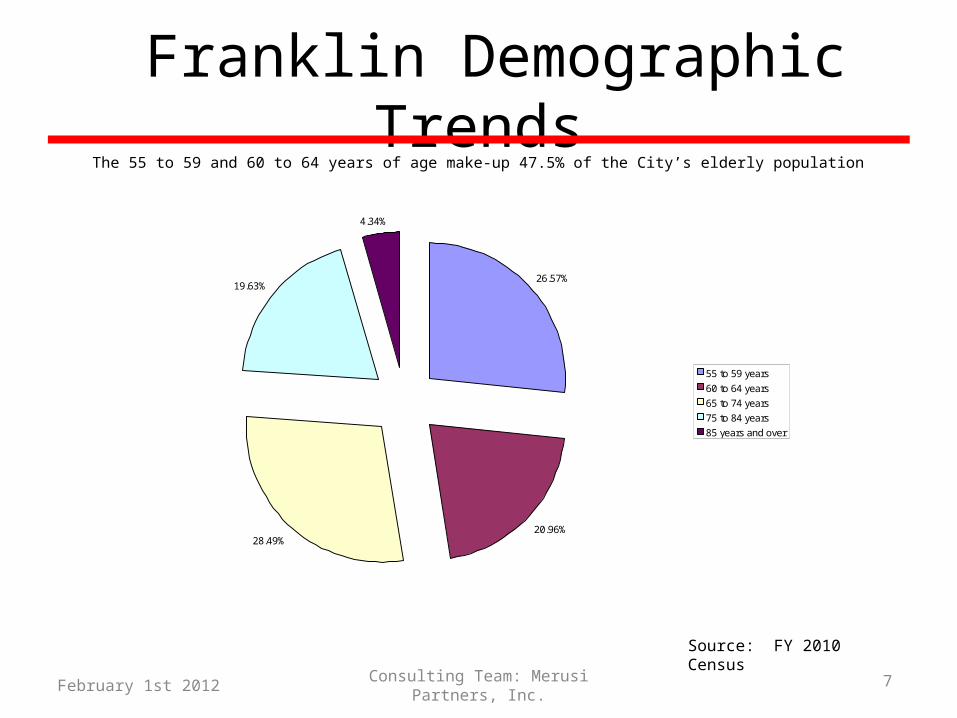
Franklin Demographic TrendsThe 55 to 59 and 60 to 64 years of age make-up 47.5% of the City’s elderly population
Source: FY 2010 Census
7Consulting Team: Merusi Partners, Inc.February 1st 2012
26.57%
20.96%28.49%
19.63%
4.34%
55 to 59 years
60 to 64 years
65 to 74 years
75 to 84 years
85 years and over

Franklin Demographic Trends
*includes all of Census Tracts 524 and 525 Source 2000 and 2010 Census
FY 2000-2010 elderly population changes are in the Hillside 60 to 64 and 75 to 84 years of age. This seems to be an indicator that the elderly population in the Hillside area is aging in-place
8Consulting Team: Merusi Partners, Inc.February 1st 2012
125
-14
-53
73
-20
131
208
8
241
104
-100
-50
0
50
100
150
200
250
300
55 to 59 years 60 to 64 years 65 to 74 years 75 to 84 years 85 years and over
Age Cohort
2000
-201
0 P
op
ula
tio
n C
HG
.
Basin
Hillside

Simpson County and City of Franklin
• FY 2000-FY 2010 demographic analysis
• City of Franklin Area and Simpson County
• Elderly population defined as 55+ years of age
• Total Elderly population change by City of Franklin and Simpson County
• Total Elderly population change by age cohort City of Franklin and Simpson County
9Consulting Team: Merusi Partners, Inc.February 1st 2012
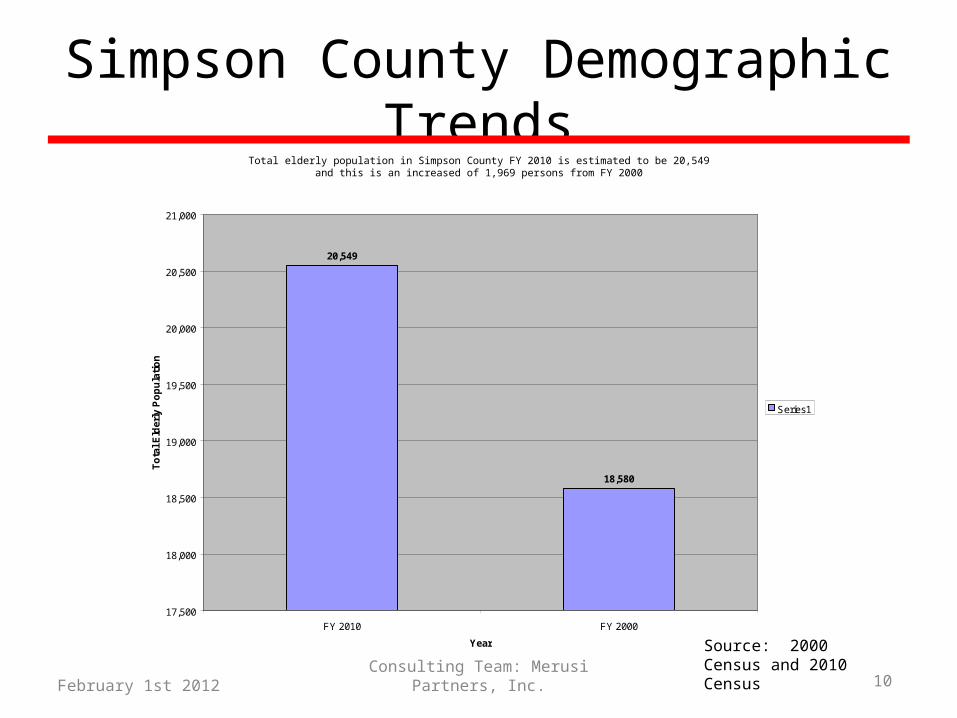
Simpson County Demographic TrendsTotal elderly population in Simpson County FY 2010 is estimated to be 20,549
and this is an increased of 1,969 persons from FY 2000
Source: 2000 Census and 2010 Census
10Consulting Team: Merusi Partners, Inc.February 1st 2012
20,549
18,580
17,500
18,000
18,500
19,000
19,500
20,000
20,500
21,000
FY 2010 FY 2000
Year
To
tal E
lder
ly P
op
ula
tio
n
Series1

Simpson County Elderly IndicatorsThe elderly growth segments for Simpson County’s are 55 to 59, 75 to 84, and 85+
Source: 2000 and 2010 Census
11Consulting Team: Merusi Partners, Inc.February 1st 2012
5,454
3,927
5,681
4,131
1,356
3,988
3,427
5,974
3,945
1,246
0
1,000
2,000
3,000
4,000
5,000
6,000
7,000
55 to 59 years 60 to 64 years 65 to 74 years 75 to 84 years 85 years and over
Age Cohort
To
tal P
op
ula
tio
n
FY 2010
FY 2000
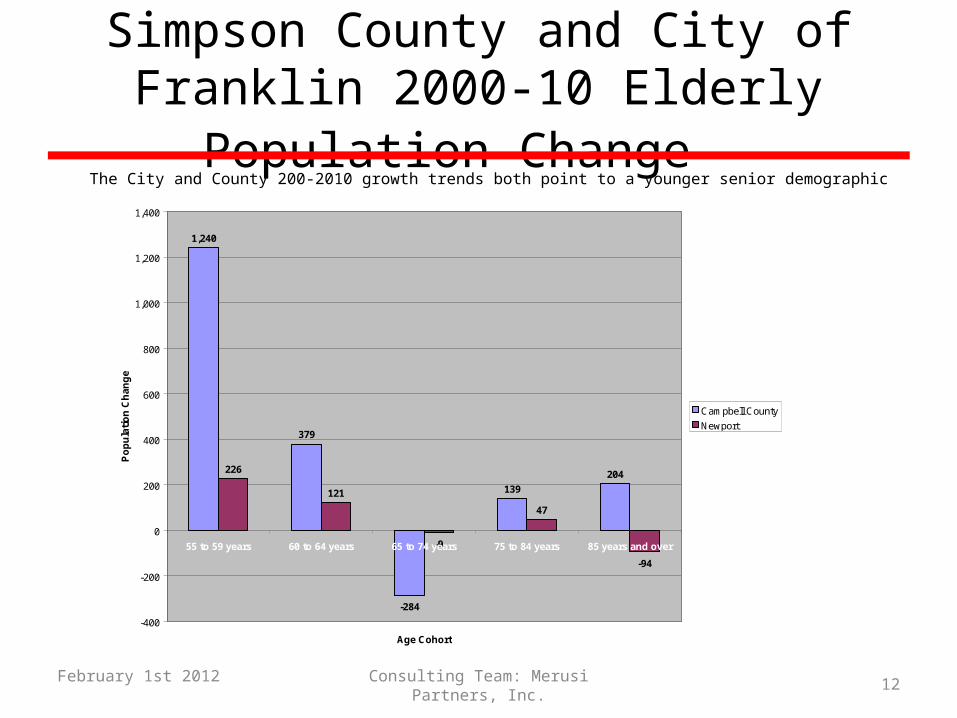
Simpson County and City of Franklin 2000-10 Elderly Population Change
The City and County 200-2010 growth trends both point to a younger senior demographic
12Consulting Team: Merusi Partners, Inc.February 1st 2012
1,240
379
-284
139
204226
121
-9
47
-94
-400
-200
0
200
400
600
800
1,000
1,200
1,400
55 to 59 years 60 to 64 years 65 to 74 years 75 to 84 years 85 years and over
Age Cohort
Po
pu
lati
on
Ch
ang
e
Campbell County
Newport

Simpson County Elderly Indicators
13Consulting Team: Merusi Partners, Inc.February 1st 2012Source: 2010 Census
The county’s elderly population is clustered in the 55 to 59 and 65 to 74 age cohort
26.54%
19.11%
27.65%
20.10%
6.60%
55 to 59 years
60 to 64 years
65 to 74 years
75 to 84 years
85 years and over