Half Yearly Financial Report 2016 - Santander UK · ANTS group, mainly at a consolidated level, is...
49
Half Yearly Financial Report 2016 Abbey National Treasury Services plc PART OF THE SANTANDER GROUP
Transcript of Half Yearly Financial Report 2016 - Santander UK · ANTS group, mainly at a consolidated level, is...
Half Yearly Financial Report 2016
Abbey National Treasury Services plc
PART OF THE SANTANDER GROUP

This page left intentionally blank

Abbey National Treasury Services plc Half Yearly Financial Report 2016
Index
Abbey National Treasury Services plc Half Yearly Financial Report 2016 1
Introduction 2
Financial review 4
Risk review 12
Governance 31
Financial statements 33

Introduction
2 Abbey National Treasury Services plc Half Yearly Financial Report 2016
The Company sets out in this report a fair review of its business and a description of its principal risks and uncertainties, including a balanced and comprehensive analysis of the development and performance of the business in the first half of the year and of its position at the end of the period. Principal activities and business review Abbey National Treasury Services plc (the Company) and its subsidiaries (collectively, ANTS or the ANTS group) provides corporate, wholesale banking and treasury services. ANTS provides these services to UK clients and also to the wider Santander UK group (comprising Santander UK plc and its subsidiaries), of which ANTS is a significant part. ANTS provides certain treasury support functions for the Santander UK group. In this regard, ANTS’s role is to provide access to certain financial markets and central bank facilities in order to meet the Santander UK group's liquidity, funding and balance sheet management requirements. The Company is authorised and regulated by the Financial Conduct Authority (FCA) and the Prudential Regulation Authority (PRA). ANTS contains portions of a number of Santander UK’s business segments. The booking of transactions in ANTS or another Santander UK group entity reflects historical or operational considerations and does not necessarily reflect any particular business split. The Company guarantees any unsubordinated liabilities of Santander UK plc, which are not debt securities, incurred prior to 30 June 2017 under a deed poll guarantee entered into by the Company on 5 June 2015, as amended (the Upstream Guarantee). Santander UK plc guarantees all the unsubordinated liabilities of the Company incurred prior to 30 June 2017 (the Downstream Guarantee). Because these guarantees are in place, the results and creditworthiness of ANTS should not be viewed in isolation. Account should also be taken of the position of the Santander UK group into which the assets and liabilities of ANTS are fully consolidated. ANTS has also entered into agreements to provide capital and/or liquidity to Santander UK plc and other members of the Santander UK group, in order to facilitate efficient intercompany funding arrangements under current regulations. For further details, see Note 32 to the Consolidated Financial Statements in the 2015 Annual Report. Preparation for ring-fencing In the first half of the year, Santander UK began repositioning the structure of its funding vehicles in preparation for ring-fencing. On 1 June 2016, Santander UK plc became the issuer of all existing medium-term wholesale securities previously issued by the Company. Specifically, Santander UK plc became the issuer in respect of all Existing Senior Medium Term Wholesale Securities issued by ANTS up to that date. The Existing Senior Medium Term Wholesale Securities comprise €60m Guaranteed Step-Down Fixed / Inverse Floating Rate Notes due 2019 and £166,995,000 Zero Coupon Amortising Guaranteed Notes due 2038. This change is part of the Santander UK group ring-fence planning pursuant to the requirements of the Financial Services (Banking Reform) Act 2013, for which we have commenced realigning the funding structure of the operating companies ANTS and Santander UK plc. Going forward, Santander UK plc will be the issuer under each of the Wholesale Funding Programmes. The Wholesale Funding Programmes comprise the US$30bn Euro Medium Term Note Programme (EMTN), the €35bn Global Covered Bond Programme and the US SEC-Registered Debt Shelf Programme. ANTS does not guarantee the notes transferred to Santander UK plc by ANTS nor will it guarantee the notes issued by Santander UK plc in the future. Economic environment The UK economy has entered a period of significant uncertainty. ANTS is well prepared to serve the needs of our customers as they steer their way through the opportunities and challenges ahead. The UK banking sector is facing some serious headwinds as the economy deals with external pressures in the short and medium term. In addition, against the backdrop of large scale regulatory change already underway, the sector has to navigate the loss of regulatory certainty as the UK negotiates new trade relationships with the European Union. The economic backdrop for most of the first half of the year continued to be positive and largely supportive of our business. The UK referendum on EU membership on 23 June 2016 marked the end of a period of relative stability for the UK banking sector. With GDP growth of about 2% in the first half of 2016, the UK economy has grown for 13 consecutive quarters. Despite recent market volatility, concerns about economic uncertainty and some headwinds from slow global growth, labour market prospects remain positive. The unemployment rate is close to 5% and its level before the crisis of 2008-2009. Inflation is currently 0.5% and, although likely to rise, is expected to remain relatively low through 2016. Low inflation also underpins the financial market expectation that the low interest rate environment will continue. Overall these have been supportive trends for our business. The low interest rate environment – with little prospect for increases in the short term – does however create a challenging environment for income growth. Demanding regulatory agenda The most significant regulatory change which we face is the requirement introduced by the Banking Reform Act for major UK banks to ring-fence their retail banking operations. Santander UK’s (including our) progress to date follows extensive efforts across the bank, and with a significant investment of management time. Santander UK submitted its plans to the PRA and FCA in January 2016 and anticipate further feedback from them later this year. Most other policy changes to support the wider regulatory change agenda have now been agreed in principle. However, implementation of these changes and compliance with the new regime remains a major undertaking across the sector.

Introduction
Abbey National Treasury Services plc Half Yearly Financial Report 2016 3
Development and performance of our business in H116 Information on the development and performance of our business in H116 is set out in the ‘Income statement review’ section of the Financial review. Our position at 30 June 2016 Information on our position at the end of the period is set out in the ‘Balance sheet review’ section of the Financial review. 2016 outlook We expect the slowdown of the UK economy, which began in the run up to the EU referendum, to continue as economic and political uncertainties prevail. In a period of significant macroeconomic uncertainty with a wide range of possible economic outcomes, some downside risks are likely to be mitigated by monetary policy actions by the Bank of England and the capital and liquidity strength of the banking sector. Despite the uncertainties we face, we believe we have the resilience and capabilities to sustain profitability and deliver on our strategy. Our principal risks and uncertainties Information on our principal risks and uncertainties is set out in the Risk review by type of risk, with more detail by business segment. Except where noted, there has been no significant change to the description of these risks or key mitigating actions as set out in the 2015 Annual Report. Key performance indicators The directors of Santander UK Group Holdings plc manage the Santander UK group’s operations on a business division basis. As a result, the Company’s Directors believe that analysis using key performance indicators for the Company or the ANTS group is not necessary or appropriate for an understanding of the development, performance or position of the Company. The development and performance of the business of the ANTS group, mainly at a consolidated level, is set out in the Financial Review. The Key Performance Indicators of Santander UK Group Holdings plc can be found on page 5 of its 2016 Half Yearly Financial Report, which do not form part of this report. By Order of the Board Antonio Roman Director 17 August 2016
Financial review
4 Abbey National Treasury Services plc Half Yearly Financial Report 2016
5 Income statement review 5 Summarised Consolidated Income Statement 6 Profit before tax by segment 7 - Commercial Banking 8 - Global Corporate Banking 9 - Corporate Centre 10 Balance sheet review 10 Summarised Condensed Consolidated Balance Sheet
Financial review
Abbey National Treasury Services plc Half Yearly Financial Report 2016 5
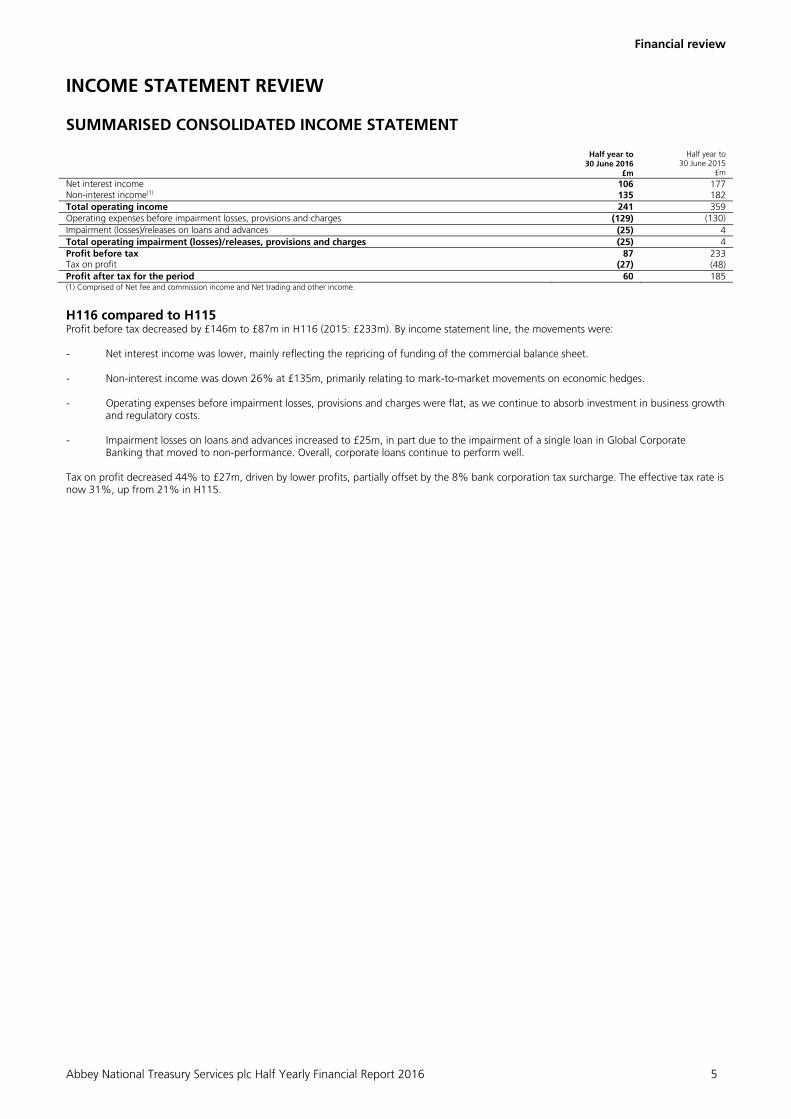
INCOME STATEMENT REVIEW SUMMARISED CONSOLIDATED INCOME STATEMENT Half year to
30 June 2016 £m
Half year to 30 June 2015
£m
Net interest income 106 177 Non-interest income(1) 135 182 Total operating income 241 359 Operating expenses before impairment losses, provisions and charges (129) (130) Impairment (losses)/releases on loans and advances (25) 4 Total operating impairment (losses)/releases, provisions and charges (25) 4 Profit before tax 87 233 Tax on profit (27) (48)Profit after tax for the period 60 185(1) Comprised of Net fee and commission income and Net trading and other income.
H116 compared to H115 Profit before tax decreased by £146m to £87m in H116 (2015: £233m). By income statement line, the movements were: - Net interest income was lower, mainly reflecting the repricing of funding of the commercial balance sheet.
- Non-interest income was down 26% at £135m, primarily relating to mark-to-market movements on economic hedges.
- Operating expenses before impairment losses, provisions and charges were flat, as we continue to absorb investment in business growth
and regulatory costs.
- Impairment losses on loans and advances increased to £25m, in part due to the impairment of a single loan in Global Corporate Banking that moved to non-performance. Overall, corporate loans continue to perform well.
Tax on profit decreased 44% to £27m, driven by lower profits, partially offset by the 8% bank corporation tax surcharge. The effective tax rate is now 31%, up from 21% in H115.

Financial review
6 Abbey National Treasury Services plc Half Yearly Financial Report 2016
Critical factors affecting results The preparation of our Condensed Consolidated Interim Financial Statements requires management to make estimates and judgements that affect the reported amount of assets and liabilities at the balance sheet date and the reported amount of income and expenses during the reporting period. Management evaluates its estimates and judgements on an ongoing basis. Management bases its estimates and judgements on historical experience and other factors believed to be reasonable under the circumstances. Actual results may differ from these estimates under different assumptions or conditions. Estimates and judgements that are considered important to the portrayal of our financial condition including, where applicable, quantification of the effects of reasonably possible ranges of such estimates are set out in ‘Critical Accounting Policies and Areas of Significant Management Judgement’ in Note 1 to the Consolidated Financial Statements in the 2015 Annual Report. The rest of this section contains a summary of the results, and commentary thereon, by income statement line item for each segment. Basis of results presentation The segmental information in this Half Yearly Financial Report reflects the reporting structure in place at the reporting date in accordance with which the segmental information in Note 2 to the Condensed Consolidated Interim Financial Statements has been presented. The Company’s board of directors (the Board) is the chief operating decision maker for ANTS. The segmental information below is presented on the basis used by the Board to evaluate performance and allocate resources. The Board reviews discrete financial information for each segment of the business which follows our normal accounting policies and principles, including measures of operating results, assets and liabilities.
PROFIT BEFORE TAX BY SEGMENT
Half year to 30 June 2016
Commercial Banking
£m
Global Corporate Banking
£m
Corporate Centre
£m Total
£m Net interest income 41 36 29 106 Non-interest income/(expense) (1) 13 160 (38) 135 Total operating income/(expense) 54 196 (9) 241 Operating expenses before impairment losses, provisions and charges (12) (104) (13) (129) Impairment losses on loans and advances (3) (22) - (25) Total operating impairment losses, provisions and charges (3) (22) - (25) Profit/(loss) before tax 39 70 (22) 87 Half year to 30 June 2015
Net interest income 37 38 102 177Non-interest income(1) 22 138 22 182Total operating income 59 176 124 359Operating expenses before impairment losses, provisions and charges (11) (101) (18) (130)Impairment releases on loans and advances 4 - - 4 Total operating impairment releases, provisions and charges 4 - - 4Profit before tax 52 75 106 233(1) Comprised of Net fee and commission income and Net trading and other income
Financial review
Abbey National Treasury Services plc Half Yearly Financial Report 2016 7
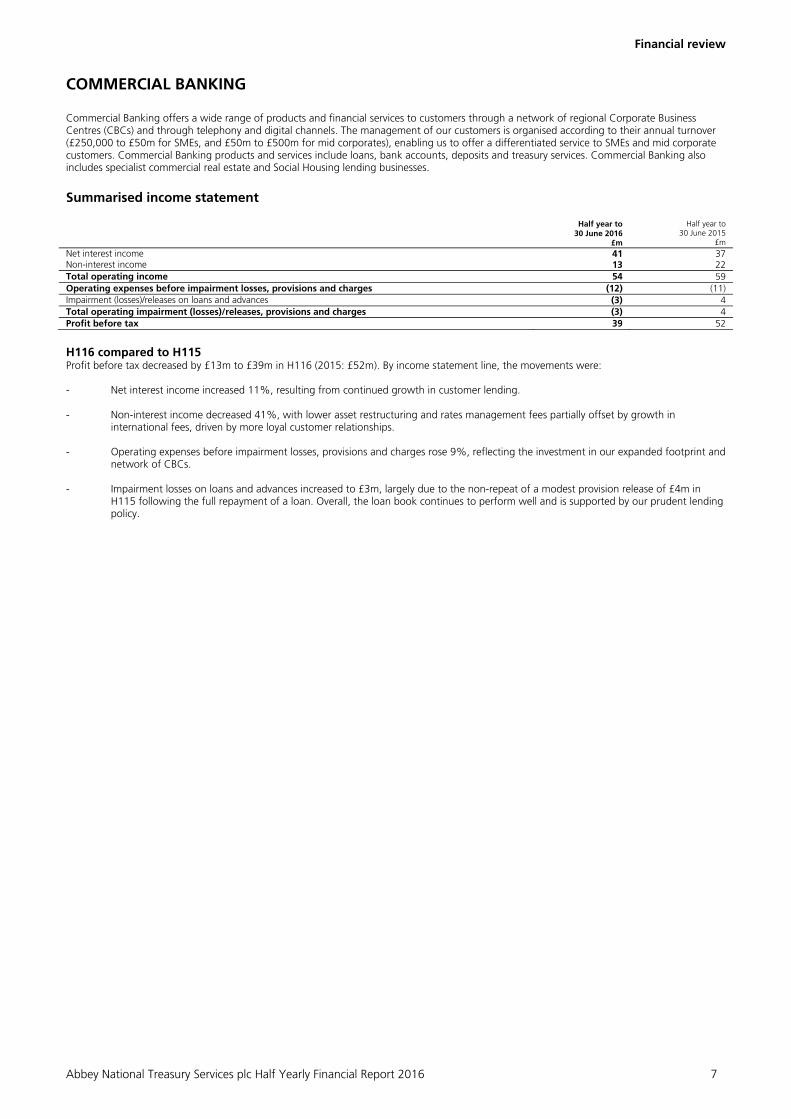
COMMERCIAL BANKING Commercial Banking offers a wide range of products and financial services to customers through a network of regional Corporate Business Centres (CBCs) and through telephony and digital channels. The management of our customers is organised according to their annual turnover (£250,000 to £50m for SMEs, and £50m to £500m for mid corporates), enabling us to offer a differentiated service to SMEs and mid corporate customers. Commercial Banking products and services include loans, bank accounts, deposits and treasury services. Commercial Banking also includes specialist commercial real estate and Social Housing lending businesses. Summarised income statement Half year to
30 June 2016 £m
Half year to 30 June 2015
£m Net interest income 41 37Non-interest income 13 22Total operating income 54 59Operating expenses before impairment losses, provisions and charges (12) (11)Impairment (losses)/releases on loans and advances (3) 4Total operating impairment (losses)/releases, provisions and charges (3) 4Profit before tax 39 52
H116 compared to H115 Profit before tax decreased by £13m to £39m in H116 (2015: £52m). By income statement line, the movements were: - Net interest income increased 11%, resulting from continued growth in customer lending.
- Non-interest income decreased 41%, with lower asset restructuring and rates management fees partially offset by growth in
international fees, driven by more loyal customer relationships.
- Operating expenses before impairment losses, provisions and charges rose 9%, reflecting the investment in our expanded footprint and network of CBCs.
- Impairment losses on loans and advances increased to £3m, largely due to the non-repeat of a modest provision release of £4m in H115 following the full repayment of a loan. Overall, the loan book continues to perform well and is supported by our prudent lending policy.
Financial review
8 Abbey National Treasury Services plc Half Yearly Financial Report 2016
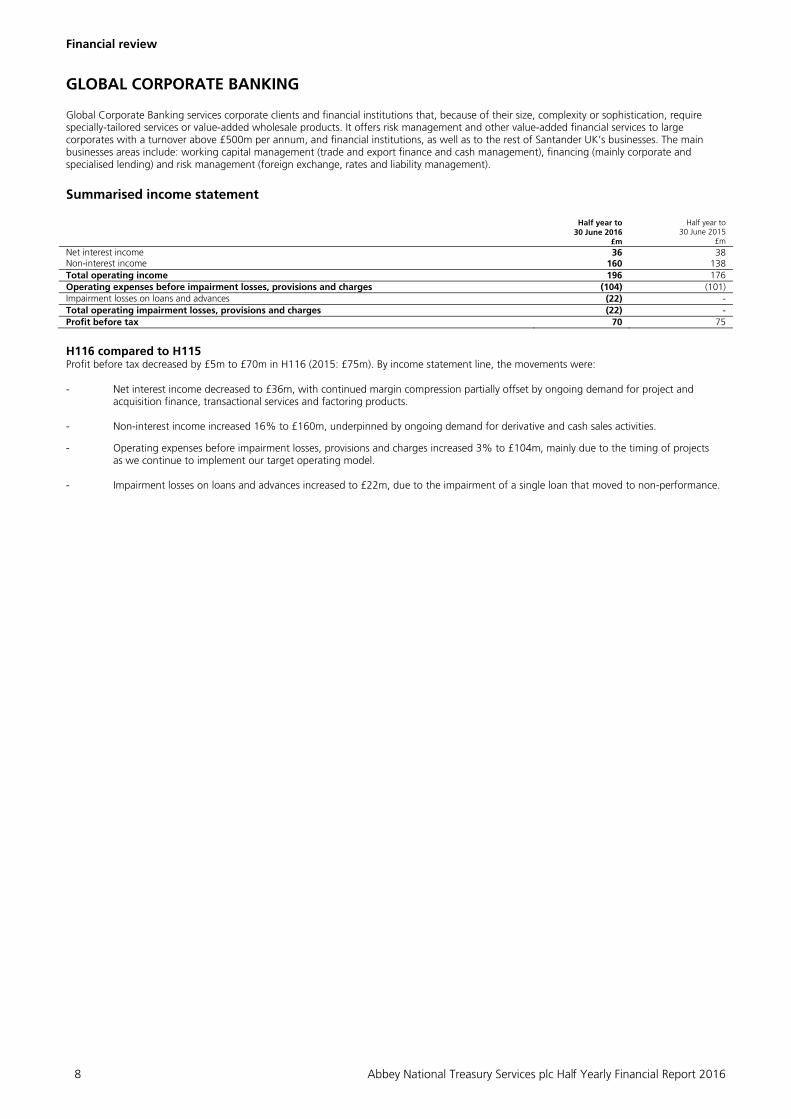
GLOBAL CORPORATE BANKING Global Corporate Banking services corporate clients and financial institutions that, because of their size, complexity or sophistication, require specially-tailored services or value-added wholesale products. It offers risk management and other value-added financial services to large corporates with a turnover above £500m per annum, and financial institutions, as well as to the rest of Santander UK’s businesses. The main businesses areas include: working capital management (trade and export finance and cash management), financing (mainly corporate and specialised lending) and risk management (foreign exchange, rates and liability management). Summarised income statement Half year to
30 June 2016 £m
Half year to 30 June 2015
£m
Net interest income 36 38Non-interest income 160 138Total operating income 196 176Operating expenses before impairment losses, provisions and charges (104) (101)Impairment losses on loans and advances (22) -Total operating impairment losses, provisions and charges (22) -Profit before tax 70 75
H116 compared to H115 Profit before tax decreased by £5m to £70m in H116 (2015: £75m). By income statement line, the movements were: - Net interest income decreased to £36m, with continued margin compression partially offset by ongoing demand for project and
acquisition finance, transactional services and factoring products.
- Non-interest income increased 16% to £160m, underpinned by ongoing demand for derivative and cash sales activities.
- Operating expenses before impairment losses, provisions and charges increased 3% to £104m, mainly due to the timing of projects as we continue to implement our target operating model.
- Impairment losses on loans and advances increased to £22m, due to the impairment of a single loan that moved to non-performance.

Financial review
Abbey National Treasury Services plc Half Yearly Financial Report 2016 9
CORPORATE CENTRE Corporate Centre predominantly consists of the non-core portfolios of Social Housing loans and structured credit assets. Corporate Centre in ANTS is also responsible for managing balance sheet composition and structure, and strategic liquidity risk for the Santander UK group. The non-core portfolios are being run-down and/or managed for value. Summarised income statement Half year to
30 June 2016 £m
Half year to 30 June 2015
£m
Net interest income 29 102Non-interest (expense)/income (38) 22Total operating (expense)/income (9) 124Operating expenses before impairment losses, provisions and charges (13) (18)(Loss)/ profit before tax (22) 106
H116 compared to H115 Profit before tax decreased by £128m to a loss of £22m in H116 (2015: profit of £106m). By income statement line, the movements were: - Net interest income decreased, reflecting the repricing of funding of the commercial balance sheet.
- Non-interest (expense)/income decreased, primarily relating to mark-to-market movements on economic hedges.
- Operating expenses before impairment losses, provisions and charges decreased, reflecting increased cost control.
Financial review
10 Abbey National Treasury Services plc Half Yearly Financial Report 2016
BALANCE SHEET REVIEW SUMMARISED CONDENSED CONSOLIDATED BALANCE SHEET 30 June 2016
£m 31 December 2015
£m Assets Cash and balances at central banks 3,499 2,279 Trading assets 28,949 23,649 Derivative financial instruments 32,918 24,875 Financial assets designated at fair value 2,238 2,130 Loans and advances to banks 11,968 21,544 Loans and advances to customers 16,506 32,455 Loans and receivables securities 165 15 Available-for-sale securities 561 1,168 Macro hedge of interest rate risk 823 521 Property, plant and equipment 10 12 Tax, intangibles and other assets 292 219 Total assets 97,929 108,867 Liabilities Deposits by banks 33,737 21,333 Deposits by customers 2,736 2,838 Trading liabilities 14,674 12,722 Derivative financial instruments 36,033 25,178 Financial liabilities designated at fair value 1,604 2,016 Debt securities in issue 5,195 40,811 Tax, other liabilities and provisions 320 326 Total liabilities 94,299 105,224 Equity Total shareholders’ equity 3,630 3,643 Total equity 3,630 3,643 Total liabilities and equity 97,929 108,867
A more detailed consolidated balance sheet is contained in the Condensed Consolidated Interim Financial Statements. 30 June 2016 compared to 31 December 2015 Assets Cash and balances at central banks Cash and balances held at central banks increased by 54% to £3,499m at 30 June 2016 (2015: £2,279m). The increase was mainly attributable to an increase at central bank for liquidity purposes. Trading assets Trading assets increased by 22% to £28,949m at 30 June 2016 (2015: £23,649m) reflecting changes in the mix of assets held for liquidity purposes, with higher levels of securities purchased under resale agreements and debt partially offset by decreased holdings of equity securities. Derivative financial instruments - assets Derivative assets increased by 32% to £32,918m at 30 June 2016 (2015: £24,875m). The increase was mainly attributable to increases in the fair value of interest rate and cross currency derivative assets principally driven by movements in yield curves and foreign exchange rates. Financial assets designated at fair value Financial assets designated at fair value through profit and loss increased by 5% to £2,238m at 30 June 2016 (2015: £2,130m), mainly driven by the increase in the valuation of assets partially offset by maturities within the portfolio. In accordance with ANTS group policy, new loans are no longer being designated at fair value. Loans and advances to banks Loans and advances to banks decreased to £11,968m at 30 June 2016 (2015: £21,544m). The decrease was mainly driven by lower balances with Santander UK group undertakings. This was due to the netting and settlement of intercompany balances following the transfer of the issuer on a number of funding programmes from the Company to Santander UK plc, as Santander UK began repositioning the structure of its funding vehicles in preparation for Banking Reform. Loans and advances to customers Loans and advances to customers decreased by 49% to £16,506m at 30 June 2016 (2015: £32,455m). The decrease was mainly driven by lower intercompany balances with Abbey Covered Bonds LLP following the transfer of the issuer on the €35bn Global Covered Bond Programme from the Company to Santander UK plc.

Financial review
Abbey National Treasury Services plc Half Yearly Financial Report 2016 11
Available-for-sale securities Available for sale securities decreased by 52% to £561m at 30 June 2016 (2015: £1,168m) primarily due to a decrease in debt securities as part of normal liquid asset portfolio management activity. Macro hedge of interest rate risk - assets The macro hedge of interest rate risk increased by 58% to £823m at 30 June 2016 (2015: £521m), mainly driven by general movements in yield curves. Tax, intangibles and other assets Tax, intangibles and other assets increased by 33% to £292m at 30 June 2016 (2015: £219m). The increase was primarily driven by an increase in prepayments and trade and other receivables relating to settlement of transactions. Liabilities Deposits by banks Deposits by banks increased by 58% to £33,737m at 30 June 2016 (2015: £21,333m). This was due to an increase in intercompany balances as consideration for the transfer of the issuer on a number of funding programmes from the Company to Santander UK plc, as Santander UK began repositioning the structure of its funding vehicles in preparation for Banking Reform. Deposits by customers Deposits by customers decreased by 4% to £2,736m at 30 June 2016 (2015: £2,838m). The decrease was due to lower levels of deposits from third party customers partially offset by increased balances with other Santander UK group companies. Trading liabilities Trading liabilities increased by 15% to £14,674m at 30 June 2016 (2015: £12,722m) as a result of an increase in short positions and short-term deposits and collateral held partially offset by a reduction in securities sold under resale agreements, as part of normal trading activity. Derivative financial instruments - liabilities Derivative liabilities increased by 43% to £36,033m at 30 June 2016 (2015: £25,178m). The increase was mainly attributable to increases in the fair value of interest rate and cross currency derivative liabilities mainly driven by movements in yield curves and foreign exchange rates. Financial liabilities designated at fair value Financial liabilities designated at fair value through profit and loss decreased by 20% to £1,604m at 30 June 2016 (2015: £2,016m). This was due to the transfer of the issuer on a number of funding programmes from the Company to Santander UK plc, as Santander UK began repositioning the structure of its funding vehicles in preparation for Banking Reform. Debt securities in issue Debt securities in issue decreased by 87% to £5,195m at 30 June 2016 (2015: £40,811m). This was due to the transfer of the issuer on a number of funding programmes from the Company to Santander UK plc, as Santander UK began repositioning the structure of its funding vehicles in preparation for Banking Reform. Tax, other liabilities and provisions Tax, other liabilities and provisions decreased by 2% to £320m at 30 June 2016 (2015: £326m). The decrease mainly reflected a reduction in deferred tax liabilities on cash flow hedges relating to the funding programmes transferred from the Company to Santander UK plc in the period. This was partially offset by an increase in current tax liabilities attributable to the banking corporation tax surcharge. Equity Total shareholders’ equity decreased to £3,630m at 30 June 2016 (2015: £3,643m). The decrease was mainly due to the transfer of the cash flow hedge reserve on the funding programmes transferred from the Company to Santander UK plc in the period. This was partially offset by the profit for the period of £60m.

Risk review
12 Abbey National Treasury Services plc Half Yearly Financial Report 2016
13 Risk governance 14 Credit risk 14 - ANTS group level 15 - Commercial Banking 20 - Global Corporate Banking 22 - Corporate Centre 24 Market risk 25 Liquidity risk 27 Capital risk 28 Other key risks and areas of focus

Risk review
Abbey National Treasury Services plc Half Yearly Financial Report 2016 13
We provide corporate, wholesale banking and treasury services to UK clients and also to the wider Santander UK group, of which we are a significant part. ANTS also provides certain treasury support functions for the Santander UK group. In this regard, our role is to provide access to certain financial markets and central bank facilities in order to meet the Santander UK group's liquidity, funding and balance sheet management requirements. ANTS contains portions of a number of Santander UK’s business segments. Specifically, ANTS consists of part of the Santander UK group’s Commercial Banking, Global Corporate Banking, and Corporate Centre business segments. The booking of transactions in ANTS or another Santander UK group entity reflects historical or operational considerations and does not necessarily reflect any particular business split. The Company guarantees any unsubordinated liabilities of Santander UK plc, which are not debt securities, incurred prior to 30 June 2017 under a deed poll guarantee entered into by the Company on 5 June 2015, as amended (the Upstream Guarantee). Because of the Upstream Guarantee, the Company is exposed to the same risks as the Santander UK group, of which the Company and the ANTS group are part. As a subsidiary of Santander UK plc, ANTS has adopted the Santander UK Risk Framework. As a result, the ANTS group’s risks are managed at a Santander UK group level in accordance with the Santander UK group’s Risk Framework. The Risk review describes the Santander UK group’s Risk Framework and includes more detail on the key risks (on a segmental basis or aggregated where relevant) to which the ANTS group is directly exposed. In addition, as a result of the guarantee given by the ANTS group in respect of the unsubordinated liabilities of Santander UK plc, we are indirectly exposed to risks that arise in parts of the Santander UK group that are wholly outside the ANTS group. Those risks consist of retail credit risk and pension obligations risk. Throughout the Risk review, except where we say otherwise, references to Santander UK should be taken to include the ANTS group (reflecting both the risks that we are directly exposed to through our own activities and the risks arising elsewhere in the Santander UK group that we are indirectly exposed to due to the existence of the Upstream Guarantee described above).
The UK’s referendum on EU membership Our financial performance is strongly linked to the health of the UK economy. We are particularly affected by factors that impact the profitability of our larger credit portfolios, including in our commercial real estate portfolio. The decision to leave the EU has led to further economic uncertainty and financial market volatility. In the near-term, this could result in lower consumer confidence that would be negative for continued economic growth. In addition, the lower value of GBP sterling, when combined with the pickup in oil prices, is likely to lead to higher inflation. In a period of significant macroeconomic uncertainty with a wide range of possible economic outcomes, some economic downside risks are likely to be mitigated by monetary policy actions by the Bank of England and the capital and liquidity strength of the banking sector. Although the result does not entail any immediate changes to our current operations and structure, economic uncertainty could adversely affect our business. Whilst the terms and timing of the UK’s exit from the EU are yet to be confirmed, it is not possible to determine with any accuracy the full impact that this might have. In addition, it remains unclear whether, following exit from the EU, it will be possible for us (and other UK banks) to continue to provide financial services on a cross-border basis within other EU member states. The risks associated with the outcome of the referendum have been considered by our Board, together with the action plans needed to ensure the impact on our business is appropriately managed.
RISK GOVERNANCE
As a financial services provider, managing risk is a core part of our day-to-day activities. To be able to manage our business effectively, it is critical that we understand and control risk in everything we do. We aim to use a prudent approach and advanced risk management techniques to help us deliver robust financial performance and build sustainable value for our stakeholders. We aim to keep a predictable medium-low risk profile, consistent with our business model, and within the limits set out in our Risk Appetite. This is key to achieving our strategic objectives. 30 June 2016 compared to 31 December 2015 In H116, we continued to make good progress with our risk culture program, I AM Risk, to continue to embed personal accountability for managing risk across the business. For all new and existing employees, we enhanced our mandatory risk training and we ensured that the updated performance management risk objectives were used across the business. In a recent survey, 99% of employees acknowledged their personal responsibility for risk management, helping to show how we are successfully embedding risk management in our culture.
Risk review
14 Abbey National Treasury Services plc Half Yearly Financial Report 2016
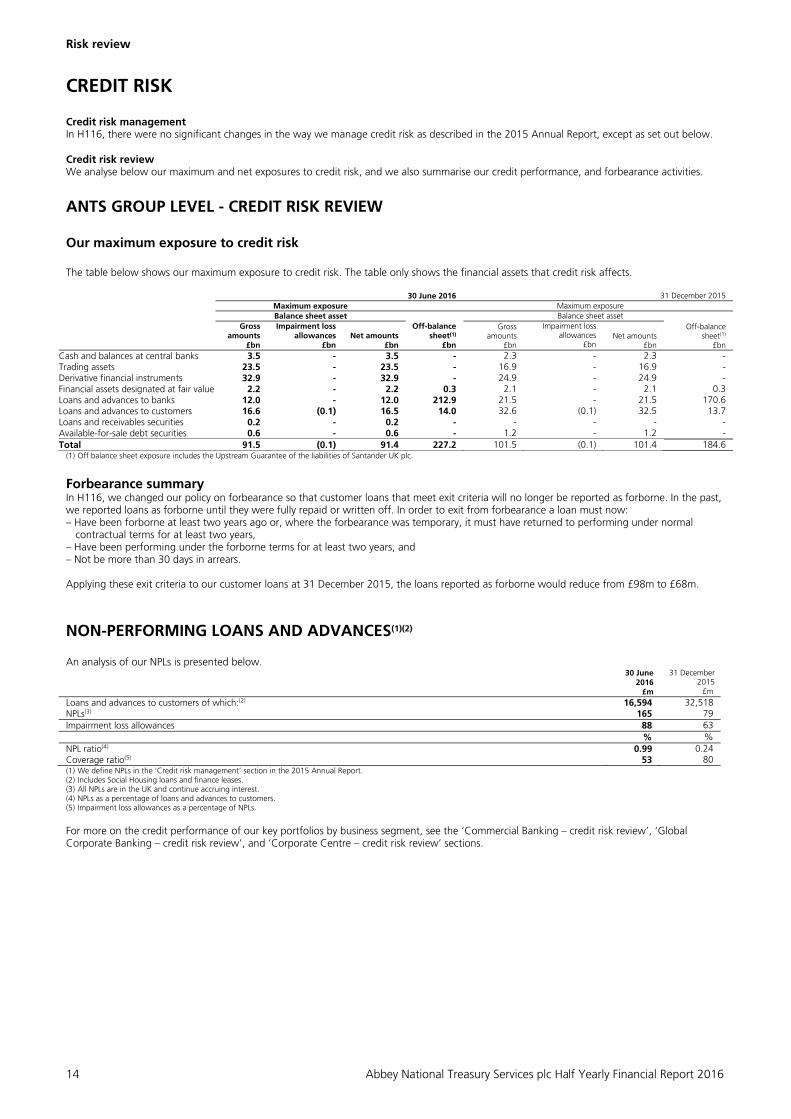
CREDIT RISK Credit risk management In H116, there were no significant changes in the way we manage credit risk as described in the 2015 Annual Report, except as set out below. Credit risk review We analyse below our maximum and net exposures to credit risk, and we also summarise our credit performance, and forbearance activities.
ANTS GROUP LEVEL - CREDIT RISK REVIEW Our maximum exposure to credit risk The table below shows our maximum exposure to credit risk. The table only shows the financial assets that credit risk affects. 30 June 2016 31 December 2015 Maximum exposure Maximum exposure Balance sheet asset Balance sheet asset
Gross amounts
£bn
Impairment loss allowances
£bn Net amounts
£bn
Off-balance sheet(1)
£bn
Gross amounts
£bn
Impairment loss allowances
£bn Net amounts
£bn
Off-balance sheet(1)
£bn Cash and balances at central banks 3.5 - 3.5 - 2.3 - 2.3 -Trading assets 23.5 - 23.5 - 16.9 - 16.9 -Derivative financial instruments 32.9 - 32.9 - 24.9 - 24.9 -Financial assets designated at fair value 2.2 - 2.2 0.3 2.1 - 2.1 0.3Loans and advances to banks 12.0 - 12.0 212.9 21.5 - 21.5 170.6Loans and advances to customers 16.6 (0.1) 16.5 14.0 32.6 (0.1) 32.5 13.7Loans and receivables securities 0.2 - 0.2 - - - - - Available-for-sale debt securities 0.6 - 0.6 - 1.2 - 1.2 -Total 91.5 (0.1) 91.4 227.2 101.5 (0.1) 101.4 184.6
(1) Off balance sheet exposure includes the Upstream Guarantee of the liabilities of Santander UK plc.
Forbearance summary In H116, we changed our policy on forbearance so that customer loans that meet exit criteria will no longer be reported as forborne. In the past, we reported loans as forborne until they were fully repaid or written off. In order to exit from forbearance a loan must now: – Have been forborne at least two years ago or, where the forbearance was temporary, it must have returned to performing under normal
contractual terms for at least two years, – Have been performing under the forborne terms for at least two years, and – Not be more than 30 days in arrears. Applying these exit criteria to our customer loans at 31 December 2015, the loans reported as forborne would reduce from £98m to £68m.
NON-PERFORMING LOANS AND ADVANCES(1)(2) An analysis of our NPLs is presented below.
30 June 2016
£m
31 December 2015
£m Loans and advances to customers of which:(2) 16,594 32,518 NPLs(3) 165 79 Impairment loss allowances 88 63 % % NPL ratio(4) 0.99 0.24 Coverage ratio(5) 53 80 (1) We define NPLs in the ‘Credit risk management’ section in the 2015 Annual Report. (2) Includes Social Housing loans and finance leases. (3) All NPLs are in the UK and continue accruing interest. (4) NPLs as a percentage of loans and advances to customers. (5) Impairment loss allowances as a percentage of NPLs.
For more on the credit performance of our key portfolios by business segment, see the ‘Commercial Banking – credit risk review’, ‘Global Corporate Banking – credit risk review’, and ‘Corporate Centre – credit risk review’ sections.

Risk review
Abbey National Treasury Services plc Half Yearly Financial Report 2016 15
COMMERCIAL BANKING – CREDIT RISK REVIEW In Commercial Banking, credit risk arises on asset balances and off-balance sheet transactions such as credit facilities or guarantees. As a result, committed exposures are typically higher than asset balances. Commercial Banking – committed exposures Rating distribution These tables show our credit risk exposure according to our internal rating scale (see the ‘Credit quality’ section in the 2015 Annual Report) for each portfolio. On this scale, the higher the rating, the better the quality of the counterparty.
30 June 2016
Mid Corporate and SME
£m
Commercial Real Estate
£m Social Housing
£m Total
£m 9 13 - 911 924 8 112 - 1,433 1,545 7 300 446 246 992 6 1,119 2,825 - 3,944 5 480 1,298 - 1,778 4 112 131 - 243 1 to 3 11 85 - 96 Other(1) - 3 - 3 2,147 4,788 2,590 9,525 31 December 2015 9 13 - 970 983 8 114 - 892 1,006 7 314 653 257 1,224 6 791 2,296 50 3,137 5 567 1,271 - 1,838 4 121 150 - 271 1 to 3 7 92 - 99 Other(1) 4 2 - 6 1,931 4,464 2,169 8,564 (1) Consists of smaller exposures mainly in the commercial mortgages portfolio. We use scorecards for them, instead of a rating model.
Geographical distribution Almost all our lending is to customers in the UK. We classify geographical location according to country of risk – in other words, the country where each counterparty has its main business activity or assets unless there is a full risk transfer guarantee in place, in which case we use the guarantor’s country of domicile instead. If our clients have operations in many countries, we use their country of incorporation. 30 June 2016 compared to 31 December 2015 Our lending to customers has grown consistently since 2008, and we continue to operate within our prudent Risk Appetite. At 30 June 2016 99.4% (2015: 99.1%) of our portfolio was with UK counterparties. In H116, our committed exposures increased by 11% to £9.5bn (2015: £8.6bn) despite an increasingly competitive environment, macro-economic uncertainty and the resulting slowdown in activity relating to the UK referendum on EU membership. Our Mid Corporate and SME exposures increased by 11% to £2.1bn (2015: £1.9bn) due to growth in the Mid Corporate portfolio. This more than offset a slight reduction in SME exposures. Our Commercial Real Estate portfolio increased by 7% to £4.8bn (2015: £4.5bn) with new business levels more than offsetting repayments. Our Social Housing portfolio increased by 19% to £2.6bn (2015: £2.2bn), driven by refinancing of longer-dated loans previously managed in Corporate Centre onto shorter maturities and on current market terms.
Commercial Banking – credit risk mitigation At 30 June 2016, the collateral we held against impaired loans was100% (2015: 100%) of the carrying amount of the impaired loan balances.
Risk review
16 Abbey National Treasury Services plc Half Yearly Financial Report 2016
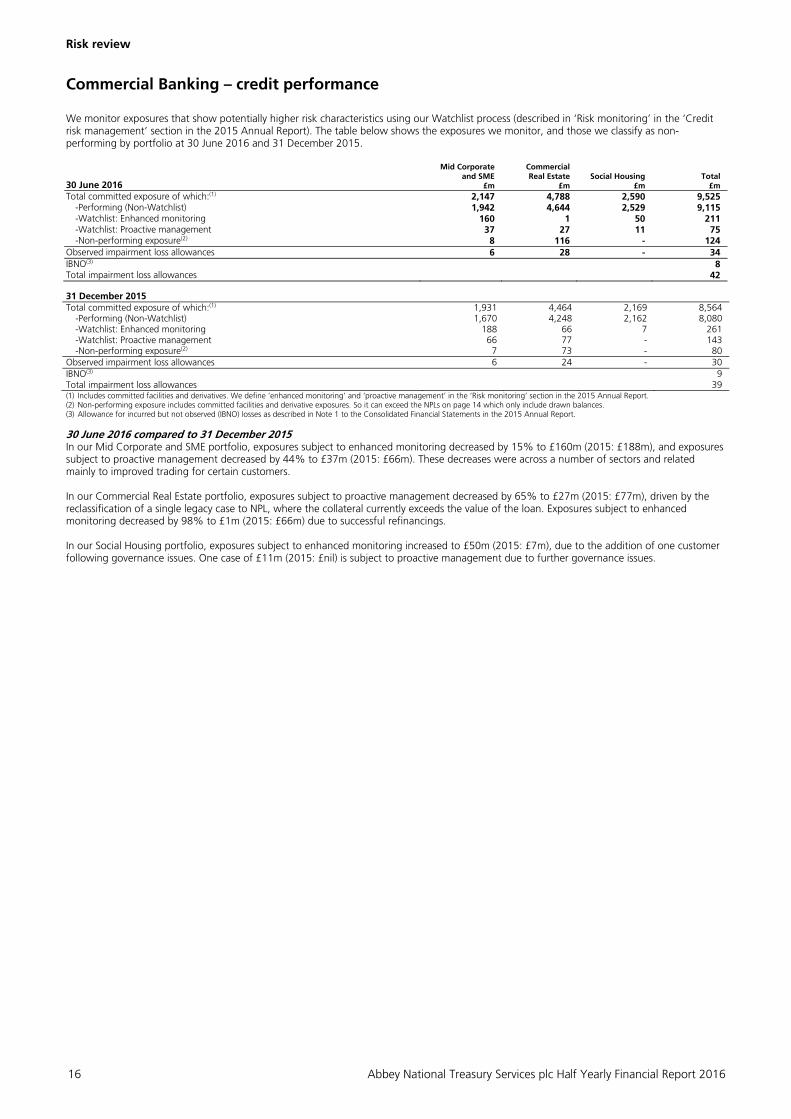
Commercial Banking – credit performance We monitor exposures that show potentially higher risk characteristics using our Watchlist process (described in ‘Risk monitoring’ in the ‘Credit risk management’ section in the 2015 Annual Report). The table below shows the exposures we monitor, and those we classify as non-performing by portfolio at 30 June 2016 and 31 December 2015.
30 June 2016
Mid Corporate and SME
£m
Commercial Real Estate
£m Social Housing
£m Total
£m Total committed exposure of which:(1) 2,147 4,788 2,590 9,525
-Performing (Non-Watchlist) 1,942 4,644 2,529 9,115 -Watchlist: Enhanced monitoring 160 1 50 211 -Watchlist: Proactive management 37 27 11 75 -Non-performing exposure(2) 8 116 - 124
Observed impairment loss allowances 6 28 - 34 IBNO(3) 8 Total impairment loss allowances 42 31 December 2015 Total committed exposure of which:(1) 1,931 4,464 2,169 8,564
-Performing (Non-Watchlist) 1,670 4,248 2,162 8,080 -Watchlist: Enhanced monitoring 188 66 7 261 -Watchlist: Proactive management 66 77 - 143 -Non-performing exposure(2) 7 73 - 80
Observed impairment loss allowances 6 24 - 30 IBNO(3) 9 Total impairment loss allowances 39 (1) Includes committed facilities and derivatives. We define ‘enhanced monitoring’ and ‘proactive management’ in the ‘Risk monitoring’ section in the 2015 Annual Report. (2) Non-performing exposure includes committed facilities and derivative exposures. So it can exceed the NPLs on page 14 which only include drawn balances. (3) Allowance for incurred but not observed (IBNO) losses as described in Note 1 to the Consolidated Financial Statements in the 2015 Annual Report.
30 June 2016 compared to 31 December 2015 In our Mid Corporate and SME portfolio, exposures subject to enhanced monitoring decreased by 15% to £160m (2015: £188m), and exposures subject to proactive management decreased by 44% to £37m (2015: £66m). These decreases were across a number of sectors and related mainly to improved trading for certain customers. In our Commercial Real Estate portfolio, exposures subject to proactive management decreased by 65% to £27m (2015: £77m), driven by the reclassification of a single legacy case to NPL, where the collateral currently exceeds the value of the loan. Exposures subject to enhanced monitoring decreased by 98% to £1m (2015: £66m) due to successful refinancings. In our Social Housing portfolio, exposures subject to enhanced monitoring increased to £50m (2015: £7m), due to the addition of one customer following governance issues. One case of £11m (2015: £nil) is subject to proactive management due to further governance issues.

Risk review
Abbey National Treasury Services plc Half Yearly Financial Report 2016 17
Commercial Banking – forbearance We only made forbearance arrangements for lending to customers. We have not made any forbearance arrangements with our Social Housing counterparties. Forbearance started in the period(1) The exposures that entered forbearance in H116 and H115 were: Half year to 30 June 2016 Half year to 30 June 2015 Mid Corporate
and SME Commercial
Real Estate Total Mid Corporate
and SME Commercial
Real Estate Total
£m £m £m £m £m £m Term extension 19 12 31 - - - 19 12 31 - - - (1) The figures reflect the forbearance activity in the period, regardless of whether there was any forbearance on the accounts before. Forbearance total position(1) The exposures at 30 June 2016 and 31 December 2015, analysed by their payment status at the period-end and the forbearance we applied, were:
30 June 2016
Term extension £m
Other payment
rescheduling £m
Total £m
Impairment
loss allowances £m
Non-performing 33 16 49 21 Performing 19 30 49 - 52 46 98 21 Proportion of portfolio 0.5% 0.5% 1.0% 31 December 2015
Non-performing 22 16 38 14 Performing 30 30 60 - 52 46 98 14 Proportion of portfolio 0.6% 0.5% 1.1% (1) We base forbearance type on the first forbearance we applied. Tables only show accounts that were open at the period-end.
30 June 2016 compared to 31 December 2015 The forbearance started in H116 was higher than in H115 due to an increase in forbearance activity mainly in our Mid Corporate and SME portfolio. At 30 June 2016, the cumulative forbearance stock remained stable at £98m. This was mainly due to the application of exit criteria to our forbearance policy in H116 as described in the ‘Forbearance summary’ of the ‘ANTS group level - credit risk review’ section, offset by a small number of new exposures entering forbearance in the period. Applying these exit criteria to our forbearance stock at 31 December 2015, the loans reported as forborne would reduce by £30m to £68m. The accounts in forbearance as a percentage of the portfolio reduced slightly to 1.0% (2015: 1.1%). At 30 June 2016, 71% (2015: 84%) of the cumulative forbearance stock had entered forbearance before default. 50% (2015: 61%) of these exposures were keeping to the forbearance terms showing that much of the action had been effective. Debt-for-equity swaps At 30 June 2016, we had no equity securities that arose from debt-for-equity swaps in respect of loans (2015: £nil).

Risk review
18 Abbey National Treasury Services plc Half Yearly Financial Report 2016
Higher risk loans and other segments of particular interest Commercial Real Estate is lending to UK customers, primarily on tenanted property assets, with a focus on the office, retail, industrial and residential sectors. The Commercial Real Estate market experienced a challenging environment in the immediate years after the last financial crisis and has previously seen regular cyclical downturns. In addition to the disclosures on the Commercial Real Estate portfolio earlier in this section, we include below more detail on credit management, credit performance, and sector and LTV analyses. Commercial Real Estate - credit management We have a clearly defined Commercial Real Estate credit risk policy and risk appetite, both of which we review regularly in light of market conditions and our exposure to separate asset classes. We assess risk appetite on a deal-by-deal basis taking into account transaction risks and the risk profile. We structure transactions on a case-by-case basis to give us a clear exit strategy at loan maturity. The repayment schedule is driven by a number of factors, including the exit strategy, the opening debt position, the nature of the asset class, the weighted average lease length, the tenant profile and the re-letting risk. All Commercial Real Estate loans benefit from senior positions in the creditor hierarchy. Commercial Real Estate - credit performance The table below shows the Commercial Real Estate total committed exposures, non-performing exposure ratios and weighted average LTVs at 30 June 2016 and 31 December 2015:
30 June 2016 31 December 2015 Total committed exposure £4,788m £4,464m Non-performing exposure ratio(1) 2.4% 1.6% Weighted average LTV 52% 53% (1) Non-performing exposures as a percentage of total committed exposures.
30 June 2016 compared to 31 December 2015 At 30 June 2016, our non-performing exposure ratio increased to 2.4% (2015: 1.6%) driven by the classification of a single legacy case as non-performing, where the collateral exceeds the value of the loan. Commercial Real Estate loans written before 2009 totalled £279m (2015: £318m), with a non-performing exposure ratio of 41.4% (2015: 23.0%), the increase in the ratio being driven by a continued reduction in the pre-2009 exposures, as well as the single loan noted above. The pre-2009 loans were written on market terms which, compared with more recent times and following a significant tightening in our lending criteria, included higher original LTVs, lower interest coverage and exposure to development risk. Commercial Real Estate - sector analysis The table below shows the sector analysis of the Commercial Real Estate portfolio at 30 June 2016 and 31 December 2015:
30 June 2016 31 December 2015 Sector £m % £m % Office 1,509 32 1,258 28 Retail 1,234 26 1,183 26 Industrial 645 13 664 15 Residential 277 6 257 6 Mixed use 580 12 615 14 Student accommodation 84 2 84 2 Hotels and leisure 238 5 238 5 Other 221 4 165 4 4,788 100 4,464 100

Risk review
Abbey National Treasury Services plc Half Yearly Financial Report 2016 19
Commercial Real Estate - LTV analysis The table below shows the LTVs of the Commercial Real Estate portfolio at 30 June 2016 and 31 December 2015: 30 June 2016 31 December 2015 Total exposure Non-performing exposure Total exposure Non-performing exposure £m % £m % £m % £m % Up to 50% 1,918 40 - - 1,840 40 - - 50% to 60% 1,862 39 - - 1,509 34 - - 60% to 70% 487 10 - - 654 15 - - 70% to 80% 61 1 50 43 37 1 - - 80% to 90% 18 - - - 68 2 - - 90% to 100% 1 - - - 16 - 15 21 >100% i.e. negative equity 47 1 47 41 40 1 40 54 Other 81 2 - - 79 2 - - Total with collateral 4,475 93 97 84 4,243 95 55 75 Development loans 313 7 18 16 221 5 18 25 4,788 100 115 100 4,464 100 73 100
30 June 2016 compared to 31 December 2015 The Commercial Real Estate portfolio was well diversified by sector at 30 June 2016 and 31 December 2015. The portfolio also represented a diverse geographical footprint across the UK, while continuing to reflect a slight concentration around London and the South East. At 30 June 2016, the LTV profile of the portfolio remained conservative with £3,780m (2015: £3,349m) of the portfolio at or below 60% LTV. This reflects the vintage of the portfolio as 94% (2015: 93%) was originated in 2009 or later. Most higher LTV deals are older deals still in the portfolio. At 30 June 2016, loans with development risk were only 7% (2015: 5%) of the total Commercial Real Estate portfolio. All development lending is on a non-speculative basis with significant pre-lets in place. In H116, no new business was written above 70% LTV, and 99% was at or below 60% LTV. At 30 June 2016, the average LTV, weighted by exposure, was 52% (2015: 53%). The weighted average LTV of new deals in H116 was 51% (FY15: 50%). The average loan size at 30 June 2016 was £33.2m (2015: £31.7m) and the top ten exposures made up 18% (2015: 18%) of the total Commercial Real Estate portfolio exposure. Commercial Real Estate - refinancing risk As part of our annual review process, for Commercial Real Estate loans approaching maturity, we look at the prospects of refinancing the loan on current market terms and applicable credit policy. We also look at other aspects (such as covenant compliance) which could mean we have to put the case on our Watchlist. In addition, if we do not receive an acceptable refinancing proposal six months before the loan matures, we put it our Watchlist. At 30 June 2016, Commercial Real Estate loans of £706m (2015: £731m) were due to mature within 12 months. Of these, £107m, i.e. 15% (2015: £103m, i.e. 14%) had an LTV ratio higher than is acceptable under our current credit policy. At 30 June 2016 and 31 December 2015, all of this had been put on our Watchlist or recorded as NPL and had an impairment loss allowance of £21m (2015: £13m).

Risk review
20 Abbey National Treasury Services plc Half Yearly Financial Report 2016
GLOBAL CORPORATE BANKING - CREDIT RISK REVIEW In Global Corporate Banking, credit risk arises on asset balances and off-balance sheet transactions such as credit facilities or guarantees. As a result, committed exposures are typically higher than asset balances. But in the committed exposures tables below, we show Sovereigns and Supranationals net of short positions. They also include Sovereign and Supranational exposures that form part of our liquidity management strategy, managed by Short Term Markets on behalf of Corporate Centre. Large Corporate reverse repurchase agreement exposures are shown net of repurchase agreement liabilities and include OTC derivatives. As a result, the committed exposures can be smaller than the asset balances on the balance sheet. The derivative and other treasury product exposures (which are classified as ‘Financial Institutions’) shown are also typically lower than the asset balances. This is because we show our overall risk exposure which takes into account our procedures to mitigate credit risk. The asset balances on our balance sheet only reflect the more restrictive netting permitted by IAS 32.
Global Corporate Banking – committed exposures Rating distribution
These tables show our credit risk exposure according to our internal rating scale (see the ‘Credit quality’ section in the 2015 Annual Report) for each portfolio. On this scale, the higher the rating, the better the quality of the counterparty.
30 June 2016
Sovereign and Supranational
£m
Large Corporate
£m
Financial Institutions
£m Total
£m 9 145 20 218 383 8 2,985 1,580 3,102 7,667 7 980 5,049 2,709 8,738 6 - 7,772 630 8,402 5 - 3,319 126 3,445 4 - 69 - 69 1 to 3 - 54 1 55 4,110 17,863 6,786 28,759
31 December 2015 9 889 3 263 1,155 8 2,766 1,614 3,596 7,976 7 789 5,042 2,786 8,617 6 - 6,941 314 7,255 5 - 2,908 6 2,914 4 - 36 - 36 1 to 3 - 4 - 4 4,444 16,548 6,965 27,957
Geographical distribution We classify geographical location according to country of risk - in other words, the country where each counterparty has its main business activity or assets, unless there is a full risk transfer guarantee in place, in which case we use the guarantor’s country of domicile instead. If our clients have operations in many countries, we use their country of incorporation.
30 June 2016
Sovereign and Supranational
£m
Large Corporate
£m
Financial Institutions
£m Total
£m UK - 15,721 3,334 19,055 Peripheral eurozone 980 413 478 1,871 Rest of Europe 48 1,465 1,506 3,019 US 74 79 1,054 1,207 Rest of world 3,008 185 414 3,607 4,110 17,863 6,786 28,759
31 December 2015 UK - 14,621 3,524 18,145 Peripheral eurozone 789 395 625 1,809 Rest of Europe 872 1,287 1,104 3,263 US - 103 1,101 1,204 Rest of world 2,783 142 611 3,536 4,444 16,548 6,965 27,957
Risk review
Abbey National Treasury Services plc Half Yearly Financial Report 2016 21
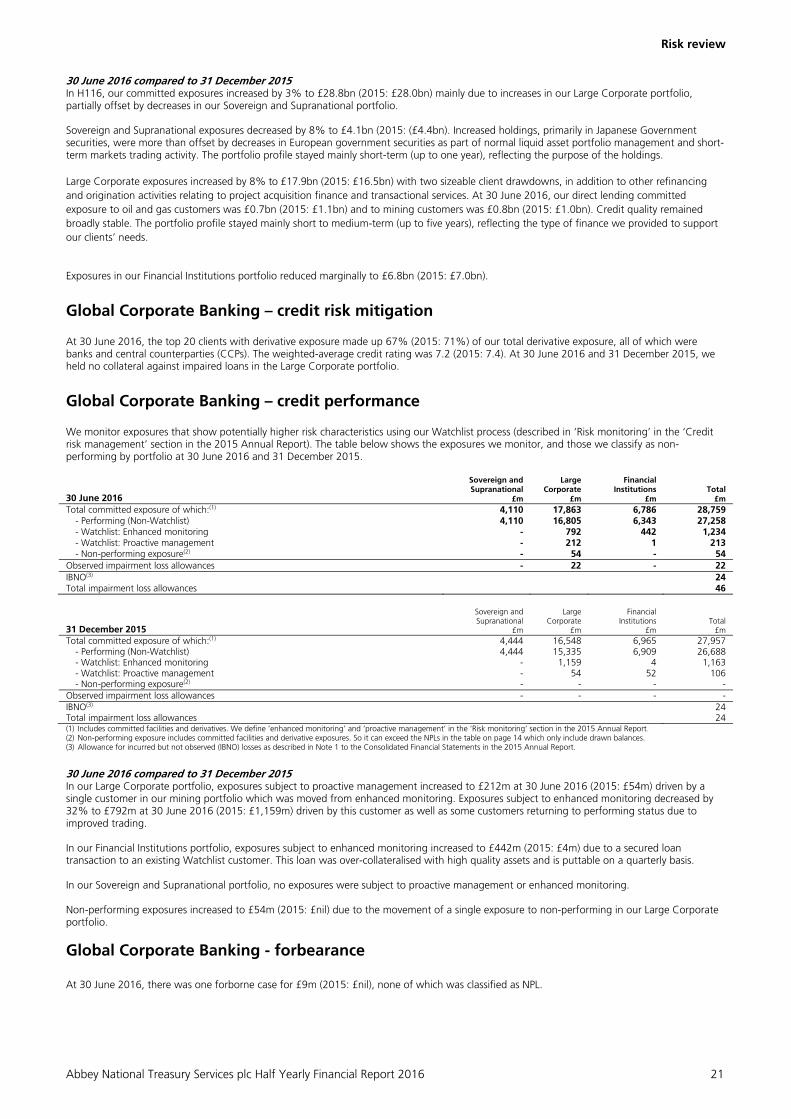
30 June 2016 compared to 31 December 2015 In H116, our committed exposures increased by 3% to £28.8bn (2015: £28.0bn) mainly due to increases in our Large Corporate portfolio, partially offset by decreases in our Sovereign and Supranational portfolio. Sovereign and Supranational exposures decreased by 8% to £4.1bn (2015: (£4.4bn). Increased holdings, primarily in Japanese Government securities, were more than offset by decreases in European government securities as part of normal liquid asset portfolio management and short-term markets trading activity. The portfolio profile stayed mainly short-term (up to one year), reflecting the purpose of the holdings. Large Corporate exposures increased by 8% to £17.9bn (2015: £16.5bn) with two sizeable client drawdowns, in addition to other refinancing and origination activities relating to project acquisition finance and transactional services. At 30 June 2016, our direct lending committed exposure to oil and gas customers was £0.7bn (2015: £1.1bn) and to mining customers was £0.8bn (2015: £1.0bn). Credit quality remained broadly stable. The portfolio profile stayed mainly short to medium-term (up to five years), reflecting the type of finance we provided to support our clients’ needs.
Exposures in our Financial Institutions portfolio reduced marginally to £6.8bn (2015: £7.0bn).
Global Corporate Banking – credit risk mitigation At 30 June 2016, the top 20 clients with derivative exposure made up 67% (2015: 71%) of our total derivative exposure, all of which were banks and central counterparties (CCPs). The weighted-average credit rating was 7.2 (2015: 7.4). At 30 June 2016 and 31 December 2015, we held no collateral against impaired loans in the Large Corporate portfolio.
Global Corporate Banking – credit performance We monitor exposures that show potentially higher risk characteristics using our Watchlist process (described in ‘Risk monitoring’ in the ‘Credit risk management’ section in the 2015 Annual Report). The table below shows the exposures we monitor, and those we classify as non-performing by portfolio at 30 June 2016 and 31 December 2015.
30 June 2016
Sovereign and Supranational
£m
Large Corporate
£m
Financial Institutions
£m Total
£m Total committed exposure of which:(1) 4,110 17,863 6,786 28,759
- Performing (Non-Watchlist) 4,110 16,805 6,343 27,258 - Watchlist: Enhanced monitoring - 792 442 1,234 - Watchlist: Proactive management - 212 1 213 - Non-performing exposure(2) - 54 - 54
Observed impairment loss allowances - 22 - 22 IBNO(3) 24 Total impairment loss allowances 46
31 December 2015
Sovereign and Supranational
£m
Large Corporate
£m
Financial Institutions
£m Total
£m Total committed exposure of which:(1) 4,444 16,548 6,965 27,957
- Performing (Non-Watchlist) 4,444 15,335 6,909 26,688 - Watchlist: Enhanced monitoring - 1,159 4 1,163 - Watchlist: Proactive management - 54 52 106 - Non-performing exposure(2) - - - -
Observed impairment loss allowances - - - - IBNO(3) 24 Total impairment loss allowances 24 (1) Includes committed facilities and derivatives. We define ‘enhanced monitoring’ and ‘proactive management’ in the ‘Risk monitoring‘ section in the 2015 Annual Report. (2) Non-performing exposure includes committed facilities and derivative exposures. So it can exceed the NPLs in the table on page 14 which only include drawn balances. (3) Allowance for incurred but not observed (IBNO) losses as described in Note 1 to the Consolidated Financial Statements in the 2015 Annual Report.
30 June 2016 compared to 31 December 2015 In our Large Corporate portfolio, exposures subject to proactive management increased to £212m at 30 June 2016 (2015: £54m) driven by a single customer in our mining portfolio which was moved from enhanced monitoring. Exposures subject to enhanced monitoring decreased by 32% to £792m at 30 June 2016 (2015: £1,159m) driven by this customer as well as some customers returning to performing status due to improved trading. In our Financial Institutions portfolio, exposures subject to enhanced monitoring increased to £442m (2015: £4m) due to a secured loan transaction to an existing Watchlist customer. This loan was over-collateralised with high quality assets and is puttable on a quarterly basis. In our Sovereign and Supranational portfolio, no exposures were subject to proactive management or enhanced monitoring. Non-performing exposures increased to £54m (2015: £nil) due to the movement of a single exposure to non-performing in our Large Corporate portfolio.
Global Corporate Banking - forbearance At 30 June 2016, there was one forborne case for £9m (2015: £nil), none of which was classified as NPL.
Risk review
22 Abbey National Treasury Services plc Half Yearly Financial Report 2016
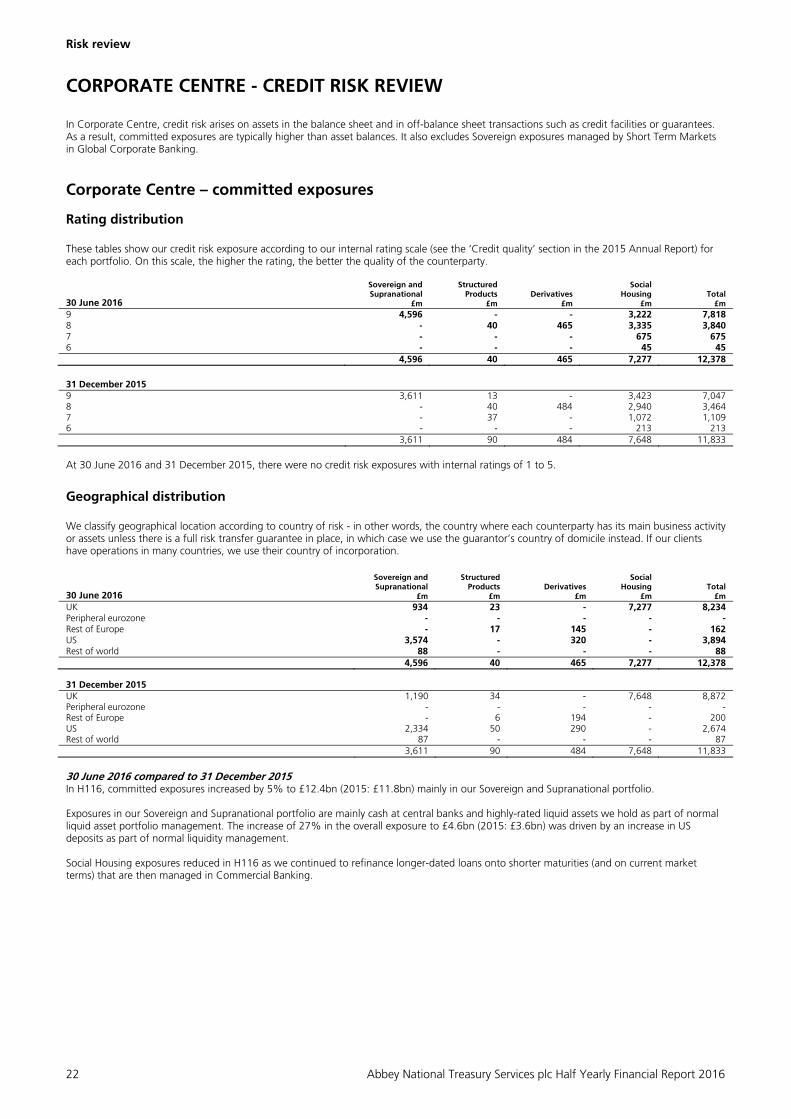
CORPORATE CENTRE - CREDIT RISK REVIEW In Corporate Centre, credit risk arises on assets in the balance sheet and in off-balance sheet transactions such as credit facilities or guarantees. As a result, committed exposures are typically higher than asset balances. It also excludes Sovereign exposures managed by Short Term Markets in Global Corporate Banking.
Corporate Centre – committed exposures Rating distribution These tables show our credit risk exposure according to our internal rating scale (see the ‘Credit quality’ section in the 2015 Annual Report) for each portfolio. On this scale, the higher the rating, the better the quality of the counterparty.
30 June 2016
Sovereign and Supranational
£m
Structured Products
£m Derivatives
£m
Social Housing
£m Total
£m 9 4,596 - - 3,222 7,818 8 - 40 465 3,335 3,840 7 - - - 675 675 6 - - - 45 45 4,596 40 465 7,277 12,378 31 December 2015 9 3,611 13 - 3,423 7,047 8 - 40 484 2,940 3,464 7 - 37 - 1,072 1,109 6 - - - 213 213 3,611 90 484 7,648 11,833 At 30 June 2016 and 31 December 2015, there were no credit risk exposures with internal ratings of 1 to 5.
Geographical distribution
We classify geographical location according to country of risk - in other words, the country where each counterparty has its main business activity or assets unless there is a full risk transfer guarantee in place, in which case we use the guarantor’s country of domicile instead. If our clients have operations in many countries, we use their country of incorporation.
30 June 2016
Sovereign and Supranational
£m
Structured Products
£m Derivatives
£m
Social Housing
£m Total
£m UK 934 23 - 7,277 8,234 Peripheral eurozone - - - - - Rest of Europe - 17 145 - 162 US 3,574 - 320 - 3,894 Rest of world 88 - - - 88 4,596 40 465 7,277 12,378 31 December 2015 UK 1,190 34 - 7,648 8,872 Peripheral eurozone - - - - - Rest of Europe - 6 194 - 200 US 2,334 50 290 - 2,674 Rest of world 87 - - - 87 3,611 90 484 7,648 11,833 30 June 2016 compared to 31 December 2015 In H116, committed exposures increased by 5% to £12.4bn (2015: £11.8bn) mainly in our Sovereign and Supranational portfolio. Exposures in our Sovereign and Supranational portfolio are mainly cash at central banks and highly-rated liquid assets we hold as part of normal liquid asset portfolio management. The increase of 27% in the overall exposure to £4.6bn (2015: £3.6bn) was driven by an increase in US deposits as part of normal liquidity management. Social Housing exposures reduced in H116 as we continued to refinance longer-dated loans onto shorter maturities (and on current market terms) that are then managed in Commercial Banking.

Risk review
Abbey National Treasury Services plc Half Yearly Financial Report 2016 23
Corporate Centre – credit risk mitigation We reduce credit risk in derivatives with netting agreements, collateralisation and the use of CCPs. For details of our approach to credit risk mitigation, see the ‘Global Corporate Banking – credit risk management’ section in the 2015 Annual Report.
Corporate Centre – credit performance We monitor exposures that show potentially higher risk characteristics using our Watchlist process (described in ‘Risk monitoring’ in the ‘Credit risk management’ section in the 2015 Annual Report). The table below shows the exposures we monitor, and those we classify as non-performing by portfolio at 30 June 2016 and 31 December 2015.
30 June 2016
Sovereign and Supranational
£m
Structured Products
£m Derivatives
£m Social Housing
£m Total
£m Total committed exposure of which:(1) 4,596 40 465 7,277 12,378
- Performing (Non-Watchlist) 4,596 40 465 7,099 12,200 - Watchlist: Enhanced monitoring - - - 178 178
31 December 2015 Total committed exposure of which:(1) 3,611 90 484 7,648 11,833
- Performing (Non-Watchlist) 3,611 90 484 7,574 11,759 - Watchlist: Enhanced monitoring - - - 74 74
(1) Includes committed facilities and derivatives. We define ‘enhanced monitoring’ in the ‘Risk monitoring‘ section in the 2015 Annual Report.
At 30 June 2016 and 31 December 2015, there were no impairment loss allowances. 30 June 2016 compared to 31 December 2015 Watchlist exposures increased by £104m to £178m at 30 June 2016 (2015: £74m). The increase was driven by a single Social Housing group added to enhanced monitoring due to governance issues.
Corporate Centre - forbearance At 30 June 2016 and 31 December 2015, there was no forbearance activity in Corporate Centre.

Risk review
24 Abbey National Treasury Services plc Half Yearly Financial Report 2016
MARKET RISK Market risk management In H116, there were no significant changes in the way we manage market risk as described in the 2015 Annual Report. Market risk review We analyse below our key trading and banking market risk metrics.
TRADING MARKET RISK REVIEW
This table shows our Internal VaR for 30 June 2016 and 31 December 2015, as defined in the ‘Trading market risk’ section of the 2015 Annual Report. There are figures for exposure to each of the main classes of risk. And for each period, we show the highest figures, the lowest, the average, and those at the period-end.
The VaR figures show how much the fair values of all our tradeable instruments (like shares or bonds) could have changed. Since trading instruments are recorded at fair value, these are also the amounts by which they could have increased or reduced our income.
Period-end exposure Average exposure Highest exposure Lowest exposure
Trading instruments
30 June 2016
£m
31 December 2015
£m
30 June 2016
£m
31 December 2015
£m
30 June 2016
£m
31 December 2015
£m
30 June 2016
£m
31 December 2015
£m Interest rate risks(1) 2.4 2.0 2.3 2.8 2.9 4.6 1.7 1.7 Equity risks(2) 0.4 0.3 0.4 0.4 1.0 0.9 0.3 0.3 Credit (spread) risks(3) - - - - - 0.2 - - Foreign exchange risks 2.1 0.1 1.0 0.1 2.1 0.1 0.1 - Correlation offsets(4) (2.1) (0.5) (1.2) (0.5) - - - - Total correlated one-day VaR 2.8 1.9 2.5 2.8 3.0 4.5 1.8 1.8
(1) This measures the effect of changes in interest rates and how volatile they are. The effects are on cash instruments, securities and derivatives. This includes swap spread risk (the difference between swap rates and government bond rates), basis risk (changes in interest rate tenor basis) and inflation risk (changes in inflation rates).
(2) This measures the effect of equity prices, volatility and dividends on stock and derivatives. (3) This measures the effect of changes in the credit spread of corporate bonds or credit derivatives. (4) The highest and lowest exposures for each risk type did not necessarily happen on the same day as the highest and lowest total correlated one-day VaR. It is impossible to calculate a
corresponding correlation offset effect, so we have not included it in the table.
BANKING MARKET RISK REVIEW Interest rate risk Yield curve risk The table below shows how the Santander UK group (including ANTS) base case income and valuation would be affected by a 50 basis point parallel shift (both upwards and downwards) applied instantaneously to the yield curve at 30 June 2016 and 31 December 2015. Sensitivity to parallel shifts represents the amount of risk in a way that we think is both simple and scalable. 50 basis points is the stress we typically focus on for banking market risk controls, although we also monitor sensitivities to other parallel shifts.
The movement in NIM sensitivities in H116 was largely due to further margin compression as a result of lower levels of the yield curve and changes in the underlying management assumptions we used for risk measurement purposes. We updated our assumptions to better reflect the continued low rate environment. This was partially offset by an increased volume of net fixed rate assets left unhedged.
We are also taking actions to be prepared for the possibility of negative interest rates in the UK, including a review of our systems and models, and to ensure any potential impact on our customers is appropriately managed.
Basis risk We measure basis risk using various risk measures, including VaR. The VaR measure uses the same VaR methodology as our trading book. The basis risk VaR for the Santander UK group (including ANTS) at 30 June 2016 was £3m (2015: £1m). It reflects our basis risk exposure between the Bank of England Bank Rate (Base Rate), reserve rate linked assets deposited with central banks, the Sterling Overnight Index Average (SONIA) rate and between London Interbank Offered Rates (LIBOR) of different terms. The increase in H116 was largely due to underlying net basis position changes as a result of the continued reduction in SVR mortgages and growth in bank account liability volumes.
Inflation and spread risks The VaR of the portfolios of securities the Santander UK group (including ANTS) held for liquidity and investment purposes at 30 June 2016 was £5m (2015: £3m). The main risk factors remain the inflation and spread risk exposures of these positions. The increase in H116 was due to an increase in spread risk driven by changes in the composition of our bond portfolio as part of normal liquidity management activities and due to an increase in market volatility at the start of H116 and following the EU referendum. We regularly stress test these portfolios against historical and hypothetical scenarios. Using the possible losses we estimate from the stress tests, we establish limits that complement our VaR-based limits. At 30 June 2016, using historic deterministic stress tests, we estimated the worst three month stressed loss for these portfolios to be £286m (2015: £259m). The increase in at 30 June 2016 was due to an increase in spread risk from changes in the composition of our bond portfolio.
30 June 2016 31 December 2015
+50bps
£m -50bps
£m +50bps
£m -50bps
£m
NIM sensitivity 43 (40) 131 39 Economic Value of Equity (EVE) sensitivity 145 (78) 86 (54)
Risk review
Abbey National Treasury Services plc Half Yearly Financial Report 2016 25
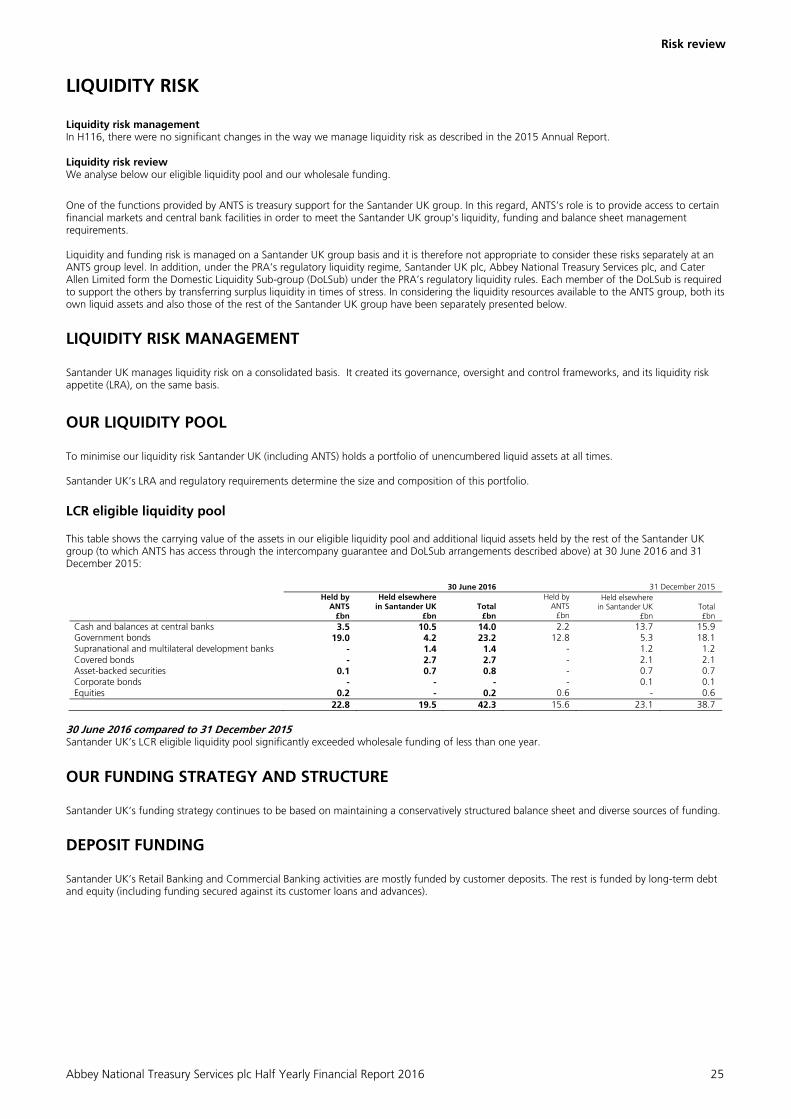
LIQUIDITY RISK Liquidity risk management In H116, there were no significant changes in the way we manage liquidity risk as described in the 2015 Annual Report. Liquidity risk review We analyse below our eligible liquidity pool and our wholesale funding.
One of the functions provided by ANTS is treasury support for the Santander UK group. In this regard, ANTS’s role is to provide access to certain financial markets and central bank facilities in order to meet the Santander UK group's liquidity, funding and balance sheet management requirements. Liquidity and funding risk is managed on a Santander UK group basis and it is therefore not appropriate to consider these risks separately at an ANTS group level. In addition, under the PRA’s regulatory liquidity regime, Santander UK plc, Abbey National Treasury Services plc, and Cater Allen Limited form the Domestic Liquidity Sub-group (DoLSub) under the PRA’s regulatory liquidity rules. Each member of the DoLSub is required to support the others by transferring surplus liquidity in times of stress. In considering the liquidity resources available to the ANTS group, both its own liquid assets and also those of the rest of the Santander UK group have been separately presented below.
LIQUIDITY RISK MANAGEMENT Santander UK manages liquidity risk on a consolidated basis. It created its governance, oversight and control frameworks, and its liquidity risk appetite (LRA), on the same basis.
OUR LIQUIDITY POOL To minimise our liquidity risk Santander UK (including ANTS) holds a portfolio of unencumbered liquid assets at all times. Santander UK’s LRA and regulatory requirements determine the size and composition of this portfolio. LCR eligible liquidity pool
This table shows the carrying value of the assets in our eligible liquidity pool and additional liquid assets held by the rest of the Santander UK group (to which ANTS has access through the intercompany guarantee and DoLSub arrangements described above) at 30 June 2016 and 31 December 2015:
30 June 2016 31 December 2015
Held by ANTS
£bn
Held elsewhere in Santander UK
£bn Total
£bn
Held by ANTS
£bn
Held elsewhere in Santander UK
£bn Total £bn
Cash and balances at central banks 3.5 10.5 14.0 2.2 13.7 15.9 Government bonds 19.0 4.2 23.2 12.8 5.3 18.1 Supranational and multilateral development banks - 1.4 1.4 - 1.2 1.2 Covered bonds - 2.7 2.7 - 2.1 2.1 Asset-backed securities 0.1 0.7 0.8 - 0.7 0.7 Corporate bonds - - - - 0.1 0.1 Equities 0.2 - 0.2 0.6 - 0.6
22.8 19.5 42.3 15.6 23.1 38.7 30 June 2016 compared to 31 December 2015 Santander UK’s LCR eligible liquidity pool significantly exceeded wholesale funding of less than one year.
OUR FUNDING STRATEGY AND STRUCTURE Santander UK’s funding strategy continues to be based on maintaining a conservatively structured balance sheet and diverse sources of funding.
DEPOSIT FUNDING Santander UK’s Retail Banking and Commercial Banking activities are mostly funded by customer deposits. The rest is funded by long-term debt and equity (including funding secured against its customer loans and advances).

Risk review
26 Abbey National Treasury Services plc Half Yearly Financial Report 2016
WHOLESALE FUNDING Composition of wholesale funding 30 June 2016 compared with 31 December 2015 In the first half of the year, Santander UK began repositioning the structure of its funding vehicles in preparation for ring-fencing. On 1 June 2016, Santander UK plc became the issuer of all existing medium-term wholesale securities previously issued by the Company. Specifically, Santander UK plc became the issuer in respect of all Existing Senior Medium Term Wholesale Securities issued by ANTS up to that date. The Existing Senior Medium Term Wholesale Securities comprise €60m Guaranteed Step-Down Fixed / Inverse Floating Rate Notes due 2019 and £166,995,000 Zero Coupon Amortising Guaranteed Notes due 2038. This change is part of the Santander UK group ring-fence planning pursuant to the requirements of the Financial Services (Banking Reform) Act 2013, for which we have commenced realigning the funding structure of the operating companies ANTS and Santander UK plc. Going forward, Santander UK plc will be the issuer under each of the Wholesale Funding Programmes. The Wholesale Funding Programmes comprise the US$30bn Euro Medium Term Note Programme (EMTN), the €35bn Global Covered Bond Programme and the US SEC-Registered Debt Shelf Programme. ANTS does not guarantee the notes transferred to Santander UK plc by ANTS nor will it guarantee the notes issued by Santander UK plc in the future. Except for the covered bonds, which will continue to have the secured guarantee of Abbey Covered Bonds LLP, all notes transferred to Santander UK plc by Abbey National Treasury Services plc and all notes issued by Santander UK plc in the future under these programmes will be the sole liability of Santander UK plc and will not be guaranteed by any other entity. Reconciliation of wholesale funding to the balance sheet This table reconciles our wholesale funding to our balance sheet at 30 June 2016 and 31 December 2015. Balance sheet line item
Funding analysis
Deposits by banks
Trading liabilities
Financial liabilities designated at
fair value Debt securities
in issue 30 June 2016 £bn £bn £bn £bn £bn Deposits by banks (non-customer deposits) 0.6 - 0.6 - - CDs and commercial paper 5.3 - - - 5.3 Senior unsecured - privately placed 1.1 - - 1.1 - Securitisation and structured issuance 1.9 1.9 - - - Total wholesale funding 8.9 1.9 0.6 1.1 5.3 Repos 7.4 0.4 7.0 - - Foreign exchange and hedge accounting (0.1) - - - (0.1) Other 39.0 31.4(1) 7.1(2) 0.5 - Balance sheet total 55.2 33.7 14.7 1.6 5.2 31 December 2015 76.8 21.3 12.7 2.0 40.8
(1) Mainly amounts due to Santander UK subsidiaries and other deposits. See Note 11 to the Condensed Consolidated Interim Financial Statements. (2) Short positions in securities and unsettled trades, cash collateral and short-term deposits. See Note 12 to the Condensed Consolidated Interim Financial Statements. 30 June 2016 compared to 31 December 2015 Together with our parent, Santander UK plc and its parent Santander UK Group Holdings plc, our overall funding strategy remains to develop and sustain a diversified funding base. We also need to fulfil regulatory requirements as well as to support our credit ratings. As in H115, the majority of Santander UK’s new issuance in H116 was in the unsecured markets. H116 presented a challenging market for issuance with macro-economic headlines driving heightened volatility. Oil price fluctuations, weaker equity markets and the EU referendum all contributed to credit spreads drifting wider throughout H116. Authorities however continued to provide support through further rounds of monetary stimulus and maintaining the low interest rate environment. The wholesale funding markets continued to offer us an economically viable source of funding. Taking advantage of the constructive market conditions at the beginning of the year and capitalising on stable windows through H116, we remained active and consequently ahead of our funding requirement.

Risk review
Abbey National Treasury Services plc Half Yearly Financial Report 2016 27
CAPITAL RISK Capital risk management In H116, there were no significant changes to the way we manage capital risk as described in the 2015 Annual Report.
THE SCOPE OF OUR CAPITAL ADEQUACY Regulatory supervision Abbey National Treasury Services plc is incorporated in the UK. For capital purposes, we are subject to prudential supervision by the following regulators: – PRA: as we are a UK authorised banking group – ECB: as we are a member of Banco Santander. The ECB supervises Banco Santander as part of the Single Supervisory Mechanism. Although we (and Santander UK plc and Santander UK Group Holding plc) are part of Banco Santander, we do not have any guarantees from our ultimate parent Banco Santander SA and we operate as an autonomous subsidiary. As we are regulated by the PRA, we have to meet the PRA capital requirements on a standalone basis. We also have to show the PRA that we can withstand capital stress tests without the support of our parent. Reinforcing our corporate governance framework, the PRA exercises oversight through its rules and regulations on the Board and senior management appointments. Our approach to CRD IV We apply Banco Santander SA’s approach to capital measurement and risk management for CRD IV. As a result, Abbey National Treasury Services plc is classified as a significant subsidiary of Banco Santander SA. For more on the CRD IV risk measurement of our exposures, see Banco Santander SA’s Pillar 3 report. 30 June 2016 compared to 31 December 2015 In December 2015, the Financial Policy Committee (FPC) published its view on the calibration of the capital framework for the UK banking system at an end point in 2019. This reflected an aggregate level of Tier 1 equity in the system of 11% RWA, with CET 1 comprising 9.5% of RWAs, plus time-varying elements including the countercyclical buffer. The RWA measures considered for this assessment assumed that the perceived shortcomings of the current RWA measures under CRD IV are corrected. Overall, the FPC expected the UK banking system would only have a little more capital to build, although the required increase could be more significant for some individual banks. The Basel Committee on Banking Supervision (BCBS) is developing revised standards for the calculation of minimum capital requirements and RWAs for market risk, operational risk and credit risk to address perceived shortcomings. In January 2016, the BCBS published the revised market risk framework and is consulting on proposals for significant revisions to the operational risk and credit risk frameworks. It is also considering setting capital floors based on standardised approaches. These revised standards, once written into EU law, could significantly impact the measurement of RWAs over the medium term and have a negative impact on our capital ratios. In addition, the Financial Stability Board finalised proposals on Total Loss Absorbing Capacity (TLAC) in November 2015. These set out the minimum level of loss absorbency required by globally systemic important banks from 2019. They are expected to apply to us as we are a subsidiary of the globally significant Banco Santander. In the EU, loss absorbency requirements have been established under the Bank Recovery and Resolution Directive, under which institutions will be required to maintain an MREL. The Bank of England has consulted on the approach to setting MREL for UK institutions, and it has proposed that MREL requirements could be set at levels equivalent to two times the minimum capital requirements (Pillar 1 minimum plus Pillar 2A) from 2020. It plans to set MREL as necessary to implement the TLAC standard. We will need to ensure that we have enough capital and loss absorbing eligible liabilities to meet this level by the implementation date.
CAPITAL RESOURCES
During H116 and FY15, we held capital over and above our regulatory requirements, and managed internal capital allocations and targets in accordance with our capital and risk management policies. Group capital 30 June 2016
£m 31 December 2015
£m Common Equity Tier 1 (CET 1) capital before regulatory adjustments 3,630 3,649 Regulatory adjustments to CET 1 capital (323) (263) CET 1 capital 3,307 3,386 Total regulatory capital 3,307 3,386
Risk review
28 Abbey National Treasury Services plc Half Yearly Financial Report 2016
OTHER KEY RISKS AND AREAS OF FOCUS
Other key risks In H116, there were no significant changes to the way we manage and monitor other key risks, as described in the 2015 Annual Report, except as set out below.
Areas of focus In this section, we discuss our country risk exposures, and analyse our on and off-balance sheet exposures, with a focus on the eurozone. We show our ‘Balances with other Santander UK group companies’ and ‘Balances with other Banco Santander companies outside the Santander UK group’ separately.
OPERATIONAL RISK
30 June 2016 compared to 31 December 2015
Cyber risk In H116, in common with other large UK financial institutions, we continued to be subject to cyber attack. This included an incident that resulted in a temporary disruption to the service offered via our digital channels and was caused by a denial of service attack, launched by an unknown external third party.
We continued to improve our systems, processes, controls and staff training to reduce cyber risk and enhance our data security. This included adding the key findings from the Bank of England led programme to improve and test resilience to cyber attacks in the financial industry into our cyber security IT systems plan for 2016.
Our Cyber Safe awareness campaign continued across the business, including mandatory training and internal phishing exercises. We continued to improve access controls and monitoring for users who have access to sensitive information.
Operational Risk Transformation Programme We continued to invest in the delivery of our Operational Risk Transformation Programme, which will help us to achieve market best practice in operational risk management.
FINANCIAL CRIME RISK
30 June 2016 compared to 31 December 2015 In H116, as part of our Financial Crime Transformation Programme and our financial crime agenda, we continued to improve our controls, culture and awareness. We: - Further increased the visibility and governance for our accountable executives. We did this in a time of political and media focus, and ahead of
expected changes to the UK’s anti-money laundering and terrorist finance regime - Intensified our work with the UK Home Office, the Joint Money Laundering Intelligence Taskforce and other law enforcement agencies. We
placed a special focus on financial crime policy, which allowed us to give better advice on key emerging geo-political changes - Enhanced our financial crime compliance operating model. We put in place dedicated first line governance and operations, and hired skilled
staff to support a more intelligence led second line approach - Further improved our internal data. As part of this, we introduced key risk indicators to track performance against our financial crime risk
appetite - Continued to invest in our transformation. We improved our screening and monitoring functions. We also enhanced our controls to support
growth plans (such as trade finance) and innovative client propositions, such as using blockchain technology for international payments - Further automated our Suspicious Activity Reporting (SAR) process. This built on positive feedback from the National Crime Agency on the
quality of our SAR submissions and improved our ability to provide high quality data.
MODEL RISK
30 June 2016 compared to 31 December 2015 In H116 we updated our model risk policy to align it to the framework that was approved in 2015. We continued to embed these across the business, and prioritised our focus on models in Finance, as well as key model deployments for IFRS 9, stress testing and valuation methodologies. We are reviewing our models to ensure that we are prepared for the possibility of negative interest rates in the UK. We also introduced an executive model owner role that will enhance the year-end attestation process.
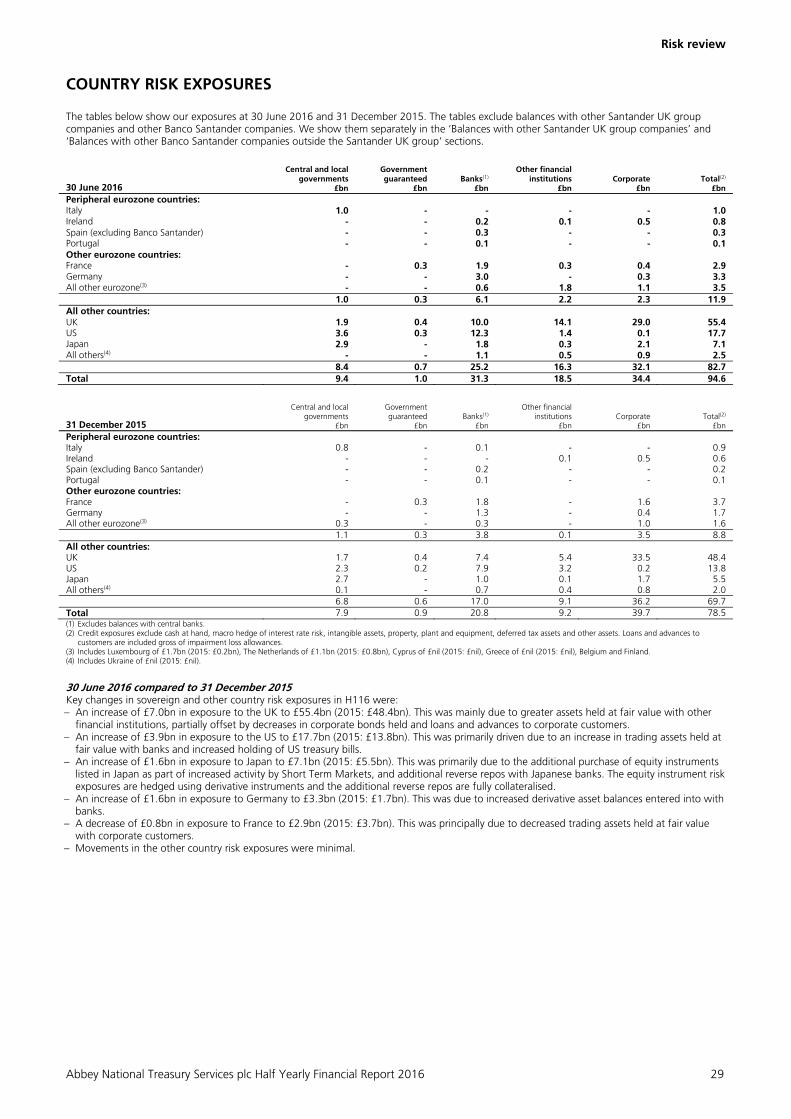
Risk review
Abbey National Treasury Services plc Half Yearly Financial Report 2016 29
COUNTRY RISK EXPOSURES The tables below show our exposures at 30 June 2016 and 31 December 2015. The tables exclude balances with other Santander UK group companies and other Banco Santander companies. We show them separately in the ‘Balances with other Santander UK group companies’ and ‘Balances with other Banco Santander companies outside the Santander UK group’ sections.
30 June 2016
Central and local governments
£bn
Government guaranteed
£bn Banks(1)
£bn
Other financial institutions
£bn
Corporate
£bn
Total(2)
£bn Peripheral eurozone countries: Italy 1.0 - - - - 1.0 Ireland - - 0.2 0.1 0.5 0.8 Spain (excluding Banco Santander) - - 0.3 - - 0.3 Portugal - - 0.1 - - 0.1 Other eurozone countries: France - 0.3 1.9 0.3 0.4 2.9 Germany - - 3.0 - 0.3 3.3 All other eurozone(3) - - 0.6 1.8 1.1 3.5 1.0 0.3 6.1 2.2 2.3 11.9 All other countries: UK 1.9 0.4 10.0 14.1 29.0 55.4 US 3.6 0.3 12.3 1.4 0.1 17.7 Japan 2.9 - 1.8 0.3 2.1 7.1 All others(4) - - 1.1 0.5 0.9 2.5 8.4 0.7 25.2 16.3 32.1 82.7 Total 9.4 1.0 31.3 18.5 34.4 94.6
31 December 2015
Central and local governments
£bn
Government guaranteed
£bn Banks(1)
£bn
Other financial institutions
£bn
Corporate
£bn
Total(2)
£bn Peripheral eurozone countries: Italy 0.8 - 0.1 - - 0.9 Ireland - - - 0.1 0.5 0.6 Spain (excluding Banco Santander) - - 0.2 - - 0.2 Portugal - - 0.1 - - 0.1 Other eurozone countries: France - 0.3 1.8 - 1.6 3.7 Germany - - 1.3 - 0.4 1.7 All other eurozone(3) 0.3 - 0.3 - 1.0 1.6 1.1 0.3 3.8 0.1 3.5 8.8 All other countries: UK 1.7 0.4 7.4 5.4 33.5 48.4 US 2.3 0.2 7.9 3.2 0.2 13.8 Japan 2.7 - 1.0 0.1 1.7 5.5 All others(4) 0.1 - 0.7 0.4 0.8 2.0 6.8 0.6 17.0 9.1 36.2 69.7 Total 7.9 0.9 20.8 9.2 39.7 78.5 (1) Excludes balances with central banks. (2) Credit exposures exclude cash at hand, macro hedge of interest rate risk, intangible assets, property, plant and equipment, deferred tax assets and other assets. Loans and advances to
customers are included gross of impairment loss allowances. (3) Includes Luxembourg of £1.7bn (2015: £0.2bn), The Netherlands of £1.1bn (2015: £0.8bn), Cyprus of £nil (2015: £nil), Greece of £nil (2015: £nil), Belgium and Finland. (4) Includes Ukraine of £nil (2015: £nil).
30 June 2016 compared to 31 December 2015 Key changes in sovereign and other country risk exposures in H116 were: – An increase of £7.0bn in exposure to the UK to £55.4bn (2015: £48.4bn). This was mainly due to greater assets held at fair value with other
financial institutions, partially offset by decreases in corporate bonds held and loans and advances to corporate customers. – An increase of £3.9bn in exposure to the US to £17.7bn (2015: £13.8bn). This was primarily driven due to an increase in trading assets held at
fair value with banks and increased holding of US treasury bills. – An increase of £1.6bn in exposure to Japan to £7.1bn (2015: £5.5bn). This was primarily due to the additional purchase of equity instruments
listed in Japan as part of increased activity by Short Term Markets, and additional reverse repos with Japanese banks. The equity instrument risk exposures are hedged using derivative instruments and the additional reverse repos are fully collateralised.
– An increase of £1.6bn in exposure to Germany to £3.3bn (2015: £1.7bn). This was due to increased derivative asset balances entered into with banks.
– A decrease of £0.8bn in exposure to France to £2.9bn (2015: £3.7bn). This was principally due to decreased trading assets held at fair value with corporate customers.
– Movements in the other country risk exposures were minimal.

Risk review
30 Abbey National Treasury Services plc Half Yearly Financial Report 2016
Redenomination risk We consider the total dissolution of the eurozone to be extremely unlikely. We also believe widespread redenomination of our euro-denominated assets and liabilities is highly improbable, despite the result of the recent referendum in the UK to leave the EU. However, we have analysed the redenomination risk that might arise from an exit of a member state from the euro or a total dissolution of the euro and how that would be implemented. It is not possible to predict what the total financial impact on us might be of this.
Determining which balances would be legally redenominated is complex and depends on a number of factors. These factors include the precise exit scenario. This is because the effects on contracts of a disorderly exit or one sanctioned under EU law may differ. We monitor these risks and have taken steps to mitigate them and/or reduce our overall exposure to losses that might arise in the event of a redenomination. We have done this by reducing our balances and funding mismatches. As part of maintaining a diverse funding base, we raise funding in a number of currencies, including euro, and convert it into sterling through currency swaps to fund our commercial assets which are largely sterling denominated.
Our net asset position denominated in euro, reflecting assets, liabilities and related swaps (which are mainly cross-currency derivatives entered into to swap funding raised in euro into sterling for reasons set out above) in connection with contracts denominated in euro, was net assets of £0.3bn at 30 June 2016 (2015: net assets of £2.1bn). This was debt securities of £0.6bn (2015: £22.5bn) we issued as part of our medium-term funding activities, net loans and advances to other Santander UK group companies of £1.9bn (2015: £18.7bn) (principally representing the on lending of these net funds to other Santander UK group companies), net repo assets of £2.4bn (2015: liabilities of £1.9bn), other deposits of £1.7bn (2015: £13.9bn), other loans and securities of £nil (2015: £4.9bn), and related swap liabilities of £1.7bn (2015: assets of £16.8bn) which swap the euro exposures into sterling to ensure our assets and liabilities are currency matched in sterling.
Our exposures to individual eurozone countries and total exposures to eurozone counterparties, including any euro-denominated contracts, are set out earlier in this section.
Balances with other Santander UK group companies
We enter into transactions with other Santander UK group companies in the ordinary course of business. We provide corporate, wholesale banking and treasury services to the wider Santander UK group, of which we are a significant part. We also provide certain treasury support functions for the Santander UK group. In this regard, our role is to provide access to certain financial markets and central bank facilities in order to meet the Santander UK group's liquidity, funding and balance sheet management requirements. Excluding the Upstream Guarantee, at 30 June 2016 and 31 December 2015 we had gross balances with other Santander UK group companies as follows:
30 June 2016 31 December 2015
Banks £bn
Other financial institutions
£bn Total
£bn Banks
£bn
Other financial institutions
£bn Total £bn
Assets: - UK 12.9 0.6 13.5 22.3 19.0 41.3
12.9 0.6 13.5 22.3 19.0 41.3 Liabilities: - UK 37.0 3.2 40.2 22.7 1.3 24.0
37.0 3.2 40.2 22.7 1.3 24.0
The above balances with other Santander UK group companies at 30 June 2016 and 31 December 2015 mainly arose from ANTS providing treasury support functions for the Santander UK group.
In the first half of the year, Santander UK began repositioning the structure of its funding vehicles in preparation for ring-fencing. On 1 June 2016, Santander UK plc became the issuer of all existing medium-term wholesale securities previously issued by the Company. For more on this, see the Notes to the Condensed Consolidated Interim Financial Statements.
Balances with other Banco Santander companies outside the Santander UK group
We deal with other Banco Santander companies outside the Santander UK group in the ordinary course of business. We do this where we have a particular business advantage or expertise and where they can offer us commercial opportunities. This is done substantially on the same terms as for similar transactions with third parties. These transactions also arise where we support the activities of, or with, larger multinational corporate clients and financial institutions which may deal with other Banco Santander companies. We conduct these activities in a way that manages the credit risk within limits acceptable to the PRA. At 30 June 2016 and 31 December 2015, we had gross balances with other Banco Santander companies outside the Santander UK group as follows:
30 June 2016 31 December 2015
Banks £bn
Other financial institutions
£bn Total
£bn Banks
£bn
Other financial institutions
£bn Total £bn
Assets: - Spain 2.1 - 2.1 1.4 - 1.4 - UK - 0.5 0.5 - 0.5 0.5 - Chile 0.6 - 0.6 0.3 - 0.3 - Other <£100m 0.2 - 0.2 0.3 - 0.3
2.9 0.5 3.4 2.0 0.5 2.5 Liabilities: - Spain 2.6 - 2.6 1.9 - 1.9 - Chile 0.6 - 0.6 0.3 - 0.3 - Other <£100m 0.2 - 0.2 0.2 0.1 0.3
3.4 - 3.4 2.4 0.1 2.5
Governance
Abbey National Treasury Services plc Half Yearly Financial Report 2016 31
BOARD OF DIRECTORS The Directors of Abbey National Treasury Services plc are listed in the 2015 Annual Report. In addition to those listed, Simon Lloyd was appointed Non-Executive Director and Chairman on 11 August 2016 and Juan Garrido Otaola was appointed as an Executive Director and Chief Executive Officer of the Company on 23 May 2016. Biographical details of Simon Lloyd and Juan Garrido Otaola are shown below. Marcelo Castro Zappa resigned as Chief Executive Officer on 23 May 2016 and stepped down as an Executive Director on 27 June 2016.
NON-EXECUTIVE DIRECTORS Simon Lloyd Chairman Timothy ‘Simon’ Lloyd (55) was appointed Chairman of Abbey National Treasury Services plc on 11 August 2016. Simon has extensive experience as a Company Secretary and General Counsel in the financial services industry and is currently the Chief Administration Officer of Santander UK plc. Previously he has occupied the role of Chief People Officer (2008 – 2015) at Santander UK plc and Company Secretary for Alliance & Leicester plc (2003 - 2007). Prior to this, he was Company Secretary and General Counsel at Bristol & West plc (1999 – 2003) and between 1990 and 1999 occupied a number of roles at Lloyds Bank plc, including Head of Legal for UK Retail Banking. Simon worked in legal private practice between 1983 and 1990. In a non-executive capacity, Simon is currently a non-executive director of Milton Keynes University Hospital NHS Foundation Trust (and a member of its Audit and Workforce Committee), and has been Governor of the IFS School of Finance since 2010.
EXECUTIVE DIRECTORS Juan Garrido Otaola Chief Executive Officer Juan Garrido Otaola (45) was appointed as Chief Executive Officer of the Company on 23 May 2016. Juan has extensive experience in financial markets related business in both trading and sales. He was appointed Head of Global Banking and Markets for Banco Santander, Mexico in 2012, with the responsibility of leading an Investment Banking team with a top three footprint in Equity and Debt Capital Markets, Mergers & Acquisitions, Project Finance, Trade Finance and Treasury Products. Prior to this, he headed a variety of departments for Banco Santander in Madrid and London, including Head of Spain Corporate Sales (2005-2008) and later Head of European Corporate Sales (2009-2011). Juan began his career at JP Morgan-Chase in London and Madrid after joining their graduate programme in 1995.
CORPORATE GOVERNANCE DEVELOPMENTS Following the introduction of the Prudential Regulation Authority’s Senior Managers Regime (SMR), effective from 7 March 2016, the Board of the Company established an Audit Committee, a Risk Committee and a Nomination Committee. Each Committee is chaired by Simon Lloyd.
AUDITORS Deloitte LLP stepped down from their office as auditor at the Annual General Meeting on 31 March 2016 and the members appointed PricewaterhouseCoopers LLP from the conclusion of that meeting.
Governance
32 Abbey National Treasury Services plc Half Yearly Financial Report 2016
STATEMENT OF DIRECTORS’ RESPONSIBILITIES The Directors listed below (being all the Directors of Abbey National Treasury Services plc) confirm that to the best of their knowledge these condensed consolidated interim financial statements have been prepared in accordance with International Accounting Standard 34, ‘Interim Financial Reporting’, as adopted by the European Union, and that the half-year management report herein includes a fair review of the information required by Disclosure and Transparency Rules 4.2.7R and 4.2.8R, namely:
- An indication of important events that have occurred during the six months ended 30 June 2016 and their impact on the condensed
consolidated half-year financial statements, and a description of the principal risks and uncertainties for the remaining six months of the financial year, and
- Material related party transactions in the six months ended 30 June 2016 and any material changes in the related party transactions described
in the last Annual Report. Signed on behalf of the Board by Antonio Roman Director 17 August 2016 Abbey National Treasury Services plc Board of Directors: Non-Executive Directors Simon Lloyd Chris Sullivan Executive Directors Juan Garrido Otaola Karim Hajjaji Antonio Roman
Financial statements
Abbey National Treasury Services plc Half Yearly Financial Report 2016 33
34 Independent review report 35 Primary financial statements 35 Condensed Consolidated Income Statement for H116 and H115 35 Condensed Consolidated Statement of Comprehensive Income for H116 and H115 36 Condensed Consolidated Balance Sheet at 30 June 2016 and 31 December 2015 37 Condensed Consolidated Cash Flow Statement for H116 and H115 37 Condensed Consolidated Statement of Changes in Equity for H116 and H115 38 Notes to the financial statements

Financial statements
34 Abbey National Treasury Services plc Half Yearly Financial Report 2016
Independent review report to Abbey National Treasury Services plc
Report on the Condensed Consolidated Interim Financial Statements
Our conclusion We have reviewed the Condensed Consolidated Interim Financial Statements, defined below, in the Half Yearly Financial Report of Abbey National Treasury Services plc for the six month period ended 30 June 2016. Based on our review, nothing has come to our attention that causes us to believe that the Condensed Consolidated Interim Financial Statements are not prepared, in all material respects, in accordance with International Accounting Standard 34, ‘Interim Financial Reporting’, as adopted by the European Union and the Disclosure and Transparency Rules of the United Kingdom’s Financial Conduct Authority. This conclusion is to be read in the context of what we say in the remainder of this report.
What we have reviewed The Condensed Consolidated Interim Financial Statements comprise:
- the Condensed Consolidated Income Statement for the six months ended 30 June 2016;
- the Condensed Consolidated Statement of Comprehensive Income for the six months ended 30 June 2016;
- the Condensed Consolidated Balance Sheet as at 30 June 2016;
- the Condensed Consolidated Cash Flow Statement for the six months ended 30 June 2016;
- the Condensed Consolidated Statement of Changes in Equity for the six months ended 30 June 2016; and
- the explanatory notes to the Condensed Consolidated Interim Financial Statements.
The Condensed Consolidated Interim Financial Statements have been prepared in accordance with International Accounting Standard 34, ‘Interim Financial Reporting’, as adopted by the European Union and the Disclosure and Transparency Rules of the United Kingdom’s Financial Conduct Authority. As disclosed in Note 1 to the Condensed Consolidated Interim Financial Statements, the financial reporting framework that has been applied in the preparation of the full annual financial statements of the Group is applicable law and International Financial Reporting Standards (IFRSs) as adopted by the European Union.
Responsibilities for the Condensed Consolidated Interim Financial Statements and the review
Our responsibilities and those of the directors The Half Yearly Financial Report, including the Condensed Consolidated Interim Financial Statements, are the responsibility of, and have been approved by, the directors. The directors are responsible for preparing the Half Yearly Financial Report in accordance with the Disclosure and Transparency Rules of the United Kingdom’s Financial Conduct Authority. Our responsibility is to express a conclusion on the Condensed Consolidated Interim Financial Statements in the Half Yearly Financial Report based on our review. This report, including the conclusion, has been prepared for and only for the company for the purpose of complying with the Disclosure and Transparency Rules of the United Kingdom’s Financial Conduct Authority and for no other purpose. We do not, in giving this conclusion, accept or assume responsibility for any other purpose or to any other person to whom this report is shown or into whose hands it may come save where expressly agreed by our prior consent in writing.
What a review of the Condensed Consolidated Interim Financial Statements involves We conducted our review in accordance with International Standard on Review Engagements (UK and Ireland) 2410, ‘Review of Interim Financial Information Performed by the Independent Auditor of the Entity’ issued by the Auditing Practices Board for use in the United Kingdom. A review of interim financial information consists of making enquiries, primarily of persons responsible for financial and accounting matters, and applying analytical and other review procedures. A review is substantially less in scope than an audit conducted in accordance with International Standards on Auditing (UK and Ireland) and, consequently, does not enable us to obtain assurance that we would become aware of all significant matters that might be identified in an audit. Accordingly, we do not express an audit opinion. We have read the other information contained in the Half Yearly Financial Report and considered whether it contains any apparent misstatements or material inconsistencies with the information in the Condensed Consolidated Interim Financial Statements. PricewaterhouseCoopers LLP Chartered Accountants London 17 August 2016

Financial statements
Abbey National Treasury Services plc Half Yearly Financial Report 2016 35
Condensed Consolidated Income Statement (unaudited) For the half year to 30 June 2016 and the half year to 30 June 2015
Notes Half year to
30 June 2016 £m
Half year to 30 June 2015
£m
Interest and similar income 678 755 Interest expense and similar charges (572) (578)Net interest income 106 177Net fee and commission income 64 68Net trading and other income 3 71 114Total operating income 241 359Operating expenses before impairment losses, provisions and charges (129) (130)Impairment (losses)/releases on loans and advances 4 (25) 4Total operating impairment (losses)/releases, provisions and charges (25) 4Profit before tax 87 233Tax on profit 5 (27) (48)Profit after tax for the period 60 185 Attributable to: Equity holders of the parent 60 185
Condensed Consolidated Statement of Comprehensive Income (unaudited) For the half year to 30 June 2016 and the half year to 30 June 2015 Half year to
30 June 2016 £m
Half year to 30 June 2015
£m Profit for the period 60 185 Other comprehensive income/(expense): Other comprehensive income that may be reclassified to profit or loss subsequently: Available-for-sale securities - Net gains on available-for-sale securities 11 5- Net losses/(gains) on available-for-sale securities transferred to profit or loss 1 (5)- Tax on above items (2) - 10 -Cash flow hedges - Net gains/(losses) on cash flow hedges 604 (762)- Net (gains)/losses on cash flow hedges transferred to profit or loss (713) 692- Tax on above items 28 14 (81) (56)Exchange differences on translation of foreign operations (2) -Net other comprehensive expense that may be reclassified to profit or loss subsequently (73) (56)Total other comprehensive expense for the period net of tax (73) (56)Total comprehensive (expense)/income for the period (13) 129 Attributable to: Equity holders of the parent
(13) 129
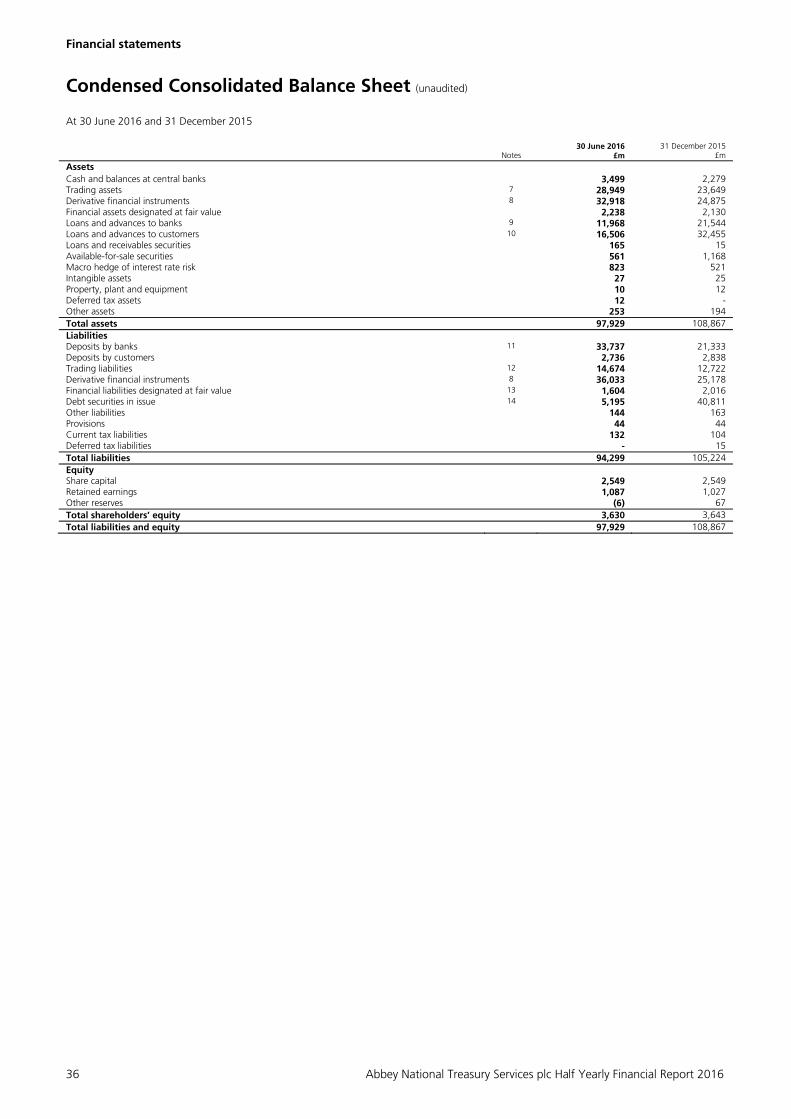
Financial statements
36 Abbey National Treasury Services plc Half Yearly Financial Report 2016
Condensed Consolidated Balance Sheet (unaudited) At 30 June 2016 and 31 December 2015
Notes 30 June 2016
£m 31 December 2015
£m
Assets Cash and balances at central banks 3,499 2,279 Trading assets 7 28,949 23,649Derivative financial instruments 8 32,918 24,875Financial assets designated at fair value 2,238 2,130Loans and advances to banks 9 11,968 21,544Loans and advances to customers 10 16,506 32,455Loans and receivables securities 165 15Available-for-sale securities 561 1,168Macro hedge of interest rate risk 823 521Intangible assets 27 25Property, plant and equipment 10 12Deferred tax assets 12 - Other assets 253 194Total assets 97,929 108,867Liabilities Deposits by banks 11 33,737 21,333Deposits by customers 2,736 2,838Trading liabilities 12 14,674 12,722Derivative financial instruments 8 36,033 25,178Financial liabilities designated at fair value 13 1,604 2,016Debt securities in issue 14 5,195 40,811Other liabilities 144 163 Provisions 44 44 Current tax liabilities 132 104Deferred tax liabilities - 15Total liabilities 94,299 105,224 Equity Share capital 2,549 2,549 Retained earnings 1,087 1,027Other reserves (6) 67Total shareholders’ equity 3,630 3,643Total liabilities and equity 97,929 108,867
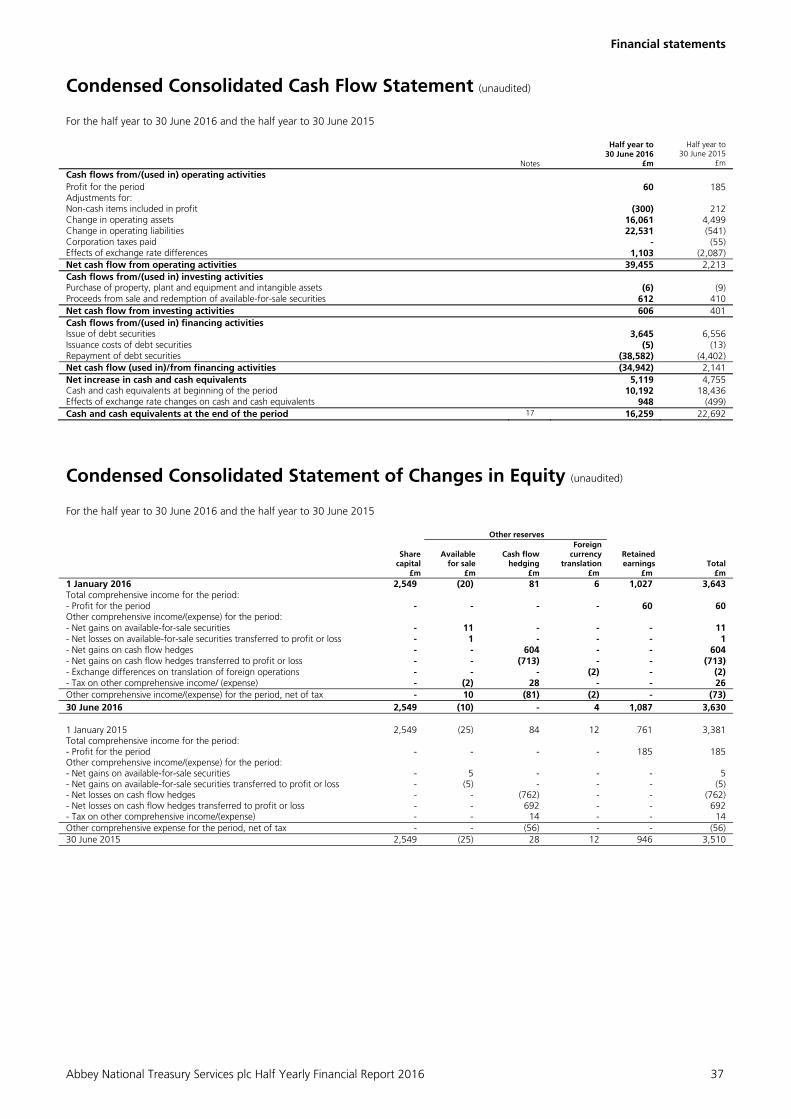
Financial statements
Abbey National Treasury Services plc Half Yearly Financial Report 2016 37
Condensed Consolidated Cash Flow Statement (unaudited) For the half year to 30 June 2016 and the half year to 30 June 2015
Notes
Half year to 30 June 2016
£m
Half year to 30 June 2015
£m
Cash flows from/(used in) operating activities Profit for the period 60 185 Adjustments for: Non-cash items included in profit (300) 212 Change in operating assets 16,061 4,499 Change in operating liabilities 22,531 (541) Corporation taxes paid - (55) Effects of exchange rate differences 1,103 (2,087) Net cash flow from operating activities 39,455 2,213 Cash flows from/(used in) investing activities Purchase of property, plant and equipment and intangible assets (6) (9) Proceeds from sale and redemption of available-for-sale securities 612 410 Net cash flow from investing activities 606 401 Cash flows from/(used in) financing activities Issue of debt securities 3,645 6,556 Issuance costs of debt securities (5) (13) Repayment of debt securities (38,582) (4,402) Net cash flow (used in)/from financing activities (34,942) 2,141 Net increase in cash and cash equivalents 5,119 4,755 Cash and cash equivalents at beginning of the period 10,192 18,436 Effects of exchange rate changes on cash and cash equivalents 948 (499) Cash and cash equivalents at the end of the period 17 16,259 22,692
Condensed Consolidated Statement of Changes in Equity (unaudited) For the half year to 30 June 2016 and the half year to 30 June 2015 Other reserves
Share capital
£m
Available for sale
£m
Cash flow hedging
£m
Foreign currency
translation £m
Retained earnings
£m Total
£m 1 January 2016 2,549 (20) 81 6 1,027 3,643 Total comprehensive income for the period: - Profit for the period - - - - 60 60 Other comprehensive income/(expense) for the period: - Net gains on available-for-sale securities - 11 - - - 11 - Net losses on available-for-sale securities transferred to profit or loss - 1 - - - 1 - Net gains on cash flow hedges - - 604 - - 604 - Net gains on cash flow hedges transferred to profit or loss - - (713) - - (713) - Exchange differences on translation of foreign operations - - - (2) - (2) - Tax on other comprehensive income/ (expense) - (2) 28 - - 26 Other comprehensive income/(expense) for the period, net of tax - 10 (81) (2) - (73) 30 June 2016 2,549 (10) - 4 1,087 3,630 1 January 2015 2,549 (25) 84 12 761 3,381Total comprehensive income for the period: - Profit for the period - - - - 185 185Other comprehensive income/(expense) for the period: - Net gains on available-for-sale securities - 5 - - - 5- Net gains on available-for-sale securities transferred to profit or loss - (5) - - - (5)- Net losses on cash flow hedges - - (762) - - (762)- Net losses on cash flow hedges transferred to profit or loss - - 692 - - 692- Tax on other comprehensive income/(expense) - - 14 - - 14Other comprehensive expense for the period, net of tax - - (56) - - (56)30 June 2015 2,549 (25) 28 12 946 3,510
Financial statements
38 Abbey National Treasury Services plc Half Yearly Financial Report 2016
1. ACCOUNTING POLICIES Basis of preparation The financial information in these Condensed Consolidated Interim Financial Statements does not constitute statutory accounts as defined in section 434 of the UK Companies Act 2006. Statutory accounts for the year ended 31 December 2015 have been delivered to the Registrar of Companies. The auditor’s report on those accounts was unqualified, did not draw attention to any matters by way of emphasis and did not contain a statement under section 498(2) of the UK Companies Act 2006.
The Condensed Consolidated Interim Financial Statements reflect all adjustments that, in the opinion of management, are necessary for a fair presentation of the results of operations for the interim period. All such adjustments to the financial information are of a normal, recurring nature. Because the results from common banking activities are so closely related and responsive to changes in market conditions, the results for any interim period are not necessarily indicative of the results that can be expected for the year.
The Condensed Consolidated Interim Financial Statements have been prepared in accordance with International Accounting Standard (IAS) 34 ‘Interim Financial Reporting’, as issued by the International Accounting Standards Board (IASB) and adopted by the European Union, and the Disclosure and Transparency Rules of the Financial Conduct Authority (FCA). They do not include all the information and disclosures normally required for full annual financial statements and should be read in conjunction with the Consolidated Financial Statements of the ANTS group for the year ended 31 December 2015 which were prepared in accordance with International Financial Reporting Standards as adopted by the European Union. Those Consolidated Financial Statements were also prepared in accordance with International Financial Reporting Standards as issued by the IASB including interpretations issued by the IFRS Interpretations Committee (IFRIC) of the IASB (together IFRS). The ANTS group has also complied with its legal obligation to comply with International Financial Reporting Standards as adopted by the European Union as there are no applicable differences between the two frameworks for the periods presented.
The same accounting policies, presentation and methods of computation are followed in these Condensed Consolidated Interim Financial Statements as were applied in the presentation of the ANTS group’s 2015 Annual Report. Copies of the ANTS group’s 2015 Annual Report are available on the Santander UK group’s website or upon request from Investor Relations, Santander UK plc, 2 Triton Square, Regent’s Place, London NW1 3AN. Future accounting developments The ANTS group has not yet adopted the following significant new or revised standards and interpretations, and amendments thereto, which have been issued but which are not yet effective for the ANTS group:
a) IFRS 9 ‘Financial Instruments’ (IFRS 9) – In July 2014, the IASB issued the final version of IFRS 9 which replaces IAS 39 ‘Financial Instruments: Recognition and Measurement’. The key areas of the standard are discussed below.
Classification and measurement of financial assets and financial liabilities. Under IFRS 9, financial assets are classified on the basis of the business model within which they are held and their contractual cash flow characteristics. These factors determine whether the financial assets are measured at amortised cost, fair value through other comprehensive income or fair value through profit or loss. For many financial assets, the classification and measurement outcomes will be similar to IAS 39. However, under IFRS 9, embedded derivatives are not separated from host financial assets and equity securities are measured at fair value either through profit or loss or, in certain circumstances, an irrevocable election may be made to present fair value movements in other comprehensive income. The requirements for the classification and measurement of financial liabilities were carried forward unchanged from IAS 39, however, the requirements relating to the fair value option for financial liabilities were changed to address own credit risk and, in particular, the presentation of gains and losses within other comprehensive income. Based on the analysis performed to date, Santander UK generally expects: - The vast majority of financial assets which are classified as loans and receivables under IAS 39 will be continue to be measured at
amortised cost under IFRS 9; - Most debt securities classified as available-for-sale financial assets will be measured at amortised cost or fair value through other
comprehensive income, with some being measured at fair value through profit or loss; and - Treasury and other eligible bills classified as available-for-sale financial assets will be measured at amortised cost or fair value
through other comprehensive income depending upon the business model in which they are held. Impairment. IFRS 9 makes fundamental changes to the impairment of financial assets measured at amortised cost or at fair value through other comprehensive income, lease receivables and certain commitments to extend credit and financial guarantee contracts. It is no longer necessary for a credit event to have occurred before credit losses are recognised. Instead, under IFRS 9, an entity always accounts for expected credit losses (ECLs), and any changes in those ECLs. IFRS 9 introduces a number of new concepts and changes to the approach to provisioning. The main features are set out below: - ECLs are based on an assessment of the probability of default, loss given default and exposure at default, discounted to give a
net present value. The estimation of ECL should be unbiased and probability-weighted, taking into account all reasonable and supportable information, including forward looking economic assumptions and a range of possible outcomes.
- On initial recognition, and for financial assets where there has not been a significant increase in credit risk since the initial recognition date, IFRS 9 provisions will be made for expected credit default events within the next 12 months.
- Where there has been a significant increase in credit risk since the initial recognition date, provisions will be made for those assets expected to default at any point over their lifetime reflecting the asset’s full expected loss.
- For assets where there is evidence of credit impairment, provisions will be made under IFRS 9 on the basis of lifetime expected credit losses.
Financial statements
Abbey National Treasury Services plc Half Yearly Financial Report 2016 39
Hedge accounting. The general hedge accounting requirements align hedge accounting more closely with risk management practices and establish a more principle-based approach to hedge accounting thereby allowing hedge accounting to be applied to a wider variety of hedging instruments and risks. Macro hedge accounting is being dealt with as a separate project. Until such time as that project is complete, and to remove any potential conflict between any existing macro hedge accounting undertaken under IAS 39 and the new general hedge accounting requirements of IFRS 9, entities can choose to continue to apply the existing hedge accounting requirements in IAS 39. Based on the analysis performed to date, ANTS expects to continue IAS 39 hedge accounting. No changes are currently being implemented to hedge accounting policies and practices.
Transition. The effective date of IFRS 9 is 1 January 2018. The classification and measurement and impairment requirements are applied retrospectively by adjusting the opening balance sheet at the date of initial application. There is no requirement to restate comparative information. For annual periods beginning before 1 January 2018, an entity may elect to early apply only the requirements for the presentation of gains and losses on financial liabilities designated at fair value through profit or loss. At the date of publication of these Condensed Consolidated Interim Financial Statements the standard is awaiting EU endorsement. EU endorsement is expected later in 2016. ANTS intends to revise the presentation of fair value gains and losses relating to its own credit risk on certain liabilities as soon as IFRS 9 has been endorsed and is able to be applied. ANTS is currently assessing the impact that the financial asset classification and impairment requirements will have. While it is expected that the measurement basis for the majority of financial assets will be unchanged upon applying IFRS 9, it is not yet practicable to quantify the effect of IFRS 9 on these Condensed Consolidated Interim Financial Statements.
b) IFRS 15 ‘Revenue from Contracts with Customers’ (IFRS 15) – In May 2014, the IASB issued IFRS 15. The effective date of IFRS 15 is 1 January 2018. The standard establishes the principles that shall be applied in connection with revenue from contracts with customers including the core principle that the recognition of revenue must depict the transfer of promised goods or services to customers in an amount that reflects the entitlement to consideration in exchange for those goods and services. IFRS 15 applies to all contracts with customers but does not apply to lease contracts, insurance contracts, financial instruments and certain non-monetary exchanges. At the date of publication of these Condensed Consolidated Interim Financial Statements the standard is awaiting EU endorsement. Whilst it is expected that a significant proportion of the ANTS group’s revenue will be outside the scope of IFRS 15, the impact of the standard is currently being assessed. It is not yet practicable to quantify the effect of IFRS 15 on these Condensed Consolidated Interim Financial Statements.
c) IFRS 16 ‘Leases’ (IFRS 16) – In January 2016, the IASB issued IFRS 16. The standard is effective for annual periods beginning on or after 1 January 2019. Earlier adoption is permitted for entities that apply IFRS 15 at or before the date of initial application of IFRS 16. IFRS 16 sets out the principles for the recognition, measurement, presentation and disclosure for both lessees and lessors. For lessee accounting, IFRS 16 introduces a single lessee accounting model and requires a lessee to recognise a right-of-use asset representing its right to use the underlying leased asset and a lease liability representing its obligation to make lease payments for all leases with a term of more than 12 months, unless the underlying asset is of low value. For lessor accounting, IFRS 16 substantially carries forward the lessor accounting requirements from the existing leasing standard (IAS 17) and a lessor continues to classify its leases as operating leases or finance leases and to account for those two types of leases differently. At the date of publication of these Condensed Consolidated Interim Financial Statements the standard is awaiting EU endorsement. The impact of the standard is currently being assessed, however, it is not yet practicable to quantify the effect of IFRS 16 on these Condensed Consolidated Interim Financial Statements.
Going concern The ANTS group’s objectives, policies and processes for managing its capital are described in Note 40 to the Consolidated Financial Statements in the 2015 Annual Report. Details of the ANTS group’s financial risk management objectives, its financial instruments and hedging activities; and its exposures to credit risk, interest rate risk, liquidity risk, operational risk and other risks are set out in the Risk review on pages 12 to 30.
The ANTS group is reliant on Santander UK plc and other companies in the Santander UK group of companies for a proportion of its funding. The Santander UK Board has confirmed that Santander UK plc is a going concern, and that it will provide funding to the ANTS group for the foreseeable future. In giving this commitment to provide funding to the ANTS group, the Santander UK Board has considered the uncertainties that affect the ANTS group when preparing the forecasts and budgets of the combined business of Santander UK.
The Company guarantees any unsubordinated liabilities of Santander UK plc, which are not debt securities, incurred prior to 30 June 2017 under a deed poll guarantee entered into by the Company on 5 June 2015, as amended (the Upstream Guarantee). Santander UK plc guarantees all the unsubordinated liabilities of the Company incurred prior to 30 June 2017 (the Downstream Guarantee).
The Company, Santander UK plc, and Cater Allen Limited, which are the three PRA-regulated entities within the Santander UK group, are party to a capital support deed dated 23 December 2015 (the Capital Support Deed) with certain other non-regulated subsidiaries of Santander UK plc and Santander UK Group Holdings plc. The parties to the Capital Support Deed constitute a core UK group as defined in the PRA Rulebook. Exposures of each of the three regulated entities to other members of the core UK group are exempt from large exposure limits that would otherwise apply. The purpose of the Capital Support Deed is to facilitate the prompt transfer of available capital resources from, or repayment of liabilities by, the non-regulated parties to any of the regulated parties in the event that one of the regulated parties has breached or is at risk of breaching its capital resources requirements or risk concentrations requirements. The core UK group permission expires on 31 December 2018.
The Company, Santander UK plc, and Cater Allen Limited form the Domestic Liquidity Sub-group (DoLSub) under the PRA’s regulatory liquidity rules. Each member of the DoLSub is required to support the others by transferring surplus liquidity in times of stress. The same arrangement existed before October 2015 under the Defined Liquidity Group rules of the PRA in place until that date.
After making enquiries, the Directors have a reasonable expectation that the ANTS group has adequate resources to continue in operational existence for at least twelve months from the date that the balance sheet is signed. For this reason, they continue to adopt the ‘going concern’ basis of accounting for preparing the Condensed Consolidated Interim Financial Statements.
Critical accounting policies and areas of significant management judgement The preparation of the Condensed Consolidated Interim Financial Statements requires management to make estimates and judgements that affect the reported amount of assets and liabilities at the date of the Condensed Consolidated Interim Financial Statements and the reported amount of income and expenses during the reporting period. Management evaluates its estimates and judgements on an ongoing basis. Management bases its estimates and judgements on historical experience and on various other factors that are believed to be reasonable under the circumstances. Actual results may differ from these estimates under different assumptions or conditions.
There have been no significant changes in the basis upon which estimates have been determined, compared to that applied in the 2015 Annual Report.
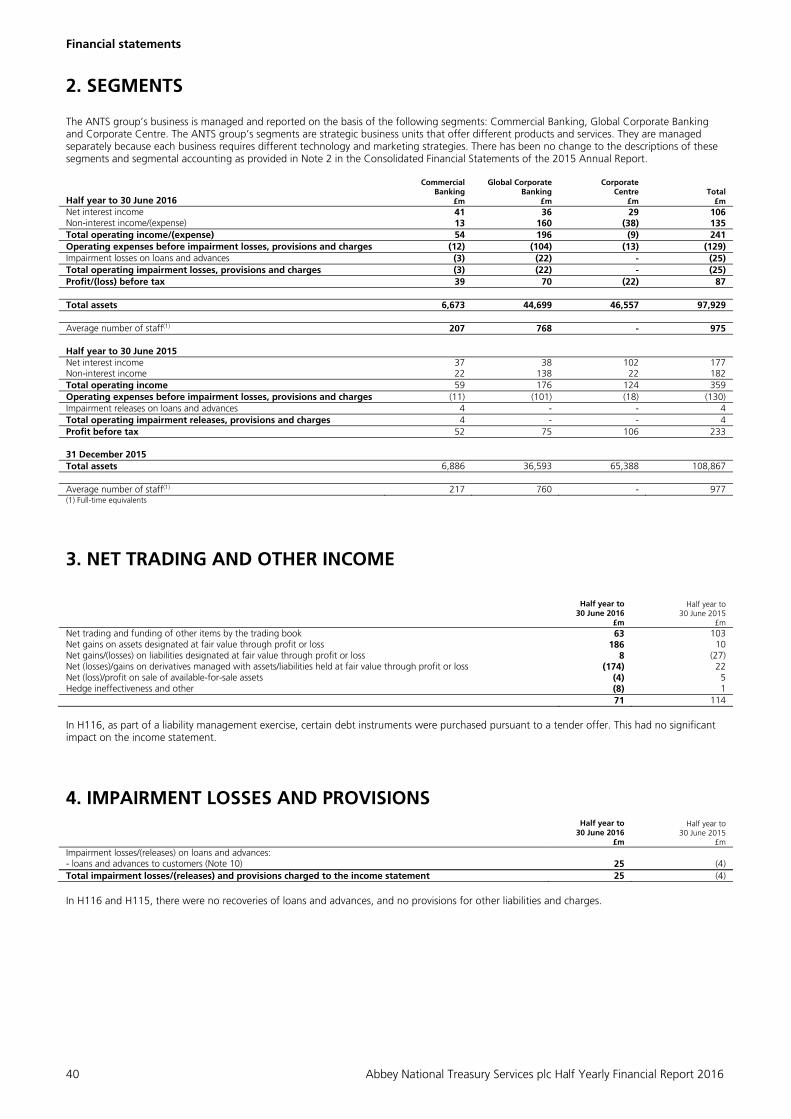
Financial statements
40 Abbey National Treasury Services plc Half Yearly Financial Report 2016
2. SEGMENTS The ANTS group’s business is managed and reported on the basis of the following segments: Commercial Banking, Global Corporate Banking and Corporate Centre. The ANTS group’s segments are strategic business units that offer different products and services. They are managed separately because each business requires different technology and marketing strategies. There has been no change to the descriptions of these segments and segmental accounting as provided in Note 2 in the Consolidated Financial Statements of the 2015 Annual Report.
Half year to 30 June 2016
Commercial Banking
£m
Global Corporate Banking
£m
Corporate Centre
£m Total
£m Net interest income 41 36 29 106 Non-interest income/(expense) 13 160 (38) 135 Total operating income/(expense) 54 196 (9) 241 Operating expenses before impairment losses, provisions and charges (12) (104) (13) (129) Impairment losses on loans and advances (3) (22) - (25) Total operating impairment losses, provisions and charges (3) (22) - (25) Profit/(loss) before tax 39 70 (22) 87 Total assets 6,673 44,699 46,557 97,929 Average number of staff(1) 207 768 - 975 Half year to 30 June 2015 Net interest income 37 38 102 177 Non-interest income 22 138 22 182 Total operating income 59 176 124 359 Operating expenses before impairment losses, provisions and charges (11) (101) (18) (130) Impairment releases on loans and advances 4 - - 4 Total operating impairment releases, provisions and charges 4 - - 4 Profit before tax 52 75 106 233 31 December 2015 Total assets 6,886 36,593 65,388 108,867 Average number of staff(1) 217 760 - 977(1) Full-time equivalents 3. NET TRADING AND OTHER INCOME
Half year to
30 June 2016 £m
Half year to 30 June 2015
£m Net trading and funding of other items by the trading book 63 103Net gains on assets designated at fair value through profit or loss 186 10Net gains/(losses) on liabilities designated at fair value through profit or loss 8 (27)Net (losses)/gains on derivatives managed with assets/liabilities held at fair value through profit or loss (174) 22Net (loss)/profit on sale of available-for-sale assets (4) 5Hedge ineffectiveness and other (8) 1 71 114 In H116, as part of a liability management exercise, certain debt instruments were purchased pursuant to a tender offer. This had no significant impact on the income statement.
4. IMPAIRMENT LOSSES AND PROVISIONS Half year to
30 June 2016 £m
Half year to 30 June 2015
£m Impairment losses/(releases) on loans and advances: - loans and advances to customers (Note 10) 25 (4)Total impairment losses/(releases) and provisions charged to the income statement 25 (4) In H116 and H115, there were no recoveries of loans and advances, and no provisions for other liabilities and charges.
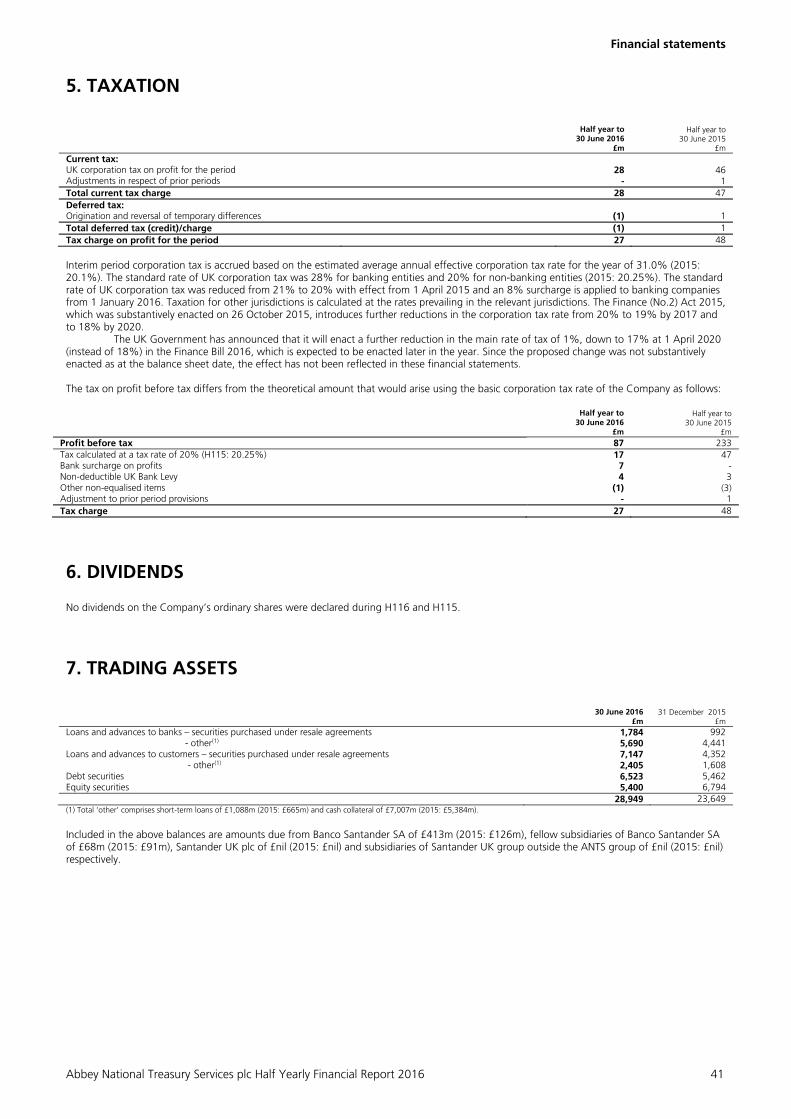
Financial statements
Abbey National Treasury Services plc Half Yearly Financial Report 2016 41
5. TAXATION Half year to
30 June 2016 £m
Half year to 30 June 2015
£m Current tax: UK corporation tax on profit for the period 28 46 Adjustments in respect of prior periods - 1 Total current tax charge 28 47 Deferred tax: Origination and reversal of temporary differences (1) 1 Total deferred tax (credit)/charge (1) 1 Tax charge on profit for the period 27 48 Interim period corporation tax is accrued based on the estimated average annual effective corporation tax rate for the year of 31.0% (2015: 20.1%). The standard rate of UK corporation tax was 28% for banking entities and 20% for non-banking entities (2015: 20.25%). The standard rate of UK corporation tax was reduced from 21% to 20% with effect from 1 April 2015 and an 8% surcharge is applied to banking companies from 1 January 2016. Taxation for other jurisdictions is calculated at the rates prevailing in the relevant jurisdictions. The Finance (No.2) Act 2015, which was substantively enacted on 26 October 2015, introduces further reductions in the corporation tax rate from 20% to 19% by 2017 and to 18% by 2020.
The UK Government has announced that it will enact a further reduction in the main rate of tax of 1%, down to 17% at 1 April 2020 (instead of 18%) in the Finance Bill 2016, which is expected to be enacted later in the year. Since the proposed change was not substantively enacted as at the balance sheet date, the effect has not been reflected in these financial statements. The tax on profit before tax differs from the theoretical amount that would arise using the basic corporation tax rate of the Company as follows:
Half year to 30 June 2016
£m
Half year to 30 June 2015
£m Profit before tax 87 233Tax calculated at a tax rate of 20% (H115: 20.25%) 17 47Bank surcharge on profits 7 - Non-deductible UK Bank Levy 4 3Other non-equalised items (1) (3)Adjustment to prior period provisions - 1Tax charge 27 48
6. DIVIDENDS No dividends on the Company’s ordinary shares were declared during H116 and H115.
7. TRADING ASSETS 30 June 2016
£m 31 December 2015
£m Loans and advances to banks – securities purchased under resale agreements 1,784 992 - other(1) 5,690 4,441 Loans and advances to customers – securities purchased under resale agreements 7,147 4,352 - other(1) 2,405 1,608 Debt securities 6,523 5,462 Equity securities 5,400 6,794 28,949 23,649 (1) Total ‘other’ comprises short-term loans of £1,088m (2015: £665m) and cash collateral of £7,007m (2015: £5,384m). Included in the above balances are amounts due from Banco Santander SA of £413m (2015: £126m), fellow subsidiaries of Banco Santander SA of £68m (2015: £91m), Santander UK plc of £nil (2015: £nil) and subsidiaries of Santander UK group outside the ANTS group of £nil (2015: £nil) respectively.

Financial statements
42 Abbey National Treasury Services plc Half Yearly Financial Report 2016
8. DERIVATIVE FINANCIAL INSTRUMENTS 30 June 2016 31 December 2015
Fair value Fair value
Derivatives held for trading Notional amount
£m Assets
£m Liabilities
£m Notional amount
£m Assets
£m Liabilities
£m Exchange rate contracts 222,648 9,803 12,972 188,606 6,770 7,111 Interest rate contracts 1,092,378 21,838 20,415 929,449 15,735 15,044 Equity and credit contracts 37,938 1,186 1,539 38,484 1,706 1,668 1,352,964 32,827 34,926 1,156,539 24,211 23,823 Derivatives held for hedging
Derivatives designated as fair value hedges: Exchange rate contracts - - - 2,402 115 11 Interest rate contracts 4,839 91 1,107 8,207 109 736 4,839 91 1,107 10,609 224 747 Derivatives designated as cash flow hedges: Exchange rate contracts - - - 12,427 361 570 Interest rate contracts - - - 4,402 79 38 - - - 16,829 440 608 4,839 91 1,107 27,438 664 1,355 Total derivatives 1,357,803 32,918 36,033 1,183,977 24,875 25,178 Included in the above balances are amounts due from Banco Santander SA of £1,701m (2015: £1,288m), fellow subsidiaries of Banco Santander SA of £762m (2015: £458m), Santander UK plc of £3,619m (2015: £2,877m), and subsidiaries of Santander UK group outside the ANTS group of £484m (2015: £1,645m) respectively and amounts due to Banco Santander SA of £2,137m (2015: £1,487m), fellow subsidiaries of Banco Santander SA of £574m (2015: £427m), Santander UK plc of £6,202m (2015: £3,093m) and subsidiaries of the Santander UK group outside the ANTS group of £2,356m (2015: £792m). The net exposures after collateral to the ultimate parent undertaking and fellow subsidiaries at 30 June 2016 amounted to £nil (2015: £nil) and £nil (2015: £nil) respectively, with collateral held exceeding the net position.
Derivative assets and liabilities are reported on a gross basis on the balance sheet unless there is a legally enforceable right to set off the recognised amounts and there is an intention to settle on a net basis, or to realise the assets and settle the liabilities simultaneously.
9. LOANS AND ADVANCES TO BANKS
30 June 2016 £m
31 December 2015 £m
Placements with other banks - securities purchased under resale agreements 1,332 1,247 - other 1,388 949
Amounts due from Banco Santander - other 2 8 Amounts due from Santander UK group undertakings - securities purchased under resale agreements 2,211 2,321
- other 7,035 17,019 11,968 21,544 The decrease was mainly due to the netting and settlement of intercompany balances following the transfer of the issuer on a number of funding programmes from the Company to Santander UK plc, as described in Notes 13 and 14, as Santander UK began repositioning the structure of its funding vehicles in preparation for Banking Reform.
10. LOANS AND ADVANCES TO CUSTOMERS
30 June 2016 £m
31 December 2015 £m
Amounts due from Santander UK group undertakings 102 17,432 Amounts due from Banco Santander SA group subsidiaries and joint ventures 498 508 Other loans and advances 15,994 14,578 Loans and advances to customers 16,594 32,518 Less: impairment loss allowances (88) (63) Loans and advances to customers, net of impairment loss allowances 16,506 32,455
Movement in impairment loss allowances:
30 June 2016 31 December 2015 £m £m At 1 January 63 76 Charge/(release) to the income statement 25 (5) Write offs and other items - (8) At 30 June/ 31 December 88 63 The decrease was mainly driven by lower intercompany balances with Abbey Covered Bonds LLP following the transfer of the issuer on the €35bn Global Covered Bond Programme from the Company to Santander UK plc, as described in Notes 13 and 14.
Financial statements
Abbey National Treasury Services plc Half Yearly Financial Report 2016 43
11. DEPOSITS BY BANKS 30 June 2016
£m 31 December 2015
£m Amounts due to Santander UK subsidiaries 30,771 17,856 Securities sold under repurchase agreements 1,946 2,321 Amounts due to Banco Santander SA - securities sold under repurchase agreements 377 309 - other - 11 Deposits held as collateral 3 2 Other deposits 640 834 33,737 21,333
With effect on and from 1 June 2016, Santander UK plc was substituted in place of Abbey National Treasury Services plc as principal obligor under the euro 35bn Global Covered Bond Programme and the US$30bn Euro Medium Term Note Programme, as described in Notes 13 and 14. The consideration for this substitution was an increase in intercompany funding from Santander UK plc. 12. TRADING LIABILITIES 30 June 2016
£m 31 December 2015
£m
Deposits by banks - securities sold under repurchase agreements 345 1,148 - other(1) 3,586 1,629 Deposits by customers - securities sold under repurchase agreements 6,689 6,510 - other(1) 1,247 641 Short positions in securities and unsettled trades 2,807 2,794 14,674 12,722 (1) Comprises cash collateral of £3,847m (2015: £1,559m) and short-term deposits of £986m (2015: £711m).
Included in the above balances are amounts due to Banco Santander SA of £nil (2015: £nil), fellow subsidiaries of Banco Santander SA of £243m (2015: £126m), Santander UK plc of £nil (2015: £nil) and subsidiaries of Santander UK group outside the ANTS group of £nil (2015: £nil) respectively.
13. FINANCIAL LIABILITIES DESIGNATED AT FAIR VALUE
30 June 2016 £m
31 December 2015 £m
Debt securities in issue 1,596 2,006 Warrants programme 8 10 1,604 2,016 Details of the ANTS group’s debt and warrants programmes are set out in Note 27 to the Consolidated Financial Statements in the 2015 Annual Report. With effect on and from 1 June 2016 Santander UK plc was substituted in place of Abbey National Treasury Services plc as principal obligor under the US$30bn Euro Medium Term Note Programme. This substitution was effected pursuant to a deed of substitution dated 26 April 2016. On and from 1 June 2016, notes issued under the US$30bn Euro Medium Term Note Programme are the sole liability of Santander UK plc and are not guaranteed by any other entity in the Santander UK group. Santander UK plc also became the issuer for the following standalone securities: the Euro 60m Guaranteed Step-Down Fixed/ Inverse Floating Rate Notes due 2019, and the £166,995,000 Zero Coupon Amortising Guaranteed Notes due 2038. These steps were taken as Santander UK began repositioning the structure of its funding vehicles in preparation for Banking Reform.
Included in the above balances are amounts due to Banco Santander SA of £28m (2015: £25m) to fellow subsidiaries of Banco Santander SA of £nil (2015: £nil), Santander UK plc £nil (2015: £nil) and subsidiaries of the Santander UK group outside the ANTS group of £nil (2015: £nil).
Gains and losses arising from changes in the credit spread of liabilities issued by the ANTS group reverse over the contractual life of the debt, provided that the debt is not repaid at a premium or a discount. The net loss during the period attributable to changes in the ANTS group’s own credit risk on the above debt securities in issue was £2m (H115: net gain of £20m). The cumulative net gain attributable to changes in the ANTS group’s own credit risk on the above debt securities in issue at 30 June 2016 was £14m (2015: cumulative net gain of £16m).
At 30 June 2016, the amount that would be required to be contractually paid at maturity of the debt securities in issue above was £91m (2015: £162m) higher than the carrying value.

Financial statements
44 Abbey National Treasury Services plc Half Yearly Financial Report 2016
14. DEBT SECURITIES IN ISSUE 30 June 2016
£m 31 December 2015
£m Bonds and medium term notes 5,195 40,811 Details of the ANTS group’s debt and certificates of deposits programmes are set out in Note 28 to the Consolidated Financial Statements in the 2015 Annual Report.
With effect on and from 1 June 2016, Santander UK plc was substituted in place of Abbey National Treasury Services plc as principal obligor under the euro 35bn Global Covered Bond Programme, US SEC registered debt shelf and the US$30bn Euro Medium Term Note Programme. This substitution was effected pursuant to a deed of substitution, novation and amendment dated 26 April 2016. On and from 1 June 2016, the Covered Bonds continue to be guaranteed, in respect of payments of interest and principal, by Abbey Covered Bonds LLP, but are not guaranteed by any other entity in the Santander UK group. On and from 1 June 2016, notes issued under the US$30bn Euro Medium Term Note Programme are the sole liability of Santander UK plc and are not guaranteed by any other entity in the Santander UK group. These steps were taken as Santander UK began repositioning the structure of its funding vehicles in preparation for Banking Reform.
Included in the above balances are amounts due to Banco Santander SA of £9m (2015: £57m), fellow subsidiaries of Banco Santander SA of £nil (2015: £60m), Santander UK plc of £nil (2015: £1,720m) and subsidiaries of Santander UK outside the ANTS group of £nil (2015: £nil) respectively.
15. RETIREMENT BENEFIT PLANS The ANTS group participates in various Santander UK defined benefit and defined contribution pension schemes in operation. Details of each scheme required by IAS 19 are disclosed in Note 34 in the 2015 Annual Report of Santander UK plc. There is no contractual agreement of stated policy for charging the net defined benefit cost of the Santander UK defined benefit schemes. Therefore, in accordance with IAS 19, the defined benefit asset or liability has been recognised in the financial statements of the sponsoring employer of the scheme and the ANTS group accounts for its contributions as a defined contribution scheme. The contribution to be paid by the ANTS group is calculated as the contributions made by Santander UK plc to the schemes in respect of the ANTS group’s employees. For H116, an expense of £0.7m (H115: £0.8m) was recognised for these contributions and is included in staff costs within administration expenses in the income statement.
16. CONTINGENT LIABILITIES AND COMMITMENTS 30 June 2016
£m 31 December 2015
£m Guarantees given on behalf of the Company’s immediate UK parent, fellow subsidiaries and subsidiaries 212,580 170,261 Guarantees given to third parties 305 313 Formal standby facilities, credit lines and other commitments 14,327 14,010 227,212 184,584
Guarantees given on behalf of the Company’s immediate UK parent, fellow subsidiaries and subsidiaries increased due to the transfer of the issuer on a number of funding programmes from the Company to Santander UK plc, as Santander UK began repositioning the structure of its funding vehicles in preparation for Banking Reform.
There have been no significant changes to the contingent liabilities as set out in Note 32 to the Consolidated Financial Statements in the 2015 Annual Report.
17. CASH FLOW STATEMENT
Analysis of cash and cash equivalents in the balance sheet 30 June 2016
£m 31 December 2015
£m Cash and balances at central banks 3,499 2,279 Less: regulatory minimum cash balances (26) (40) 3,473 2,239 Net trading other cash equivalents 5,440 2,068 Net non-trading other cash equivalents 7,346 5,885 Cash and cash equivalents 16,259 10,192
Financial statements
Abbey National Treasury Services plc Half Yearly Financial Report 2016 45
18. FINANCIAL INSTRUMENTS a) Measurement basis of financial assets and liabilities The ANTS group categorises assets and liabilities measured at fair value within the fair value hierarchy based on the inputs to the valuation techniques as described in Note 38(a) in the Consolidated Financial Statements of the 2015 Annual Report. b) Fair values of financial instruments carried at amortised cost
30 June 2016 31 December 2015 Fair value Fair value
Level 2 Level 3 Total Carrying value
Level 2 Level 3 Total Carrying value
£m £m £m £m £m £m £m £m Assets
Loans and advances to banks 4,357 7,464 11,821 11,968 3,979 17,454 21,433 21,544 Loans and advances to customers
Corporate loans 6,507 9,448 15,955 15,906 6,426 7,886 14,312 14,515
Other advances - 601 601 600 - 17,940 17,940 17,940 6,507 10,049 16,556 16,506 6,426 25,826 32,252 32,455 Loans and receivables securities 162 - 162 165 13 - 13 15 Liabilities Deposits by banks Securities sold under
agreements to repurchase 2,331 - 2,331 2,323 2,665 - 2,665 2,630
Other deposits 249 31,174 31,423 31,414 505 18,207 18,712 18,703 2,580 31,174 33,754 33,737 3,170 18,207 21,377 21,333 Deposits by customers Current and demand accounts - 815 815 815 - 558 558 558 Wholesale funds and deposits - 1,921 1,921 1,921 - 2,280 2,280 2,280 - 2,736 2,736 2,736 - 2,838 2,838 2,838 Debt securities in issue Bonds and medium term notes 5,195 - 5,195 5,195 42,464 - 42,464 40,811
c) Fair values of financial instruments measured at fair value on a recurring basis The following tables summarise the fair values of the financial assets and liabilities accounted for at fair value at 30 June 2016 and 31 December 2015, analysed by their levels in the fair value hierarchy – Level 1, Level 2 and Level 3. Transfers between levels of the fair value hierarchy During H116, there were no transfers of financial instruments between Levels in the fair value hierarchy. Transfers relating to the FY15 are disclosed in Note 38(d) in the Consolidated Financial Statements of the 2015 Annual Report.
Fair value
Balance sheet category 30 June 2016 31 December 2015
Level 1 Level 2 Level 3 Total Level 1 Level 2 Level 3 Total Valuation
£m £m £m £m £m £m £m £m technique
Assets Trading assets Loans and advances to banks - 7,474 - 7,474 - 5,433 - 5,433 A Loans and advances to
customers 1,010 8,542 - 9,552 580 5,380 - 5,960 A
Debt securities 6,523 - - 6,523 5,462 - - 5,462 - Equity securities 5,400 - - 5,400 6,794 - - 6,794 - Derivative assets Exchange rate contracts - 9,773 30 9,803 - 7,191 55 7,246 A Interest rate contracts - 21,912 17 21,929 - 15,905 18 15,923 A & C Equity and credit contracts 88 739 359 1,186 88 1,275 343 1,706 B & D Financial assets designated at fair value
Loans and advances to customers
- 1,920 71 1,991 - 1,831 59 1,890 A
Debt securities - 247 - 247 - 240 - 240 A Available-for-sale securities Debt securities 561 - - 561 1,168 - - 1,168 - Total assets at fair value 13,582 50,607 477 64,666 14,092 37,255 475 51,822 Liabilities Trading liabilities Deposits by banks - 3,931 - 3,931 - 2,777 - 2,777 A Deposits by customers - 7,936 - 7,936 - 7,151 - 7,151 A Short positions 2,807 - - 2,807 2,794 - - 2,794 - Derivative liabilities Exchange rate contracts - 12,945 27 12,972 - 7,637 55 7,692 A Interest rate contracts - 21,512 10 21,522 1 15,807 10 15,818 A & C Equity and credit contracts - 1,491 48 1,539 2 1,620 46 1,668 B & D Financial liabilities designated at fair value
Debt securities in issue - 1,597 7 1,604 - 2,011 5 2,016 A
Total liabilities at fair value 2,807 49,412 92 52,311 2,797 37,003 116 39,916

Financial statements
46 Abbey National Treasury Services plc Half Yearly Financial Report 2016
d) Valuation techniques The main valuation techniques employed in internal models to measure the fair value of the financial instruments are disclosed in Note 38(e) in the Consolidated Financial Statements of the 2015 Annual Report. The ANTS group did not make any material changes to the valuation techniques and internal models it used during H116 and FY15. e) Fair value adjustments The internal models incorporate assumptions that the ANTS group believes would be made by a market participant to establish fair value. Fair value adjustments are adopted when the ANTS group considers that there are additional factors that would be considered by a market participant that are not incorporated in the valuation model.
The ANTS group classifies fair value adjustments as either ‘risk-related’ or ‘model-related’. The fair value adjustments form part of the portfolio fair value and are included in the balance sheet values of the product types to which they have been applied. The majority of these adjustments relate to Global Corporate Banking. The magnitude and types of fair value adjustment adopted by Global Corporate Banking are listed in the following table:
30 June 2016
£m 31 December 2015
£m
Risk-related: - Bid-offer and trade specific adjustments 46 46 - Uncertainty 50 42 - Credit risk adjustment 2 20 98 108 Model-related 4 6 Day One profits 3 1 105 115
Risk-related adjustments Risk-related adjustments are driven, in part, by the magnitude of the ANTS group’s market or credit risk exposure, and by external market factors, such as the size of market spreads. For further details, see the ‘Risk-related adjustments’ in Note 38(f) to the Consolidated Financial Statements in the 2015 Annual Report. f) Internal models based on information other than market data (Level 3) Valuation techniques There have been no significant changes to the valuation techniques as set out in Note 38(i) to the Consolidated Financial Statements in the 2015 Annual Report. Reconciliation of fair value measurements in Level 3 of the fair value hierarchy The following table provides a reconciliation of the movement between opening and closing balances of Level 3 financial instruments, measured at fair value using a valuation technique with significant unobservable inputs: Assets Liabilities
Derivatives Fair value
through P&L Total Derivatives Fair value
through P&L Total £m £m £m £m £m £m
At 1 January 2016 416 59 475 (111) (5) (116)Total gains/(losses) recognised in profit/(loss): - Fair value movements 7 12 19 15 (1) 14- Foreign exchange and other movements 1 - 1 - (1) (1)Settlements (18) - (18) 11 - 11At 30 June 2016 406 71 477 (85) (7) (92) Gains/(losses) recognised in profit/(loss) relating to assets and
liabilities held at the end of the period 8 12 20
15 (2) 13
At 1 January 2015 368 61 429 (56) (13) (69)
Total gains/(losses) recognised in profit/(loss): - Fair value movements 1 2 3 (8) (4) (12)Transfers in 63 - 63 (61) - (61)Settlements (16) (4) (20) 14 12 26At 31 December 2015 416 59 475 (111) (5) (116) Gains/(losses) recognised in profit/(loss) relating to assets and
liabilities held at the end of the period 1 2 3
(8) (4) (12)
Total gains or losses are included in ‘Net trading and other income’ (see Note 3).
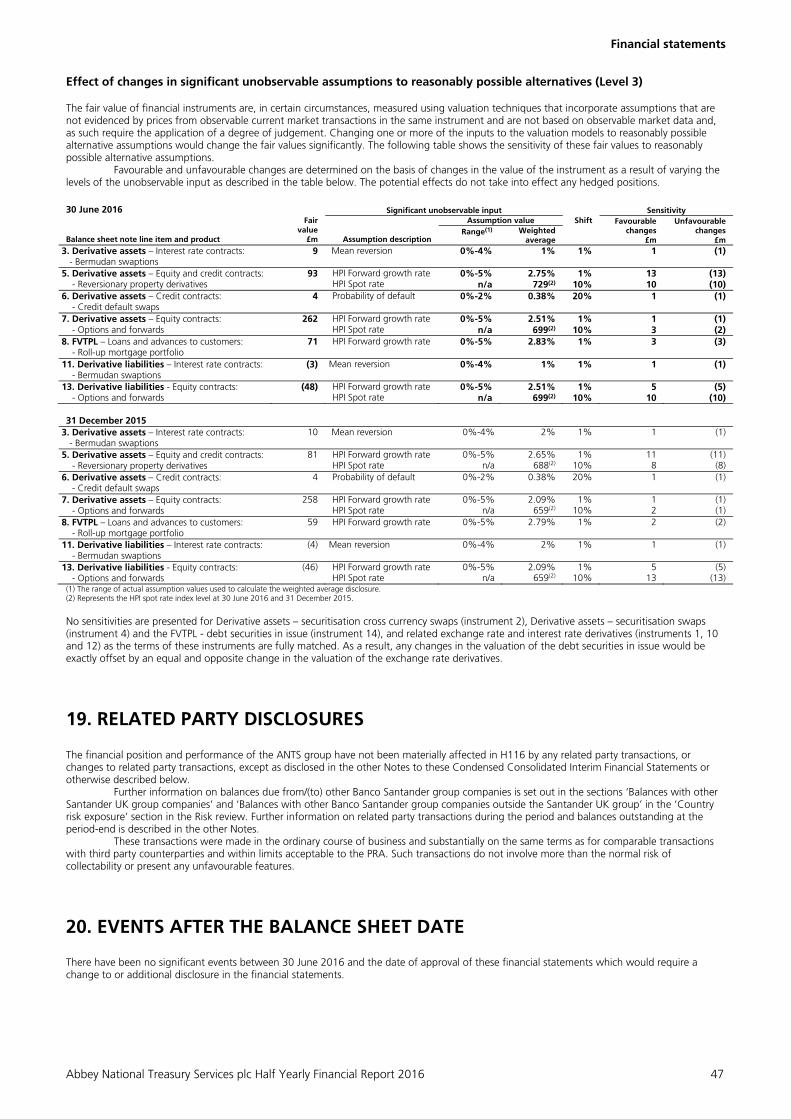
Financial statements
Abbey National Treasury Services plc Half Yearly Financial Report 2016 47
Effect of changes in significant unobservable assumptions to reasonably possible alternatives (Level 3)
The fair value of financial instruments are, in certain circumstances, measured using valuation techniques that incorporate assumptions that are not evidenced by prices from observable current market transactions in the same instrument and are not based on observable market data and, as such require the application of a degree of judgement. Changing one or more of the inputs to the valuation models to reasonably possible alternative assumptions would change the fair values significantly. The following table shows the sensitivity of these fair values to reasonably possible alternative assumptions.
Favourable and unfavourable changes are determined on the basis of changes in the value of the instrument as a result of varying the levels of the unobservable input as described in the table below. The potential effects do not take into effect any hedged positions.
30 June 2016 Significant unobservable input Sensitivity Balance sheet note line item and product
Fair value
£m
Assumption description
Assumption value Shift Favourable changes
£m
Unfavourable changes
£m Range(1) Weighted
average 3. Derivative assets – Interest rate contracts: - Bermudan swaptions
9 Mean reversion 0%-4% 1% 1% 1 (1)
5. Derivative assets – Equity and credit contracts: - Reversionary property derivatives
93 HPI Forward growth rate HPI Spot rate
0%-5% n/a
2.75% 729(2)
1% 10%
13 10
(13) (10)
6. Derivative assets – Credit contracts: - Credit default swaps
4 Probability of default 0%-2% 0.38% 20% 1
(1)
7. Derivative assets – Equity contracts: - Options and forwards
262 HPI Forward growth rate HPI Spot rate
0%-5% n/a
2.51% 699(2)
1% 10%
1 3
(1) (2)
8. FVTPL – Loans and advances to customers: - Roll-up mortgage portfolio
71 HPI Forward growth rate 0%-5% 2.83% 1% 3 (3)
11. Derivative liabilities – Interest rate contracts: - Bermudan swaptions
(3) Mean reversion
0%-4% 1% 1% 1 (1)
13. Derivative liabilities - Equity contracts: - Options and forwards
(48) HPI Forward growth rate HPI Spot rate
0%-5% n/a
2.51% 699(2)
1% 10%
5 10
(5) (10)
31 December 2015
3. Derivative assets – Interest rate contracts: - Bermudan swaptions
10 Mean reversion
0%-4% 2%
1%
1
(1)
5. Derivative assets – Equity and credit contracts: - Reversionary property derivatives
81 HPI Forward growth rate HPI Spot rate
0%-5% n/a
2.65% 688(2)
1% 10%
11 8
(11) (8)
6. Derivative assets – Credit contracts: - Credit default swaps
4 Probability of default 0%-2% 0.38% 20% 1
(1)
7. Derivative assets – Equity contracts: - Options and forwards
258 HPI Forward growth rate HPI Spot rate
0%-5% n/a
2.09% 659(2)
1% 10%
1 2
(1) (1)
8. FVTPL – Loans and advances to customers: - Roll-up mortgage portfolio
59 HPI Forward growth rate 0%-5% 2.79% 1% 2 (2)
11. Derivative liabilities – Interest rate contracts: - Bermudan swaptions
(4) Mean reversion
0%-4% 2%
1%
1
(1)
13. Derivative liabilities - Equity contracts: - Options and forwards
(46) HPI Forward growth rate HPI Spot rate
0%-5% n/a
2.09% 659(2)
1% 10%
5 13
(5) (13)
(1) The range of actual assumption values used to calculate the weighted average disclosure. (2) Represents the HPI spot rate index level at 30 June 2016 and 31 December 2015. No sensitivities are presented for Derivative assets – securitisation cross currency swaps (instrument 2), Derivative assets – securitisation swaps (instrument 4) and the FVTPL - debt securities in issue (instrument 14), and related exchange rate and interest rate derivatives (instruments 1, 10 and 12) as the terms of these instruments are fully matched. As a result, any changes in the valuation of the debt securities in issue would be exactly offset by an equal and opposite change in the valuation of the exchange rate derivatives.
19. RELATED PARTY DISCLOSURES The financial position and performance of the ANTS group have not been materially affected in H116 by any related party transactions, or changes to related party transactions, except as disclosed in the other Notes to these Condensed Consolidated Interim Financial Statements or otherwise described below. Further information on balances due from/(to) other Banco Santander group companies is set out in the sections ‘Balances with other Santander UK group companies’ and ‘Balances with other Banco Santander group companies outside the Santander UK group’ in the ‘Country risk exposure’ section in the Risk review. Further information on related party transactions during the period and balances outstanding at the period-end is described in the other Notes.
These transactions were made in the ordinary course of business and substantially on the same terms as for comparable transactions with third party counterparties and within limits acceptable to the PRA. Such transactions do not involve more than the normal risk of collectability or present any unfavourable features.
20. EVENTS AFTER THE BALANCE SHEET DATE There have been no significant events between 30 June 2016 and the date of approval of these financial statements which would require a change to or additional disclosure in the financial statements.