
Half Year Results for the six months ended 31 December ... · 1H14 Group performance •Sales...
22
Presented by: Mick McMahon, CEO 12 February 2014 Half Year Results for the six months ended 31 December 2013 For personal use only
Transcript of Half Year Results for the six months ended 31 December ... · 1H14 Group performance •Sales...

Presented by:
Mick McMahon, CEO 12 February 2014
Half Year Results
for the six months ended 31 December 2013
For
per
sona
l use
onl
y
Disclaimer
This presentation has been prepared by SKILLED Group Limited (ASX:SKE). The information contained in this presentation is of
a general nature only, is not investment advice, and should not be used as the basis for making an investment decision. This
presentation has been prepared without taking into account the investment objectives, financial situation or specific needs of any
particular person.
Except for any statutory liability that cannot be excluded, none of SKILLED Group Limited, its directors, employees or agents
accept any liability, including, without limitation, any liability caused or contributed to by any fault or negligence on their part, for
any loss arising from the use of the information contained in this presentation. In particular, no representation or warranty,
express or implied, is given as to the accuracy, completeness or correctness, likelihood of achievement or reasonableness of any
forecast, or statement as to prospects or expected returns contained in this presentation. Any such forecast, or statement as to
prospects or expected returns are by their nature subject to significant uncertainties and contingencies, and are for indicative
purposes only. Past performance is no guarantee of future performance.
Before making an investment decision, you should consult your financial adviser to determine whether an investment in SKILLED
Group Limited is appropriate in light of your particular investment objectives, financial situation, or specific needs.
PAGE 2
For
per
sona
l use
onl
y

Contents
Group performance
Strategy update
Outlook
Business segments
Appendix
PAGE 3
For
per
sona
l use
onl
y

1H14 Group performance
• Sales revenue declined on pcp, however in line with 2H13
• EBITDA impacted by mining slowdown & overall economic weakness partially offset by cost reductions
and contribution from Broadsword
• Cash flow consistent with pcp and gearing remains conservative post increased investment in
Broadsword and OMSA
• Reported EPS includes impact of non-cash acquisition accounting adjustments
• Interim dividend of 7.5 cps, fully franked, up from 7.0 cps
PAGE 4 Note: all comparisons above are to the prior corresponding period unless stated otherwise. 1 Includes equity accounted income from joint ventures; 2 As per
segment reporting in Half Year Financial Report 3 Debt/(Debt + Equity)
1H14 2H13 1H13
Sales Revenue1 ($m) 906.3 900.3 973.6
Reported NPAT ($m) 21.0 27.9 28.2
Underlying NPAT ($m) 26.0 29.3 29.2
Underlying EBITDA2 ($m) 43.9 46.4 48.7
Operating cash flow (before tax) ($m) 13.1 73.8 15.9
Net debt ($m) 132.9 44.8 67.1
Gearing %3 21.9 8.7 12.8
Reported EPS (cps) 9.0 12.0 12.1
Underlying EPS (cps) 11.1 12.5 12.5
Dividend (cps) 7.5 9.0 7.0
For
per
sona
l use
onl
y

1H14 Results
• Mining sector slowdown
• WFS revenue and margin impacted but partially offset by cost reductions
• Swan revenue significantly lower due to decrease in project activity
• Deferral of activity into 2H impacted ATIVO
• Subdued economic conditions
• WFS slow but underlying business activity stabilised in Q2
• Weaker demand for permanent technical professional roles
• Oil & Gas
• Slow first half in OMS Australia with solid activity levels in NZ and International
• Visible pipeline of oil & gas projects including recent contract wins
• Broadsword revenue in line with expectations
• Continued focus on improving safety performance
• 7% reduction in injury frequency rate (AIFR) vs pcp
• Disciplined management of costs
• $10m cost reduction in 1H14
PAGE 5
For
per
sona
l use
onl
y
Strategy implementation
PAGE 6
Well positioned to benefit from any improvement in economic activity and growth in mining volumes
• Retained key clients and benefiting from supplier consolidation
Continued to invest in systems and processes to leverage scale
• Benefits flowing through further integration of recruitment and back office processes
• Pilot “Paperless Branch of the Future” opened in Thomastown (VIC)
• ERP (Agresso) system upgrade underway will enable further process improvement and cost reduction
• Integration of Broadsword back office functions to ERP system
Further reduction in the indirect cost base
• $10 million indirect cost reduction delivered in 1H14 from accelerated program
• Expect to deliver a total of ~$15 million cost reduction over the full year
Disciplined investment in future earnings growth
• Building scale in attractive, higher growth sectors - acquisition of Broadsword in oil and gas sector
• Expansion of scale in maintenance and technical trades - acquisition of T & C Services
• Securing key oil and gas contract - manning services for Saipem on the Ichthys LNG Project
For
per
sona
l use
onl
y

PAGE 7
Segment performance
Workforce Services
• Revenue impacted by reduced demand in
resources sector; activity stabilised in 2Q
• Margin pressure from customers across most
sectors; partially offset by sustainable cost
reduction and efficiency improvement
Technical Professionals
• Slowdown in client project activity and pricing
pressure in Swan; expected to continue into 2H
• Weaker demand for permanent technical
professional roles in 1H14
• Trainees and apprentices and Indigenous
employment program performed well
Engineering & Marine Services
• Deferral of activities into 2H impacted ATIVO
and OMS Australia
• Revenue and profitable growth in OMS
International and OMS NZ
• Revenue from Broadsword in line with
expectations; integration progressing well
Note: all comparisons above are to the prior corresponding period unless stated otherwise. 1 Includes equity accounted income from joint ventures.
2 As per segment reporting in Half Year Financial Report.
Sales
$m EBITDA2
$m
Underlying EBITDA margin
Workforce
Services 1H14 452.6 19.4 4.3%
2H13 454.9 18.3 4.0%
1H13 463.4 22.5 4.9%
Technical
Professionals 1H14 202.8 9.3 4.6%
2H13 217.5 11.7 5.4%
1H13 271.4 15.1 5.6%
Engineering &
Marine Services1 1H14 252.3 22.7 9.0%
2H13 227.8 21.6 9.5%
1H13 241.0 19.7 8.2%
Group
Performance1 1H14 906.3 43.9 4.8%
2H13 900.3 46.4 5.2%
1H13 973.6 48.7 5.0%
For
per
sona
l use
onl
y

PAGE 8
$m 1H14 1H13 1H14 vs.
1H13
EBITDA adjusted for non-cash items 38.4 46.5 (8.1)
Decrease/(increase) in working capital (25.3) (30.6) 5.3
Operating cashflow, excluding tax 13.1 15.9 (2.8)
Net tax paid (11.8) (19.8) 8.0
Operating cashflow after tax 1.3 (3.9) 5.2
Net interest paid (3.0) (2.0) (1.0)
CAPEX (8.6) (6.5) (2.1)
Acquisition/earn-out payments1 (52.4) (9.5) (42.9)
Dividends paid (21.0) (18.7) (2.3)
Other (1.2) 1.6 (2.8)
Total cashflow (84.9) (39.0) (45.9)
Opening Net Debt 44.8 27.4 17.4
Cash (inflow)/outflow 84.9 39.0 45.9
Other movements (FX, fees) 3.2 0.7 2.5
Closing Net Debt 132.9 67.1 65.8
Cashflow and net debt
1 Net of cash/debt acquired
67.1
27.3
63.0 17.5
17.5
52.4
0
1
2
3
4
0
20
40
60
80
100
120
140
1H13 2H13 1H14
Broadsword acquisition
OMSA JV increased shareholding
Net Debt (excl acquisitions)
Net interest
132.9
44.8
Net Debt ($m)
• Seasonal working capital movement ($25m) consistent with pcp
• Capex increased due to additional Broadsword vessel & systems investment
• Gearing of 21.9% remains conservative post investments
For
per
sona
l use
onl
y

Strategy update
For
per
sona
l use
onl
y

PAGE 10
Market leader in the provision of flexible labour
solutions
• Tradespeople, experienced operators & technical
professionals
• Engineering projects & maintenance
• Offshore marine services
Strong position in key growth sectors
• Mining & resources; oil and gas; infrastructure;
telecommunications
• 51% revenue from WA and QLD
Safety leadership in the industry
Industrial relations expertise
~50,000 people employed each year, including:
• ~ 1,000 traineeships and apprenticeships
• ~ 500 Indigenous employees
Long term client relationships
Well established and trusted brand
Extensive branch network across Australia
29%
23%
10% 9% 7% 6% 5% 4%
2% 5%
Oil
& g
as
Min
ing &
resourc
es
FM
CG
Prim
ary
ma
nufa
ctu
rin
g
Gov't &
utilit
ies
Infr
astr
uctu
re
Tra
nsp
ort
& lo
gis
tics
Au
to &
defe
nce
Health
Oth
er
SKILLED Group revenue by sector 1H14
Note: above graphs include notional 1/2 share of joint venture revenue
4%
SKILLED Group revenue by geography 1H14
Our competitive advantage
42%
2%
4%
9%
19%
14% Overseas 6%
4%
For
per
sona
l use
onl
y

PAGE 11
Year 1 - 2
Pe
rfo
rma
nce
Understand the Business Simple clear strategy:
• Core Plus strategy
• SKILLED “re-Engineering”
change program
• Balance sheet repair
• Re-organise / new team
• Improve basic disciplines
Leverage exposure to growth markets & segments
Zero Harm safety refresh
Build capability:
• Leadership & organisation
• Sales & marketing
• Management processes
Deliver benefits:
• Leverage IT system investments
• Cost out, cash improvements
• Non-core assets
“One Team” culture
Leverage exposure to growth markets & segments
Zero Harm safety leadership
Build on brand leadership:
• Strengthen market position
• Leading employer brand
Higher value services
Most efficient operation
• Low cost, high volume
Embedded “One Team” culture Superior returns
Overhead Costs
Reduced Debt
Cash
Conservative Gearing
Unit Costs
EBIT Margin
Cash
ROIC
Revenue & Margin
EBIT Margin
Cash
ROIC
Developing a shared strategy Building capability Profitable growth
Year 5+
Good progress but more to do
For
per
sona
l use
onl
y

Strategy for value growth
Leverage scale and brand
strength in Workforce Services:
• Transformation, cost efficiency, data
based decision support
• Focus on safety and higher skill roles
Blue collar labour
hire &
placements
Branch network and „Back Office‟ systems
Projects &
Maintenance
Offshore Marine
Services Technical
Professionals
Value added services
Sourcing
& supply
of labour
and skills
Client
focused
sales,
service &
operation
Build scale in attractive
higher skill, higher margin
segments
Page 12
For
per
sona
l use
onl
y

Acquisition of T & C Services • Acquisition completed on 11 February 2014, following
favourable shareholder vote
• ATIVO, T&C and Damstra will work side by side in a newly formed SKILLED
Engineering division
• Johannes Risseeuw appointed COO SKILLED Engineering
• Integration commenced
• T & C Services is a leading maintenance services provider to
the manufacturing, mining, heavy industry and utilities sectors
• Maintenance services, asset management and optimisation, as well as
preventative maintenance activities such as shutdowns, equipment
servicing, machinery repair and inspection
• Supported by workshop services including plant and equipment rebuild /
repair, production of spares and consumables, fabrication, machining,
welding and electrical work
• Established presence in NSW and QLD with a blue chip client
base
• Longstanding client relationships built on reputation for safety, quality and
service
• Experienced management team
• Highly skilled workforce (~ 600 employees)
• Key management to remain following the acquisition
Mobile maintenance support to customers
Highly skilled employees
Workshop facilities
Note: excludes Thomas & Coffey Limited construction projects, head office and residual business risks PAGE 13
For
per
sona
l use
onl
y

Outlook
For
per
sona
l use
onl
y

Outlook
PAGE 15
• Trading conditions remain challenging but second half expected to be stronger
• Workforce Services: overall activity levels appear to have stabilised and benefiting from supplier
consolidation; however continued price pressure in mining impacting margins
• Technical Professionals: reduced activity in mining and related engineering services, primarily in
Swan; Telecommunications expected to strengthen
• Engineering & Marine Services: activity levels improving in maintenance services and oil and
gas, with growth expected from:
• increased activity levels & visible pipeline in oil & gas in the second half; Saipem vessel
mobilisation delayed to end FY14
• Broadsword - additional vessel and opportunity to change the mix of chartered / owned vessels
• initial contribution from T & C Services acquisition
• Cost reduction program expected to deliver ~$15 million in FY14 from initiatives already underway
• Well positioned for longer term benefit from:
• any improvement in economic activity and expansion in mining volumes
• full contribution from the Saipem contract, Broadsword and T&C Services; while the OMSA JV is
expected to reduce from peak levels in line with activity on the Gorgon project
• ongoing strategy implementation supporting further cost reduction
• a strong balance sheet to support dividends and investment in future growth
For
per
sona
l use
onl
y

Business Segments
For
per
sona
l use
onl
y

PAGE 17
Mining & Resources
24%
Primary Manufacturing
17%
FMCG 18%
Infrastructure 11%
Gov't & Utilities
10%
Transport & Logistics
8%
Other 12%
• Initial impact of slowdown in mining and
related services and a slow seasonal build up
into Christmas partially offset by improved
activity in infrastructure and rail sectors
• Well positioned for growth in mining volumes
and improvement in economic activity
• activity levels stabilised in 2Q
• Margins impacted by continued pricing
pressure from clients across most sectors.
• Good progress on sustainable cost reduction
and efficiency improvement:
• cost out program accelerated in 1H14
• partially offsetting reduction in mining activity
1H14 2H13 1H13 1H14 v
2H13
1H14 v
1H13
Revenue ($m) 452.6 454.9 463.4 (0.5)% (2.3%)
EBITDA ($m) 19.4 18.3 22.5 6.2% (13.7%)
EBITDA margin 4.3% 4.0% 4.9% 0.3 (0.6)
Revenue and EBITDA:
Industry Breakdown:
Workforce Services
For
per
sona
l use
onl
y
PAGE 18
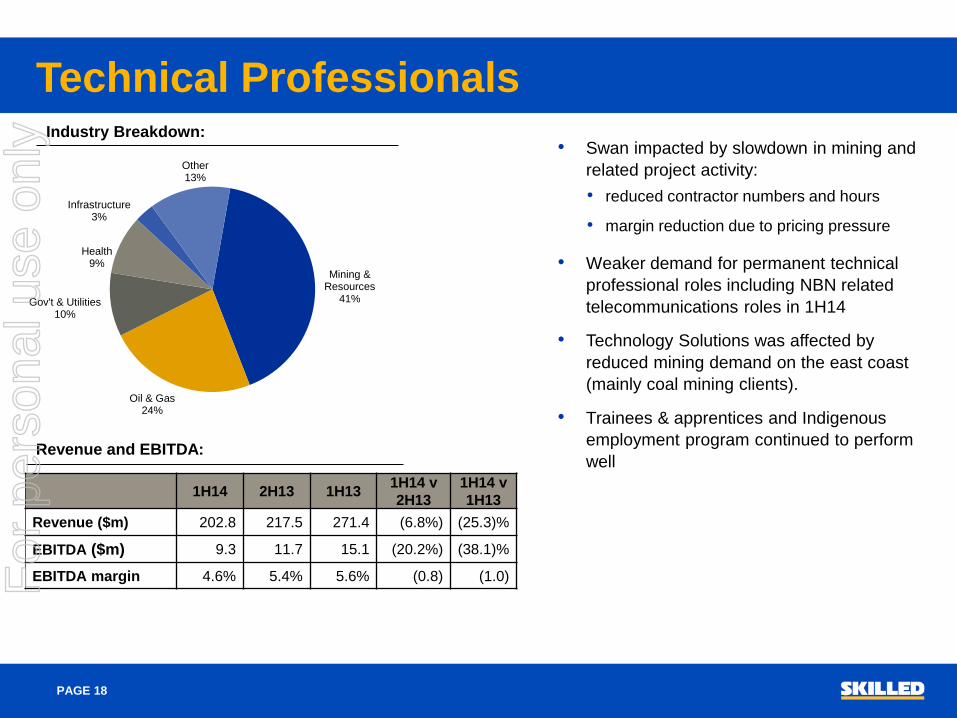
Revenue and EBITDA:
Industry Breakdown:
Mining & Resources
41%
Oil & Gas 24%
Gov't & Utilities 10%
Health 9%
Infrastructure 3%
Other 13%
• Swan impacted by slowdown in mining and
related project activity:
• reduced contractor numbers and hours
• margin reduction due to pricing pressure
• Weaker demand for permanent technical
professional roles including NBN related
telecommunications roles in 1H14
• Technology Solutions was affected by
reduced mining demand on the east coast
(mainly coal mining clients).
• Trainees & apprentices and Indigenous
employment program continued to perform
well
1H14 2H13 1H13 1H14 v
2H13
1H14 v
1H13
Revenue ($m) 202.8 217.5 271.4 (6.8%) (25.3)%
EBITDA ($m) 9.3 11.7 15.1 (20.2%) (38.1)%
EBITDA margin 4.6% 5.4% 5.6% (0.8) (1.0)
Technical Professionals
For
per
sona
l use
onl
y

PAGE 19
Revenue and EBITDA:
Industry Breakdown:
Oil & Gas 74%
Mining & Resources
10%
FMCG 4%
Transport & Logistics
4%
Other 8%
Revenue by activity:
Manning - domestic
37%
Manning - international
22%
Vessels (incl
manning) 13%
Maintenance 14%
Projects and Shutdowns
14% 1H14 2H13 1H13
1H14 v
2H13
1H14 v
1H13
Revenue ($m) 252.3 227.8 241.0 10.7% 4.7%
EBITDA ($m) 22.7 21.6 19.7 4.8% 15.1%
EBITDA margin 9.0% 9.5% 8.2% (0.5) 0.8
Engineering and Marine Services • ATIVO: Impacted by deferrals of maintenance projects
and shutdowns by clients. Activity levels have stabilised in
recent months.
• Initial contribution from T&C Services in 2H
• OMS: Increased activity in OMS International and OMS
NZ; offset by reduced activity levels in OMS Australia.
Activity levels have ramped up early in the second half.
• Broadsword: Revenue in line with expectations;
integration progressing well.
• Mobilisation of Saipem vessels expected to commence at
the end of FY14
Note: above graphs include notional 1/2 share of joint venture revenue
For
per
sona
l use
onl
y

Appendix
For
per
sona
l use
onl
y

Reconciliation of result
PAGE 21
$m Comments
Underlying NPAT 26.0
Redundancy and branch closure (2.3) Costs incurred to realise $10m cost saving in1H14
Acquisition and integration costs (1.2) T&C Services acquisition costs and Broadsword
integration costs
Amortisation of acquired
intangibles (non-cash) (2.4)
Non-cash amortisation of “customer contracts” in
relation to Broadsword acquisition and increase in
OMSA investment.
Notional interest on deferred
consideration (non-cash) (0.7)
Non-cash notional interest expense on Broadsword
deferred consideration recognised at NPV on
acquisition.
Tax on reconciling items 1.6 Tax expense on above items, where relevant
Reported NPAT 21.0
For
per
sona
l use
onl
y

Contact Details:
Delphine Cassidy
EGM Investor Relations
P: +61 3 8646 6465
M: +61 419 163 467
E: [email protected] For
per
sona
l use
onl
y