Half Year Report 2020
39
Half Year Report 2020 Key figures USD thousands (except earnings per share) Q2 2020 Q2 2019 Q1 2020 1st Half 2020 1st Half 2019 Revenues 460,324 407,292 500,585 960,910 785,841 Gross margin in % (adjusted - see footnote 1) 40% 37% 39% 40% 35% Result from operations (adjusted – see footnote 1) 90,068 49,008 100,915 190,984 71,810 EBIT margin in % (adjusted – see footnote 1) 20% 12% 20% 20% 9% Net result (adjusted – see footnote 1) 56,765 52,226 25,476 82,241 70,179 Basic / diluted earnings per share in CHF 2) (adjusted – see footnote 1) 0.21 / 0.20 0.66 / 0.61 0.30 / 0.40 0.47 / 0.50 0.89 / 0.88 Basic / diluted earnings per share in USD (adjusted – see footnote 1) 0.22 / 0.20 0.65 / 0.60 0.31 / 0.42 0.48 / 0.52 0.87 / 0.86 Total backlog (excluding consignment stocks) 249,561 298,381 255,137 249,561 298,381 Net debt -55,635 1,360,794 1,550,515 -55,635 1,360,794 1) Excluding acquisition-related and share-based compensation costs. 2) Earnings per share in CHF were converted using the average currency exchange rate for the respective periods.
Transcript of Half Year Report 2020

Half Year Report
2020
Key figures
USD thousands (except earnings per share)
Q2 2020 Q2 2019 Q1 2020 1st Half 2020 1st Half 2019
Revenues 460,324 407,292 500,585 960,910 785,841
Gross margin in % (adjusted - see footnote 1)
40% 37% 39% 40% 35%
Result from operations (adjusted – see footnote 1)
90,068 49,008 100,915 190,984 71,810
EBIT margin in % (adjusted – see footnote 1)
20% 12% 20% 20% 9%
Net result (adjusted – see footnote 1)
56,765 52,226 25,476 82,241 70,179
Basic / diluted earnings per share in CHF 2)
(adjusted – see footnote 1)
0.21 / 0.20 0.66 / 0.61 0.30 / 0.40 0.47 / 0.50 0.89 / 0.88
Basic / diluted earnings per share in USD
(adjusted – see footnote 1)
0.22 / 0.20 0.65 / 0.60 0.31 / 0.42 0.48 / 0.52 0.87 / 0.86
Total backlog (excluding consignment stocks)
249,561 298,381 255,137 249,561 298,381
Net debt -55,635 1,360,794 1,550,515 -55,635 1,360,794 1) Excluding acquisition-related and share-based compensation costs.
2) Earnings per share in CHF were converted using the average currency exchange rate for the respective periods.

Half Year Report 2020
www.ams.com page 2/39
Second quarter revenues at mid-point and profitability at top end of
expectation range; resilient consumer demand compensates for
Automotive and Industrial weakness; very good third quarter
expected despite Covid-19 with ams revenues of USD 530-570
million, up 20% quarter-on-quarter at midpoint, and strong ams adj.
EBIT margin of 21-24% reflecting consumer ramps; OSRAM
acquisition successfully closed, moving towards start of integration
Report to shareholders on the second quarter and first half of 2020
Ladies and Gentlemen
Our second quarter and first half results show our business performing very well despite the ongoing
global Covid-19 pandemic and its macro-economic and end market impact. The demand environment
in the consumer market remained clearly supportive during the first two quarters while end markets in
Automotive and Industrial are seeing continued weakness worldwide. Despite these factors we expect
very good sequential revenue and profit growth in the third quarter based on meaningful consumer
ramps.
Financial results
Second quarter group revenues were USD 460.3 million, down 8% sequentially from the first quarter
and up 13% from USD 407.3 million in the same quarter 2019. Group revenues for the first half of
2020 were USD 960.9 million, up 22% compared to USD 785.8 million recorded in the first half of
2019. Adjusted gross margin for the second quarter was 40% (excluding acquisition-related and share-
based compensation costs) compared to 37% in the same quarter 2019 (37% including acquisition-
related and share-based compensation costs, 35% in the same quarter 2019). For the first half of
2020, adjusted gross margin was 40% (excluding acquisition-related and share-based compensation
costs) compared to 35% in the first half of 2019 (37% including acquisition-related and share-based
compensation costs, 32% in the first half of 2019).
The adjusted result from operations (EBIT) for the second quarter was USD 90.1 million or 20% of
revenues (excluding acquisition-related and share-based compensation costs), increasing from
USD 49.0 million in the same period 2019 (USD 39.2 million or 9% of revenues including acquisition-
related and share-based compensation costs, up from USD 21.5 million in the same period 2019). For
the first half of 2020, the adjusted EBIT was USD 191.0 million or 20% of revenues (excluding
acquisition-related and share-based compensation costs), significantly up from USD 71.8 million in the
same period 2019 (USD 99.0 million or 10% of revenues including acquisition-related and share-based
compensation costs, up from USD 17.1 million in the first half year 2019).
For transparent and consistent presentation of ams’ business we show the net result and earnings per
share adjusted for acquisition-related and share-based compensation costs from this quarter onwards,
corresponding to adjusted gross profit and adjusted operating profit (EBIT). Adjusted net income for
the second quarter was USD 56.8 million (excluding acquisition-related and share-based
compensation costs), compared to USD 52.2 million for the same period 2019 (second quarter 2020:
USD 5.9 million including the aforementioned costs). Adjusted basic/diluted earnings per share for the

Half Year Report 2020
www.ams.com page 3/39
second quarter were CHF 0.21/0.20 or USD 0.22/0.20 based on 256,750,833/261,613,899 shares or
CHF 0.02/0.01 or USD 0.02/0.01 including the aforementioned costs (second quarter 2019:
CHF 0.66/0.61 or USD 0.65/0.60 based on 80,773,555/86,504,145 shares; all weighted average).
Adjusted net income for the first half year 2020 was USD 82.2 million (excluding acquisition-related
and share-based compensation costs), compared to USD 70.2 million for the same period 2019 (first
half 2020: USD -9.8 million including aforementioned costs). Adjusted basic/diluted earnings per share
for the first half were CHF 0.47/0.50 or USD 0.48/0.52 per share based on 169,720,047/175,619,483
shares or CHF -0.06/0.00 or USD -0.06/0.00 including aforementioned costs (first half 2019:
CHF 0.89/0.88 or USD 0.87/0.86 based on 80,504,466/81,864,338 shares; all weighted average).
Operating cash flow for the second quarter was USD 106.2 million, strongly up from USD 49.7 million
in the same quarter 2019, and operating cash flow for the first half was USD 340.6 million significantly
higher than USD 142.9 million in the first half 2019. Total backlog on 30 June 2020 (excluding
consignment stock agreements) was USD 249.6 million compared to USD 255.1 million at the end of
the first quarter 2020 and USD 298.4 million on 30 June 2019.
Business overview
Our business showed a very good performance in the second quarter and first half of 2020 against the
backdrop of the continuing impact of Covid-19 on economies and end markets worldwide. We
achieved second quarter results at the midpoint or upper end of the published expectation range. This
positive development was again driven by our consumer business and continuing resilient demand in
the consumer market overall.
As the key development for ams in the second quarter we are proud to have successfully closed the
acquisition of OSRAM on 9 July 2020. Following the closing we owned 69% of OSRAM shares
(excluding treasury shares) at a transaction value of around EUR 2.7 billion, as of today we have
further increased our holdings to around 71% of OSRAM shares. Prior to the closing and shortly
afterwards, we successfully placed a multi-tranche issue of around EUR 1.25 billion equivalent 5-year
senior notes with international investors comprising EUR 850 million and USD 450 million notes in
total. The debt issue served to secure a long-term financing structure for the acquisition in line with our
plans. Beyond that it is our intention to use future excess cash flow from operations to support
increasing our OSRAM shareholdings further.
The closing was a vital milestone for this highly strategic and transformative acquisition that will now
combine the complementary strengths of ams and OSRAM. We are bringing together two leaders in
their respective areas and are fully convinced of the outstanding technology, market and earnings
potential of this combination. We are welcoming OSRAM’s worldwide employees into the new global
combined company team and are aligning all necessary steps to start integrating both organizations.
With ams and OSRAM now coming together, we have defined a vision for the combined company: to
create the uncontested leader in optical solutions. To this end, we will focus on the three areas of
Sensing, Illumination and Visualization offering exciting solutions for innovative applications. We look
forward to building an outstanding technology platform delivering strong profitability and growth. This
encompasses bold technology investments in innovation and ongoing smart transformation of the
company in line with our vision.

Half Year Report 2020
www.ams.com page 4/39
We have declared the intention to pursue a domination and profit and loss transfer agreement
(DPLTA) for OSRAM and are driving towards implementing this step. As we are keen to realize this
agreement in a timely manner we are already engaged in required preparations. Based on these and
our current assessment, we regard an implementation of a DPLTA broadly around year-end 2020 as a
feasible timeline following required approvals. We will provide further information on the timeline and
the steps involved as this information becomes available. On the basis of the DPLTA we will be able to
drive and accelerate the integration and alignment of ams’ and OSRAM’s businesses in the most
efficient way to build a strongly profitable combined company within the next years.
Notwithstanding the DPLTA process we are now starting to work closely with OSRAM on the basis of
our majority share ownership, taking first steps towards a successful integration of the two companies.
These include joint initiatives to prepare the future organizational and business structure, align joint
customer-facing marketing and sales activities and set up combined financial management and
reporting. At the same time, we are in the process of realizing ams representation on the Supervisory
Board of OSRAM where we plan to take four seats. In this context OSRAM will remain an independent
majority-owned listed subsidiary of ams until additional steps such as a DPLTA are concluded and
implemented.
As we move towards the combination, we are making profitability, earnings growth and cash flow
generation the primary focus of ams for all our businesses as well as the combined company. We will
therefore drive our strategic positioning and portfolio in strong alignment with these target metrics.
Looking at our business, our consumer solutions once more provided the largest contribution to our
overall results in the second quarter and first half. Leading in optical sensing our market position is
based on our wide range of solutions for 3D sensing including VCSEL (Vertical Cavity Surface-
Emitting Laser) illumination, high quality display management including behind-OLED (BOLED)
sensing, micro-scale proximity sensing, spectral and bio-sensing, and other optical applications.
As a key player in 3D sensing we leverage an extensive portfolio and industry-leading system know-
how and address all architectures, structured light (SL), time-of-flight (iToF/dToF), and active stereo
vision (ASV). Building on our advanced VCSEL products and optics capabilities for front-side and
world-facing use we offer high performance 3D illumination for SL, ToF and ASV. We are shipping
high volume 3D sensing products to the leading smartphone OEMs with the Android market
contributing attractively in the first half. Here we serve several platforms with different VCSEL 3D
illumination solutions for world-facing iToF 3D sensing. These camera enhancement systems have
become successful in the market as they allow OEMs to offer significantly improved picture quality. We
are extending our 3D sensing focus and technology offering through the targeted integration of high
quality NIR image sensing for specific architectures. Further expanding our coverage of 3D technology
and our system expertise, this roadmap enables solution designs where our NIR technology can drive
high QE and other performance aspects.
In display management, behind-OLED (BOLED) light and proximity sensing solutions are continuing
their adoption in major Android platforms through this year. Eliminating bezel-placed components from
the device face, our unmatched technology makes light and proximity sensing invisible by measuring
from behind the OLED display. Leading Android OEMs have been driving penetration of the
technology which is becoming a common entry on high-end feature lists. Against this backdrop we are
realizing an expanding multi-generation BOLED roadmap for the coming years. Across our overall

Half Year Report 2020
www.ams.com page 5/39
display management portfolio we are shipping very high volumes of differentiated sensing solutions to
top consumer OEMs.
We focus on innovation in optical sensing through ongoing significant R&D investments for new
technologies and applications. We already introduced innovative technology for camera automatic
white balancing (AWB) earlier this year where our highly accurate spectral sensor opens a new way of
boosting mobile camera performance. Precise spectrum analysis of the light environment enables
previously impossible white balancing accuracy for smartphone cameras through advanced optical
sensing. This drives significantly better picture quality and excellent natural color expression for
outstanding results and measurable benchmark improvement. The solution is shipping in high volume
into a first flagship platform and we expect broader adoption of the technology going forward.
We are pursuing a development roadmap for dToF 3D technology, a more complex ToF architecture
that offers significant advantages for longer distances. High performance dToF illumination and
systems that build on our industry-leading 3D illumination and sensing expertise are an innovation
focus for the next years as we see dToF emerging into an important 3D area and market interest in
future world-facing applications is growing. We continue development activities to create front-facing
3D sensing technology for face authentication behind the display, making it invisible and eliminating
components from the device face. Leveraging our singular BOLED know-how and 3D system
capabilities which are built around VCSEL illumination, NIR sensing, software and algorithms we plan
to demonstrate BOLED 3D technology using ASV around year-end. Later on, we plan to explore
potential architectures for BOLED 3D sensing related to SL. All in all, we see dToF and BOLED 3D
technology as very attractive high value opportunities for the coming years. Audio sensing which
includes our range of active noise cancelling solutions performed in line with expectations based on
our strong position in high performance digital and hybrid noise cancelling technologies.
Looking out into the next years, we see a number of new optical sensing opportunities and potential
applications we are pursuing across the top smartphone OEMs. These are based on our strong
relationships and high level of engagement at each of these customers. We are working to bring new
and better solutions to customers that are driven by our focus on high value innovation and
differentiating capabilities.
Our automotive, industrial, and medical businesses as a whole showed a muted performance in the
second quarter and first half. This development reflected expectations due to the continued impact of
Covid-19 though end markets differed in the effects recorded. In Automotive, global demand weakness
and lowered automotive production remained apparent in order trends and volume requirements so
our business performed in line with expectations. We navigate through this challenging environment
looking forward to a more significant strengthening of automotive production globally. We are well
positioned for attractive automotive sensing markets in safety, driver assistance/autonomous driving,
position sensing, and chassis control, and continue to invest in R&D and project-based development
efforts.
For 3D LIDAR we support illumination in several programs at different Tier 1 system suppliers where
our high power VCSEL arrays enable advanced scan/non-scan LIDAR architectures. Beyond this, we
are seeing ongoing good market traction in LIDAR from our partnership with LIDAR technology leader
IBEO. Our internal VCSEL production, where a ramp-up continues through this year, is already fully
automotive qualified which offers further differentiation in the VCSEL market. The emerging area of

Half Year Report 2020
www.ams.com page 6/39
optical in-cabin sensing (ICS) shows positive momentum as OEM and Tier 1 suppliers are highly
interested in new in-cabin comfort and safety applications such as monitoring. We are developing
products for first secured ICS projects including illumination and see future opportunities around our
3D solution capabilities.
Our industrial business also recorded a continued subdued performance in the second quarter
reflecting ongoing weak demand in industrial markets due to Covid-19 impacts worldwide. As we
progress towards recovery of demand our broad customer base and leading position in high
performance sensing for industrial and factory automation, HABA, imaging and other industrial uses
remain supportive factors in the current environment. Built around our leading global shutter
technology, our imaging business for industrial applications and machine vision saw a similar
development and performed in line with expectations.
Our medical business continued to perform well in the second quarter in contrast to other AIM
markets. We are a leading supplier of medical imaging solutions for CT, digital X-ray, and
mammography as well as miniature camera endoscopy. In light of the Covid-19 pandemic we have
been fulfilling demand for broader deployment of computed tomography (CT) scanners that help
clinical Covid-19 diagnostics. Driving innovation we note positive momentum for our recently
announced new use of spectral sensing technology in medical lateral flow testing (LFT). Here we
enable fast diagnostics by optically analyzing LFT results at the point-of-care with very high accuracy.
We have announced a partnership with European medical test manufacturer Senova for an integrated
LFT test kit for Covid-19 antibody identification that incorporates our spectral sensor, and expect first
production runs to start in the second half of this year. Given the strength of our unmatched technology
we are already exploring several additional industry partnerships for different medical LFT uses and
see a meaningful growth opportunity for the coming years.
In manufacturing operations, we have maintained volume production in all our locations despite the
continued Covid-19 related restrictions and challenges. As we continue detailed measures to safe-
guard the health of our employees as well as our ability to manufacture we remain fully aligned with
customer requirements and able to support evolving customer demand. Our Singapore manufacturing
showed a strong operational performance through the first half and we expect this to continue as
capacity utilization increases with expected higher production volumes in the third quarter and second
half. Capital expenditures remained low through the first half of 2020, even when compared to 2019,
underlining the successful management of investment requirements for our business. We therefore
expect capital expenditures to continue to be limited for the remainder of the year.
Outlook
For the third quarter 2020, we expect very good growth for the ams business despite the ongoing
Covid-19 pandemic impacting economies and our end markets, on a sequential basis. This growth will
be driven by volume ramps for smartphone sensing solutions while our non-consumer business in
Automotive and Industrial continues to show limited demand and provide a muted contribution to our
results. We will be fully consolidating OSRAM as of the beginning of the third quarter 2020 and intend
to include OSRAM as a separate reporting segment. Going forward, we plan to continue our practice
of providing a financial outlook for the current quarter. Given the current financial guidance structure of
OSRAM, however, our financial outlook for the third quarter 2020 below only comprises the ams
business.

Half Year Report 2020
www.ams.com page 7/39
Based on available information and the above mentioned definition, we expect third quarter revenues
for the ams business of USD 530-570 million, up 20% sequentially at the midpoint. This positive
outlook encompasses strength in our consumer business compensating for ongoing demand
weakness in the majority of our non-consumer business. Despite this situation, we also expect robust
profitability for the third quarter with an expected adjusted operating (EBIT) margin of 21-24% on the
basis of our operational strength. The expectations above assume no further unforeseen negative
effects from the Covid-19 pandemic that would result in a meaningful negative impact on our business.
Premstaetten, 29 July 2020
Alexander Everke, CEO Ingo Bank, CFO
Thomas Stockmeier, COO Mark Hamersma, Chief Business Development Officer

Half Year Report 2020
www.ams.com page 8/39
Consolidated Income Statement (unaudited)
USD thousands (except earnings per share)
Q2 2020 1st Half 2020 Q2 2019 1st Half 2019
Revenues 460,324 960,910 407,292 785,841
Cost of sales -289,581 -604,510 -265,977 -533,095
Gross profit 170,743 356,399 141,315 252,746
Gross margin in % 37% 37% 35% 32%
Research and development -68,317 -133,740 -75,437 -152,096
Selling, general and administrative -65,182 -129,633 -46,517 -89,457
Other operating income 2,628 6,498 2,497 6,522
Other operating expense -96 108 -464 -506
Result from investments in associates -550 -693 63 -85
Result from operations 39,226 98,939 21,457 17,124
Net financing result -32,160 -104,975 4,972 2,234
Result before tax 7,066 -6,036 26,429 19,358
Income tax result -1,144 -3,768 -1,754 -3,865
Net result 5,922 -9,804 24,675 15,492
Basic earnings per share in CHF 1) 0.02 -0.06 0.31 0.19
Diluted earnings per share in CHF 1) 0.01 0.00 0.28 0.19
Basic earnings per share in USD 0.02 -0.06 0.31 0.19
Diluted earnings per share in USD 0.01 0.00 0.28 0.19
1) Earnings per share in CHF were converted using the average currency exchange rate for the respective period.

Half Year Report 2020
www.ams.com page 9/39
Consolidated Statement of Comprehensive Income
(unaudited)
USD thousands Q2 2020 1st Half 2020 Q2 2019 1st Half 2019
Net result 5,922 -9,804 24,675 15,492
Items that will never be reclassified to profit and loss (after income taxes)
Remeasurements of defined benefit liability 0 0 0 -15
FVOCI equity instruments - net change in fair value 248,429 -47,756 -12 -1,932
Items that may be reclassified to profit and loss (after income taxes)
FVOCI debt instruments - net change in fair value 0 0 0 0
Exchange differences on translating foreign operations -49,769 7,027 -28,885 11,762
Other comprehensive income 198,660 -40,729 -28,897 9,814
Total comprehensive income 204,582 -50,534 -4,222 25,307

Half Year Report 2020
www.ams.com page 10/39
Consolidated Balance Sheet (unaudited)
USD thousands 30 June 2020 31 December 2019
Assets
Cash and cash equivalents 2,315,358 551,256
Trade receivables 121,428 222,404
Inventories 246,337 231,533
Other receivables and assets 150,299 142,872
Assets held for sale 0 94,845
Total current assets 2,833,422 1,242,910
Property, plant and equipment 1,179,671 1,244,894
Intangible assets 1,221,398 1,242,577
Right of use assets 130,684 135,298
Investments in associates 52,643 30,710
Deferred tax assets 7,998 9,417
Other long term assets 2,751 1,986
Financial assets 1,112,975 976,054
Total non-current assets 3,708,121 3,640,936
Total assets 6,541,542 4,883,846
Liabilities and shareholders' equity
Liabilities
Interest-bearing loans and borrowings 1,027,878 861,004
Trade liabilities 156,263 149,224
Income tax liabilities 26,051 21,645
Provisions 109,586 124,162
Other liabilities 134,821 168,981
Liabilities in regard to assets held for sale 0 1,472
Total current liabilities 1,454,599 1,326,488
Interest-bearing loans and borrowings 1,231,845 1,432,738
Employee benefits 53,680 53,958
Deferred tax liabilities 66,349 68,974
Other long-term liabilities 130,587 140,352
Total non-current liabilities 1,482,461 1,696,021
Shareholders' equity
Issued capital 302,157 92,997
Additional paid-in capital 2,369,060 792,112
Treasury shares -140,190 -147,761
Other reserves 17,935 10,908
Retained earnings 1,055,521 1,113,082
Total shareholders' equity and reserves 3,604,482 1,861,337
Total liabilities and shareholders' equity 6,541,542 4,883,846

Half Year Report 2020
www.ams.com page 11/39
Consolidated Statement of Cash Flows (unaudited)
USD thousands Q2 2020 1st Half 2020 Q2 2019 1st Half 2019
Operating activities
Result before tax 7,066 -6,036 26,429 19,358
Depreciation (net of government grants) 82,847 166,374 75,433 149,651
Expense from stock option plan 23,965 36,228 9,614 18,157
Changes in other long-term liabilities -1 -142 -5,439 -4,232
Result from sale of plant and equipment -1 -14 -4 -5
Result from investments in associates 550 693 -63 85
Net financing cost 32,160 104,975 -4,972 -2,234
Change in provisions and employee benefits -24,721 -15,266 -2,690 2,272
Changes in inventories -1,781 -14,282 -6,855 14,803
Changes in trade and other receivables -8,714 40,133 -48,628 -46,099
Changes in trade and other payables -5,859 28,670 10,596 -3,913
Income taxes paid 719 -752 -3,679 -4,896
Cash flows from operating activities 106,230 340,582 49,742 142,948
Investing activities
Acquisition of intangibles, property, plant and equipment
-19,903 -56,725 -47,015 -132,274
Acquisition of subsidiary, net of cash acquired 0 0 0 -8,922
Acquisition of other financial investments -27,325 -199,334 0 0
Proceeds from sale of plant and equipment 0 2 1 1
Proceeds from the sale of discontinued business area
0 45,621 0 0
Interest received 1,008 3,264 1,680 3,276
Cash flows from investing activities -46,219 -207,171 -45,335 -137,919
Financing activities
Proceeds from borrowings 1,967 101,892 220 13,940
Repayment of borrowings -118,512 -151,978 -67,639 -106,742
Repayment of finance lease liabilities -7,580 -12,001 -6,540 -10,424
Buyback of convertible bonds 0 0 -73,948 -73,948
Acquisition of treasury shares -140,273 -140,273 -3,114 -33,556
Sale of treasury shares 142 154,626 635 1,813
Interest paid -8,555 -19,920 -3,094 -9,260
Transaction costs from loans and borrowings -105,616 -117,891 0 0
Changes resulting from capital increase 1,816,538 1,816,538 0 0
Cash flows from financing activities 1,438,113 1,630,994 -153,480 -218,178
Change in cash and cash equivalents 1,498,123 1,764,405 -149,074 -213,148
Effects of changes in foreign exchange rates on cash and cash equivalents
-8,619 -304 -6,867 -4,207
Cash and cash equivalents at begin of period 825,854 551,256 627,259 688,674
Cash and cash equivalents at end of period 2,315,358 2,315,358 471,318 471,318

Half Year Report 2020
www.ams.com page 12/39
Consolidated Statement of Changes in Shareholders’ Equity
according to IFRS (unaudited)
USD thousands Issued
capital
Additional
paid-in
capital
Treasury
shares
Other
reserves
Retained
earnings
Total
share-
holders‘
equity
Total equity as of 1 January 2019
92,997 782,090 -130,498 -19,992 700,602 1,425,199
Net result 0 0 0 0 15,492 15,492
Valuation of financial instruments
0 0 0 0 -1,948 -1,948
Exchange differences on translating foreign operations
0 0 0 11,762 0 11,762
Comprehensive income 0 0 0 11,762 13,545 25,307
Share based payments 0 16,223 0 0 0 16,223
Option right convertible bond 0 -11,575 0 0 11,431 -143
Purchase of treasury shares 0 0 -32,875 0 0 -32,875
Issue of treasury shares 0 0 1,989 0 0 1,989
Total equity as of 30 June 2019
92,997 786,738 -161,384 -8,230 725,578 1,435,699
Total equity as of 1 January 2020
92,997 792,112 -147,761 10,908 1,113,082 1,861,337
Net result 0 0 0 0 -9,804 -9,804
Valuation of financial instruments
0 0 0 0 -47,756 -47,756
Exchange differences on translating foreign operations
0 0 0 7,027 0 7,027
Comprehensive income 0 0 0 7,027 -57,560 -50,534
Share based payments 0 42,661 0 0 0 42,661
Capital increase 209,160 1,534,287 0 0 0 1,743,447
Purchase of treasury shares 0 0 -140,273 0 0 -140,273
Sale/Issue of treasury shares
0 0 147,844 0 0 147,844
Total equity as of 30 June 2020
302,157 2,369,060 -140,190 17,935 1,055,521 3,604,482
Half Year Report 2020
www.ams.com page 13/39
Selected Notes on the Condensed Consolidated Interim Financial
Statements as of 30 June 2020 (unaudited)
For consistency of presentation, selected information from the notes on the condensed consolidated
financial interim statements has been converted to USD.
1. Segment reporting and revenues
Segment information is presented on the basis of the internal reporting structure for the segments
“Consumer” and “Non-Consumer” and are determined according to valuation and accounting
regulations of IFRS. The Segment “Consumer” is comprised of products and sensor solutions targeting
the consumer and communications markets. The segment “Non-Consumer” is comprised of products
and sensor solutions targeting the automotive, industrial and medical markets as well as foundry,
where ams reports the contract manufacturing of analog/mixed signal ICs based on its customers’
designs.
In 2020 ams reorganized its segments and merged the former “Foundry” segment into the “Non-
Consumer” segment. 2019 figures have been reorganized accordingly to ensure comparability.
The geographic regions are structured by the three main regions in which sales occur: “EMEA”
(Europe, Middle East and Africa), “Americas” and “Asia/Pacific”. Revenues by geographical regions
are based on the geographical billing location of customers. Revenues from one customer of the
segment “Consumer” amounted to USD 229.7 million (1st half 2019: USD 152.4 million). This
customer is a distributor that serves different end customers.
The segment key figure “Result from operations” consists of gross profit, expenses for research &
development, expenses for selling, general and administrative as well as other operating income and
expenses.
The segment assets include solely assets that are directly attributable to the respective segment such
as customer receivables and segment-specific tangible and intangible assets as well as right of use
assets. For this reasons, assets that are used by both segments due to their equipment are not
allocated to a segment.
Half Year Report 2020
www.ams.com page 14/39
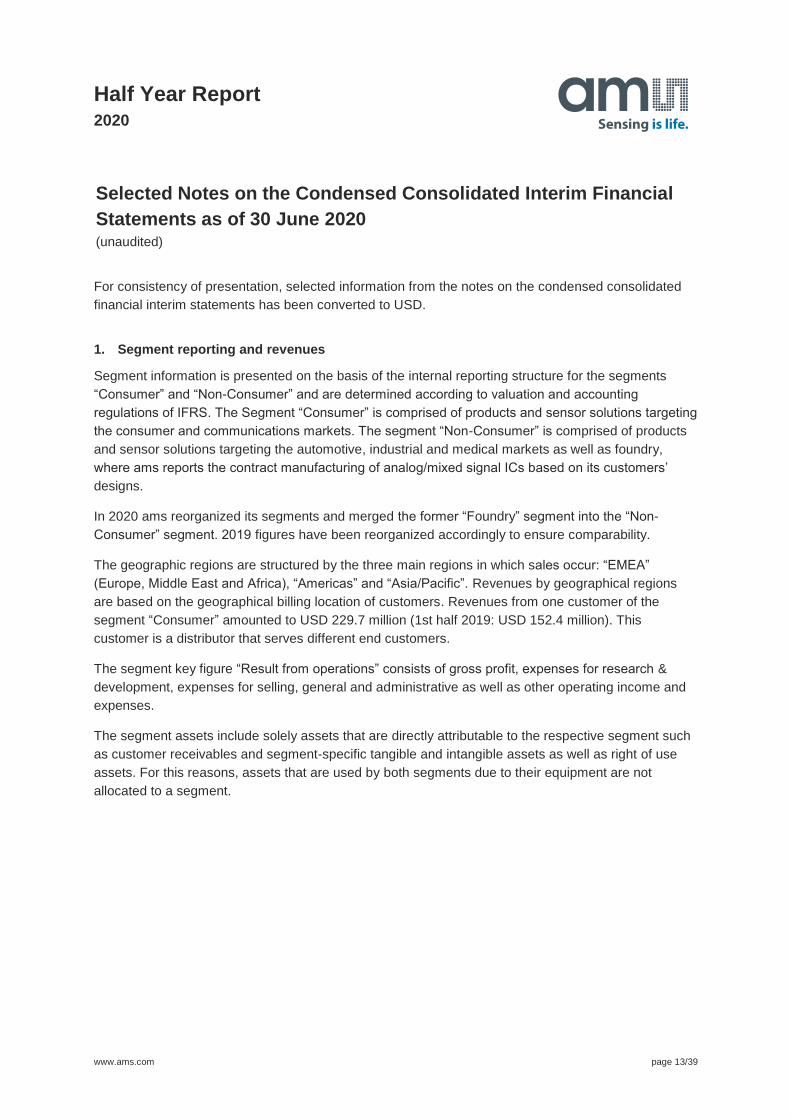
Business segments
USD thousands 1st Half 2020 1st Half 2019
Consumer Non-
Consumer Total Consumer
Non-Consumer
Total
Consolidated revenues
789,904 171,005 960,910 522,275 263,566 785,841
Research & development
93,792 30,486 124,278 65,377 54,779 120,155
Depreciation & Amortization
66,516 1,675 68,191 62,272 2,660 64,932
Result from operations
95,545 680 96,225 22,518 41,321 63,839
Segment assets 961,317 63,362 1,024,679 1,108,932 74,282 1,183,214
Reconciliation of segment results to income statement
USD thousands 1st Half 2020 1st Half 2019
Result from operations per segment reporting 96,225 63,839
Result from investments in associates -693 -85
Depreciation due to business combinations -37,484 -36,351
Unallocated research and development costs 6,914 -13,480
Subsidies for research and development 3,822 2,775
Unallocated income/expense 30,156 426
Result from operations 98,939 17,124
Reconciliation of segment assets to total assets
USD thousands 30 June 2020 31 Dec 2019
Assets per segment reporting 1,024,679 1,183,214
Intangible assets deriving from PPA 1,089,198 1,121,136
Property, plant and equipment 412,223 430,018
Inventories 246,337 231,533
Cash, cash equivalents and short-term investments 2,315,358 551,256
Deferred tax assets 7,998 9,417
Intangible assets 106,324 95,940
Right of use assets for administration and sales 19,116 14,800
Investments in associates 52,643 30,710
Financial assets 1,112,975 976,054
Assets held for sale 0 94,845
Accrual for financial transaction costs 56,299 105,193
Other assets 98,392 39,730
Total assets 6,541,542 4,883,846

Half Year Report 2020
www.ams.com page 15/39
Revenue by primary geographic segment
In the following table external revenues are split by the primary geographic segments.
USD thousands 1st Half 2020/2019
Consumer Non-Consumer Total
2020 2019 2020 2019 2020 2019
EMEA1) 45,276 58,789 98,193 133,153 143,469 191,941
Americas 4,796 3,062 22,309 19,250 27,105 22,312
Asia/Pacific 739,833 460,424 50,502 111,163 790,335 571,587
Total 789,904 522,275 171,005 263,566 960,910 785,841
1) Europe, Middle East, Africa
Revenues per country
USD thousands 1st Half 2020 1st Half 2019
Taiwan 424,805 331,384
Japan 242,430 100,555
Germany 62,150 72,055
Hong Kong 59,663 58,842
United Kingdom 44,624 67,600
China 31,002 46,946
Austria 401 815
Rest of the world 95,835 107,644
Total 960,910 785,841
Long-term assets per geographical segments
USD thousands 30 June 2020 31 Dec 2019
Austria 1,452,573 1,513,867
Singapore 877,835 935,991
Switzerland 103,542 91,910
Other countries 97,803 81,002
Total 2,531,753 2,622,769
2. Seasonality - economic cycles
In the past, results have varied from quarter to quarter as revenues are derived from a number of end
markets which may display different seasonal demand patterns over the course of a calendar year.
The company currently derives a substantial portion of its revenues from the consumer electronics
market, which has in the past displayed meaningful seasonality between quarters due to factors such
as consumer acceptance of technologies, changes in buying behavior and seasonal demand before

Half Year Report 2020
www.ams.com page 16/39
major holidays such as Christmas. In addition, general economic cycles may have an additional impact
on demand for the company’s products across end markets. As the net effect of the different factors
mentioned above may differ from quarter to quarter and cannot be predicted, variations of the
company’s quarterly results will continue in the future.
3. Financial Instruments
Summary of financial instruments recorded on the balance sheet as of 30 June 2020:
USD thousands FVOCI FVTPL At
amortized cost
Carrying amount
Fair value
Short-term financial assets
Cash and cash equivalents 0 0 2,315,358 2,315,358 2,315,358
Trade receivables 0 0 121,428 121,428 121,428
Other receivables and assets 0 0 106,959 106,959 106,959
Long-term financial assets 1,088,986 23,989 1,708 1,114,684 1,114,684
1,088,986 23,989 2,545,453 3,658,428 3,658,428
USD thousands Fair value
through P/L
At amortized
cost
Carrying amount
Fair value
Short-term financial liabilities
Interest bearing loans and borrowings 0 1,027,878 1,027,878 1,029,857
Trade payables 0 156,263 156,263 156,263
Other liabilities 4,237 83,649 87,886 87,886
Interest bearing loans and borrowings
0 1,231,845 1,231,845 1,234,217
Other long-term liabilities 2,554 113,583 116,137 116,137
6,791 2,613,218 2,620,009 2,624,361
Summary of financial instruments recorded on the balance sheet as of 31 December 2019:
USD thousands FVOCI FVTPL At
amortized cost
Carrying amount
Fair value
Short-term financial assets
Cash and cash equivalents 0 0 551,256 551,256 551,256
Trade receivables 0 0 222,404 222,404 222,404
Other receivables and assets 0 0 118,122 118,122 118,122
Long-term financial assets 942,647 33,407 652 976,706 976,706
942,647 33,407 892,435 1,868,489 1,868,489

Half Year Report 2020
www.ams.com page 17/39
USD thousands Fair value
through P/L
At amortized
cost
Carrying amount
Fair value
Short-term financial liabilities
Interest bearing loans and borrowings 0 861,004 861,004 867,163
Trade payables 0 149,224 149,224 149,224
Other liabilities 307 98,861 99,168 99,168
Interest bearing loans and borrowings
0 1,432,738 1,432,738 1,442,986
Other long-term liabilities 7,349 117,151 124,501 124,501
7,656 2,658,979 2,666,635 2,683,041
The following table shows, for the financial assets and liabilities measured at fair value, which level in
the fair value hierarchy is to be allocated to the fair value. The levels have the following meaning:
Level 1: Quoted prices (unadjusted) in active markets for identical assets and liabilities.
Level 2: inputs other than quoted prices included in Level 1 that are observable for the asset or liability,
either directly (i.e. as prices) or indirectly (i.e. derived from prices).
Level 3: inputs for the asset or liability that are not based on observable market data (unobservable
inputs).
June 30, 2020
USD thousands Level 1 Level 2 Level 3 Total
Short-term financial assets
Financial assets 0 0 0 0
Long-term financial assets
Financial assets 1,112,975 0 0 1,112,975
1,112,975 0 0 1,112,975
Short-term financial liabilities
Other liabilities 0 0 4,237 4,237
Long-term financial liabilities
Other liabilities 0 293 2,261 2,554
0 293 6,498 6,791

Half Year Report 2020
www.ams.com page 18/39
December 31, 2019
USD thousands Level 1 Level 2 Level 3 Total
Short-term financial assets
Financial assets 0 0 0 0
Long-term financial assets
Financial assets 976,054 0 652 976,706
976,054 0 652 976,706
Short-term financial liabilities
Other liabilities 0 0 21,986 21,986
Long-term financial liabilities
Other liabilities 0 868 124,501 125,369
0 868 146,486 147,355
On 12 March 2019 ams announced the repurchase of the issued USD and EUR convertible bonds
with a total volume of up to USD 100 million. The repurchase started on 27 March 2019 and was
upheld until 30 December 2019. By 30 June 2019, ams has repurchased 148 units of the USD
convertible bond and 339 units of the EUR convertible bond. This resulted in a financial profit of USD
18.0 million and a reduction of balance sheet liabilities of USD 91.8 million.
Material long-term financial assets relate to the investment in OSRAM Licht AG (USD 1,088 million)
and HLJ Technologies (USD 24.0 million). In the first half 2020 the group acquired additional
3,932,058 OSRAM shares for USD 194.6 million. The change in fair value of the shares of OSRAM
Licht AG is recorded in the OCI (FVOCI equity instruments, USD -47.8 million) and the change in fair
value for the holdings in HLJ Technologies is recorded in the net financing result with USD -9.6 million.
Other short and long-term financial liabilities measured at fair value through profit and loss relate to
contingent purchase price obligations resulting from the acquisition of KeyLemon in 2018 (30 June
2020 USD 2.6 million; 31 Dec. 2019 USD 2.5 million), of CCMOSS in 2016 (30 June 2020 USD 1
million; 31 Dec. 2019 USD 1.3 million) and Incus Laboratories in 2016 (30 June 2020 USD 2.7 million;
31 Dec. 2019 USD 2.9 million) and to the conversion right of the convertible USD bond issued (30
June 2020 USD 0.3 million, 31 Dec. 2019 USD 0.9 million). The total change in fair value of USD 0.6
million (first half year 2019 USD 0.0 million) is included in net financial result.
Fair values of short term financial assets, trade payables and other short term financial liabilities
(except those measured at fair value) are deemed to approximate their respective book value due to
their short term character. Long-term financial liabilities measured at amortized cost mainly relate to
lease liabilities in accordance with IFRS 16.
Effective 3 April 2020, ams AG issued 189,869,454 new shares leading to a net cash inflow of USD
1,817 million. The proceeds are used to partially refinance the acquisition of OSRAM Licht AG,
including related costs. In accordance with IAS 32 direct related costs to the rights issue were offset in
the balance sheet with the proceeds from the rights issue. This leads to a reduction by USD 73.1
million to USD 1,744 million.

Half Year Report 2020
www.ams.com page 19/39
On 15 June 2020 ams announced to its employees, that ams implements measures for anti-dilution in
connection with the rights issue for all stock option programs and long term incentive plans. In line with
IFRS 2 this led to a one-time valuation effect in Q2 2020 (USD 14.5 million), which results in overall
IFRS 2 expenses of USD 24.0 million in Q2 and USD 36.2 million in the first half year 2020.
4. Property, plant & equipment
The group acquired property plant and equipment amounting to USD 35.5 million, mainly for expansion
of production capacity and reinvestments for maintenance.
5. Intangible assets and goodwill
The group has assessed whether there is an impairment trigger that would lead to an impairment.
There was no indication for an impairment.
6. Assets held for sale
In March 2019, ams announced and signed an agreement to set up a joint venture with Wise Road
Capital to advance the development of environmental, flow and pressure sensors business for the
global market. The closing of the transaction in connection with the investment in Jinan Smart Sensing
Sensor Co in cooperation with Wise Road Capital took place on 13 January 2020. Consequently,
assets held for sale and related liabilities have been derecognized with a corresponding addition to
investment in associates.
7. Treasury shares
The group acquired a total of 13,714,464 treasury shares during the reporting period, amounting to
USD 140,272,893.
22,186 treasury shares have been sold to fulfill obligations for employee stock option plans. On 13
February 2020 the group sold 3,350,688 treasury shares (CHF 44.25 per share) amounting to a cash
inflow of USD 154.4 million. The aim of the placement was to enhance the ams shareholder base and
preventing dilution as treasury shares are not granted subscription rights under Austrian law.
8. Dividends
ams AG has not distributed any dividend during the reporting periods 2020 and 2019.
9. Number of employees
The average number of employees was 8,639 during the first half of 2020, compared to 8,543 during
the first half of 2019.
10. Related parties
There were no changes regarding the group’s related entities. Effective 1 May 2020, Ingo Bank joined
the Management Board of ams AG as chief financial officer (CFO), after stepping down from the
managing board of the OSRAM Group, and replacing Michael Wachsler-Markowitsch. There were no
other changes regarding group’s related parties in the reporting period.

Half Year Report 2020
www.ams.com page 20/39
11. Subsequent events
Effective on 6 July 2020 ams AG issued senior notes split into a EUR 650 million and USD 400 million
tranche, which have been issued at an issue price of 99%. The interest rate for the EUR tranche is 6%
and for the USD tranche 7%. The maturity date for both tranches is 31 July 2025. This led to net
proceeds of about USD 1.095 million. The proceeds are used to finance the proposed acquisition of
OSRAM, finance or refinance the purchase of other OSRAM shares, to refinance certain existing
indebtedness of OSRAM and its subsidiaries and/or ams and its subsidiaries and to pay certain fees
and expenses.
Furthermore effective on 20 July 2020 ams issues additional senior notes in connection with the
acquisition of OSRAM Licht AG. The additional notes are split into a EUR 200 million and USD 50
million tranches and were issued at an issue price of 100.75%. The interest rate for the EUR tranche is
6% and for the USD tranche 7%. The maturity date for both tranches is 31 July 2025. These leads to
net proceeds of about USD 270 million.
On 9 July 2020 ams successfully closed the acquisition of OSRAM Licht AG and settled the takeover
which led to a holding of about 69% of all OSRAM shares (excluding treasury shares) at closing date.
OSRAM Licht AG is a leading company in photonics, especially within the areas of illumination,
sensing, visualization and treatment. The headquarters of the OSRAM group are located in Munich,
Germany.
On 24 July 2020 Johann Eitner retired from the Supervisory Board of ams AG as a works council
representative. The ams’ works council will delegate a new employee representative in due course.
The Covid-19 situation is expected to have a limited impact on the group’s business. At the time of
statement of the interim financial statement, the Management Board of the Company is not aware of
material negative effects of Covid-19 on the group. However the general uncertainties in a Covid-19
economic environment remain.

Half Year Report 2020
www.ams.com page 21/39
Supplemental financial information

Half Year Report 2020
www.ams.com page 22/39
Reconciliation from adjusted figures to reported figures
USD thousands Q2 2020 1st Half 2020 Q2 2019 1st Half 2019
Gross profit – adjusted 183,273 380,137 152,521 274,918
Acquisition-related costs -10,548 -21,077 -10,337 -20,557
Share-based compensation costs -1,982 -2,661 -869 -1,614
Gross profit – reported 170,743 356,399 141,315 252,746
Gross margin in % – adjusted 40% 40% 37% 35%
Gross margin in % – IFRS reported 37% 37% 35% 32%
Operating expenses – adjusted -93,204 -189,153 -103,513 -203,107
Acquisition-related costs -16,319 -34,716 -7,447 -15,794
Share-based compensation costs -21,995 -33,591 -8,898 -16,721
Operating expenses – reported -131,517 -257,460 -119,858 -235,622
Result from operations – adjusted 90,068 190,984 49,008 71,810
Acquisition-related costs -26,867 -55,794 -17,784 -36,351
Share-based compensation costs -23,976 -36,252 -9,767 -18,335
Result from operations – reported 39,226 98,939 21,457 17,124
Operating margin in % – adjusted 20% 20% 12% 9%
Operating margin in % – reported 9% 10% 5% 2%
Result from operations – adjusted 90,068 190,984 49,008 71,810
Net financing result -32,160 -104,975 4,972 2,234
Income tax result -1,144 -3,768 -1,754 -3,865
Net result – adjusted 56,765 82,241 52,226 70,179
Basic adjusted earnings per share (in USD)
0.22 0.48 0.65 0.87

Condensed Consolidated Interim
Financial Statements as of
30 June 2020
(according to IAS 34 – unaudited)
Half Year Report 2020 (according to IAS 34)
www.ams.com page 24/39
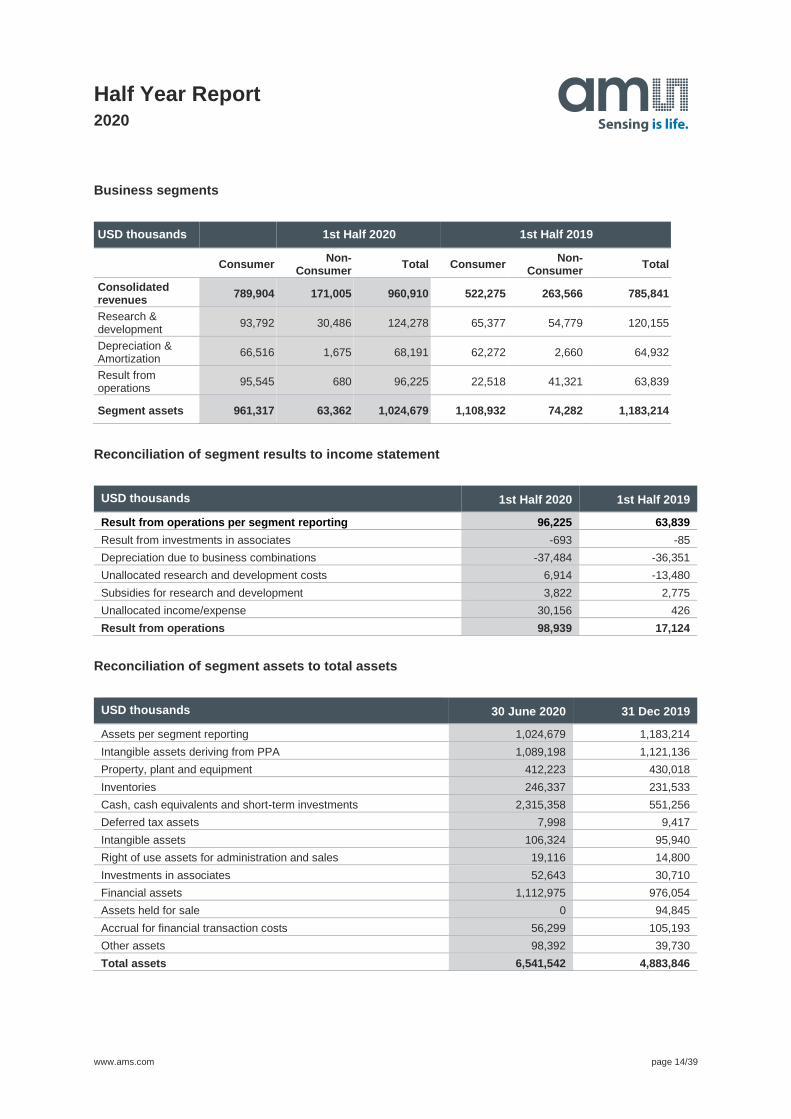
Consolidated Income Statement according to IFRS (unaudited)
EUR thousands (except earnings per share)
Q2 2020 1st Half 2020 Q2 2019 1st Half 2019
Revenues 417,869 872,285 369,728 713,363
Cost of sales -262,873 -548,757 -241,446 -483,928
Gross profit 154,996 323,529 128,282 229,435
Gross margin in % 37% 37% 35% 32%
Research and development -62,017 -121,406 -68,480 -138,068
Selling, general and administrative -59,170 -117,677 -42,227 -81,206
Other operating income 2,385 5,899 2,267 5,921
Other operating expense -87 98 -421 -460
Result from investments in associates -499 -629 58 -77
Result from operations 35,608 89,814 19,478 15,544
Net financing result -29,194 -95,293 4,513 2,028
Result before tax 6,414 -5,479 23,991 17,572
Income tax result -1,039 -3,420 -1,592 -3,509
Net result 5,375 -8,900 22,399 14,064
Basic earnings per share in CHF 1) 0.02 -0.06 0.31 0.19
Diluted earnings per share in CHF 1) 0.01 0.00 0.28 0.19
Basic earnings per share in EUR 0.02 -0.05 0.28 0.17
Diluted earnings per share in EUR 0.01 0.00 0.25 0.17
1) Earnings per share in CHF were converted using the average currency exchange rate for the respective periods.

Half Year Report 2020 (according to IAS 34)
www.ams.com page 25/39
Consolidated Statement of Comprehensive Income acc. to IFRS
(unaudited)
EUR thousands Q2 2020
1st Half
2020 Q2 2019
1st Half
2019
Net result 5,375 -8,900 22,399 14,064
Items that will never be reclassified to profit and loss (after income taxes)
Remeasurements of defined benefit liability 0 0 0 -14
FVOCI equity instruments - net change in fair value 225,517 -43,352 -11 -1,754
Items that may be reclassified to profit and loss (after income taxes)
FVOCI debt instruments - net change in fair value 0 0 0 0
Exchange differences on translating foreign operations -45,179 6,379 -26,221 10,677
Other comprehensive income 180,338 -36,973 -26,232 8,909
Total comprehensive income 185,713 -45,873 -3,833 22,973

Half Year Report 2020 (according to IAS 34)
www.ams.com page 26/39
Consolidated Balance Sheet according to IFRS (unaudited)
EUR thousands 30 June 2020 31 December 2019
Assets
Cash and cash equivalents 2,101,814 500,414
Trade receivables 110,228 201,892
Inventories 223,618 210,178
Other receivables and assets 136,437 129,696
Assets held for sale 0 86,097
Total current assets 2,572,097 1,128,277
Property, plant and equipment 1,070,870 1,130,078
Intangible assets 1,108,749 1,127,974
Right of use assets 118,631 122,820
Investments in associates 47,788 27,878
Deferred tax assets 7,261 8,548
Other long term assets 2,497 1,803
Financial assets 1,010,326 886,033
Total non-current assets 3,366,123 3,305,134
Total assets 5,938,219 4,433,412
Liabilities and shareholders' equity
Liabilities
Interest-bearing loans and borrowings 933,077 781,594
Trade liabilities 141,851 135,461
Income tax liabilities 23,648 19,649
Provisions 99,479 112,711
Other liabilities 122,387 153,396
Liabilities in regard to assets held for sale 0 1,336
Total current liabilities 1,320,442 1,204,147
Interest-bearing loans and borrowings 1,118,233 1,300,597
Employee benefits 48,729 48,981
Deferred tax liabilities 60,230 62,612
Other long-term liabilities 118,543 127,407
Total non-current liabilities 1,345,735 1,539,598
Shareholders' equity
Issued capital 274,289 84,420
Additional paid-in capital 2,150,562 719,056
Treasury shares -127,261 -134,133
Other reserves 16,281 9,902
Retained earnings 958,171 1,010,423
Total shareholders' equity and reserves 3,272,043 1,689,667
Total liabilities and shareholders' equity 5,938,219 4,433,412

Half Year Report 2020 (according to IAS 34)
www.ams.com page 27/39
Consolidated Statement of Cash Flows according to IFRS (unaudited)
EUR thousands Q2 2020 1st Half 2020 Q2 2019 1st Half 2019
Operating activities
Result before tax 6,414 -5,479 23,991 17,572
Depreciation (net of government grants) 75,206 151,029 68,476 135,849
Expense from stock option plan 21,755 32,887 8,727 16,483
Changes in other long-term liabilities -1 -129 -4,938 -3,841
Result from sale of plant and equipment -1 -13 -4 -4
Result from investments in associates 499 629 -58 77
Net financing cost 29,194 95,293 -4,513 -2,028
Change in provisions and employee benefits -22,441 -13,858 -2,442 2,063
Changes in inventories -1,617 -12,965 -6,223 13,438
Changes in trade and other receivables -7,911 36,431 -44,143 -41,847
Changes in trade and other payables -5,318 26,026 9,618 -3,553
Income taxes paid 653 -683 -3,339 -4,444
Cash flows from operating activities 96,432 309,170 45,154 129,764
Investing activities
Acquisition of intangibles, property, plant and equipment
-18,067 -51,493 -42,679 -120,074
Acquisition of subsidiary, net of cash acquired 0 0 0 -8,099
Acquisition of other financial investments -24,805 -180,949 0 0
Proceeds from sale of plant and equipment 0 2 1 1
Proceeds from the sale of discontinued business area
0 41,414 0 0
Interest received 915 2,963 1,525 2,974
Cash flows from investing activities -41,956 -188,063 -41,154 -125,198
Financing activities
Proceeds from borrowings 1,786 92,495 200 12,654
Repayment of borrowings -107,582 -137,961 -61,400 -96,897
Repayment of finance lease liabilities -6,881 -10,894 -5,937 -9,463
Buyback of convertible bonds 0 0 -67,128 -67,128
Acquisition of treasury shares -127,336 -127,336 -2,827 -30,461
Sale of treasury shares 129 140,365 576 1,646
Interest paid -7,766 -18,083 -2,808 -8,406
Transaction costs from loans and borrowings -95,875 -107,018 0 0
Changes resulting from capital increase 1,649,000 1,649,000 0 0
Cash flows from financing activities 1,305,476 1,480,569 -139,325 -198,056
Change in cash and cash equivalents 1,359,952 1,601,675 -135,325 -193,490
Effects of changes in foreign exchange rates on cash and cash equivalents
-7,824 -276 -6,234 -3,819
Cash and cash equivalents at begin of period 749,686 500,414 569,407 625,158
Cash and cash equivalents at end of period 2,101,814 2,101,814 427,849 427,849

Half Year Report 2020 (according to IAS 34)
www.ams.com page 28/39
Consolidated Statement of Changes in Shareholders’ Equity
according to IFRS (unaudited)
EUR thousands Issued
capital
Additional
paid-in
capital
Treasury
shares
Other
reserves
Retained
earnings
Total
share-
holders‘
equity
Total equity as of
1 January 2019 84,420 709,958 -118,462 -18,148 635,986 1,293,754
Net result 0 0 0 0 14,064 14,064
Valuation of financial
instruments 0 0 0 0 -1,768 -1,768
Exchange differences on
translating foreign operations 0 0 0 10,677 0 10,677
Comprehensive income 0 0 0 10,677 12,296 22,973
Share based payments 0 14,726 0 0 0 14,726
Option right convertible bond 0 -10,507 0 0 10,377 -130
Purchase of treasury shares 0 0 -29,843 0 0 -29,843
Issue of treasury shares 0 0 1,805 0 0 1,805
Total equity as of
30 June 2019 84,420 714,177 -146,499 -7,471 658,658 1,303,286
Total equity as of
1 January 2020 84,420 719,056 -134,133 9,902 1,010,423 1,689,667
Net result 0 0 0 0 -8,900 -8,900
Valuation of financial
instruments 0 0 0 0 -43,352 -43,352
Exchange differences on
translating foreign operations 0 0 0 6,379 0 6,379
Comprehensive income 0 0 0 6,379 -52,251 -45,873
Share based payments 0 38,726 0 0 0 38,726
Capital increase 189,869 1,392,780 0 0 0 1,582,650
Purchase of treasury shares 0 0 -127,336 0 0 -127,336
Sale/Issue of treasury
shares 0 0 134,208 0 0 134,208
Total equity as of
30 June 2020 274,289 2,150,562 -127,261 16,281 958,171 3,272,043

Half Year Report 2020 (according to IAS 34)
www.ams.com page 29/39
Selected notes on the Condensed Consolidated Interim Financial
Statements as of 30 June 2020 (unaudited)
1. Basis of preparation
The condensed consolidated interim financial statements as of 30 June 2020 were prepared in
accordance with IAS 34. In line with IAS 34 (Interim Financial Reporting) the condensed consolidated
interim financial statements do not include all information and disclosures that are required for a full
set of financial statements and should be read in conjunction with the Group’s last annual
consolidated financial statements as at and for the year ended 31 December 2019.
2. Accounting policies
The accounting policies applied in this interim financial statement are the same as those applied in the
group’s consolidated financial statements as at and for the year ended 31 December 2019. A number
of new standards or amendments are effective from 1 January 2020, however none of these have a
material effect on the group’s consolidated financial statements.
3. Segment reporting and revenues
Segment information is presented on the basis of the internal reporting structure for the segments
“Consumer” and “Non-Consumer” and are determined according to valuation and accounting
regulations of IFRS. The Segment “Consumer” is comprised of products and sensor solutions targeting
the consumer and communications markets. The segment “Non-Consumer” is comprised of products
and sensor solutions targeting the industrial, medical, and automotive markets as well as foundry,
where ams reports the contract manufacturing of analog/mixed signal ICs based on its customers’
designs.
In 2020 ams reorganized its segments and merged the former “Foundry” segment into the “Non-
Consumer” segment. 2019 figures have been reorganized accordingly to ensure comparability.
The geographic regions are structured by the three main regions in which sales occur: “EMEA”
(Europe, Middle East and Africa), “Americas” and “Asia/Pacific”. Revenues by geographical regions
are based on the geographical billing location of customers. Revenues from one customer of the
segment Consumer amounted to EUR 208.5 million (1st half 2019: EUR 138.4 million). This customer
is a distributor that serves different end customers.
The segment key figure “Result from operations” consists of gross profit, expenses for research and
development, expenses for selling, general and administrative as well as other operating income and
expenses.
The segment assets include solely assets that are directly attributable to the respective segment such
as customer receivables and segment-specific tangible and intangible assets as well as right of use
assets. For this reasons, assets that are used by both segments due to their equipment are not
allocated to a segment.

Half Year Report 2020 (according to IAS 34)
www.ams.com page 30/39
Business Segments
EUR thousands 1st Half 2020 1st Half 2019
Consumer Non-
Consumer Total Consumer
Non-Consumer
Total
Consolidated revenues
717,052 155,234 872,285 474,106 239,257 713,363
Research & development
85,142 27,674 112,816 59,347 49,727 109,073
Depreciation & Amortization
60,381 1,520 61,902 56,529 2,415 58,944
Result from operations
86,733 618 87,350 20,441 37,510 57,951
Segment assets 872,655 57,518 930,173 1,006,656 67,431 1,074,087
Reconciliation of segment results to income statement
EUR thousands 1st Half 2020 1st Half 2019
Result from operations per segment reporting 87,350 57,951
Result from investments in associates -629 -77
Depreciation due to business combinations -34,027 -32,999
Unallocated research and development costs 6,276 -12,237
Subsidies for research and development 3,469 2,519
Unallocated income 27,375 387
Result from operations 89,814 15,544
Reconciliation of segment assets to total assets
EUR thousands 30 June 2020 31 Dec 2019
Assets per segment reporting 930,173 1,074,087
Intangible assets deriving from PPA 988,742 1,017,735
Property, plant and equipment 374,204 390,358
Inventories 233,618 210,178
Cash, cash equivalents and short-term investments 2,101,814 500,414
Deferred tax asset 7,261 8,548
Intangible assets 96,518 87,091
Right of use assets for administration and sales 17,353 13,435
Investments in associates 47,788 27,878
Financial assets 1,010,326 886,033
Assets held for sale 0 86,097
Accrual for financial transaction costs 51,106 95,491
Other assets 89,317 36,066
Total assets 5,938,219 4,433,412

Half Year Report 2020 (according to IAS 34)
www.ams.com page 31/39
Revenue by primary geographic segment
In the following table the external revenue is split by the primary geographic segments.
EUR thousands 1st Half 2020/2019
Consumer Non-Consumer Total
2020 2019 2020 2019 2020 2019
EMEA1) 41,100 53,367 89,137 120,872 130,237 174,239
Americas 4,353 2,780 20,252 17,475 24,605 20,254
Asia/Pacific 671,598 417,959 45,845 100,911 717,443 518,870
Total 717,052 474,106 155,234 239,257 872,285 713,363
1) Europe, Middle East, Africa
Revenues per country
EUR thousands 1st Half 2020 1st Half 2019
Taiwan 385,625 300,821
Japan 220,070 91,281
Germany 56,418 65,409
Hong Kong 54,160 53,415
United Kingdom 40,509 61,365
China 28,143 42,617
Austria 364 739
Rest of the world 86,996 97,716
Total 872,285 713,363
Long-term assets per geographical segments
EUR thousands 30 June 2020 31 Dec 2019
Austria 1,318,603 1,374,243
Singapore 796,873 849,665
Switzerland 93,992 83,433
Other countries 88,783 73,531
Total 2,298,251 2,380,873

Half Year Report 2020 (according to IAS 34)
www.ams.com page 32/39
4. Seasonality - economic cycles
In the past, results have varied from quarter to quarter as revenues are derived from a number of end
markets which may display different seasonal demand patterns over the course of a calendar year.
The company currently derives a substantial portion of its revenues from the consumer electronics
market, which has in the past displayed meaningful seasonality between quarters due to factors such
as consumer acceptance of technologies, changes in buying behavior and seasonal demand before
major holidays such as Christmas. In addition, general economic cycles may have an additional impact
on demand for the company’s products across end markets. As the net effect of the different factors
mentioned above may differ from quarter to quarter and cannot be predicted, variations of the
company’s quarterly results will continue in the future.
5. Financial Instruments
Summary of financial instruments recorded on the balance sheet as of 30 June 2020:
EUR thousands FVOCI FVTPL At
amortized cost
Carrying amount
Fair value
Short-term financial assets
Cash and cash equivalents 0 0 2,101,814 2,101,814 2,101,814
Trade receivables 0 0 110,228 110,228 110,228
Other receivables and assets 0 0 97,094 97,094 97,094
Long-term financial assets 988,550 21,777 1,551 1,011,877 1,011,877
988,550 21,777 2,310,687 3,321,013 3,321,013
EUR thousands Fair value
through P/L
At amortized
cost
Carrying amount
Fair value
Short-term financial liabilities
Interest bearing loans and borrowings 0 933,077 933,077 934,874
Trade payables 0 141,851 141,851 141,851
Other liabilities 3,846 75,934 79,780 79,780
Interest bearing loans and borrowings
0 1,118,233 1,118,233 1,120,386
Other long-term liabilities 2,318 103,108 105,426 105,426
6,164 2,372,203 2,378,367 2,382,318

Half Year Report 2020 (according to IAS 34)
www.ams.com page 33/39
Summary of financial instruments recorded on the balance sheet as of 31 December 2019:
EUR thousands FVOCI FVTPL At
amortized cost
Carrying amount
Fair value
Short-term financial assets
Cash and cash equivalents 0 0 500,414 500,414 500,414
Trade receivables 0 0 201,892 201,892 201,892
Other receivables and assets 0 0 107,228 107,228 107,228
Long-term financial assets 855,707 30,326 592 886,625 886,625
855,707 30,326 810,126 1,696,159 1,696,159
EUR thousands Fair value
through P/L
At amortized
cost
Carrying amount
Fair value
Short-term financial liabilities
Interest bearing loans and borrowings 0 781,594 781,594 787,185
Trade payables 0 135,461 135,461 135,461
Other liabilities 279 89,743 90,022 90,022
Interest bearing loans and borrowings
0 1,300,597 1,300,597 1,309,900
Other long-term liabilities 6,671 106,347 113,018 113,018
6,950 2,413,743 2,420,693 2,435,586
The following table shows, for the financial assets and liabilities measured at fair value, which level in
the fair value hierarchy is to be allocated to the fair value. The levels have the following meaning:
Level 1: Quoted prices (unadjusted) in active markets for identical assets and liabilities.
Level 2: inputs other than quoted prices included in Level 1 that are observable for the asset or liability,
either directly (i.e. as prices) or indirectly (i.e. derived from prices).
Level 3: inputs for the asset or liability that are not based on observable market data (unobservable
inputs).

Half Year Report 2020 (according to IAS 34)
www.ams.com page 34/39
30 June 2020
EUR thousands Level 1 Level 2 Level 3 Total
Short-term financial assets
Financial assets 0 0 0 0
Long-term financial assets
Financial assets 1,010,326 0 0 1,010,326
1,010,326 0 0 1,010,326
Short-term financial liabilities
Other liabilities 0 0 3,846 3,846
Long-term financial liabilities
Other liabilities 0 266 2,052 2,318
0 266 5,899 6,164
31 December 2019
EUR thousands Level 1 Level 2 Level 3 Total
Short-term financial assets
Financial assets 0 0 0 0
Long-term financial assets
Financial assets 886,033 0 592 886,625
886,033 0 592 886,625
Short-term financial liabilities
Other liabilities 0 0 19,958 19,958
Long-term financial liabilities
Other liabilities 0 788 113,018 113,806
0 788 132,976 133,764
On 12 March 2019, ams announced the repurchase of the issued USD and EUR convertible bonds
with a total volume of up to USD 100 million. The repurchase started on 27 March 2019 and was
upheld until 30 December 2019. By 30 June 2019, ams has repurchased 148 units of the USD
convertible bond and 339 units of the EUR convertible bond. This resulted in a financial profit of EUR
16.3 million and a reduction of balance sheet liabilities of EUR 83.4 million.
Material long-term financial assets relate to the investment in OSRAM Licht AG (EUR 987.6 million)
and HLJ Technologies (EUR 21.8 million). In the first half 2020 the group acquired additional
3,932,058 OSRAM shares for EUR 176.7 million. The change in fair value of the shares of OSRAM
Licht AG is recorded in the OCI (FVOCI equity instruments, EUR -43.4 million) and the change in fair
value for the holdings in HLJ Technologies is recorded in the net financing result with EUR -8.7 million.
Half Year Report 2020 (according to IAS 34)
www.ams.com page 35/39
Other short and long-term financial liabilities measured at fair value through profit and loss relate to
contingent purchase price obligations resulting from the acquisition of KeyLemon in 2018 (30 June
2020 EUR 2.3 million; 31 Dec. 2019 EUR 2.3 million), of CCMOSS in 2016 (30 June 2020 EUR 0.9
million; 31 Dec. 2019 EUR 1.2 million) and Incus Laboratories in 2016 (30 June 2020 EUR 2.5 million;
31 Dec. 2019 EUR 2.7 million) and to the conversion right of the convertible USD bond issued (30
June 2020 EUR 0.3 million; 31 Dec. 2019 EUR 0.8 million). The total change in fair value of EUR 0.5
million (first half year 2019 EUR 0.0 million) is included in net financial result.
Fair values of short term financial assets, trade payables and other short term financial liabilities
(except those measured at fair value) are deemed to approximate their respective book value due to
their short term character. Long-term financial liabilities measured at amortized cost mainly relate to
lease liabilities in accordance with IFRS 16.
Effective 3 April 2020, ams AG issued 189,869,454 new shares leading to a net cash inflow of EUR
1,649 million. The proceeds are used to partially refinance the acquisition of OSRAM Licht AG,
including related costs. In accordance with IAS 32 direct related costs to the rights issue were offset in
the balance sheet with the proceeds from the rights issue. This leads to a reduction by EUR 66.4
million to EUR 1,583 million.
On 15 June 2020, ams announced to its employees, that ams implements measures for anti-dilution in
connection with the rights issue for all stock option programs and long term incentive plans. In line with
IFRS 2 this led to a one-time valuation effect in Q2 2020 (EUR 13.2 million), which results in overall
IFRS 2 expenses of EUR 21.8 million in Q2 and EUR 32.9 million in the first half year 2020.
6. Property, plant & equipment
The group acquired property plant and equipment amounting to EUR 32.2 million, mainly for
expansion of production capacity and reinvestments for maintenance.
7. Intangible assets and goodwill
The group has assessed whether there is an impairment trigger that would lead to an impairment.
There was no indication for an impairment.
8. Assets held for sale
In March 2019, ams announced and signed an agreement to set up a joint venture with Wise Road
Capital to advance the development of environmental, flow and pressure sensors business for the
global market. The closing of the transaction in connection with the investment in Jinan Smart Sensing
Sensor Co in cooperation with Wise Road Capital took place on 13 January 2020. Consequently,
assets held for sale and related liabilities have been derecognized with a corresponding addition to
investment in associates.
9. Treasury shares
The group acquired a total of 13,714,464 treasury shares during the reporting period, amounting to
EUR 127,335,596.
22,186 treasury shares have been sold to fulfill obligations for employee stock option plans. On 13
February 2020 the group sold 3,350,688 treasury shares (CHF 44.25 per share) amounting to a cash

Half Year Report 2020 (according to IAS 34)
www.ams.com page 36/39
inflow of EUR 140.2 million. The aim of the placement was to enhance the ams shareholder base and
preventing dilution as treasury shares are not granted subscription rights under Austrian law.
10. Dividends
ams AG has not distributed any dividend during the reporting periods 2020 and 2019.
11. Number of employees
The average number of employees was 8,639 during the first half of 2020, compared to 8,543 during
the first half of 2019.
12. Related parties
There were no changes regarding the group’s related entities. Effective 1 May 2020, Ingo Bank joined
the Management Board of ams AG as chief financial officer (CFO), after stepping down from the
managing board of the OSRAM Group, and replacing Michael Wachsler-Markowitsch. There were no
other changes regarding group’s related parties in the reporting period.
13. Subsequent events
Effective on 6 July 2020 ams AG issued a high yield bond split into a EUR 650 million and USD 400
million tranche, which have been issued at an issue price of 99%. The interest rate for the EUR
tranche is 6% and for the USD tranche 7%. The maturity date for both tranches is 31 July 2025. This
led to net proceeds of about EUR 995 million. The proceeds are used to finance the proposed
acquisition of OSRAM, finance or refinance the purchase of other OSRAM shares, to refinance certain
existing indebtedness of OSRAM and its subsidiaries and/or ams and its subsidiaries and to pay
certain fees and expenses.
Furthermore effective on 20 July 2020, ams issues additional senior notes in connection with the
acquisition of OSRAM Licht AG. The additional notes are split into a EUR 200 million and USD 50
million tranches and were issued at an issue price of 100.75%. The interest rate for the EUR tranche is
6% and for the USD tranche 7%. The maturity date for both tranches is 31 July 2025. This led to net
proceeds of about EUR 246 million.
On 9 July 2020 ams successfully closed the acquisition of OSRAM Licht AG and settled the takeover
which led to a holding of about 69% of all OSRAM shares (excluding treasury shares) at closing date.
OSRAM Licht AG is a leading company in photonics, especially within the areas of illumination,
sensing, visualization and treatment. The headquarters of the OSRAM group are located in Munich,
Germany.
On 24 July 2020 Johann Eitner retired from the Supervisory Board of ams AG as a works council
representative. The ams’ works council will delegate a new employee representative in due course.
The Covid-19 situation is expected to have a limited impact on the group’s business. At the time of
statement of the interim financial statement, the Management Board of the Company is not aware of
material negative effects of Covid-19 on the group. However the general uncertainties in a Covid-19
economic environment remain.

Half Year Report 2020 (according to IAS 34)
www.ams.com page 37/39
Supplemental financial information

Half Year Report 2020 (according to IAS 34)
www.ams.com page 38/39
Reconciliation from adjusted figures to reported figures according
to IFRS
EUR thousands Q2 2020 1st Half 2020 Q2 2019 1st Half 2019
Gross profit – adjusted 166,370 345,078 138,454 249,562
Acquisition-related costs -9,575 -19,133 -9,384 -18,661
Share-based compensation costs -1,799 -2,415 -789 -1,466
Gross profit – IFRS reported 154,996 323,529 128,282 229,435
Gross margin in % – adjusted 40% 40% 37% 35%
Gross margin in % – IFRS reported 37% 37% 35% 32%
Operating expenses – adjusted -84,608 -171,708 -93,966 -184,375
Acquisition-related costs -14,814 -31,515 -6,760 -14,338
Share-based compensation costs -19,966 -30,493 -8,077 -15,178
Operating expenses – IFRS reported -119,388 -233,715 -108,804 -213,891
Result from operations – adjusted 81,762 173,370 44,488 65,187
Acquisition-related costs -24,389 -50,648 -16,144 -32,999
Share-based compensation costs -21,765 -32,908 -8,866 -16,644
Result from operations – IFRS reported
35,608 89,814 19,478 15,544
Operating margin in % – adjusted 20% 20% 12% 9%
Operating margin in % – IFRS reported 9% 10% 5% 2%
Result from operations – adjusted 81,762 173,370 44,488 65,187
Net financing result -29,194 -95,293 4,513 2,028
Income tax result -1,039 -3,420 -1,592 -3,509
Net result – adjusted 51,529 74,656 47,409 63,706
Basic adjusted earnings per share (in
EUR) 0.20 0.44 0.59 0.79

Half Year Report 2020 (according to IAS 34)
www.ams.com page 39/39
ams AG
Tobelbader Strasse 30
8141 Premstaetten, Austria
T +43 3136 500-0
www.ams.com
This report is also available in German. All figures are unaudited.