2020 Half Year Report 2020 guidance confirmed - Givaudan
27
2020 Half Year Report 2020 guidance confirmed
Transcript of 2020 Half Year Report 2020 guidance confirmed - Givaudan

Givaudan – 2020 Half Year Report
1
2020 Half Year Report2020 guidance confirmed

Givaudan – 2020 Half Year Report
2
Creating for happier, healthier lives, with love for nature.Let’s imagine together.
Givaudan is committed to driving responsible, long-term growth while leading the way to improve happiness and health for people and nature. With a heritage stretching back over 250 years, we have a long history of innovating scents and tastes, and are proud to be the industry leader, with approximately 25% of market share of the fragrance and flavour industry.
Together with our customers in the food, beverage, consumer goods and fragrance and cosmetics industries, we create products that delight consumers the world over. With a passion to understand consumer preferences and a relentless drive to innovate, we are at the forefront of creating scents and tastes that touch consumers’ emotions.
Table of contents
03 At a glance
05 Business performance
07 Fragrance Division
08 Flavour Division
09 Half Year Financial Report

Givaudan – 2020 Half Year Report
3 - At a glance
Key Figures
At a glanceFirst half of 2020
For the six months ended 30 June, in millions of Swiss francs, except for earnings per share data 2020 2019Percentage
change
Group sales 3,221 3,094 4.1%Fragrance sales 1,456 1,361 7.0%Flavour sales 1,765 1,733 1.9%Like-for-like sales growth 4.0% 6.3%Gross profit 1,359 1,274 6.7%as % of sales 42.2% 41.2%EBITDA a 734 660 11.3%as % of sales 22.8% 21.3%Operating income 532 491 8.4%as % of sales 16.5% 15.9%Income attributable to equity holders of the parent 413 380 8.8%as % of sales 12.8% 12.3%Operating cash flow 359 271 32.5%as % of sales 11.1% 8.8%Free cash flow b 178 148 20.3%as % of sales 5.5% 4.8%Earnings per share − basic (CHF) 44.81 41.24 8.7%
a) EBITDA defined as Earnings before interest (and other financial income (expense), net), Tax, Depreciation and Amortisation, corresponds to operating income before depreciation, amortisation and impairment of long-lived assets.
b) Free Cash Flow refers to operating cash flow after net investments, interest paid and lease payments.
in millions of Swiss francs
2019 Sales
as reportedlike-for-like
development
2020 Sales
like-for-like
Change % on like-for-like
basisAcquisition
impact (net)Currency
effects
2020 Sales
as reportedChange %
in Swiss francs
Group 3,094 125 3,219 4.0% 194 (192) 3,221 4.1%- Fragrance 1,361 62 1,423 4.5% 127 (94) 1,456 7.0%- Flavour 1,733 63 1,796 3.6% 67 (98) 1,765 1.9%
Sales performance from January to June
Sales evolution by market – January to June
in millions of Swiss francs
2019 Sales
as reportedlike-for-like
development
2020 Sales
like-for-like
Change % on like-for-like
basisAcquisition
impact (net)Currency
effects
2020 Sales
as reportedChange %
in Swiss francs
Mature markets 1,802 9 1,811 0.5% 128 (71) 1,868 3.4%High growth markets 1,292 116 1,408 9.0% 66 (121) 1,353 5.1%
Note: Like-for-like (LFL) is defined as: (a) sales calculated using the invoicing exchange rates of the prior year, (b) excluding sales of businesses acquired from the acquisition date until the period end date, up to 12 months from the acquisition date, and (c) excluding sales of the businesses disposed of from the disposal date until the period end date of the comparable prior period.

Givaudan – 2020 Half Year Report
Building on our capabilities• Strengthening our speciality ingredient capabilities and our leadership in the fast growing local
and regional customer segment with the acquisition of Ungerer• The announcement to acquire Alderys is part of our long-term strategy to expand our
capabilities in bio-engineering technologies• The acquisition of the cosmetic ingredients business of Indena further enables sustainable value
creation and strengthens our global Active Beauty capabilities in botanical active cosmeticingredients
• Partnership with start-up company Kaffe Bueno brings innovative facial skin care benefits toconsumers through the launch of Koffee’Up ™, a scientifically proven premium coffee oil craftedusing upcycling techniques
Performance summary• Strong financial performance in a very challenging environment related to COVID-19 pandemic• Global Manufacturing and supply chain sustained with minimal disruption• Both divisions and all geographical regions contributed to the good growth• Strong sales growth in those product categories which were not impacted by the COVID-19
pandemic• Strategic focus areas and acquired companies continuing to contribute positively
4 - At a glance
At a glance
“Our strong performance in the first half of 2020 demonstrates our market leadership and the important role that we play in sustaining the global supply chain in food and beverage as well as in household, health and personal care products,” said CEO Gilles Andrier. “I am very proud of the entire Givaudan organisation for their dedication during this challenging period and for enabling us to continue to support our customers to keep critical products available to consumers throughout the COVID-19 crisis.”
Looking towards the future• Delivery of 2020 guidance is fully on track• Continued integration of acquired companies on to our operating platforms• GBS almost fully implemented across the Company: GBS delivery centres working effectively
within the broader Givaudan organisation• Finalising our strategic roadmap for 2021-2025 in line with the Company’s purpose

Givaudan – 2020 Half Year Report
5 - Business performance - Group
Group EBITDAin millions of Swiss francs
638
597
601
660
734
2016
2017
2018
2019
2020
2,334
2,483
2,674
3,094
3,221
2016
2017
2018
2019
2020
Business performanceGivaudan Group sales for the first six months of the year were CHF 3,221 million, an increase of 4.0% on a like-for-like basis and 4.1% in Swiss francs.
Fragrance Division sales were CHF 1,456 million, an increase of 4.5% on a like-for-like basis and 7.0% in Swiss francs.
Flavour Division sales were CHF 1,765 million, an increase of 3.6% on a like-for-like basis and 1.9% in Swiss francs.
As the COVID-19 pandemic continues to have an impact on a global level, Givaudan sustained strong business momentum whilst maintaining its operations and global supply chain with minimal disruption. The good growth was achieved across most product segments and geographies, with particularly strong performance in household, health and personal care segments within the Fragrance division, as well as in packaged foods, savoury, snacks and nutraceuticals in the Flavour division. In the product segments most affected by the COVID-19 pandemic, namely Fine Fragrance and to a lesser extent Active Beauty in the Fragrance division and Foodservice in the Flavour division, the Group experienced a significant reduction in business activity in the months from March through June, as the restrictions related to the COVID-19 pandemic restricted retail and travel retail activity as well as out-of-home food consumption.
In the continuing challenging environment related to the COVID-19 crisis and in line with the Company’s purpose, Givaudan is strongly focused on:
• Protecting and supporting its employees. Be it those on site or those who are still working from home;
• Meeting the demands of its customers. Particularly for those products which support consumers throughout the pandemic around the world;
• Taking care of the communities in which it operates. In the early stages of the COVID-19 pandemic, the Company established the Givaudan COVID-19 Communities Fund to enable Givaudan sites to support local communities that are being affected around the world. Givaudan committed to donate at least CHF 1 million to this fund and to date, over 120 initiatives across 40 countries have been launched.
Gross profitThe gross profit increased by 6.7% from CHF 1,274 million in 2019 to CHF 1,359 million in 2020. Due to continued productivity gains and cost discipline, the gross margin increased to 42.2% in 2020 compared to 41.2% in 2019.
Earnings Before Interest, Tax, Depreciation and Amortisation (EBITDA)The EBITDA increased by 11.3% to CHF 734 million from CHF 660 million for the same period in 2019, whilst the EBITDA margin was 22.8% in 2020 compared to 21.3% in 2019. On a comparable basis, the EBITDA margin was 23.7% in 2020 compared to 22.3% in 2019.
In 2020, the Group incurred costs of CHF 4 million in relation to the implementation of the Givaudan Business Solutions organisation, compared with CHF 19 million in 2019.
Business performanceStrong financial performance
Group salesin millions of Swiss francs
Operating incomeThe operating income increased to CHF 532 million, compared to CHF 491 million in 2019. When measured in local currency terms, the operating income increased by 18.9%. The operating margin increased to 16.5% in 2020 from 15.9% in 2019.

Givaudan – 2020 Half Year Report
6 - Business performance - Group
Operating cash flow after net investments was CHF 220 million versus CHF 177 million recorded in 2019, an increase of 24.3%. Free cash flow was CHF 178 million in the first half of 2020, versus CHF 148 million for the comparable period in 2019, an increase of 20.3%. As a percentage of sales, free cash flow in the first six months of 2020 was 5.5%, compared to 4.8% in 2019.
Financial positionGivaudan’s financial position remained solid at the end of June 2020. Net debt at June 2020 was CHF 4,631 million, up from CHF 3,679 million at December 2019, with the increase driven by the acquisition of Ungerer in the first quarter of 2020. The leverage ratio was 56% compared to 47% at the end of 2019.
2020 guidance: Responsible growth. Shared successThe Company’s 2020 ambition is to create further value through profitable, responsible growth. Building on the first four years of this strategic cycle, Givaudan’s 2020 ambition is defined around the three strategic pillars of ‘Growing with our customers’, ‘Delivering with excellence’ and ‘Partnering for shared success’.
As part of the Company’s 2020 strategy, Givaudan also seeks to create value through targeted acquisitions, which complement existing capabilities in providing winning solutions for its customers. Since 2014, Givaudan has announced sixteen acquisitions, which are fully in line with the growth pillars within the Company’s 2020 strategy. Ambitious financial targets are a fundamental part of Givaudan’s strategy. We aim to outpace the market with 4-5% sales growth and a free cash flow of 12-17% of sales, both measured as an average over the five-year period of our strategy cycle. It is Givaudan’s intention to maintain its current dividend practice as part of this ambition.
Givaudan’s purposeThe Company’s purpose, ‘Creating for happier, healthier lives with love for nature. Let’s imagine together’, is at the heart of its strategy. Under the purpose, Givaudan has defined bold and ambitious goals in four domains, namely creations, nature, people and communities. These ambitions include doubling its business through creations that contribute to happier, healthier lives by 2030, becoming climate positive before 2050, becoming a leading employer for inclusion before 2025 and sourcing all materials and services in a way that protects the environment and people by 2030.
Note: Definitions and further information and reconciliations of the Group’s Alternative Performance Measures can be found in the Appendix ‘Alternative Perfor-mance Measures’ pages 24-25.
Group operating incomein millions of Swiss francs
500
489
489
491
532
2016
2017
2018
2019
2020
Financial performanceFinancing costs were CHF 39 million in the first half of 2020, versus CHF 36 million for the same period in 2019, largely related to the increase in net debt of the Group in connection with the recent acquisitions. Other financial expense, net of income, was CHF 13 million in 2020 versus CHF 18 million in 2019.
The interim period income tax expense as a percentage of income before taxes was 14% in 2020, compared with 13% for the same period in 2019.
Net incomeThe net income for the first six months of 2020 was CHF 413 million compared to CHF 380 million in 2019, an increase of 8.8%, resulting in a net profit margin of 12.8% versus 12.3% in 2019. Basic earnings per share were CHF 44.81 versus CHF 41.24 for the same period in 2019.
Cash flowGivaudan delivered an operating cash flow of CHF 359 million for the first six months of 2020, compared to CHF 271 million in 2019.
Net Working capital was 27.9% of sales compared to 27.3% in 2019, with temporarily higher accounts receivable and inventory levels related to the COVID-19 pandemic. Total net investments in property, plant and equipment were CHF 122 million, compared to CHF 77 million in 2019, as the Group continues to invest in expanding its capabilities in high growth markets. As a reminder, in 2018 the Group completed an agreement to sell and leaseback the Zurich Innovation Centre (ZIC) for a total consideration of CHF 173 million, of which CHF 60 million was received in the first six months of 2019.
Intangible asset additions were CHF 17 million in 2020, compared to CHF 17 million in 2019, as the Company continues to invest in its IT platform capabilities.
Total net investments in tangible and intangible assets were 4.3% of sales, compared to 3.0% in 2019. Excluding the impact of the ZIC transaction, total net investments in tangible and intangible assets in 2019 would have been 4.6% of sales.

Givaudan – 2020 Half Year Report
7 - Business performance: - Fragrance Division
Fragrance Division salesin millions of Swiss francs
1,132
1,137
1,223
1,361
1,456
2016
2017
2018
2019
2020
Fragrance DivisionFragrance salesFragrance Division sales were CHF 1,456 million, an increase of 4.5% on a like-for-like basis and an increase of 7.0% in Swiss francs over 2019. Sales growth was driven by the particularly strong volume growth of the consumer products business unit, despite the impact on Fine Fragrances related to the COVID-19 pandemic.
Total sales for Fragrance Compounds (Fine Fragrances and Consumer Products combined) increased by 5.3% on a like-for-like basis. In Swiss francs, sales of compounds increased to CHF 1,252 million from CHF 1,171 million in 2019.
Fine Fragrance sales decreased by 16.4% on a like-for-like basis driven by a significant reduction of activity in retail stores and travel retail related to COVID-19. After a strong start to the year, driven by new wins and existing products, the months of March through June experienced a strong reduction in demand as the COVID-19 pandemic severely restricted traditional retail channels in the major Fine Fragrance markets.
Consumer Products sales increased by 11.8% on a like-for-like basis, against 8.7% for the same period in 2019, with strong demand for household, health and personal care products related to COVID-19. The excellent growth was delivered in both high growth and mature markets and was spread across all customer groups and regions.
Sales of Fragrance Ingredients and Active Beauty were almost flat with a reported reduction of 0.1% on a like-for-like basis, against a strong comparable growth of 8.2% in 2019.
The EBITDA of the Fragrance Division increased to CHF 333 million in 2020 compared to CHF 270 million for the first six months of 2019. The increase was mainly driven by higher sales, the contribution of the recent acquisitions and the result of the actions taken to contain operating expenses. The EBITDA margin increased to 22.9% in 2020 from 19.8% in 2019. On a comparable basis the EBITDA margin of the Fragrance Division was 23.4% in 2020 compared to 21.3% in 2019.
In the first six months of 2020 the division incurred costs associated with the GBS project of CHF 4 million, compared to CHF 19 million in 2019.
The operating income increased by 23.8% to CHF 264 million in 2020, versus CHF 213 million for the same period in 2019. The operating margin increased to 18.2% in 2020 from 15.7% in 2019.
Fine FragrancesFine fragrance sales decreased by 16.4% on a like-for-like basis against a strong comparable of 8.5% growth in 2019. These results were impacted by the COVID-19 outbreak driving high
levels of business erosion across all customer groups and regions due to the restricted activities in retail and travel retail channels.
On a regional basis, sales performance in Western Europe was negatively impacted by the overall slowdown in demand from customers, while sustained levels of new business wins in North America were offset by established volume decline. In the high-growth markets, double-digit sales growth in Latin America was offset by weaker performance in Asia and the Middle East.
Consumer ProductsConsumer Products sales increased by 11.8% on a like-for-like basis with excellent growth across all customer groups and geographies, supported by increased consumption of household, health and personal care products related to COVID-19.
On a regional basis, Latin America reported double-digit growth across all customer groups and most sub-regions. Asia recorded good growth led by strong double-digit growth with local and regional customers. Europe, Africa and the Middle East delivered double-digit sales increase across all product segments led by local and regional customers, as well as strong double-digit growth in the African and Middle East sub-region. North America posted double-digit growth spread across all products segments with strong performance of international customers.
On a product segment basis, sales growth was led by double-digit growth in Home Care and Fabric Care, followed by solid performance in Personal Care.
Fragrance Ingredients and Active BeautySales of Fragrance Ingredients and Active Beauty were almost flat with a reported decline of 0.1% on a like-for-like basis, against a strong comparable growth of 8.2% in 2019. Active Beauty performed relatively well in difficult market conditions related to COVID-19, with a minimal sales reduction thanks to its well balanced portfolio of products and customers. Fragrance Ingredients experienced a moderate single digit growth driven by Local & Regional customers.

Givaudan – 2020 Half Year Report
8 - Business performance: - Flavour Division
1,202
1,346
1,451
1,733
1,765
2016
2017
2018
2019
2020
Flavour Division salesin millions of Swiss francs
Flavour DivisionFlavour salesFlavour Division sales were CHF 1,765 million, an increase of 3.6% on a like-for-like basis and 1.9% in Swiss francs.
The sales performance was driven by both new wins and existing products with strong business momentum across all regions coming from both Global and Local and Regional customers. The key strategic focus areas of the 2020 strategy, namely Health and Well-Being and Naturals grew at double-digit and single-digit levels respectively.
Linked to the COVID-19 pandemic, the Flavour divisions experienced a shift in demand from Foodservice and alcoholic beverages into established products in categories such as Juice Based Beverages, Culinary Solutions, Nutritional Bars, Savoury and Snacks.
From a segment perspective Dairy, Sweet Goods, Savoury and Snacks were the main contributors to the division growth.
The EBITDA increased to CHF 401 million from CHF 390 million in 2019, an increase of 2.8%, with continuing productivity gains and cost discipline contributing to the increase. The EBITDA margin was 22.7% in 2020, up from 22.5% in 2019. On a comparable basis the EBITDA margin of the Flavour Division was 23.8% in 2020 compared to 23.1% in 2019.
The operating income decreased to CHF 268 million in 2020 from CHF 278 million in 2019, a decrease of 3.5%. The operating margin was 15.2% in 2020 compared to 16.0% in 2019.
Asia PacificSales in Asia Pacific grew by 2.4% on a like-for-like basis, against a comparable growth of 6.2% in 2019. The high-growth markets of Thailand and China delivered strong double-digit performance, whilst India, Indonesia and Malaysia were heavily impacted by the COVID-19 crisis. In the mature markets, growth was driven by Japan, Korea and Singapore.
From a customer perspective in Asia Pacific, there was a shift towards Global and International customers, which were less impacted by the COVID-19 crisis compared to Local and Regional customers. From a segment perspective, Savoury, Snacks and Sweet Goods contributed significantly to the growth.
Europe, Africa and Middle EastSales in Europe, Africa and the Middle East increased by 3.4% on a like-for-like basis. In the high-growth markets of Africa and the Middle East, double-digit growth was achieved in Algeria, Egypt and Cameroon followed by the Middle East with good single-digit growth. Growth in Central and Eastern Europe was led by Russia and Turkey. In the mature markets of Western Europe, we saw very good momentum driven by France, the Netherlands, Belgium and Sweden.
The growth was driven by the Dairy, Savoury and Snacks segments.
North AmericaOn a like-for-like basis, sales in North America increased by 2.8% driven by the good performance of global and local and regional Customers. From a segment perspective good growth was achieved in Beverages, Snacks and Sweet Goods.
Latin AmericaSales in Latin America increased by 10.6% on a like-for-like basis, against a strong comparable of 22.8% growth in 2019. The strong growth was achieved across all markets and in the segments of Dairy, Beverage, Savoury and Sweet Goods.

Givaudan – 2020 Half Year Report
9 - Financial statements
Table of contents:
10 Interim condensed consolidated financial statements
15 Notes to the interim condensed consolidated financial statements
2020 Half Year Financial Report

Givaudan – 2020 Half Year Report
10 - Financial statements
Interim condensed consolidated financial statements (unaudited) Condensed consolidated income statementFor the six months ended 30 June
in millions of Swiss francs, except for earnings per share data Note 2020 2019
Sales 6 3,221 3,094 Cost of sales (1,862) (1,820)Gross profit 1,359 1,274 as % of sales 42.2% 41.2%Selling, marketing and distribution expenses (412) (373)Research and product development expenses (261) (259)Administration expenses (104) (109)Share of results of joint ventures and associates 3 3 Other operating income 11 11 Other operating expense 7 (64) (56)Operating income 532 491 as % of sales 16.5% 15.9%Financing costs 8 (39) (36)Other financial income (expense), net 9 (13) (18)Income before taxes 480 437 Income taxes (67) (57)Income for the period 413 380 AttributionIncome attributable to non-controlling interests – –Income attributable to equity holders of the parent 413 380 as % of sales 12.8% 12.3%Earnings per share − basic (CHF) 10 44.81 41.24 Earnings per share − diluted (CHF) 10 44.48 40.94
The notes on pages 15 to 23 form an integral part of these interim condensed financial statements (unaudited).

Givaudan – 2020 Half Year Report
11 - Financial statements
Condensed consolidated statement of comprehensive income For the six months ended 30 June
in millions of Swiss francs 2020 2019
Income for the period 413 380 Items that may be reclassified to the income statementCash flow hedgesMovement in fair value, net (58) (49)Gains (losses) removed from equity and recognised in the consolidated income statement 3 3 Movement on income tax 7 4 Exchange differences arising on translation of foreign operationsMovement in fair value arising on hedging instruments of the net assets in foreign operations 46 22 Currency translation differences (340) (46)Movement on income tax (2) (4)Items that will not be reclassified to the income statementDefined benefit pension plansRemeasurement gains (losses) of post-employment benefit obligations 39 (87)Movement on income tax (2) (1)Other comprehensive income for the period (307) (158)Total comprehensive income for the period 106 222 AttributionTotal comprehensive income attributable to non-controlling interests – –Total comprehensive income attributable to equity holders of the parent 106 222
The notes on pages 15 to 23 form an integral part of these interim condensed financial statements (unaudited).
Givaudan – 2020 Half Year Report
12 - Financial statements
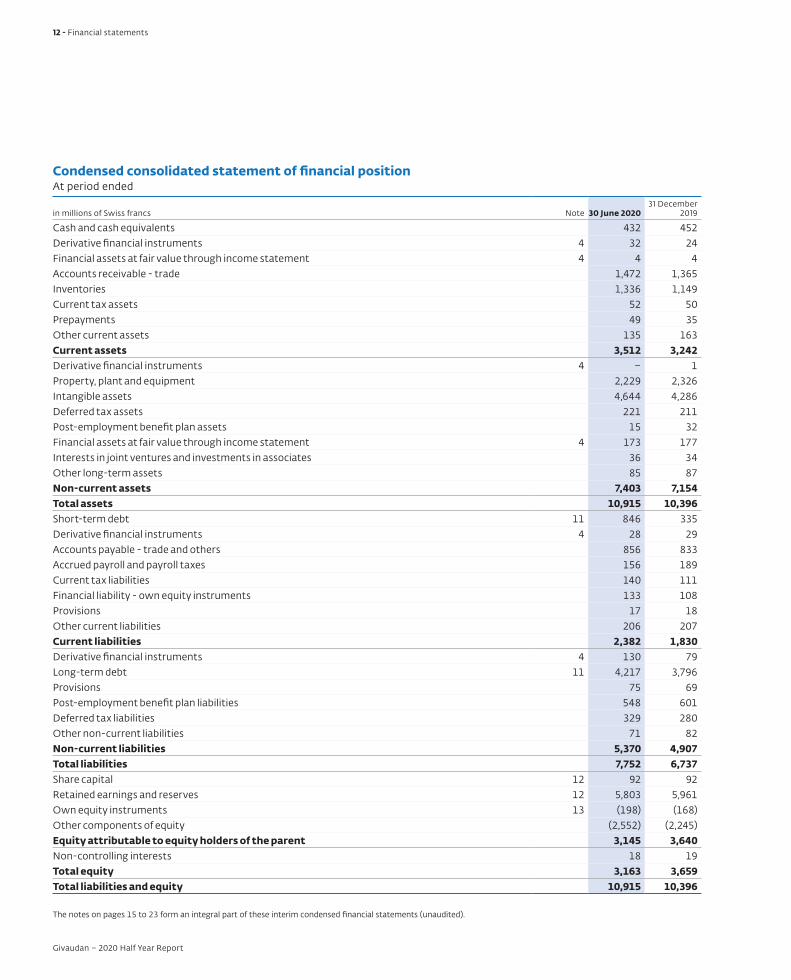
Condensed consolidated statement of financial positionAt period ended
in millions of Swiss francs Note 30 June 202031 December
2019
Cash and cash equivalents 432 452 Derivative financial instruments 4 32 24 Financial assets at fair value through income statement 4 4 4 Accounts receivable - trade 1,472 1,365 Inventories 1,336 1,149 Current tax assets 52 50 Prepayments 49 35 Other current assets 135 163 Current assets 3,512 3,242 Derivative financial instruments 4 – 1 Property, plant and equipment 2,229 2,326 Intangible assets 4,644 4,286 Deferred tax assets 221 211 Post-employment benefit plan assets 15 32 Financial assets at fair value through income statement 4 173 177 Interests in joint ventures and investments in associates 36 34 Other long-term assets 85 87 Non-current assets 7,403 7,154 Total assets 10,915 10,396 Short-term debt 11 846 335 Derivative financial instruments 4 28 29 Accounts payable - trade and others 856 833 Accrued payroll and payroll taxes 156 189 Current tax liabilities 140 111 Financial liability - own equity instruments 133 108 Provisions 17 18 Other current liabilities 206 207 Current liabilities 2,382 1,830 Derivative financial instruments 4 130 79 Long-term debt 11 4,217 3,796 Provisions 75 69 Post-employment benefit plan liabilities 548 601 Deferred tax liabilities 329 280 Other non-current liabilities 71 82 Non-current liabilities 5,370 4,907 Total liabilities 7,752 6,737 Share capital 12 92 92 Retained earnings and reserves 12 5,803 5,961 Own equity instruments 13 (198) (168)Other components of equity (2,552) (2,245)Equity attributable to equity holders of the parent 3,145 3,640 Non-controlling interests 18 19Total equity 3,163 3,659 Total liabilities and equity 10,915 10,396
The notes on pages 15 to 23 form an integral part of these interim condensed financial statements (unaudited).

Givaudan – 2020 Half Year Report
13 - Financial statements
Condensed consolidated statement of changes in equityFor the six months ended 30 June
2020 in millions of Swiss francs Share Capital
Retained earnings
and reservesOwn equity instruments
Cash flow hedges
Currency translation differences
Remeasure-ment of post employment
benefit obligations
Equity attributable
to equity holders of
the parents
Non- controlling
interests Total equity
Balance as at 1 January 92 5,961 (168) (107) (1,613) (525) 3,640 19 3,659 Income for the period 413 413 – 413 Other comprehensive income for the period (48) (296) 37 (307) (307)Total comprehensive income for the period 413 (48) (296) 37 106 – 106 Dividends paid (571) (571) (571)Movement on own equity instruments, net (30) (30) (30)Non-controlling interests (1) (1)Net change in other equity items (571) (30) (601) (1) (602)Balance as at 30 June 92 5,803 (198) (155) (1,909) (488) 3,145 18 3,163
2019 in millions of Swiss francs Share Capital
Retained earnings
and reservesOwn equity instruments
Cash flow hedges
Currency translation differences
Remeasure-ment of post employment
benefit obligations
Equity attributable
to equity holders of
the parents
Non- controlling
interests Total equity
Balance as at 1 January 92 5,811 (142) (61) (1,559) (431) 3,710 22 3,732 Income for the period 380 380 – 380 Other comprehensive income for the period (42) (28) (88) (158) (158)Total comprehensive income for the period 380 (42) (28) (88) 222 – 222 Dividends paid (552) (552) (552)Movement on own equity instruments, net (34) (34) (34)Non-controlling interests – –Net change in other equity items (552) (34) (586) (586)Balance as at 30 June 92 5,639 (176) (103) (1,587) (519) 3,346 22 3,368
The notes on pages 15 to 23 form an integral part of these interim condensed financial statements (unaudited).

Givaudan – 2020 Half Year Report
14 - Financial statements
Consolidated statement of cash flowsFor the six months ended 30 June
in millions of Swiss francs Note 2020 2019
Income for the period 413 380 Income tax expense 67 57 Interest expense 38 31 Non-operating income and expense 14 23 Operating income 532 491 Depreciation of property, plant and equipment 6 100 88 Amortisation of intangible assets 6 91 80 Impairment of long-lived assets 6 11 1 Other non-cash items - share-based payments 24 18 - pension expense 24 19 - additional and unused provisions, net 10 4 - other non-cash items – (18) Adjustments for non-cash items 260 192 (Increase) decrease in inventories (184) (180)(Increase) decrease in accounts receivable (170) (137)(Increase) decrease in other current assets 11 (13)Increase (decrease) in accounts payable 100 131 Increase (decrease) in other current liabilities (80) (72)(Increase) decrease in working capital (323) (271)Income taxes paid (54) (63)Pension contributions paid (17) (18)Provisions used (9) (9)Purchase and sale of own equity instruments, net (30) (51)Cash flows from (for) operating activities 359 271 Increase in long-term debt 11 1,260 6 (Decrease) in long-term debt 11 (781) (170)Increase in short-term debt 11 2,616 1,296(Decrease) in short-term debt 11 (2,091) (817)Cash flows from debt, net 1,004 315 Interest paid (14) (10)Purchase and sale of derivative financial instruments, net (15) (2)Lease payments 11 (28) (19)Transactions of non-controlling interest (1)Other, net (8) –Cash flows from financial liabilities 938 284 Distribution to the shareholders paid 12 (571) (552)Cash flows from (for) financing activities 367 (268)Acquisition of property, plant and equipment (123) (138)Acquisition of intangible assets (19) (17)Acquisition of subsidiaries, net of cash acquired 5 (614) (61)Proceeds from the disposal of property, plant and equipment 1 61 Proceeds from sales of intangible assets 2 Interest received 3 3 Purchase and sale of financial assets at fair value through income statement, net – 2 Impact of financial transactions on investing, net 24 (17)Other, net 1 (20)Cash flows from (for) investing activities (725) (187)Net increase (decrease) in cash and cash equivalents 1 (184)Net effect of currency translation on cash and cash equivalents (21) –Cash and cash equivalents at the beginning of the period 452 423 Cash and cash equivalents at the end of the period 432 239
The notes on pages 15 to 23 form an integral part of these interim condensed financial statements (unaudited).

Notes to the interim condensed consolidated financial statements (unaudited)
1. Group organisation Givaudan SA and its subsidiaries (hereafter ‘the Group’) operate under the name Givaudan. Givaudan SA is a limited liability company incorporated and domiciled in Switzerland. The Group is headquartered in Vernier, near Geneva, Switzerland. Givaudan is a leading supplier of creative fragrance and flavour products to the consumer goods industry. It operates in over 100 countries and has subsidiaries and branches in more than 40 countries. Worldwide, it employs 15,847 people.
The Group is listed on the SIX Swiss Exchange (GIVN).
2. Basis of financial statementsThese financial statements are the unaudited interim condensed consolidated financial statements (hereafter ‘the interim financial statements’) of the Group for the six months period ended 30 June 2020 (hereafter ‘the interim period’). They have been prepared in accordance with International Accounting Standard 34 ‘Interim Financial Reporting’.
The interim financial statements include the operations of Givaudan SA and its controlled subsidiaries where control is defined as the power to govern the financial and operating policies of an enterprise so as to obtain benefits from its activities.
These interim financial statements should be read in conjunction with the 2019 consolidated financial statements as they provide an update of the most recent financial information available.
Taxes on income in the interim period are accrued using the tax rate that would be applicable to expected total annual earnings.
The Group operates in markets where no significant seasonal or cyclical variations in sales are experienced during the financial year. The COVID-19 pandemic has not materially affected the business activities of the Group; thus the operating results as well as the interim condensed consolidated financial statements for the six month period ended 30 June 2020 have not been materially impacted.
The 31 December 2019 statement of financial position has been derived from the audited 2019 consolidated financial statements. Givaudan SA’s Board of Directors approved these interim financial statements on 17 July 2020.
3. Accounting policiesThe accounting policies adopted are consistent with those of the annual financial statements for the year ended 31 December 2019, as described in the 2019 consolidated financial statements with the exception of the adoption as of 1 January 2020 of the standards and interpretation described below:
Amendments to IFRS 10 and IAS 28: Sales or Contribution of Assets between an Investor and its Associate or Joint Venture clarify that in a transaction involving an associate or joint venture the extent of gain or loss recognition depends on whether the assets sold or contributed constitute a business. The adoption of these amendments has no impact on the accounting of the joint arrangements currently held by the Group.
Definition of Material: Amendments to IAS 1 and IAS 8 align the definition used in the Conceptual Framework and the standards themselves. The clarification does not impact the current practice of the Group.
Definition of Business: Amendments to IFRS 3 narrow and clarify the definition of a business. They also permit a simplified assessment of whether an acquired set of activities and assets is a group of assets rather than a business. The amendments do not impact the current practice of the Group.
Amendments to IFRS 9, IAS 39 and IFRS 7: Interest Rate Benchmark Reform provide certain reliefs in connection with interest rate benchmark reform. The reliefs relate to hedge accounting and have the effect that IBOR reform should not generally cause hedge accounting to terminate. The amendments do not impact the current practice of the Group.
Givaudan – 2020 Half Year Report
15 - Financial statements

4. Financial risk management
Derivative financial instruments
The Group entered into several forward starting EUR interest rate swaps in 2020, in order to protect against future increases in the EUR interest rate, while also fixing the interest rate on future debt issuance. The transactions have the following characteristics:
EntityIssue date
Type of instrument
Currency of
instrument
Notional amount in
millions
Annual fixed interest rate (payment)
Floating rate
(receipt)Starting
dateMaturity
date Assigned to
Givaudan SA 2020
Forward starting interest rate swaps
EUR
25 0.390%
The 6 months EUR Libor
rate
20 Dec 2024
22 Dec 2031
Private placement of EUR 200 million, issued in Dec 2017 with a 7 year maturity 25 0.120%
50 0.499% 17 Sep 2025
17 Sep 2032
Public bond of EUR 500 million, issued in Sep 2018 with a 7 year maturity
25 0.818%17 Sep 2030
17 Sep 2040
Public bond of EUR 800 million, issued in Sep 2018 with a 12 year maturity
25 0.510%
25 0.145%
25 0.304% 22 Apr 2032
22 Apr 2042
Public bond of EUR 500 million, issued in Apr 2020 with a 12 year maturity25 0.260%
In addition the Group entered into cross-currency swaps with the following characteristics:
EntityIssue date
Type of instrument
Notional amount in millions of
EUR
Notional amount in millions of
USD
Annual USD fixed
interest rate (payment)
Annual EUR fixed
interest rate (receipt)
Starting date
Maturity date Purpose of the instrument
Givaudan SA 2020Cross- currency swaps
80 87.3 2.218%
1% 22 Apr 2020
22 Apr 2027
Conversion of the EUR 500 million public bond issued in April 2020 with a 7 year maturity into a USD synthetic debt of USD 544 million
100 108.8 2.166%80 86.9 2.167%80 87.0 2.166%90 97.9 2.133%70 76.2 2.126%
In 2020 the Group applied hedge accounting on the net investment in foreign currency in Ungerer (Note 5) with the aim of being protected from the foreign currency risk on the translation of the investment in Ungerer (i.e. USD) into the Group’s presentation currency (i.e. CHF). The combination of a Eurobond and cross-currency swap as one single item are designated as hedge instrument for an amount of USD 544 million corresponding to the foreign currency principal cash flow of the cross-currency swap. In the period ended 30 June 2020, it resulted in a gain of CHF 17 million recognised in currency translation differences in equity.
Fair value measurements recognised in the statement of financial positionFinancial assets consisting of equity and debt securities of CHF 111 million (31 December 2019: CHF 112 million) were measured with Level 1 inputs whereas CHF 32 million (31 December 2019: CHF 33 million) were measured with Level 2 inputs. Corporate owned life insurance of CHF 34 million (31 December 2019: CHF 36 million) were measured with Level 2 inputs.
Givaudan – 2020 Half Year Report
16 - Financial statements

Derivative assets of CHF 32 million (31 December 2019: CHF 25 million) and derivative liabilities of CHF 158 million (31 December 2019: CHF 108 million) were measured with Level 2 inputs. Derivative assets and liabilities consist of cross-currency swaps and forward foreign exchange contracts that are measured using quoted forward exchange rates and yield curves derived from quoted interest rates matching maturities of the contracts, and of interest swaps that are measured using quoted interest rates and yield curves derived from quoted interest rates matching maturities of the contracts.
There was no transfer between the level categories in the period. The Group did not carry out any transactions on Level 3 inputs during the period presented in these interim financial statements. The carrying amount of each class of financial assets and liabilities disclosed above approximates their fair value.
5. Acquisitions
UngererOn 20 February 2020 Givaudan acquired 100% of the share capital of Ungerer and its affiliates for a purchase price of CHF 676 million (USD 688 million). Headquartered in New Jersey, USA, Ungerer is a leading independent company in the flavour and fragrance specialty ingredients business, most notably in essential oils, which provides a rich palette of predominantly natural ingredients for flavour and fragrance creation, as well as for end customers of such specialties. Ungerer also has an impressive local and regional customer presence for both flavours and fragrances in North America. Founded more than 125 years ago, Ungerer has developed a strong market position in all segments and a high quality reputation with its customer base. With a presence in more than 60 countries, a total of eight manufacturing facilities and six R&D centres, Ungerer’s capabilities and its 650 employees will further extend Givaudan’s market leadership in its core flavour and fragrance activities. As from 1 February 2020 the acquisition contributed CHF 96 million of sales and a net profit of CHF 11 million to the Group’s consolidated results.
The identifiable assets and liabilities of Ungerer acquired are recorded at fair value at the date of acquisition and are as follows:
in millions of Swiss francs Fair value
Cash and Cash equivalents 94 Accounts receivable 36 Inventories 78 Other current assets 10 Property, plant and equipment 36
- Client relationships 213 - Process-oriented technology and other 73 - Name and product brands 10 - Software / ERP system 1 Total identified intangible assets 297 Accounts payable (4)Other payables (67)Provisions (7)Debt (7)Deferred tax liabilities (63)Net assets acquired 403
Cash consideration 676 Goodwill 273
Givaudan – 2020 Half Year Report
17 - Financial statements
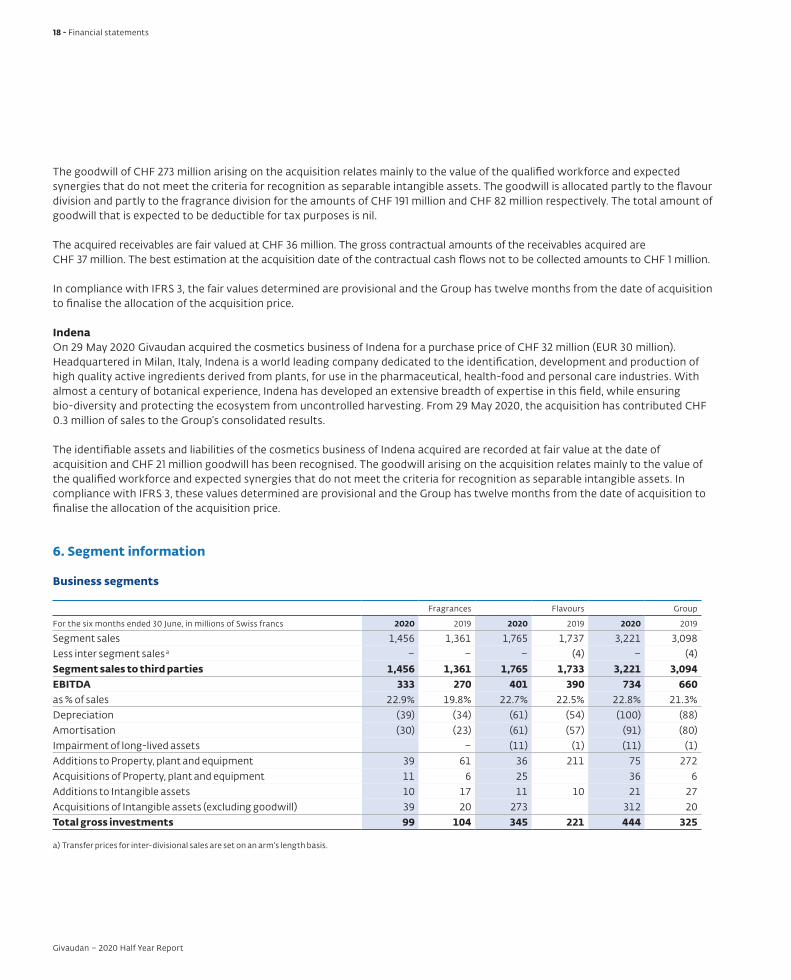
The goodwill of CHF 273 million arising on the acquisition relates mainly to the value of the qualified workforce and expected synergies that do not meet the criteria for recognition as separable intangible assets. The goodwill is allocated partly to the flavour division and partly to the fragrance division for the amounts of CHF 191 million and CHF 82 million respectively. The total amount of goodwill that is expected to be deductible for tax purposes is nil.
The acquired receivables are fair valued at CHF 36 million. The gross contractual amounts of the receivables acquired are CHF 37 million. The best estimation at the acquisition date of the contractual cash flows not to be collected amounts to CHF 1 million.
In compliance with IFRS 3, the fair values determined are provisional and the Group has twelve months from the date of acquisition to finalise the allocation of the acquisition price.
IndenaOn 29 May 2020 Givaudan acquired the cosmetics business of Indena for a purchase price of CHF 32 million (EUR 30 million).Headquartered in Milan, Italy, Indena is a world leading company dedicated to the identification, development and production of high quality active ingredients derived from plants, for use in the pharmaceutical, health-food and personal care industries. With almost a century of botanical experience, Indena has developed an extensive breadth of expertise in this field, while ensuring bio-diversity and protecting the ecosystem from uncontrolled harvesting. From 29 May 2020, the acquisition has contributed CHF 0.3 million of sales to the Group’s consolidated results.
The identifiable assets and liabilities of the cosmetics business of Indena acquired are recorded at fair value at the date of acquisition and CHF 21 million goodwill has been recognised. The goodwill arising on the acquisition relates mainly to the value of the qualified workforce and expected synergies that do not meet the criteria for recognition as separable intangible assets. In compliance with IFRS 3, these values determined are provisional and the Group has twelve months from the date of acquisition to finalise the allocation of the acquisition price.
6. Segment information
Business segments
Fragrances Flavours Group
For the six months ended 30 June, in millions of Swiss francs 2020 2019 2020 2019 2020 2019
Segment sales 1,456 1,361 1,765 1,737 3,221 3,098 Less inter segment sales a – – – (4) – (4)Segment sales to third parties 1,456 1,361 1,765 1,733 3,221 3,094 EBITDA 333 270 401 390 734 660 as % of sales 22.9% 19.8% 22.7% 22.5% 22.8% 21.3%Depreciation (39) (34) (61) (54) (100) (88)Amortisation (30) (23) (61) (57) (91) (80)Impairment of long-lived assets – (11) (1) (11) (1)Additions to Property, plant and equipment 39 61 36 211 75 272Acquisitions of Property, plant and equipment 11 6 25 36 6Additions to Intangible assets 10 17 11 10 21 27Acquisitions of Intangible assets (excluding goodwill) 39 20 273 312 20Total gross investments 99 104 345 221 444 325
a) Transfer prices for inter-divisional sales are set on an arm's length basis.
Givaudan – 2020 Half Year Report
18 - Financial statements

Reconciliation table to Group’s operating income
Fragrances Flavours Group
For the six months ended 30 June, in millions of Swiss francs 2020 2019 2020 2019 2020 2019
EBITDA 333 270 401 390 734 660 Depreciation (39) (34) (61) (54) (100) (88)Amortisation (30) (23) (61) (57) (91) (80)Impairment of long-lived assets – – (11) (1) (11) (1)Operating income 264 213 268 278 532 491 as % of sales 18.2% 15.7% 15.2% 16.0% 16.5% 15.9%Financing costs (39) (36)Other financial income (expense), net (13) (18)Income before taxes 480 437as % of sales 14.9% 14.1%
Classification of amortisation expenses is as follows:
For the six months ended 30 June, in millions of Swiss francs
Fragrances Flavours Group
2020 2019 2020 2019 2020 2019
Cost of sales 5 3 7 5 12 8 Selling, marketing and distribution expenses 16 9 18 13 34 22 Research and product development expenses 5 6 26 29 31 35 Administration expenses 1 2 6 7 7 9 Other operating expenses 3 3 4 3 7 6 Total 30 23 61 57 91 80
7. Other operating expense
For the six months ended 30 June, in millions of Swiss francs 2020 2019
Project related expenses 10 21 Amortisation of intangible assets 7 6 Impairment of long-lived assets 11 1 Loss on divestment 5 Losses on disposal of fixed assets 1 1 Environmental provisions 1 –Business taxes 10 10 Acquisition and integration related expenses 13 9 Other expenses 6 8 Total other operating expense 64 56
During the first half of 2020 the Group continued to review its business portfolio and divested a small part of its business, which resulted in a loss on divestment of CHF 5 million. Furthermore, as part of the manufacturing footprint optimisation program, the Group restructured some of its operations and as a consequence recorded impairment charges of CHF 11 million.
Givaudan – 2020 Half Year Report
19 - Financial statements

8. Financing costs
For the six months ended 30 June, in millions of Swiss francs 2020 2019
Interest expense 38 31Net interest related to defined benefit pension plans 3 4Derivative interest (gains) losses (3) –Amortisation of debt discounts 1 1 Total financing costs 39 36
9. Other financial (income) expense, net
For the six months ended 30 June, in millions of Swiss francs 2020 2019
Fair value and realised (gains) losses from derivatives instruments, net (at fair value through income statement) 3 32Exchange (gains) losses, net (2) (18)Unrealised (gains) losses from financial instruments measured at fair value through income statement 3 (5)Interest (income) (2) (2)Capital taxes and other non-business taxes 4 4 Other (income) expense, net 7 7 Total other financial (income) expense, net 13 18
10. Earnings per share
Basic earnings per shareBasic earnings per share is calculated by dividing the net income attributable to shareholders by the weighted average number of shares outstanding:
2020 2019
Income attributable to equity holder of the parent (in millions of Swiss francs) 413 380 Weighted average number of shares outstandingOrdinary shares 9,233,586 9,233,586 Treasury shares (17,338) (19,197)Net weighted average number of shares outstanding 9,216,248 9,214,389 Basic earnings per share (CHF) 44.81 41.24
Diluted earnings per shareFor the calculation of diluted earnings per share, the weighted average number of shares outstanding is adjusted to assume conversion of all potentially dilutive shares:
2020 2019
Income attributable to equity holder of the parent (in millions of Swiss francs) 413 380 Weighted average number of shares outstanding for diluted earnings per share of 68,834 (2019: 67,443) 9,285,082 9,281,832 Diluted earnings per share (CHF) 44.48 40.94
Givaudan – 2020 Half Year Report
20 - Financial statements

11. Debt
2020 in millions of Swiss francs
Bank borrowings Bank facility
Bank overdrafts Public bonds
Private placements
Total short-term
and long-term
debtTotal lease
liabilities Total debt
Balance as at 1 January 68 600 2 2,453 567 3,690 441 4,131 Cash flows 736 (600) 1 907 (40) 1,004 (28) 976 Non-cash changes- Amortisation of debt discount 1 1 4 5 - Acquisition / Divestment 3 1 4 2 6 - Currency effects (18) (29) (10) (57) (16) (73)- Lease liabilities 18 18 Balance as at 30 June 789 3 3,332 518 4,642 421 5,063 Within 1 year 703 3 100 806 40 846 Within 1 to 3 years 17 249 248 514 76 590 Within 3 to 5 years 38 350 270 658 55 713 Thereafter 31 2,633 2,664 250 2,914 Balance as at 30 June 789 3 3,332 518 4,642 421 5,063
2019 in millions of Swiss francs
Bank borrowings Bank facility
Bank overdrafts Public bonds
Private placements
Total short-term
and long-term
debtTotal lease
liabilities Total debt
Balance as at 1 January 11 169 3 2,505 582 3,270 260 3,530 Cash flows 31 431 (1) 461 (52) 409 Non-cash changes- Amortisation of debt discount 1 1 9 10 - Acquisition / Divestment 31 1 32 20 52 - Currency effects (5) (1) (53) (15) (74) (2) (76)- Lease liabilities 206 206 Balance as at 31 December 68 600 2 2,453 567 3,690 441 4,131 Within 1 year 2 2 250 39 293 42 335 Within 1 to 3 years 18 249 108 375 49 424 Within 3 to 5 years 40 600 150 362 1,152 35 1,187 Thereafter 8 1,804 58 1,870 315 2,185 Balance as at 31 December 68 600 2 2,453 567 3,690 441 4,131
Givaudan – 2020 Half Year Report
21 - Financial statements

Details of the Group’s various debt transactions are as follows:
IssuerIssue date
Type of debt
Currency of
principal
Principal amount in
millions RedeemableInterest
rateType of interest
30 June 2020 31 Dec 2019
in millions of Swiss francs
Givaudan SA 2011 Public bonds CHF 150 07 Dec 2021 2.125%
Fixed
149 149
Givaudan United States, Inc. 2012
Private placements a
USD 40 06 Feb 2020 2.740% reimbursed 39USD 150 06 Feb 2023 3.300% 142 145USD 60 06 Feb 2025 3.450% 57 58
Givaudan SA
2014Public bonds
CHF 100 18 Sep 2020 1.000% 100 100CHF 150 19 Mar 2024 1.750% 150 150
2016CHF 100 07 Dec 2022 0.000% 100 100CHF 200 05 Dec 2031 0.625% 200 200
2017Private placements
EUR 100 20 Dec 2022 Floating 106 108EUR 200 20 Dec 2024 1.331% Fixed 213 217
2018 Public bonds
CHF 150 09 Apr 2020 Floating reimbursed 150CHF 200 09 Apr 2025 0.375%
Fixed200 200
EUR 500 17 Sep 2025 1.125% 529 540EUR 800 17 Sep 2030 2.000% 847 864
2019Group bank credit facility CHF 600 26 Jun 2023 Floating reimbursed 600
2020Other local borrowings
CHF 210Various
maturities Floating 701EUR 150
USD 350
Givaudan Finance Europe BV 2020 Public bond EUR
500 22 Apr 2027 1.000%Fixed
528500 22 Apr 2032 1.625% 529
Other entities 2019Other local borrowings
EUR 7Various
maturities
1.180% Fixed 6 8
CNY426 (2019) 609 (2020) Floating
82 59
other 3 3Total short-term and long-term debtb 4,642 3,690
a) There are various covenants contained in these transactions covering conditions on net worth, indebtedness and EBITDA ratio to net interest expense of Givaudan United States, Inc. The company is and has been in full compliance with the covenants set.
b) The fair value of the short-term and long-term debt exceeds its carrying value by approximately 5% as at 30 June 2020.
12. EquityAt the Annual General Meeting held on 25 March 2020 the distribution of an ordinary dividend of CHF 62.00 per share (2019: ordinary dividend of CHF 60.00 per share) was approved. The dividend payment has been paid out of available retained earnings. At 30 June 2020, the share capital amounts to CHF 92,335,860, divided into 9,233,586 fully paid-up registered shares with a nominal value of CHF 10.00 each. Each share gives the right to one vote.
13. Own equity instrumentsThe Group holds own equity instruments and derivatives on own shares mainly to cover the anticipated obligations related to the executive share plans. At 30 June 2020 the Group held 4,594 own shares (2019: 15,541), as well as derivatives on own shares, equating to a total long position of 54,000 (2019: 44,000).
Givaudan – 2020 Half Year Report
22 - Financial statements

14. Contingent liabilitiesFrom time to time and in varying degrees, Group operations and earnings continue to be affected by political, fiscal and regulatory developments, including those relating to environmental protection, in the countries in which it operates.
The activities in which the Group is engaged are also subject to physical risks of various kinds. The nature and frequency of these developments and events, not all of which are covered by insurance, as well as their effect on the future operations and earnings are not predictable.
Givaudan Group companies are involved in various legal and regulatory proceedings of a nature considered typical of its business, including contractual disputes and employment litigation.
One of the Group’s US affiliates, Givaudan Flavors Corporation was named as a defendant in several lawsuits brought against it and other flavour and raw chemical supply companies. The plaintiffs alleged that they sustained pulmonary injuries due to diacetyl -containing butter flavours manufactured by one or more of the flavour and raw chemical supply company defendants. The majority of the cases filed against Givaudan Flavors Corporation have been settled. The Group has already recovered or will recover amounts it is entitled to under the terms of its insurance policies.
15. Other InformationAs part of its long term strategy to expand its capabilities in bio-engineering technologies, Givaudan announced that it is to acquire Alderys. Founded in 2009, Alderys is an innovative French biotechnology company headquartered in Orsay, France, employing 30 employees. Alderys develops innovative approaches to the biological engineering of valuable compounds from renewable feedstock. The projects developed by Alderys are aimed at the chemical and cosmetic industry sectors as well as nutrition. They are recognised for offering innovative technological industrial solutions with high sustainability standards. The closing of the acquisition is expected to take place in the second half of 2020.
Givaudan – 2020 Half Year Report
23 - Financial statements
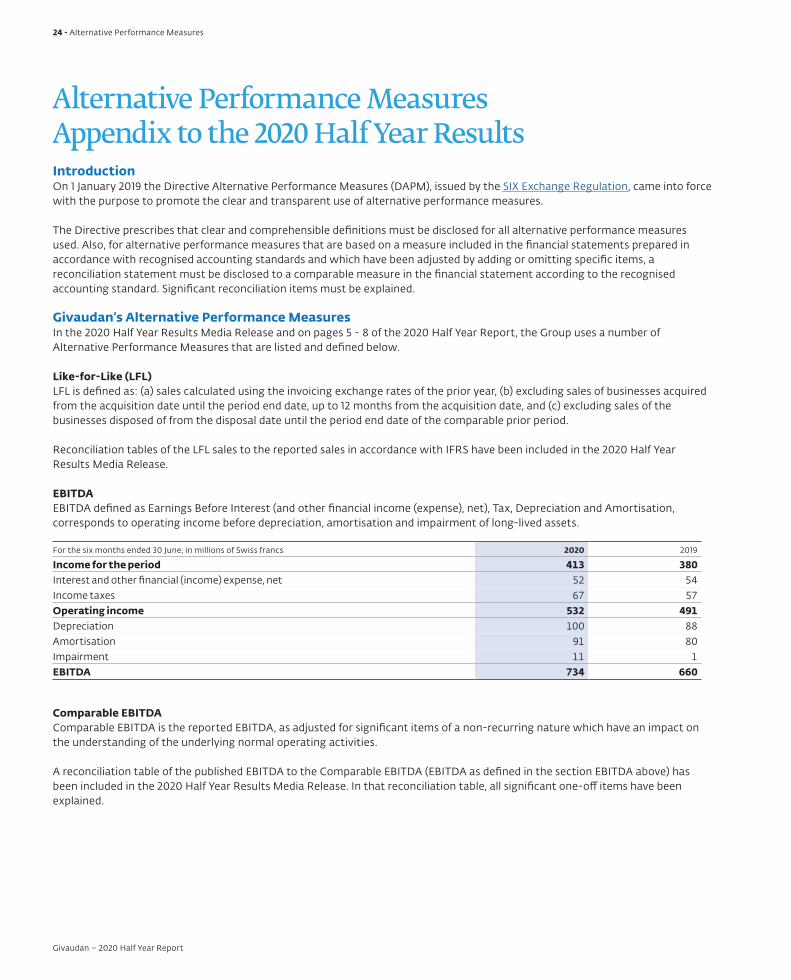
IntroductionOn 1 January 2019 the Directive Alternative Performance Measures (DAPM), issued by the SIX Exchange Regulation, came into force with the purpose to promote the clear and transparent use of alternative performance measures.
The Directive prescribes that clear and comprehensible definitions must be disclosed for all alternative performance measures used. Also, for alternative performance measures that are based on a measure included in the financial statements prepared in accordance with recognised accounting standards and which have been adjusted by adding or omitting specific items, a reconciliation statement must be disclosed to a comparable measure in the financial statement according to the recognised accounting standard. Significant reconciliation items must be explained.
Givaudan’s Alternative Performance MeasuresIn the 2020 Half Year Results Media Release and on pages 5 - 8 of the 2020 Half Year Report, the Group uses a number of Alternative Performance Measures that are listed and defined below.
Like-for-Like (LFL)LFL is defined as: (a) sales calculated using the invoicing exchange rates of the prior year, (b) excluding sales of businesses acquired from the acquisition date until the period end date, up to 12 months from the acquisition date, and (c) excluding sales of the businesses disposed of from the disposal date until the period end date of the comparable prior period. Reconciliation tables of the LFL sales to the reported sales in accordance with IFRS have been included in the 2020 Half Year Results Media Release.
EBITDAEBITDA defined as Earnings Before Interest (and other financial income (expense), net), Tax, Depreciation and Amortisation, corresponds to operating income before depreciation, amortisation and impairment of long-lived assets.
For the six months ended 30 June, in millions of Swiss francs 2020 2019
Income for the period 413 380 Interest and other financial (income) expense, net 52 54 Income taxes 67 57 Operating income 532 491 Depreciation 100 88 Amortisation 91 80 Impairment 11 1 EBITDA 734 660
Comparable EBITDAComparable EBITDA is the reported EBITDA, as adjusted for significant items of a non-recurring nature which have an impact on the understanding of the underlying normal operating activities.
A reconciliation table of the published EBITDA to the Comparable EBITDA (EBITDA as defined in the section EBITDA above) has been included in the 2020 Half Year Results Media Release. In that reconciliation table, all significant one-off items have been explained.
Alternative Performance MeasuresAppendix to the 2020 Half Year Results
Givaudan – 2020 Half Year Report
24 - Alternative Performance Measures
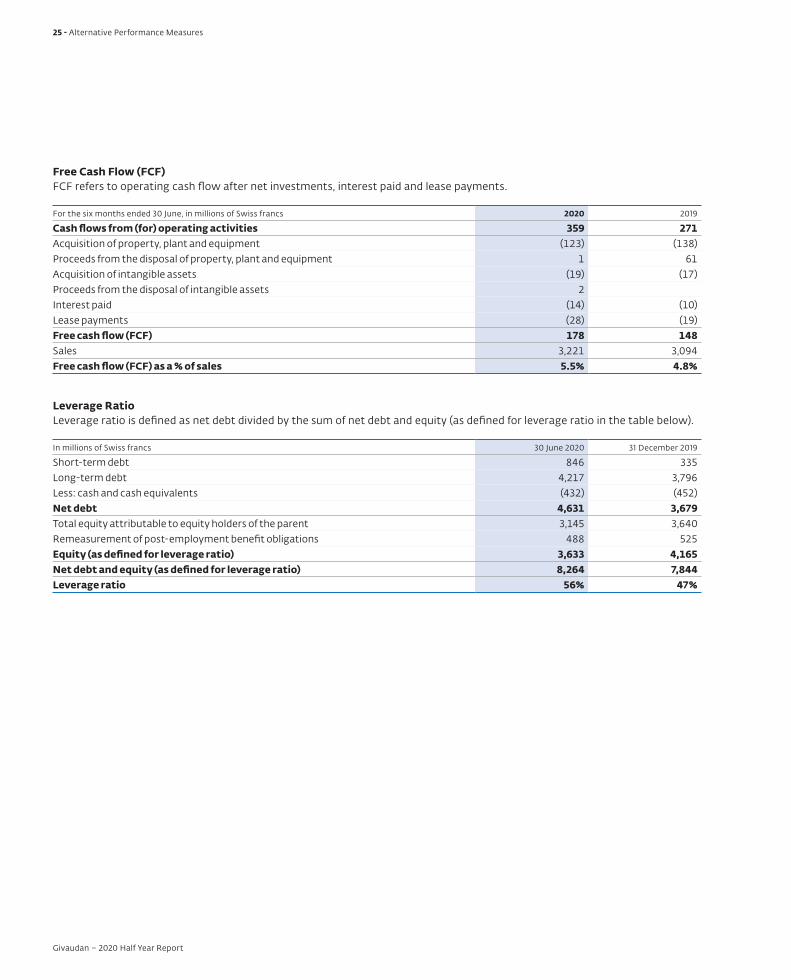
Free Cash Flow (FCF)FCF refers to operating cash flow after net investments, interest paid and lease payments.
For the six months ended 30 June, in millions of Swiss francs 2020 2019
Cash flows from (for) operating activities 359 271 Acquisition of property, plant and equipment (123) (138)Proceeds from the disposal of property, plant and equipment 1 61 Acquisition of intangible assets (19) (17)Proceeds from the disposal of intangible assets 2 Interest paid (14) (10)Lease payments (28) (19)Free cash flow (FCF) 178 148 Sales 3,221 3,094 Free cash flow (FCF) as a % of sales 5.5% 4.8%
Leverage RatioLeverage ratio is defined as net debt divided by the sum of net debt and equity (as defined for leverage ratio in the table below).
In millions of Swiss francs 30 June 2020 31 December 2019
Short-term debt 846 335 Long-term debt 4,217 3,796 Less: cash and cash equivalents (432) (452)Net debt 4,631 3,679 Total equity attributable to equity holders of the parent 3,145 3,640 Remeasurement of post-employment benefit obligations 488 525 Equity (as defined for leverage ratio) 3,633 4,165 Net debt and equity (as defined for leverage ratio) 8,264 7,844 Leverage ratio 56% 47%
Givaudan – 2020 Half Year Report
25 - Alternative Performance Measures

Givaudan – 2020 Half Year Report
26 - Financial statements

Givaudan SA
Chemin de la Parfumerie 51214 Vernier, Switzerland
General informationT + 41 22 780 91 11F + 41 22 780 91 50
Media and investor relationsT + 41 22 780 90 53F + 41 22 780 90 90
Share registrySAG SEGA Aktienregister AG Postfach 4601 Olten, Switzerland T + 41 62 205 36 95 F + 41 62 205 39 66
Investor CalendarHalf year conference, Zurich: 30 August 2017Nine month sales results: 10 October 2017Full year results: 26 January 2018Annual General Meeting: 22 March 2018
Dates may be subject to change, please consult the calendar on the Givaudan website: www.givaudan.com/investors/shareholder-information/investor-calendar
Givaudan – 2020 Half Year Report
27 - Financial statements
All trademarks mentioned enjoy legal protection.
This Half Year Report and Financial statements may contain forward-looking information.Such information is subject to a variety of significant uncertainties, including scientific, business, economic and financial factors. Therefore actual results may differ significantly from those presented in such forward looking statements.Investors must not rely on this information for investment decisions.
© Givaudan SA, 2020 www.givaudan.com