H1 FY2016 RESULTS PRESENTATION For personal use only PRESENTATION · 2016. 2. 18. · H1 FY2016...
27
HI F Y 2 016 Beacon Lighting Group Limited RESULTS PRESENTATION For personal use only
Transcript of H1 FY2016 RESULTS PRESENTATION For personal use only PRESENTATION · 2016. 2. 18. · H1 FY2016...

H1 FY2016RESULTS PRESENTATION
HI F Y20 16
Beacon Lighting Group Limited
RESULTS PRESENTATIONF
or p
erso
nal u
se o
nly

The Presentation contains “forward-looking statements”. All statements other than those of historical facts included in the Presentation are forward-looking statements. Where the Company expresses or implies an expectation or belief as to future events or results, such expectation or belief is expressed in good faith and believed to have a reasonable basis. However, forward-looking statements are subject to risks, uncertainties and other factors, which could cause actual results to differ materially from future results expressed, projected or implied by such forward-looking statements. The Company will not necessarily release publicly any revisions to any such forward-looking statement.
The Presentation contains general background information about the Company and its activities current as at the date of this presentation. The information in this Presentation is in summary form only and does not contain all the information necessary to fully evaluate whether or not to buy or sell shares in the Company. It should be read in conjunction with the Company’s other periodic and continuous disclosure announcements lodged with the ASX, which are available at www.asx.com.au.
This Presentation is not a prospectus, disclosure document or other offering document. It is for information purposes only and does not constitute an offer, invitation or recommendation to subscribe for or purchase any security and does not form the basis of any contract or commitment.
DISCLAIMER
2
For
per
sona
l use
onl
y
CONTENTS
1 RESULTS OVERVIEW
2 TRADING PERFORMANCE
3 CASH FLOW, BALANCE SHEET, DIVIDENDS
4 GROWTH STRATEGIES
5 H2 FY2016 OUTLOOK
6 QUESTIONS
3
For
per
sona
l use
onl
y

PLEASE NOTE
For the purposes of this presentation, please note the following:
• H1 FY2016 was for the 26 weeks ending 27 December 2015• H1 FY2015 was for the 26 weeks ending 28 December 2014• H1 FY2014 based on the pro forma historical results presented in the Prospectus• H1 FY2013 based on the pro forma historical results presented in the Prospectus
4
For
per
sona
l use
onl
y

RESULTS OVERVIEW1
For
per
sona
l use
onl
y

H1 FY2016 HIGHLIGHTS
• Record first half year sales and record profit result• Sales increased by $7.7m, 8.5% ahead of H1 FY2015• Company store comparative sales increased by 5.1%• Gross profit dollars increased by 11.5%• Opened two new company stores and purchased two franchised stores• Designed and developed 205 exclusive new products• Light Source Solutions, our GE globe distribution business commenced• Continued to realise productivity gains within the Group• EBITDA increased $3.1m, 21.4% ahead of H1 FY2015 • NPAT increased $2.0m, 22.1% ahead of H1 FY2015
1
6
For
per
sona
l use
onl
y

H1 FY2015$’000
H1 FY2016$’000
$ Inc / Dec on Last Year
% Inc / Dec on Last Year
Sales 90,829 98,514 7,685 8.5%
Gross Profit 58,247 64,934 6,687 11.5%
Gross Profit Margin 64.1% 65.9%
Other Income 2,034 1,763 (271) (13.3%)
% of Sales 2.2% 1.8%
Operating Expenses (1) (45,817) (49,143) (3,326) 7.3%
% of Sales 50.4% 49.9%
EBITDA 14,464 17,554 3,090 21.4%
EBITDA Margin % 15.9% 17.8%
EBIT 13,393 16,316 2,923 21.8%
EBIT Margin % 14.7% 16.6%
Net Profit After Tax 9,089 11,098 2,009 22.1%
NPAT Margin % 10.0% 11.3%
(1) Operating Expenses exclude depreciation, amortisation and financing costs
H1 FY2016 RESULT1
7
For
per
sona
l use
onl
y

TRADING PERFORMANCE2
For
per
sona
l use
onl
y

SALES
SALES: +8.5% Increased to $98.5m
• Record first half year sales• Company store sales increased by 11.5%• Sales to trade and commercial customers increased by 13.7% • Acquired franchised stores contributed to sales to Australian wholesale customers decreasing by 27.8%
66.174.5
90.898.5
Total Sales $m
H1 FY13 H1 FY14 H1 FY15 H1 FY16
8.5%
21.9%
12.7%
Sales Increase %
H1 FY15H1 FY14 H1 FY16
2
9
For
per
sona
l use
onl
y

COMPANY STORE COMPARATIVE SALES
COMPARATIVE SALES: +5.1% Increase
Company Store Comparative Sales Growth
5.1%
11.7%
5.1%
-2.3%
H1 FY15H1 FY14
H1 FY13
H1 FY16
• Solid 5.1% comparative sales growth over a very strong H1 FY2015 increase of 11.7%• Stronger comparative sales growth in Q2 FY2016 compared to Q1 FY2016 • Strong comparative sales in NSW and QLD• Positive comparative sales momentum in WA
2
10
For
per
sona
l use
onl
y
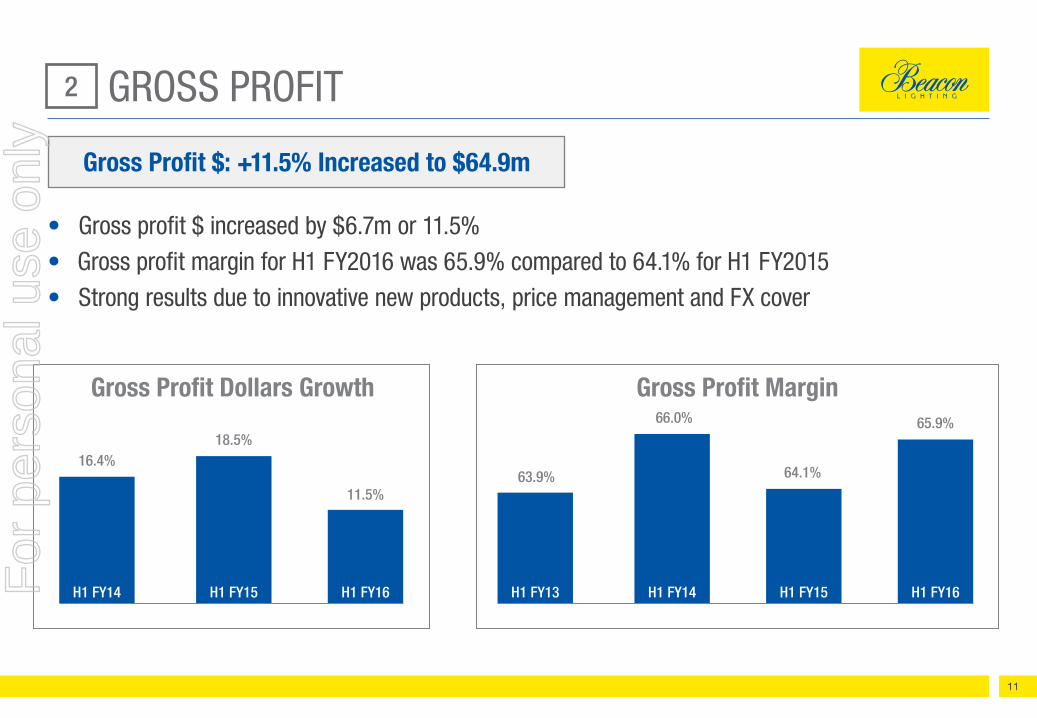
GROSS PROFIT
Gross Profit $: +11.5% Increased to $64.9m
• Gross profit $ increased by $6.7m or 11.5%• Gross profit margin for H1 FY2016 was 65.9% compared to 64.1% for H1 FY2015• Strong results due to innovative new products, price management and FX cover
63.9%
66.0%
64.1%
65.9%
Gross Profit Margin
H1 FY13 H1 FY14 H1 FY15 H1 FY16
11.5%
18.5%16.4%
Gross Profit Dollars Growth
H1 FY15H1 FY14 H1 FY16
2
11
For
per
sona
l use
onl
y
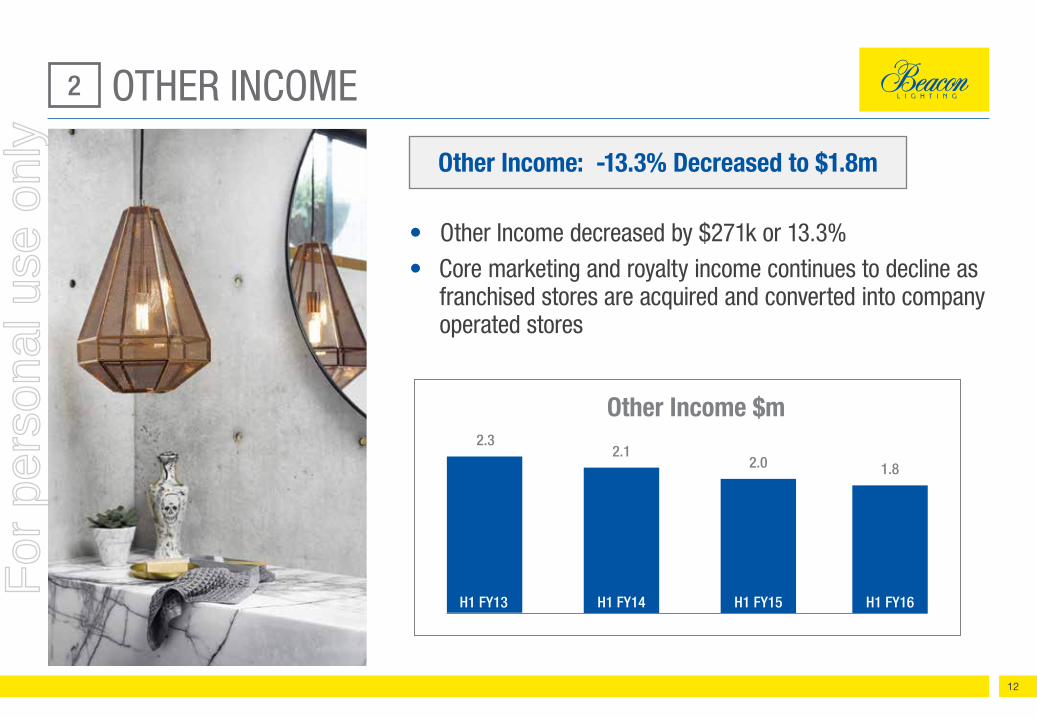
OTHER INCOME
Other Income: -13.3% Decreased to $1.8m
Other Income $m
1.82.02.1
2.3
H1 FY15H1 FY14H1 FY13 H1 FY16
• Other Income decreased by $271k or 13.3% • Core marketing and royalty income continues to decline as franchised stores are acquired and converted into company operated stores
2
12
For
per
sona
l use
onl
y

OPERATING EXPENSES
$ ‘000 H1 FY15 % to Sales H1 FY16 % to Sales
Sales 90,829 98,514
Operating Expenses (1)
- Marketing Expenses 5,619 6.2% 6,003 6.1%
- Selling and Distribution 32,216 35.5% 34,839 35.4%
- General and Admin 7,982 8.8% 8,302 8.4%
Total 45,817 50.4% 49,143 49.9%
Opex: Down 0.5% of Sales to $49.1m
54.8% 54.1%50.4% 49.9%
Opex % of Sales
H1 FY13 H1 FY14 H1 FY15 H1 FY16
• Operating expenses decreased by 0.5% of sales compared to H1 FY2015
• Productivity gains continue to be realised in relation to operating expenses
2
(1) Operating Expenses exclude depreciation, amortisation and financing costs
13
For
per
sona
l use
onl
y

EARNINGS
EBIT $m
8.2 7.2
4.712.5%
11.0 10.0
6.714.7%
14.517.5
13.416.3
9.1
11.1
15.9%17.8%
EBITDA $m
H1 FY13 H1 FY13
H1 FY13H1 FY13
H1 FY14 H1 FY14
H1 FY14H1 FY14
H1 FY15 H1 FY16 H1 FY16
H1 FY16 H1 FY16
H1 FY15
H1 FY15H1 FY15
EBITDA Margin NPAT $m
EBITDA: +21.4% to $17.5m
EBIT: +21.8% to $16.3m
NPAT: +22.1% to $11.1m
2
14
For
per
sona
l use
onl
y
CASH FLOW,BALANCE SHEET & DIVIDENDS
3
For
per
sona
l use
onl
y

CASH FLOW
$ ‘000 H1 FY15 H1 FY16
Cash Flow from Operations
Receipts from Customers 101,629 105,935
Payments to Suppliers & Employees (99,345) (94,869)
Other (590) (499)
Income Tax Paid (2,404) (3,379)
Net Operating Cash Flow (710) 7,188
Net Cash (Outflow) from Investing (3,898) (4,110)
Net Cash (Outflow) from Financing 3,728 (1,750)
Net Increase (Decrease) Cash (880) 1,328
$ ‘000 H1 FY15 H1 FY16
Other Details
Capital Expenditure (2,516) (2,720)
Dividends (3,011) (5,164)
Capital Expenditure $2.7m
• New Stores Capex $1.0m
• Information Tech. $0.9m
• Major Refits $0.3m
• Motor Vehicles $0.2m
• Other $0.3m
3
16
For
per
sona
l use
onl
y
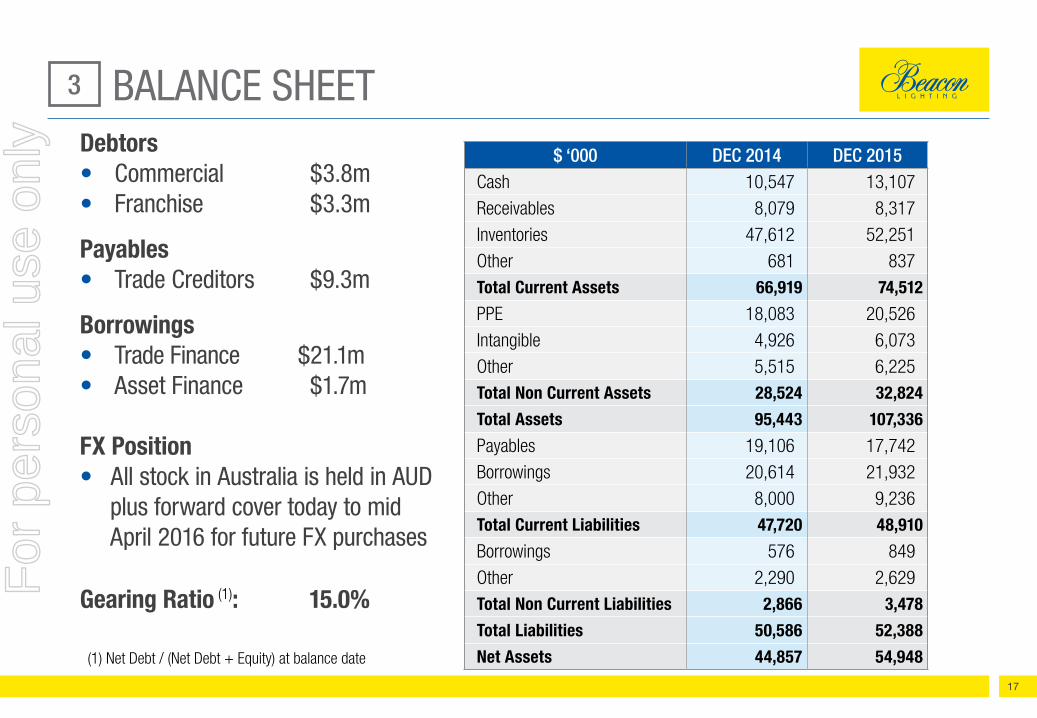
$ ‘000 DEC 2014 DEC 2015Cash 10,547 13,107
Receivables 8,079 8,317
Inventories 47,612 52,251
Other 681 837Total Current Assets 66,919 74,512
PPE 18,083 20,526
Intangible 4,926 6,073
Other 5,515 6,225Total Non Current Assets 28,524 32,824
Total Assets 95,443 107,336
Payables 19,106 17,742
Borrowings 20,614 21,932
Other 8,000 9,236Total Current Liabilities 47,720 48,910
Borrowings 576 849
Other 2,290 2,629Total Non Current Liabilities 2,866 3,478
Total Liabilities 50,586 52,388
Net Assets 44,857 54,948
Debtors• Commercial $3.8m• Franchise $3.3m
Payables• Trade Creditors $9.3m
Borrowings• Trade Finance $21.1m • Asset Finance $1.7m
FX Position• All stock in Australia is held in AUD plus forward cover today to mid April 2016 for future FX purchases Gearing Ratio (1): 15.0%
BALANCE SHEET
(1) Net Debt / (Net Debt + Equity) at balance date
3
17
For
per
sona
l use
onl
y
DIVIDENDS
• Earnings Per Share (EPS) increased by 22.1% to 5.16 cents per share
• Fully franked dividend of 2.3 cents per share for H1 FY2016
• Dividend increase of 27.8% over H1 FY2015 • Record date 4th March 2016
• Payment date 25th March 2016
• Payout ratio in the future expected to be 50% to 60% of annual NPAT
3
18
For
per
sona
l use
onl
y

GROWTH STRATEGIES4
For
per
sona
l use
onl
y

H1 FY2016 Store changes:• Purchased the Essendon (VIC) and Watergardens (VIC) franchise stores and converted them to company stores• Opened the Bundall (QLD) and Maribyrnong (VIC) stores• Expanded the Alexandria (NSW) Store
NEW STORE ROLLOUT
Excludes the four Commercial Sales Offices
48
FY2006
27
21
53
29
FY2007
24
59
38
FY2008
21
61
42
FY2009
19
66
48
FY2010
18
71
54
FY2011
17
74
58
FY2012
16
79
64
FY2013
15
85
71
FY2014
14
91
78
FY2015
13
82
93
FY2016
11
COMPANY STORES FRANCHISE STORES
4
20
For
per
sona
l use
onl
y

LATEST PRODUCTSLatest fashion, on trend and technologically advanced products for our customers
4
21
For
per
sona
l use
onl
y

LIGHT SOURCE SOLUTIONS
• Commenced Light Source Solutions, our GE globes distribution business in September 2015 in both Australia and New Zealand• Established company infrastructure to support the new business• Agreed to purchase all the existing GE stock at a discount to book value• Purchase new GE branded stock FOB ex Asia factory• Introduced new GE products (e.g. Bright Stik)• Pay an ongoing royalty to GE• Light Source Solutions is meeting our early expectations
4
22
For
per
sona
l use
onl
y

• Continued to leverage the benefits of a strong online presence combined with our bricks and mortar stores• Online fulfilment from all 93 stores. Click and collect available in all stores• Online sales grew by 20.0% to be 2.5% of total retail sales • Opened an eBay Beacon Lighting store in July 2015• Plan to upgrade website in H2 FY2016 to improve the mobile online user experience• Customers continue to be socially engaged through Facebook, Pinterest and Instagram• 34.0% of cutomers researched online before visiting our stores
OMNI CHANNEL4
23
For
per
sona
l use
onl
y

• JustEnough forecasting and replenishment system implemented for all stores• Increased interstate store supply through the 3PL supply network by 33.1% to 24.7% of wholesale distribution • 198 Accredited Lighting Design Consultants in the Group (including franchised stores)• Acquisitions with synergy to core business continue to be reviewed and considered• Continue to support the emerging businesses in Beacon International and Beacon Solar• Continue to leverage Group infrastructure to target ongoing productivity gains
4 OTHER STRATEGIES
24
For
per
sona
l use
onl
y

H2 FY2016 OUTLOOK5
For
per
sona
l use
onl
y

Beacon Lighting • Continue to drive company store comparative sales which have made a positive start to the new half year • Gungahlin (ACT), Preston (VIC) and Fairfield (QLD) are all planned to open • Continue to drive product innovation for our customers with 322 new fashion, on trend and energy efficient products to be released in H2 2016 • Support, grow and develop the Light Source Solutions, Beacon International and Beacon Solar businesses • Consider property investment opportunities in relation to Beacon Lighting locations • Continue to investigate and evaluate acquisition and expansion opportunities
Maket Conditions • General market conditions remain supportive of Beacon Lighting
Summary • Beacon Lighting expects the current growth strategies to continue to drive improved sales and profits in H2 FY2016
5 H2 FY2016 OUTLOOK
26
For
per
sona
l use
onl
y

QUESTIONS6
For
per
sona
l use
onl
y


![Q3 FY2016 Results Presentation [Company Update]](https://static.fdocuments.in/doc/165x107/577c874d1a28abe054c41fdf/q3-fy2016-results-presentation-company-update.jpg)