H & M Hennes & Mauritz AB · AI and advanced data analytics – very good results from ongoing...
17
Q1 H & M Hennes & Mauritz AB Three-month report First quarter (1 December 2017 – 28 February 2018) The H&M group’s sales including VAT amounted to SEK 53,554 m (54,369). Sales excluding VAT amounted to SEK 46,181 m (46,985). In local currencies, sales including VAT were unchanged in the first quarter. Gross profit amounted to SEK 23,040 m (24,466). This corresponds to a gross margin of 49.9 percent (52.1). Profit after financial items amounted to SEK 1,263 m (3,212). The group’s profit after tax amounted to SEK 1,372 m (2,457), corresponding to SEK 0.83 (1.48) per share. Profit development in the quarter was negatively affected by weak sales development as well as higher markdowns. The group had one-off positive tax income of SEK 399 m as a result of the US tax reform (Tax Cuts & Jobs Act). H&M’s online store in India, which was launched in mid-March, has got off to a very good start. The launch of H&M and H&M Home on Tmall in China on 21 March exceeded our high expectations. In 2018 Uruguay and Ukraine will become new H&M markets in the second half of the year. The global roll-out of online continues. With the launch of H&M online via franchise in Saudi Arabia and the United Arab Emirates in spring/summer 2018, H&M will offer online shopping in 47 markets. Afound will be launched as a new brand during 2018. Afound will be an off-price marketplace offering products from well-known and popular fashion and lifestyle brands, both external brands and those from the H&M group. Its first stores and a digital marketplace will open in Sweden to start with. AI and advanced data analytics – very good results from ongoing projects. Three new highly automated logistic centres with significantly increased capacity and efficiency and faster lead times will be introduced during the year. SEK m Q1 2018 Q1 2017 Net sales 46,181 46,985 Gross profit 23,040 24,466 gross margin, % 49.9 52.1 Operating profit 1,208 3,159 operating margin, % 2.6 6.7 Net financial items 55 53 Profit after financial items 1,263 3,212 Tax 109 -755 Profit for the period 1,372 2,457 Earnings per share, SEK 0.83 1.48 Definitions on key figures, see annual report 2016. First quarter 2018 SEK 54 billion Sales incl VAT H&M
Transcript of H & M Hennes & Mauritz AB · AI and advanced data analytics – very good results from ongoing...

Q1
H & M Hennes & Mauritz AB Three-month report
First quarter (1 December 2017 – 28 February 2018)
The H&M group’s sales including VAT amounted to SEK 53,554 m (54,369). Sales
excluding VAT amounted to SEK 46,181 m (46,985). In local currencies, sales including
VAT were unchanged in the first quarter.
Gross profit amounted to SEK 23,040 m (24,466). This corresponds to a gross margin
of 49.9 percent (52.1).
Profit after financial items amounted to SEK 1,263 m (3,212). The group’s profit after tax
amounted to SEK 1,372 m (2,457), corresponding to SEK 0.83 (1.48) per share. Profit
development in the quarter was negatively affected by weak sales development as
well as higher markdowns.
The group had one-off positive tax income of SEK 399 m as a result of the US tax
reform (Tax Cuts & Jobs Act).
H&M’s online store in India, which was launched in mid-March, has got off to a very
good start.
The launch of H&M and H&M Home on Tmall in China on 21 March exceeded our high
expectations.
In 2018 Uruguay and Ukraine will become new H&M markets in the second half of the
year.
The global roll-out of online continues. With the launch of H&M online via franchise in
Saudi Arabia and the United Arab Emirates in spring/summer 2018, H&M will offer
online shopping in 47 markets.
Afound will be launched as a new brand during 2018. Afound will be an off-price
marketplace offering products from well-known and popular fashion and lifestyle
brands, both external brands and those from the H&M group. Its first stores and a
digital marketplace will open in Sweden to start with.
AI and advanced data analytics – very good results from ongoing projects.
Three new highly automated logistic centres with significantly increased capacity and
efficiency and faster lead times will be introduced during the year.
SEK m
Q1
2018
Q1
2017
Net sales 46,181 46,985
Gross profit 23,040 24,466
gross margin, % 49.9 52.1
Operating profit 1,208 3,159
operating margin, % 2.6 6.7
Net financial items 55 53
Profit after financial items 1,263 3,212
Tax 109 -755
Profit for the period 1,372 2,457
Earnings per share, SEK 0.83 1.48
Definitions on key figures, see annual report 2016.
First quarter 2018
SEK 54 billion Sales incl VAT
H&M

Three-month report 2018 (1 Dec 2017 – 28 Feb 2018)
2
Comments by Karl-Johan Persson, CEO “The rapid transformation of the fashion retail sector continues. As communicated
previously, the start of the year has been tough. 2018 is a transitional year for the H&M
group, as we accelerate our transformation so that we can take advantage of the
opportunities generated by rapid digitalisation.
Weak sales in the fourth quarter, partly caused by imbalances in the assortment for the
H&M brand, resulted in the need for substantial clearance sales in the first quarter. The high
level of clearance sales combined with unusually cold winter weather had a negative impact
on the sales of the spring garments. In the first quarter the H&M group’s sales were
unchanged in local currencies.
Many of our ongoing initiatives are giving good indications and results, even though they
have not yet been implemented at a large enough scale to have a decisive effect on the
overall results. The weak sales development combined with substantial markdowns had a
significant negative impact on results in the first quarter.
Our transformation work continues with full force within the following priority action areas:
Restlessly develop our brands, focusing on H&M
Assortment – always have the best combination of fashion, quality, price and
sustainability.
Physical stores – develop new concepts and new formats at the same time as
optimising our existing store portfolio.
Online store – further enhanced through additional testing and faster
development.
Seamless – continued integration of the physical and digital stores so that
customers can move frictionlessly between channels, for example through
faster and more flexible delivery and payment options.
Accelerate our key enablers
Our supply chain - ensure a faster, more flexible and more efficient supply chain.
We are expanding our initiatives relating to advanced analytics and AI.
Continued investments in our tech foundation with robust scalable platforms,
faster development of various customer apps and new technologies.
New growth
Continued digital expansion of existing brands into new markets and by working
with external partners and social platforms. Widen the product assortment.
New stores for existing brands, H&M focusing on emerging markets.
We are developing new concepts and business models.
Good cost control and efficiencies
With good cost control, operating costs are expected to continue to increase at a
slow rate.
Ongoing efficiencies, with several promising initiatives within buying and
production. In addition, the weaker US dollar is currently having a favourable
impact on our purchasing costs.
Great potential for lower markdown costs in relation to sales from 2019 onwards.
Our assessment remains that sales for online and New Business will grow by more than
25 percent during the year, and that the H&M group will achieve a somewhat better result
for full-year 2018 compared with the previous year. We take a long-term view that together
with our knowledge and experience enable us to navigate through times such as this. We
look forward to telling you more about the H&M group’s continued transformation work,
which will lead us back to healthy growth in both sales and profitability.”
& Other Stories

Three-month report 2018 (1 Dec 2017 – 28 Feb 2018)
3
Sales Online sales for the H&M group increased by approximately 20 percent compared to the
first quarter the previous year.
Total sales for the new brands (new business) increased by 15 percent in the quarter
compared to the corresponding period the previous year.
The assessment is still that both online sales and new business will increase by more than
25 percent for the full year.
Sales including VAT amounted to SEK 53,554 m (54,369) in the first quarter. In local
currencies the H&M group’s sales including VAT were unchanged.
Sales excluding VAT amounted to SEK 46,181 m (46,985) in the first quarter.
Sales in top ten markets, first quarter
The difference between the sales increase in SEK and in local currencies is due to how the
Swedish krona has developed against the overall basket of currencies in the group
compared to the same period last year. Currency translation effects arise when sales and
profits in local currencies are translated into the company’s reporting currency, which is
SEK. A negative currency translation effect arises when the Swedish krona strengthens and
a positive currency translation effect arises when the Swedish krona weakens.
54,369 53,554
- 1%
0
10,000
20,000
30,000
40,000
50,000
60,000
Q1
SEK m incl VAT
2017
2018
Q1 - 2018 Q1 - 2017 28 Feb - 18 Q1 - 2018
SEK m
incl VAT
SEK m
incl VAT
SEK Local
currency
Number of
stores
New stores
(net)
Germany 8,133 8,413 -3 -6 461 -2
USA 6,032 6,790 -11 -1 543 7
UK 3,362 3,395 -1 0 286 -6
France 3,120 3,354 -7 -10 236 -4
China 2,571 2,755 -7 -3 513 7
Sweden 2,249 2,372 -5 -5 170 -2
Italy 2,090 2,145 -3 -5 173 -2
Spain 1,981 1,882 5 2 175 0
Netherlands 1,655 1,630 2 -1 143 -2
Denmark 1,391 1,338 4 1 110 0
Others* 20,970 20,295 3 6 1,933 8
Total 53,554 54,369 -1 0 4,743 4
* Of which franchises 1,342 1,220 10 21 225 6
Change in %
ARKET
Three-month report 2018 (1 Dec 2017 – 28 Feb 2018)
4
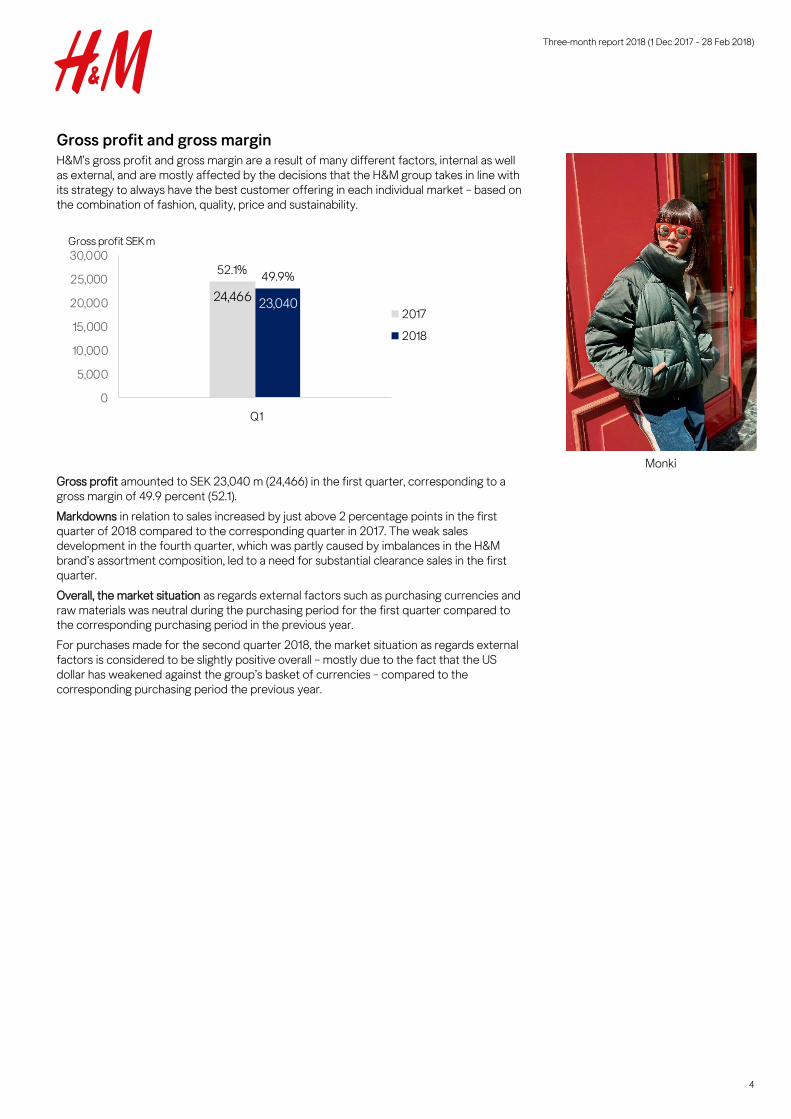
Gross profit and gross margin H&M’s gross profit and gross margin are a result of many different factors, internal as well
as external, and are mostly affected by the decisions that the H&M group takes in line with
its strategy to always have the best customer offering in each individual market – based on
the combination of fashion, quality, price and sustainability.
Gross profit amounted to SEK 23,040 m (24,466) in the first quarter, corresponding to a
gross margin of 49.9 percent (52.1).
Markdowns in relation to sales increased by just above 2 percentage points in the first
quarter of 2018 compared to the corresponding quarter in 2017. The weak sales
development in the fourth quarter, which was partly caused by imbalances in the H&M
brand’s assortment composition, led to a need for substantial clearance sales in the first
quarter.
Overall, the market situation as regards external factors such as purchasing currencies and
raw materials was neutral during the purchasing period for the first quarter compared to
the corresponding purchasing period in the previous year.
For purchases made for the second quarter 2018, the market situation as regards external
factors is considered to be slightly positive overall – mostly due to the fact that the US
dollar has weakened against the group’s basket of currencies – compared to the
corresponding purchasing period the previous year.
24,46623,040
52.1%49.9%
0
5,000
10,000
15,000
20,000
25,000
30,000
Gross profit SEK m
Q1
2017
2018
Monki

Three-month report 2018 (1 Dec 2017 – 28 Feb 2018)
5
Selling and administrative expenses
Cost control in the group remains good. In the first quarter of 2018, selling and
administrative expenses increased by 2 percent in SEK and by 4 percent in local currencies
compared to the first quarter the previous year.
Profit after financial items
Profit after financial items amounted to SEK 1,263 m (3,212) in the first quarter.
The weak sales development and the substantial markdowns had a significant negative
impact on results and profitability in the first quarter.
The first quarter is the clearance sale quarter, which includes low sales months such as
January and February. This means that Q1 is the quarter with the lowest sales and
profitability, with a greater proportion of fixed costs compared with other quarters. Q1 is
therefore the most sensitive quarter as regards large deviations in sales.
Profit after tax amounted to SEK 1,372 m (2,457) which includes one-off positive tax income
of SEK 399 m related to the US tax reform (Tax Cuts & Jobs Act). Cash flow was not
affected by this one-off effect.
21,307 21,832
+ 2%
0
5,000
10,000
15,000
20,000
25,000
Q1
SEK m
2017
2018
3,212
1,263
- 61%
0
1,000
2,000
3,000
4,000
Q1
SEK m
2017
2018
H&M Home

Three-month report 2018 (1 Dec 2017 – 28 Feb 2018)
6
Stock-in-trade
Stock-in-trade amounted to SEK 34,959 m (32,692), an increase of 7 percent in SEK
compared to the same point in time last year. Currency adjusted the increase was
8 percent.
The increase in stock-in trade is explained by the expansion, but also by the weak sales
development in the quarter. As a result, stock-in-trade as of 28 February 2018 is higher than
planned which will lead to increased markdowns in the second quarter of 2018 compared
to the corresponding quarter last year.
The stock-in-trade amounted to 17.6 percent (16.7) of sales excluding VAT, rolling twelve
months and 32.3 percent (33.4) of total assets.
Expansion The online expansion will continue in 2018 to countries including India, which opened in
March, and via franchise partners to Saudi Arabia and the United Arab Emirates in
spring/summer 2018. The plan is to offer e-commerce in all store markets as well as in
other markets. New H&M store markets in 2018 will be Uruguay and Ukraine, which will
open in the second half of the year.
For full-year 2018 a net addition of approximately 220 new stores is planned. Most of the
new stores in 2018 will be H&M stores, of which 45 will have H&M Home shop-in-shops,
while approximately 90 stores will consist of the brands COS, & Other Stories, Monki,
Weekday, ARKET and Afound. In 2018, eight standalone H&M Home stores are planned to
open.
In parallel with the expansion, the store portfolio is being optimised as regards the number
of stores, store space, rebuilds and relocations to continually ensure that the store portfolio
is the best fit for each market.
32,69234,959
+ 7%
0
5,000
10,000
15,000
20,000
25,000
30,000
35,000
28 February
SEK m
2017
2018
H&M

Three-month report 2018 (1 Dec 2017 – 28 Feb 2018)
7
Store count by brand
In the first quarter, excluding franchise, the group opened 32 (62) stores and closed 34 (25)
stores, i.e. a net change of -2 (42) stores. Via franchise partners 6 (6) new stores were
opened and 0 (1) stores were closed. The group had 4,743 (4,393) stores as of 28 February
2018, of which 225 (193) were operated by franchise partners.
Store count by region
Expansion
2018
Brand Store Online New markets
H&M 69 44 Store: Uruguay, Ukraine
Online: India**, Kuwait (franchise)*, United
Arab Emirates (franchise), Saudi Arabia
(franchise)
COS 37 20 Store: Thailand (franchise)
Monki 14 19 Store: Kuwait (franchise)**
Weekday 9 18 Store: Finland
& Other Stories 16 15 Store: Austria, Kuwait (franchise)**
Cheap Monday 2 18
ARKET 4 18 Store: Netherlands**, Sweden
H&M Home 46 38 Store: Ukraine, Morocco (franchise)
** Opened in March - 2018
No. of markets
28 Feb - 2018
* Opened until 28 Feb - 2018
Brand Q1 - 2018 28 Feb - 2018 28 Feb - 2017
H&M 5 4,293 4,001
COS 0 231 199
Monki -1 118 115
Weekday 0 33 27
& Other Stories 0 60 48
Cheap Monday 0 3 3
ARKET 0 5 0
Total 4 4,743 4,393
New Stores (net) Total No of stores
Region Q1 - 2018 28 Feb - 2018 28 Feb - 2017
Europe & Africa -20 2,988 2,885
Asia & Oceania 16 1,062 902
North & South America 8 693 606
Total 4 4,743 4,393
New Stores
(net)
Total No of stores
COS

Three-month report 2018 (1 Dec 2017 – 28 Feb 2018)
8
Tax The US tax reform (Tax Cuts & Jobs Act) was enacted in December 2017. For H&M this
means that deferred tax liabilities and deferred tax claims assignable to H&M’s US
subsidiary were remeasured during the first quarter 2018. The group had one-off positive
tax income of SEK 399 m in the quarter as a result of this remeasurement. Cash flow was
not affected by this one-off effect.
The H&M group’s tax rate for the 2017/2018 financial year is expected to be approximately
22.0 – 23.0 percent excluding the one-off effect described above. In the first, second and
third quarters of 2018 a tax rate of 23.0 percent will be used to calculate tax expense on
the result of each quarter. The outcome of the tax rate for the year depends on the results
of the group’s various companies and the corporate tax rates in each country.
Financing As of 28 February 2018, the group had SEK 9,770 m (1,250) in loans from credit institutions
with a term of up to 12 months as well as SEK 1,008 m (0) in loans from credit institutions
with a term of up to 24 months.
As previously communicated, during the first quarter 2017 the H&M group signed a five-
year revolving credit facility (RCF) of EUR 700 m. The RCF has not yet been drawn down
and serves as the group’s liquidity reserve.
Net debt in relation to EBITDA amounted to 0.0, the same level as in the previous quarter.
The strong credit profile of the H&M group enables cost-effective financing. To increase
financing flexibility and cost-effectiveness, the group continuously reviews opportunities to
complement this with other sources of funding on the credit market.
Accounting principles The group applies International Financial Reporting Standards (IFRS) as adopted by the EU.
This report has been prepared according to IAS 34 Interim Financial Reporting as well as
the Swedish Annual Accounts Act.
The accounting principles and calculation methods applied in this report are unchanged
from those used in the preparation of the annual report and consolidated financial
statements for 2016 which are described in Note 1 – Accounting principles.
H & M Hennes & Mauritz AB’s financial instruments consist of accounts receivable, other
receivables, cash and cash equivalents, accounts payable, accrued trade payables, interest-
bearing securities and currency derivatives. Currency derivatives are measured at fair value
based on input data corresponding to level 2 of IFRS 13. As of 28 February 2018, forward
contracts with a positive market value amount to SEK 332 m (439), which is reported under
other current receivables. Forward contracts with a negative market value amount to SEK
977 m (562), which is reported under other current liabilities. Other financial assets and
liabilities have short terms. It is therefore judged that the fair values of these financial
instruments are approximately equal to their book values.
The parent company applies the Swedish Annual Accounts Act and the Swedish Financial
Reporting Board’s recommendation RFR 2 Accounting for Legal Entities, which essentially
involves applying IFRS. In accordance with RFR 2, the parent company does not apply IAS
39 to the measurement of financial instruments; nor does it capitalise development
expenditure.
For definitions see annual report and consolidated accounts for 2016.
Risks and uncertainties A number of factors may affect the H&M group’s result and business. Many of these can be
dealt with through internal routines, while certain others are affected more by external
influences. There are risks and uncertainties for the H&M group related to fashion, weather
conditions, macroeconomic and geopolitical changes, sustainability issues, foreign currency,
cyber-attacks, tax and different regulations but also in connection with expansion into new
markets, the launch of new concepts and how the brand is managed.
For a more detailed description of risks and uncertainties, refer to the administration report
and to note 2 in the annual report and consolidated accounts for 2016.

Three-month report 2018 (1 Dec 2017 – 28 Feb 2018)
9
Calendar
8 May 2018, 3 p.m. CET Annual general meeting 2018, Erling Persson Hall,
Aula Medica, Karolinska Institutet, Solna
15 June 2018 Sales development in second quarter 2018, 1 March 2018
– 31 May 2018
28 June 2018 Six-month report, 1 Dec 2017 – 31 May 2018
17 September 2018 Sales development in third quarter 2018, 1 Jun 2018 – 31
Aug 2018
27 September 2018 Nine-month report, 1 Dec 2017 – 31 Aug 2018
This three-month report has not been audited by the company’s auditors.
Stockholm, 26 March 2018
Board of Directors
Contact A telephone conference for the financial market and media will be held in English on 27
March at 9:00 CET in which Karl-Johan Persson CEO, Jyrki Tervonen CFO and Nils Vinge
Head of IR will participate.
For log-in details and registration please visit:
about.hm.com/en/media/calendar/three-month-report0.html
Registration can be made until 27 March 10.00 CET. After 10.00 CET Nils Vinge will be
available on +46 8 796 52 50 or via email: [email protected].
For interview requests with Karl-Johan Persson CEO and Nils Vinge Head of IR in
conjunction to the three-month report please contact:
Kristina Stenvinkel, Communications Director
Phone: +46 8 796 39 08
Email: [email protected]
H & M Hennes & Mauritz AB (publ)
SE-106 38 Stockholm
Phone: +46-8-796 55 00, Fax: +46-8-24 80 78, E-mail: [email protected]
Registered office: Stockholm, Reg. No. 556042-7220
Information in this interim report is that which H & M Hennes & Mauritz AB (publ) is required to disclose under the EU Market Abuse Regulation
(596/2014/EU). The information was submitted for publication by the abovementioned persons at 8.00 (CET) on 27 March 2018. This interim
report and other information about H&M, is available at about.hm.com.
H & M Hennes & Mauritz AB (publ) was founded in Sweden in 1947 and is quoted on Nasdaq Stockholm. H&M’s business idea is to offer fashion and quality at the best
price in a sustainable way. In addition to H&M, the group includes the brands COS, Monki, Weekday, Cheap Monday, & Other Stories and H&M Home as well as ARKET.
The H&M group has 45 online markets and more than 4,700 stores in 69 markets including franchise markets. In 2017, sales including VAT were SEK 232 billion. The
number of employees amounts to more than 171,000. For further information, visit about.hm.com.

Three-month report 2018 (1 Dec 2017 – 28 Feb 2018)
10
Q1
2018
Q1
2017
1 Dec 2016-
30 Nov 2017
Sales including VAT 53,554 54,369 231,771
Sales excluding VAT 46,181 46,985 200,004
Cost of goods sold -23,141 -22,519 -91,914
GROSS PROFIT 23,040 24,466 108,090
Gross margin, % 49.9 52.1 54.0
Selling expenses -19,976 -19,553 -80,427
Administrative expenses -1,856 -1,754 -7,094
OPERATING PROFIT 1,208 3,159 20,569
Operating margin, % 2.6 6.7 10.3
Net financial items 55 53 240
PROFIT AFTER FINANCIAL ITEMS 1,263 3,212 20,809
Tax 109 -755 -4,625
PROFIT FOR THE PERIOD 1,372 2,457 16,184
All profit for the year is attributable to the shareholders of the parent company H & M Hennes & Mauritz AB.
Earnings per share, SEK* 0.83 1.48 9.78
Number of shares, thousands* 1,655,072 1,655,072 1,655,072
Depreciation, total 2,279 2,106 8,488
of which cost of goods sold 151 204 736
of which selling expenses 1,984 1,760 7,175
of which administrative expenses 144 142 577
* Before and after dilution.
CONSOLIDATED STATEMENT OF COMPREHENSIVE INCOME (SEK m)
Q1
2018
Q1
2017
1 Dec 2016-
30 Nov 2017
PROFIT FOR THE PERIOD 1,372 2,457 16,184
Other comprehensive income
Items that are or may be reclassified to profit or loss
Translation differences 606 -502 -1,496
Change in hedging reserves 38 268 -179
Tax attributable to change in hedging reserves -9 -64 39
Items that will not be classified to profit or loss
Remeasurement of defined benefit pension plans - - 78
Tax related to the above remeasurement - - -19
OTHER COMPREHENSIVE INCOME 635 -298 -1,577
TOTAL COMPREHENSIVE INCOME FOR THE PERIOD 2,007 2,159 14,607
All comprehensive income is attributable to the shareholders of the parent company H & M Hennes & Mauritz AB.
GROUP INCOME STATEMENT IN SUMMARY (SEK m)

Three-month report 2018 (1 Dec 2017 – 28 Feb 2018)
11
GROUP BALANCE SHEET IN SUMMARY (SEK m)
ASSETS 28 Feb - 2018 28 Feb - 2017 30 Nov 2017
Fixed assets
Intangible fixed assets 7,482 5,727 7,043
Property, plant and equipment 39,570 38,220 39,818
Other fixed assets 3,635 3,822 3,955
50,687 47,769 50,816
Current assets
Stock-in-trade 34,959 32,692 33,712
Current receivables 12,646 8,882 12,316
Cash and cash equivalents 10,003 8,437 9,718
57,608 50,011 55,746
TOTAL ASSETS 108,295 97,780 106,562
EQUITY AND LIABILITIES
Equity 61,720 63,402 59,713
Long-term liabilities* 6,713 5,647 6,126
Current liabilities** 39,862 28,731 40,723
TOTAL EQUITY AND LIABILITIES 108,295 97,780 106,562
* Interest-bearing long-term liabilities amounts to SEK 1,818 m (737).
CHANGE IN GROUP EQUITY IN SUMMARY (SEK m)
28 Feb - 2018 28 Feb - 2017 30 Nov 2017
Shareholders' equity at the beginning of the period 59,713 61,236 61,236
Adjustment of opening balance* - 7 7
Total comprehensive income for the period 2,007 2,159 14,607
Dividend - - -16,137
Shareholders' equity at the end of the period 61,720 63,402 59,713
*Change of accounting principles regarding defined-contribution pension previous years.
** Interest-bearing current liabilities amounts to SEK 9,898 m (1,313).

Three-month report 2018 (1 Dec 2017 – 28 Feb 2018)
12
GROUP CASH FLOW STATEMENT (SEK m)
Q1 - 2018 Q1 - 2017
Current operations
Profit after financial items* 1,263 3,212
Provisions for pensions 11 1
Depreciation 2,279 2,106
Tax paid 257 -1,397
Other -6 4
Cash flow from current operations before changes in working capital 3,804 3,926
Cash flow from changes in working capital
Current receivables -807 358
Stock-in-trade -1,037 -1,084
Current liabilities -653 -839
CASH FLOW FROM CURRENT OPERATIONS 1,307 2,361
Investment activities
Investment in intangible fixed assets -615 -500
Investment in tangible fixed assets -1,493 -1,918
Other investments -101 -33
CASH FLOW FROM INVESTMENT ACTIVITIES -2,209 -2,451
Financing activities
Change in interest-bearing liabilities 1,003 -833
CASH FLOW FROM FINANCING ACTIVITIES 1,003 -833
CASH FLOW FOR THE PERIOD 101 -923
Cash and cash equivalents at beginning of the financial year 9,718 9,446
Cash flow for the period 101 -923
Exchange rate effect 184 -86
Cash and cash equivalents at end of the period** 10,003 8,437
* Interest paid for the group amounts to SEK 15 m (1).
** Cash and cash equivalents and short-term investments at the end of the period amounted to SEK 10,003 m (8,437).

Three-month report 2018 (1 Dec 2017 – 28 Feb 2018)
13
SALES INCLUDING VAT BY MARKET AND NUMBER OF STORES
Q1, 1 December - 28 February
Market Q1 - 2018 Q1 - 2017 28 Feb - 18
SEK m SEK m SEK Local
currency
No. of stores New
stores
Closed
stores
Sweden 2,249 2,372 -5 -5 170 2
Norway 1,320 1,492 -12 -7 128
Denmark 1,391 1,338 4 1 110
UK 3,362 3,395 -1 0 286 6
Switzerland 1,238 1,494 -17 -12 99 1
Germany 8,133 8,413 -3 -6 461 1 3
Netherlands 1,655 1,630 2 -1 143 1 3
Belgium 1,092 1,110 -2 -4 96 1
Austria 1,262 1,285 -2 -4 86
Luxembourg 106 111 -5 -8 10
Finland 685 688 0 -3 63 1
France 3,120 3,354 -7 -10 236 4
USA 6,032 6,790 -11 -1 543 10 3
Spain 1,981 1,882 5 2 175 2 2
Poland 1,382 1,178 17 9 177 2
Czech Republic 412 355 16 7 50 1 1
Portugal 327 317 3 0 32
Italy 2,090 2,145 -3 -5 173 2
Canada 989 1,074 -8 -3 91
Slovenia 125 124 1 -2 12 1
Ireland 292 275 6 3 24
Hungary 442 392 13 10 45
Slovakia 197 169 17 13 23 1
Greece 476 444 7 4 35
China 2,571 2,755 -7 -3 513 8 1
Hong Kong 386 479 -19 -9 29 1
Japan 969 1,022 -5 2 82
Russia 1,195 1,094 9 16 135 1
South Korea 424 427 -1 2 41
Turkey 683 667 2 19 68 2
Romania 594 532 12 12 56
Croatia 187 190 -2 -5 15
Singapore 237 273 -13 -10 12 1
Bulgaria 160 148 8 6 20
Latvia 85 83 2 -1 8
Malaysia 345 346 0 -1 44
Mexico 826 546 51 53 38 1
Chile 486 368 32 37 8
Lithuania 85 88 -3 -6 9
Serbia 102 90 13 6 12
Estonia 94 88 7 4 10
Australia 595 673 -12 -6 32
Philippines 317 289 10 24 32
Taiwan 189 224 -16 -12 12
Peru 241 250 -4 5 8
Macau 32 41 -22 -9 2
India 349 288 21 27 29 2
South Africa 267 246 9 11 17
Puerto Rico 17 36 -53 -47 2
Cyprus 23 26 -12 -15 1
New Zealand 75 53 42 56 3
Kazakhstan 44 3
Colombia 123 3
Iceland 60 2
Vietnam 69 3 1
Georgia 24 1
Franchise 1,342 1,220 10 21 225 6
Total 53,554 54,369 -1 0 4,743 38 34
Change in % Q1 - 2018

Three-month report 2018 (1 Dec 2017 – 28 Feb 2018)
14
FIVE YEAR SUMMARY
Q1, 1 December - 28 February
2014 2015 2016 2017 2018
Sales including VAT, SEK m 37,524 46,791 50,624 54,369 53,554
Sales excluding VAT, SEK m 32,143 40,276 43,691 46,985 46,181
Change sales excl. VAT from previous year in SEK, % 13 25 8 8 -2
Change sales excl. VAT previous year in local currencies, % 12 15 9 4 0
Operating profit, SEK m 3,401 4,637 3,270 3,159 1,208
Operating margin, % 10.6 11.5 7.5 6.7 2.6
Depreciations for the period, SEK m 1,208 1,556 1,819 2,106 2,279
Profit after financial items, SEK m 3,486 4,723 3,327 3,212 1,263
Profit after tax, SEK m 2,649 3,613 2,545 2,457 1,372
Cash and cash equivalents and short-term investments, SEK m 18,226 20,026 14,571 8,437 10,003
Stock-in-trade, SEK m 15,865 20,266 25,153** 32,692** 34,959**
Equity, SEK m 47,586 56,933 59,401 63,395 61,720
Number of shares, thousands* 1,655,072 1,655,072 1,655,072 1,655,072 1,655,072
Earnings per share, SEK* 1.60 2.18 1.54 1.48 0.83
Equity per share, SEK* 28.75 34.40 35.89 38.30 37.29
Cash flow from current operations
per share, SEK* 1.61 2.98 2.61 1.43 0.79
Share of risk-bearing capital, % 76.2 73.0 72.1 69.9 61.5
Equity/assets ratio, % 72.1 68.9 67.2 64.8 57.0
Total number of stores 3,192 3,551 3,970 4,393 4,743
Rolling twelve months
Earnings per share, SEK* 10.48 12.65 11.98 11.21 9.12
Return on equity, % 37.2 40.1 34.1 30.2 24.1
Return on capital employed, % 48.5 51.5 44.1 38.2 27.2
* Before and after dilution.
For definitions of key figures see the annual report
** The booked value of stock-in-trade for 2016-2018 is approximately 5 percent higher than previous years as a result of improved invoicing processes.
Accounts payable have increased with the corresponding amount.

Three-month report 2018 (1 Dec 2017 – 28 Feb 2018)
15
SEGMENT REPORTING (SEK m)
Q1 - 2018 Q1 - 2017
Asia and Oceania
External net sales 7,112 7,327
Operating profit -120 -46
Operating margin, % -1.7 -0.6
Europe and Africa
External net sales 31,041 31,251
Operating profit -2,035 -1,247
Operating margin, % -6.6 -4.0
North and South America
External net sales 8,028 8,407
Operating profit -272 -397
Operating margin, % -3.4 -4.7
Group Functions
Net sales to other segments 16,400 18,036
Operating profit 3,635 4,849
Eliminations
Net sales to other segments -16,400 -18,036
Total
External net sales 46,181 46,985
Operating profit 1,208 3,159
Operating margin, % 2.6 6.7

Three-month report 2018 (1 Dec 2017 – 28 Feb 2018)
16
PARENT COMPANY INCOME STATEMENT IN SUMMARY (SEK m)
Q1
2018
Q1
2017
1 Dec 2016-
30 Nov 2017
External sales excluding VAT 5 - 13
Internal sales excluding VAT* 999 916 4,069
GROSS PROFIT 1,004 916 4,082
Administrative expenses -42 -44 -158
OPERATING PROFIT 962 872 3,924
Net financial items** 76 418 12,931
PROFIT AFTER FINANCIAL ITEMS 1,038 1,290 16,855
Year-end appropriations - - -328
Tax -217 -190 -773
PROFIT FOR THE PERIOD 821 1,100 15,754
PARENT COMPANY STATEMENT OF COMPREHENSIVE INCOME (SEK m)
Q1
2018
Q1
2017
1 Dec 2016-
30 Nov 2017
PROFIT FOR THE PERIOD 821 1,100 15,754
Other comprehensive income
Items that have not been and will not be reclassified to profit or loss
Remeasurement of defined benefit pension plans - - -1
Tax related to the above remeasurement - - 0
OTHER COMPREHENSIVE INCOME - - -1
TOTAL COMPREHENSIVE INCOME FOR THE PERIOD 821 1,100 15,753
* Internal sales in the quarter consists of royalty of SEK 997 m (914) and other SEK 2 m (2) received from group companies.
** Dividend income from subsidiaries in the quarter consists of SEK 50 m (426) .

Three-month report 2018 (1 Dec 2017 – 28 Feb 2018)
17
PARENT COMPANY BALANCE SHEET IN SUMMARY (SEK m)
28 Feb - 2018 28 Feb - 2017 30 Nov 2017
ASSETS
Fixed assets
Property, plant and equipment 349 425 367
Financial fixed assets 1,654 1,619 1,627
2,003 2,044 1,994
Current assets
Current receivables 20,154 16,614 19,312
Cash and cash equivalents 235 112 133
20,389 16,726 19,445
TOTAL ASSETS 22,392 18,770 21,439
EQUITY AND LIABILITIES
Equity 17,299 17,957 16,478
Untaxed reserves 417 429 417
Long-term liabilities* 182 191 182
Current liabilities** 4,494 193 4,362
TOTAL EQUITY AND LIABILITIES 22,392 18,770 21,439
* Relates to provisions for pensions.
** Interest-bearing current liabilities amounts to SEK 4,000 m (0).