Gujarat International finance tech city
81
1 Gujarat International Finance Tec-City
-
Upload
kunik-swaroop -
Category
Documents
-
view
47 -
download
3
description
GIFT Presentation GUJARAT
Transcript of Gujarat International finance tech city
1
Gujarat International Finance Tec-City
2
Why Invest in India?

3
India has witnessed steady growth and is set to become an economic superpower in the 21st century
GDP growth trajectory
Real GDPUS$ billion
625473
2791591188660
1950
+5%+3%
+5%
3%
+6%
1960 20001970 20051980 1990
+4%
GDP Contribution (%)
20.1
5.02.1
Contribution to incremental GDP growth of major world economies*
*Major economies considered are the BRIC and G6 countries
2000 2020 2050
– Progressive and stable environment
• Commitment to liberalization across political parties, both central and state. WTO an additional catalyst
• A healthy economic environment with stable financial markets
– Increased consumption
• Fast growing middle-class with increased spending ability. A young population ensures savings and investment rates will rise
– Infrastructure growth
• Government, private and international investments in telecom, transport, power and IT parks are driving growth
– Emergence of strong corporate India
• Home grown local innovators and MNCs alike have shaped the landscape and set up large scale profitable businesses
• The next wave of manufacturing will further bolster GDP growth – India will become a global sourcing base in skill intensive sectors
Why growth is likely to sustain
Source: Press Search, Goldman Sachs BRIC report 2003
4
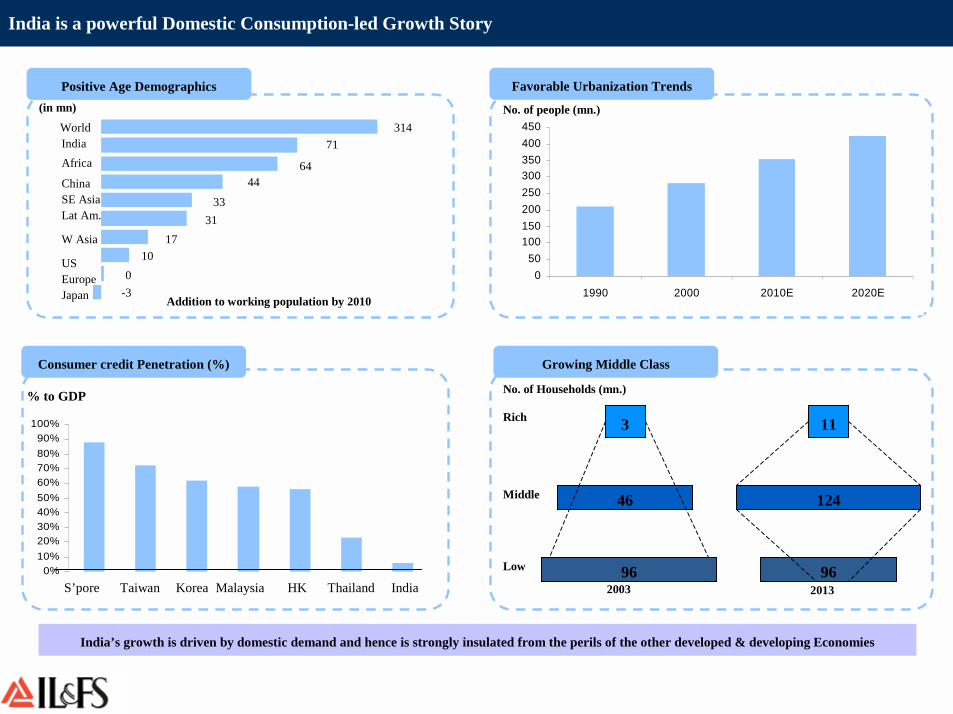
India is a powerful Domestic Consumption-led Growth Story
India’s growth is driven by domestic demand and hence is strongly insulated from the perils of the other developed & developing Economies
0%10%20%30%40%50%60%70%80%90%
100%
S’pore Taiwan Korea Malaysia HK Thailand India
050
100150200250300350400450
1990 2000 2010E 2020E
% to GDP
3 11
46 124
96962003 2013
No. of Households (mn.)
Rich
Middle
Low
No. of people (mn.)(in mn)
Addition to working population by 2010
WorldIndiaAfrica
ChinaSE AsiaLat Am.
W Asia
EuropeUS
Japan
31471
6444
3331
1710
0-3
Favorable Urbanization TrendsPositive Age Demographics
Consumer credit Penetration (%) Growing Middle Class
5
How attractive is India as a destination for doing Business?

6
India is emerging as an ‘Off shoring Hub’ for the entire spectrum of Services
CIO views on % increase in Offshore spending for specific locations*
* change relative to current spending levels
Source: Morgan Stanley Chief Investment Officer Survey, May 2005
India
China
Other Asia
E. Europe
Canada
Other Euro.
Lat Am
56
38
27
22
20
3
2
Source: Citigroup Smith Barney
Select Global companies with Offshoring presence across Services spectrum
India- Most Favored Offshore DestinationOff shoring ‘Sweet Spot’ for Indian Services companies
• Increasing number of Pharmaceutical Companies of US and UK are out
sourcing their clinical research to India
• Leading law firms have been off shoring their operation to India
• Global IT executives willing to move higher-end work offshore; Indian
service providers moving up the value-chain
• Citi, Lehman, JPMC, Morgan Stanley, Meryllynch are off shoring not
just the back end but also the front end business to India
CRO Legal IT Finance
7
What are the USPs for investing in India?
8
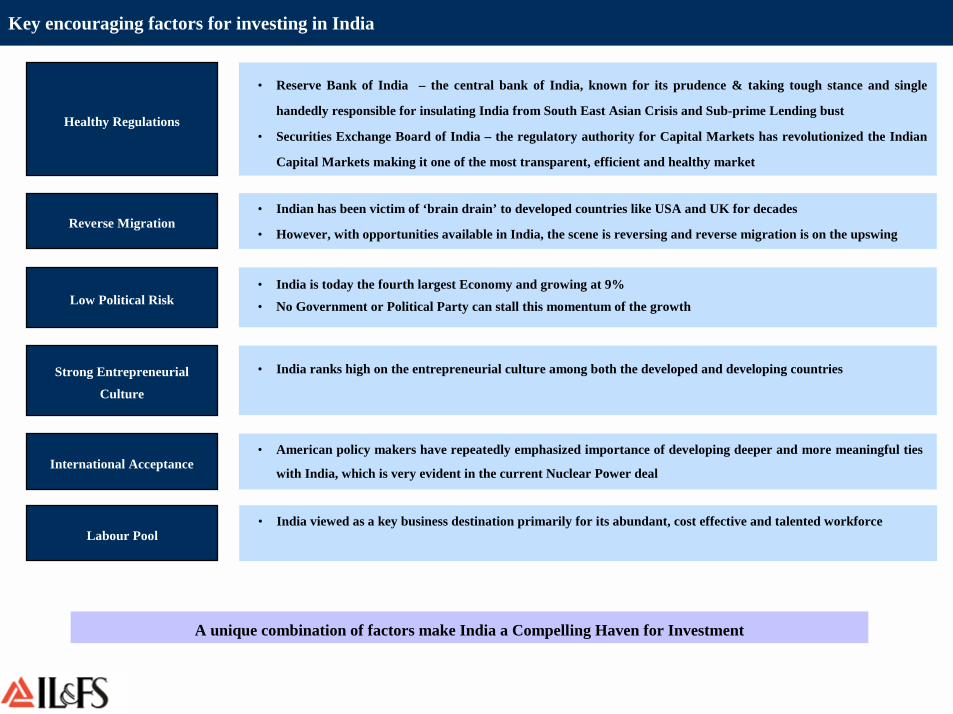
Key encouraging factors for investing in India
A unique combination of factors make India a Compelling Haven for Investment
Healthy Regulations
Reverse Migration
Strong Entrepreneurial
Culture
International Acceptance
• Reserve Bank of India – the central bank of India, known for its prudence & taking tough stance and single
handedly responsible for insulating India from South East Asian Crisis and Sub-prime Lending bust
• Securities Exchange Board of India – the regulatory authority for Capital Markets has revolutionized the Indian
Capital Markets making it one of the most transparent, efficient and healthy market
• Indian has been victim of ‘brain drain’ to developed countries like USA and UK for decades
• However, with opportunities available in India, the scene is reversing and reverse migration is on the upswing
• India ranks high on the entrepreneurial culture among both the developed and developing countries
• American policy makers have repeatedly emphasized importance of developing deeper and more meaningful ties
with India, which is very evident in the current Nuclear Power deal
Low Political Risk• India is today the fourth largest Economy and growing at 9%
• No Government or Political Party can stall this momentum of the growth
Labour Pool• India viewed as a key business destination primarily for its abundant, cost effective and talented workforce
9
Why is Infrastructure the “need of the hour” for India?
10
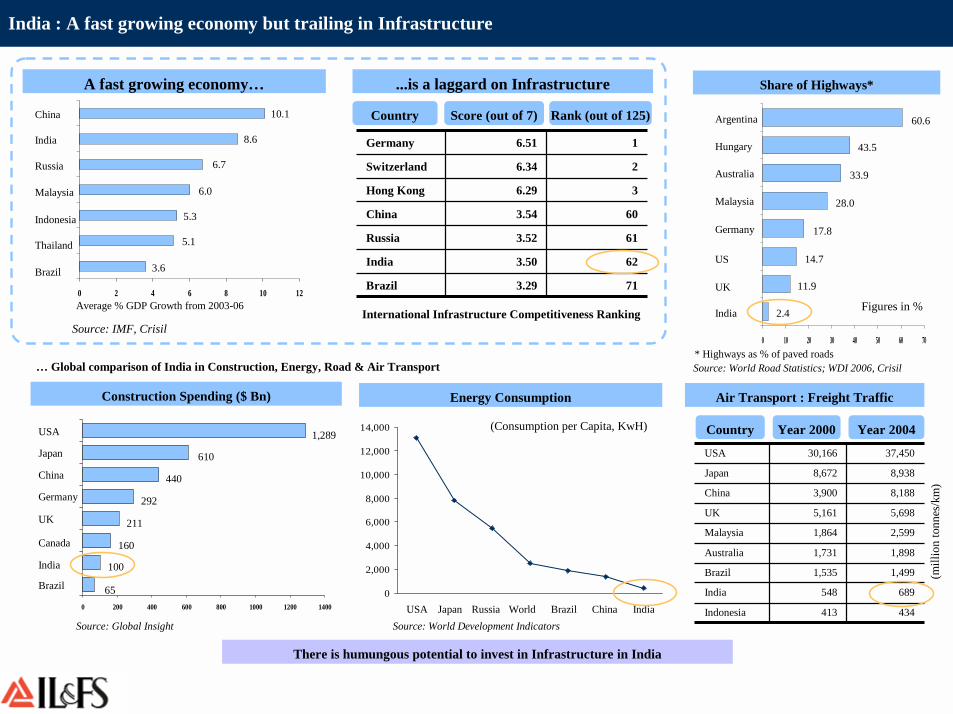
India : A fast growing economy but trailing in Infrastructure
...is a laggard on InfrastructureA fast growing economy…
0 2 4 6 8 10 12
China
India
Russia
Malaysia
Indonesia
Thailand
Brazil
10.1
8.6
6.7
6.0
5.3
5.1
3.6
Average % GDP Growth from 2003-06
Source: IMF, Crisil
613.52Russia
3.29
3.50
3.54
6.29
6.34
6.51
2Switzerland
71Brazil
62India
60China
3Hong Kong
1Germany
International Infrastructure Competitiveness Ranking
Country Score (out of 7) Rank (out of 125)
Construction Spending ($ Bn)
Source: Global Insight
0 200 400 600 800 1000 1200 1400
USA
Japan
China
Germany
UK
India
Brazil
1,289
610
440
292
211
160
65
Canada
100
Energy Consumption
Share of Highways*
* Highways as % of paved roadsSource: World Road Statistics; WDI 2006, Crisil
434413Indonesia
689548India
2,5991,864Malaysia
1,535
1,731
5,161
3,900
8,672
30,166
8,938Japan
1,499Brazil
1,898Australia
5,698UK
8,188China
37,450USA
Country Year 2000 Year 2004
Air Transport : Freight Traffic
(mill
ion
tonn
e s/k
m)
0
2,000
4,000
6,000
8,000
10,000
12,000
14,000
USA Japan Russia World Brazil China IndiaSource: World Development Indicators
(Consumption per Capita, KwH)
0 10 20 30 40 50 60 70
Argentina
Hungary
Australia
Malaysia
Germany
UK
India
60.6
43.5
33.9
28.0
17.8
14.7
2.4
US
11.9
Figures in %
There is humungous potential to invest in Infrastructure in India
… Global comparison of India in Construction, Energy, Road & Air Transport

11
Mumbai : A case in point
12
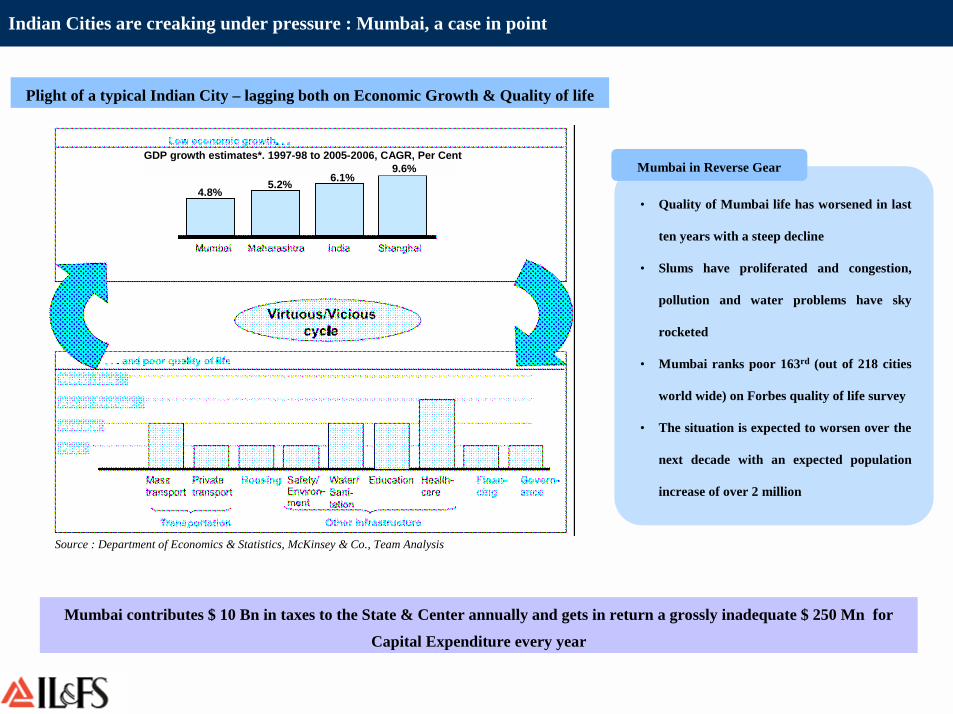
Indian Cities are creaking under pressure : Mumbai, a case in point
Plight of a typical Indian City – lagging both on Economic Growth & Quality of life
• Quality of Mumbai life has worsened in last
ten years with a steep decline
• Slums have proliferated and congestion,
pollution and water problems have sky
rocketed
• Mumbai ranks poor 163rd (out of 218 cities
world wide) on Forbes quality of life survey
• The situation is expected to worsen over the
next decade with an expected population
increase of over 2 million
Mumbai in Reverse Gear
Mumbai contributes $ 10 Bn in taxes to the State & Center annually and gets in return a grossly inadequate $ 250 Mn for
Capital Expenditure every year
Source : Department of Economics & Statistics, McKinsey & Co., Team Analysis
GDP growth estimates*. 1997-98 to 2005-2006, CAGR, Per Cent
4.8%5.2% 6.1%
9.6%

13
Why is Urbanization taking place?
14
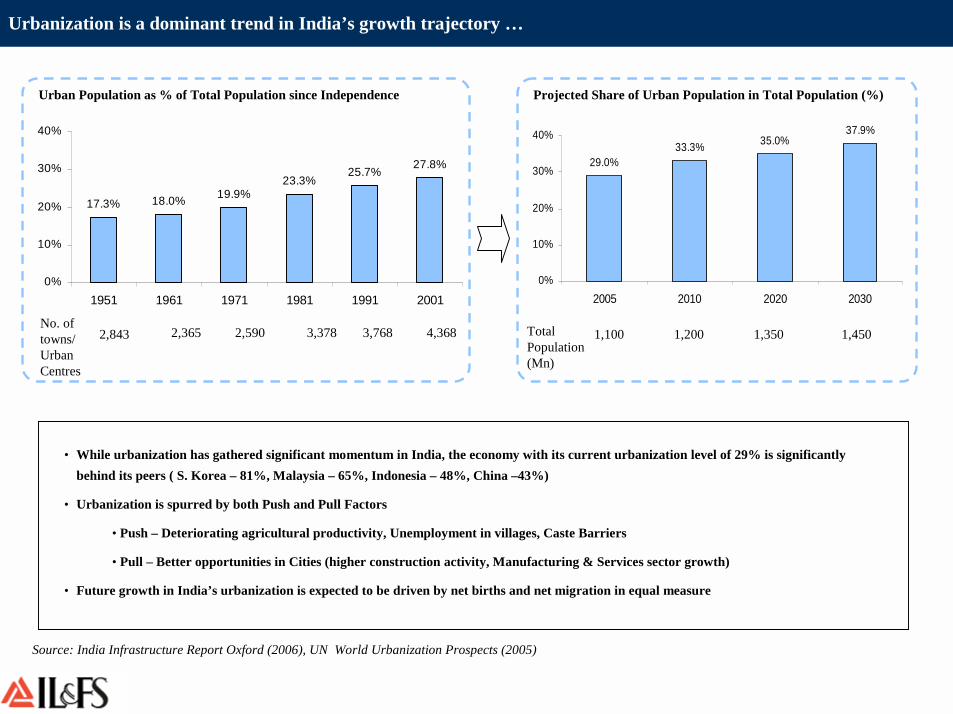
Urbanization is a dominant trend in India’s growth trajectory …
17.3% 18.0% 19.9%23.3%
25.7% 27.8%
0%
10%
20%
30%
40%
1951 1961 1971 1981 1991 2001
No. of towns/ Urban Centres
2,843 2,365 2,590 3,378 3,768 4,368
Urban Population as % of Total Population since Independence
1,100 1,200 1,350 1,450Total Population (Mn)
• While urbanization has gathered significant momentum in India, the economy with its current urbanization level of 29% is significantly behind its peers ( S. Korea – 81%, Malaysia – 65%, Indonesia – 48%, China –43%)
• Urbanization is spurred by both Push and Pull Factors
• Push – Deteriorating agricultural productivity, Unemployment in villages, Caste Barriers
• Pull – Better opportunities in Cities (higher construction activity, Manufacturing & Services sector growth)
• Future growth in India’s urbanization is expected to be driven by net births and net migration in equal measure
Projected Share of Urban Population in Total Population (%)
29.0%33.3% 35.0%
37.9%
0%
10%
20%
30%
40%
2005 2010 2020 2030
Source: India Infrastructure Report Oxford (2006), UN World Urbanization Prospects (2005)
15
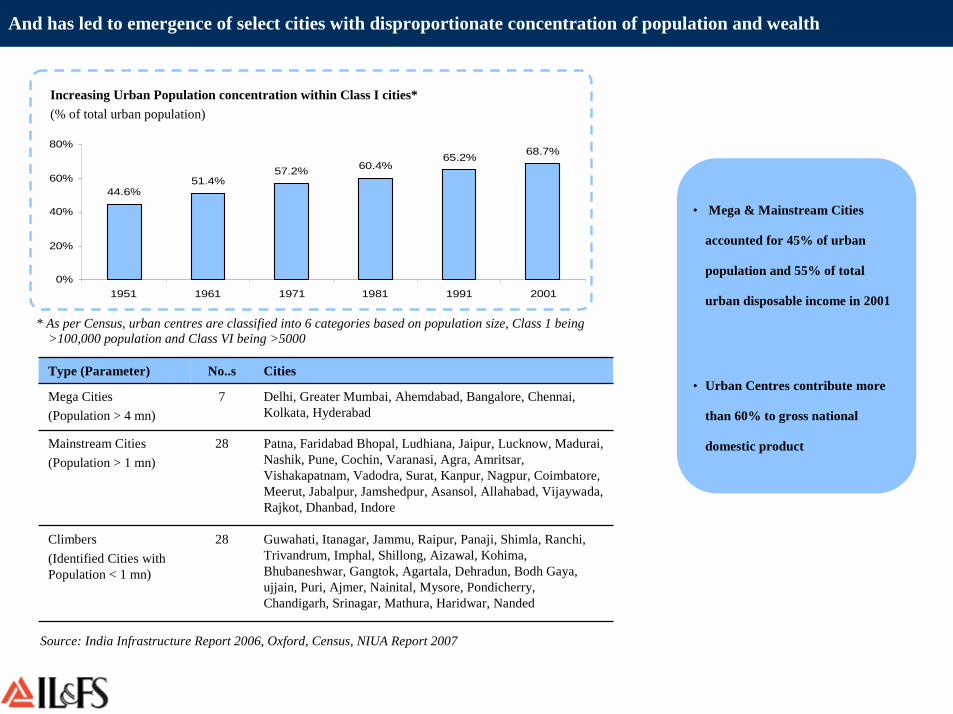
And has led to emergence of select cities with disproportionate concentration of population and wealth
28
28
7
No..s
Guwahati, Itanagar, Jammu, Raipur, Panaji, Shimla, Ranchi, Trivandrum, Imphal, Shillong, Aizawal, Kohima, Bhubaneshwar, Gangtok, Agartala, Dehradun, Bodh Gaya, ujjain, Puri, Ajmer, Nainital, Mysore, Pondicherry, Chandigarh, Srinagar, Mathura, Haridwar, Nanded
Climbers(Identified Cities with Population < 1 mn)
Patna, Faridabad Bhopal, Ludhiana, Jaipur, Lucknow, Madurai, Nashik, Pune, Cochin, Varanasi, Agra, Amritsar, Vishakapatnam, Vadodra, Surat, Kanpur, Nagpur, Coimbatore, Meerut, Jabalpur, Jamshedpur, Asansol, Allahabad, Vijaywada, Rajkot, Dhanbad, Indore
Mainstream Cities(Population > 1 mn)
Delhi, Greater Mumbai, Ahemdabad, Bangalore, Chennai, Kolkata, Hyderabad
Mega Cities(Population > 4 mn)
CitiesType (Parameter)
Source: India Infrastructure Report 2006, Oxford, Census, NIUA Report 2007
• Mega & Mainstream Cities
accounted for 45% of urban
population and 55% of total
urban disposable income in 2001
44.6%51.4%
57.2% 60.4%65.2% 68.7%
0%
20%
40%
60%
80%
1951 1961 1971 1981 1991 2001
Increasing Urban Population concentration within Class I cities*(% of total urban population)
* As per Census, urban centres are classified into 6 categories based on population size, Class 1 being >100,000 population and Class VI being >5000
• Urban Centres contribute more
than 60% to gross national
domestic product
16
The Bangalore issue
17
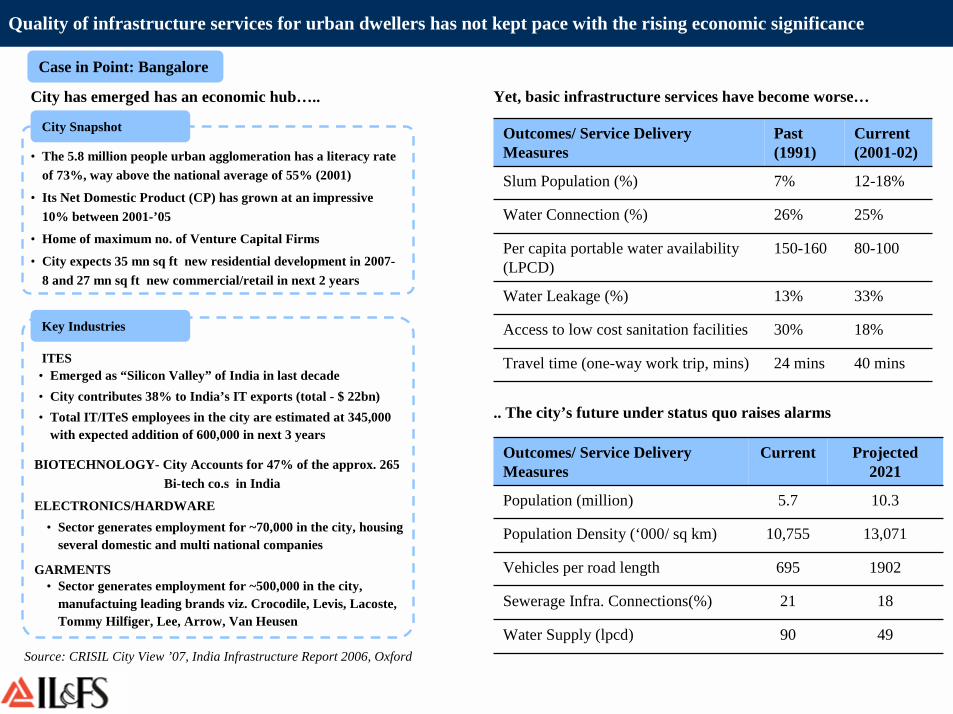
Quality of infrastructure services for urban dwellers has not kept pace with the rising economic significance
Case in Point: Bangalore
City has emerged has an economic hub…..
.. The city’s future under status quo raises alarms
40 mins24 minsTravel time (one-way work trip, mins)
18%30%Access to low cost sanitation facilities
33%13%Water Leakage (%)
80-100 150-160 Per capita portable water availability (LPCD)
25%26%Water Connection (%)
12-18%7%Slum Population (%)
Current (2001-02)
Past (1991)
Outcomes/ Service Delivery Measures
• Sector generates employment for ~70,000 in the city, housing several domestic and multi national companies
Yet, basic infrastructure services have become worse…
Source: CRISIL City View ’07, India Infrastructure Report 2006, Oxford
1821Sewerage Infra. Connections(%)
4990Water Supply (lpcd)
1902695Vehicles per road length
13,07110,755Population Density (‘000/ sq km)
10.35.7Population (million)
Projected 2021
CurrentOutcomes/ Service Delivery Measures
• The 5.8 million people urban agglomeration has a literacy rate of 73%, way above the national average of 55% (2001)
• Its Net Domestic Product (CP) has grown at an impressive 10% between 2001-’05
• Home of maximum no. of Venture Capital Firms
• City expects 35 mn sq ft new residential development in 2007-8 and 27 mn sq ft new commercial/retail in next 2 years
City Snapshot
Key Industries
ITES• Emerged as “Silicon Valley” of India in last decade• City contributes 38% to India’s IT exports (total - $ 22bn)• Total IT/ITeS employees in the city are estimated at 345,000
with expected addition of 600,000 in next 3 years
BIOTECHNOLOGY- City Accounts for 47% of the approx. 265 Bi-tech co.s in India
ELECTRONICS/HARDWARE
• Sector generates employment for ~500,000 in the city, manufactuing leading brands viz. Crocodile, Levis, Lacoste, Tommy Hilfiger, Lee, Arrow, Van Heusen
GARMENTS

18
What is the Solution?
19
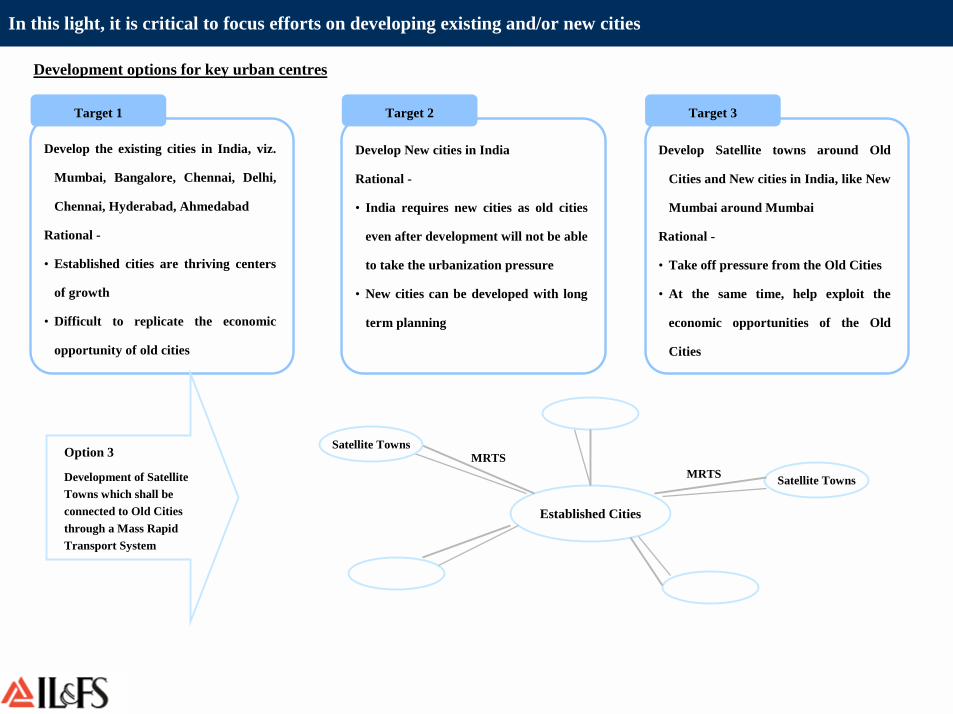
Target 1
Develop the existing cities in India, viz.
Mumbai, Bangalore, Chennai, Delhi,
Chennai, Hyderabad, Ahmedabad
Rational -
• Established cities are thriving centers
of growth
• Difficult to replicate the economic
opportunity of old cities
Target 2 Target 3
Established Cities
Satellite Towns
Satellite Towns
Develop New cities in India
Rational -
• India requires new cities as old cities
even after development will not be able
to take the urbanization pressure
• New cities can be developed with long
term planning
Develop Satellite towns around Old
Cities and New cities in India, like New
Mumbai around Mumbai
Rational -
• Take off pressure from the Old Cities
• At the same time, help exploit the
economic opportunities of the Old
Cities
MRTSMRTSOption 3
Development of Satellite Towns which shall be connected to Old Cities through a Mass Rapid Transport System
In this light, it is critical to focus efforts on developing existing and/or new cities
Development options for key urban centres

20
What is the Rationale for the Solution?

21
Our Dual Return Approach
Before Infrastructure Development After Infrastructure Development
Developed City with infrastructure in place
Real estate price – 5x
Land parcel near to developed city
Real estate price – 0.5x
Distance of 35 – 40 Km
After a period of 5 years
Real estate price – 8x
Develop Infrastructure on the Land Parcel
Real estate price – 5x
Mass Rapid
Transport System
Dual returns for Investors
Health CareSanitation
Waste ManagementWater Supply
TelecommunicationCivil Structures
Independent Power PlantsRoad/ Highways/ Freeways
Investment in Allied Infrastructure of the New City
Investment in Real Estate of the New City
Along with
Steady stream of Cash Flows per annum
The appreciation of Real Estate Price
As in this case from 0.5x to 5x
Example : Independent Power Plant
IPP shall be a JV (74%:26%) between a Power Major & the Fund, hence part of the returns shall come from the Profits of the IPP in form of Dividends
Aim is to Develop Urban
Infrastructure creating
Captive Demands in
Infrastructure and share
the upside with the
investors in
infrastructure as well as
Real Estate
22
Shanghai : A Case in point
23
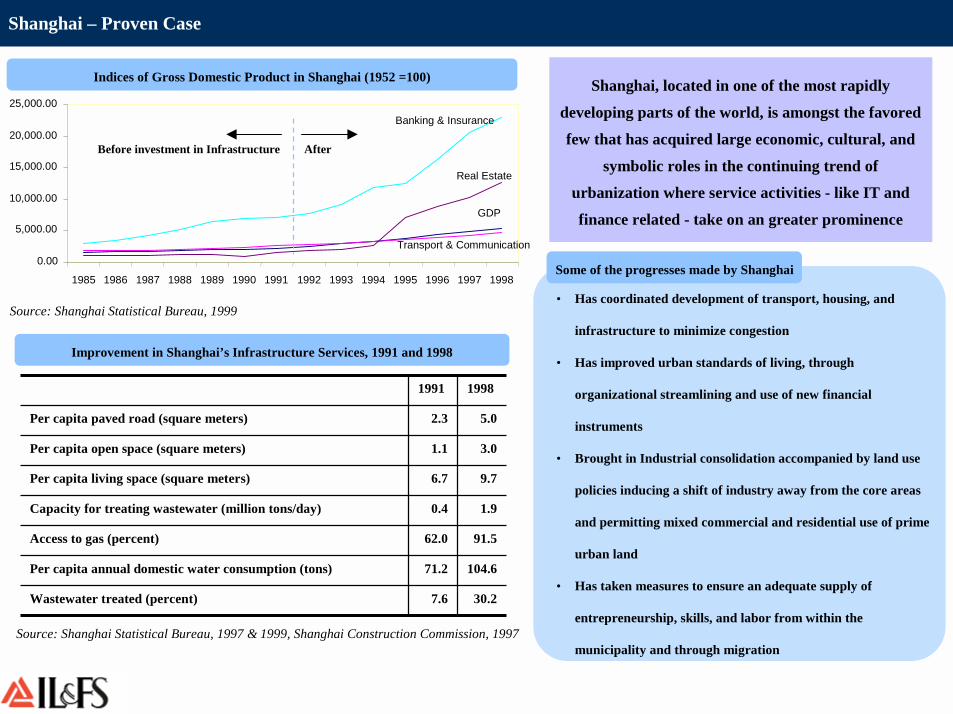
Shanghai – Proven Case
• Has coordinated development of transport, housing, and
infrastructure to minimize congestion
• Has improved urban standards of living, through
organizational streamlining and use of new financial
instruments
• Brought in Industrial consolidation accompanied by land use
policies inducing a shift of industry away from the core areas
and permitting mixed commercial and residential use of prime
urban land
• Has taken measures to ensure an adequate supply of
entrepreneurship, skills, and labor from within the
municipality and through migration
Some of the progresses made by Shanghai
30.27.6Wastewater treated (percent)
104.671.2Per capita annual domestic water consumption (tons)
91.562.0Access to gas (percent)
1.90.4Capacity for treating wastewater (million tons/day)
9.76.7Per capita living space (square meters)
3.01.1Per capita open space (square meters)
5.02.3Per capita paved road (square meters)
19981991
Source: Shanghai Statistical Bureau, 1997 & 1999, Shanghai Construction Commission, 1997
Improvement in Shanghai’s Infrastructure Services, 1991 and 1998
0.00
5,000.00
10,000.00
15,000.00
20,000.00
25,000.00
1985 1986 1987 1988 1989 1990 1991 1992 1993 1994 1995 1996 1997 1998
GDP
Transport & Communication
Banking & Insurance
Real Estate
Indices of Gross Domestic Product in Shanghai (1952 =100)
Source: Shanghai Statistical Bureau, 1999
Before investment in Infrastructure After
Shanghai, located in one of the most rapidly
developing parts of the world, is amongst the favored
few that has acquired large economic, cultural, and
symbolic roles in the continuing trend of
urbanization where service activities - like IT and
finance related - take on an greater prominence

24
Our Approach to the Solution

25
Improving existing cities & creating Self-sustaining New Cities
Residential Housing Projects
High rise Business District
• Benchmark office high rise district
• Anchor developers to be given land at
concessional rates; efforts to be made in
conjunction with developers to attract key
anchor tenants
Social Infrastructure
Technology
Overall Connectivity/ transport Retail cum entertainment hubs
• Well panned residential housing projects
• Walk to work layouts
• Educational institutes to be established
• International schools for primary education
• Privatised hospitals with infrastructure to
be established
• Broadband FTTP
• WiFi/ Wimax
• Shared IT Services
• MRTS connecting old cities
• Expressway to airport
• High speed train to Bombay
• High quality entertainment malls to be set
up
• Over 60% of the space is planned to be
green
Basic Infrastructure
• Uninterrupted and highly reliable power
supply potentially generated through a
captive power plant in the long run
• Reliance on non-conventional sources
Urban Infrastructure Development
Develop New
Cities
Develop Existing
Cities
Gives Opportunity to develop different aspects of infrastructure considering their inter-dependability & long term demand of next 100 years
Target 1
Target 2
Gives opportunity to take advantage of the already thriving economic potential
New Paradigm in Urban PlanningCity’s master plan to serve as the Vibrant
Hub

26
What is the Deal?

27
Gujarat International Finance Tech-City - GIFT
+• Booming demand in Financial & IT
Services
• India’s financial capital, Mumbai, saddled with crumbling infrastructure and sky-rocketing cost of business operations
• Lack of any methodically planned and developed world-class International Finance Centre (IFC)
• State Govt. of Gujarat (GoG) spearheading a slew of initiatives to usher economic prosperity through public-private efforts and investment in the State
• Gujarat’s economy recorded CAGR of 9% in last 3 years, set itself the highest target CAGR of 11.4 % under India’s 11th 5-year plan
GoG and Infrastructure Leasing and Financial Services Ltd. (IL&FS)join hands to conceive, plan and develop
Gujarat International Finance Tec-City
+• A premium institution with a proven
track record in infrastructure and financial services
• Pioneer in launching infrastructure projects on a PPP model in India
• Widespread experience in planning and development of large-scale commercially viable Infrastructure projects
An Opportunity A Pro-active State Govt IL&FS

28
Where is the Project?

29
• The City additionally benefits from the Sabarmati river demarcating it’s eastern boundary
GIFT is strategically located in close proximity to the commercial hub of Gujarat as well as Mumbai
Gujarat
GandhinagarGIFT
545
8
12
Distance (kms) Primary Travel Mode
Road@- Dedicated 8 lane
expressway; LRTS
Ahmedabad
Air* ( 1 hr flying time),
Train (8 hrs)
Gandhinagar
Mumbai
@ GIFT site currently abuts a four lane National Highway connecting Ahemdabad
and Gandhinagar (LRTS and expressway to be developed)
* Nearest Airport to GIFT, Ahemdabad Intl. Airport, is very well connected to
Mumbai with over 12 flights a day (one way)

30
What is the Value Proposition?

31
GIFT presents a compelling value proposition
GIFT
Integrated Utilities
DefinedPositioning
StrongGovt. Backing
World Class Infrastructure
Excellent Connectivity
• A brand new 506 acre city designed to be a globally benchmarked
International Finance Centre
• Located in the rapidly developing state of Gujarat between it’s State capital,
Gandhinagar, and its commerce capital, Ahemdabad
• To serve as the central business hub for an Integrated Township sprawling
over 27,000 acres
• Developed with the full backing of a proactive and result oriented State
Govt.• Service emerging business requirements in financial services &
IT/ITeS sectors that Mumbai is not in a position to address
• In close proximity to Ahemdabad, a premium tier 2 city, and also
close to Mumbai vis-à-vis other cities
• Be a first of it’s kind development in the country in terms of scale,
scope and quality of offerings
• State of the art physical/social/ IT infrastructure and world class
connectivity at affordable price points • Special Economic Zone benefits including concessionary tax and
regulatory policies for all the stakeholders
• Provide opportunity for business at less than half the cost of Mumbai

32
Who are the Partners to GIFT?

33
Consultants Engaged by GIFTCL
Environmental Aspects
Talent Demand Assessment
Market Demand Assessment
Process Management
ICT Advisory Services
Design & ArchitectureConsortium of East China Architectural Design Institute (ECADI) & Fairwood
India Pvt. Ltd.
IL&FS Ecosmart Limited

34
What is the Bouquet of Offering?

35
This new IFC would be a world-class bouquet of offerings
36
What is the Macro-Economic Perspective?
37
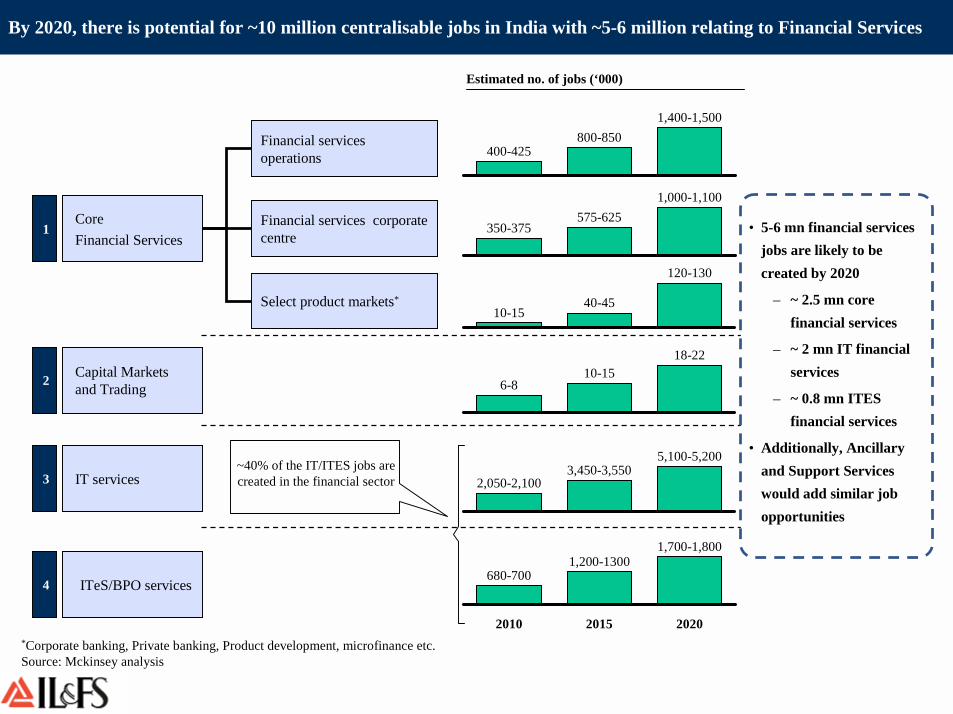
By 2020, there is potential for ~10 million centralisable jobs in India with ~5-6 million relating to Financial Services
37
Estimated no. of jobs (‘000)
400-425800-850
1,400-1,500
350-375575-625
1,000-1,100
10-1540-45
120-130
2,050-2,1003,450-3,550
5,100-5,200
680-700
2010
1,200-1300
2015
1,700-1,800
2020
~40% of the IT/ITES jobs are created in the financial sector
• 5-6 mn financial services jobs are likely to be created by 2020
– ~ 2.5 mn core financial services
– ~ 2 mn IT financial services
– ~ 0.8 mn ITES financial services
• Additionally, Ancillary and Support Services would add similar job opportunities
6-810-15
18-22
*Corporate banking, Private banking, Product development, microfinance etc.Source: Mckinsey analysis
Core Financial Services
IT services
ITeS/BPO services
Financial services operations
Financial services corporate centre
Capital Markets and Trading
Select product markets*
1
3
4
2
38
What is the Target Focus?

39
GIFT would focus on nine specific opportunities emerging within Financial Services sector
1. National Financial services operations’ hub
2. Regional/functional Head quarters for financial services players
3. National head quarters for players
4. Private Banking hub for NRIs/ Regional HNWs5. International microfinance hub
Core Financial Services
8. Global Hub for IT services for Financial services sector IT services
9. Global Hub for BPO services for Financial services sectorITeS/BPO
services
6. International commodity trade hub
7. Participation in global capital markets Capital Markets and Trading
Financial services operations
Financial services corporate centre
Select product markets
GIFT’s focus segments
GIFT aims to generate 0.3 mn direct and 0.6 mn indirect employment by
2020
40
What is the Value Proposition for the Occupier?

41
Value proposition for the Occupiers in GIFT
4070300375Lease Rentals (Rs/month)
331,110
52
Mumbai
259,350
40
Delhi
128,310
45
Bangalore
78,000
17
Ahmedabad
Manpower Cost (Rs/ hr)
Workstation Cost (Rs/ 100 sq ft seat/ annum)
Particulars
Comparison of Cost Structure across Cities…
• Both, the Manpower Cost and Workstation Cost at GIFT would be comparable to those in Ahmedabad
• It has to be noted that GIFT is planned to be developed and benchmarked as an International Financial Center for
India and hence the quality of infrastructure at GIFT will be far superior as compared to the existing infrastructure
in these cities
… How GIFT if more attractive than any other City in India
• Infrastructure developments and linkages are done from scratch keeping in mind long term growth in urbanization
• Regional infrastructure and economic growth drivers are cherry picked to suit the occupiers’ need
• Reduction of dependence on local government by Municipal bodies and the new city is run as an enterprise with thrust on self-governance
• Regulatory framework is tailor made as per the needs of the city
• Land and sectoral demand-supply scenario are chosen keeping in mind future growth and land availability
• Demographic profiles is well balanced and controlled
• New city attracts world class Educational Institutes
• Restricted access and high surveillance keeps law and order in check
• Availability of quality workforce is a planned concept with thrust on specific sectors to create ample opportunities and good quality of life to sustain the workforce
Advantages of setting up a New City like GIFT
Cost & Facilities Advantage for the Occupier
Infrastructure Advantage for the Occupier
Source: NASSCOM, DTZ

42
What is the Development Plan?
43
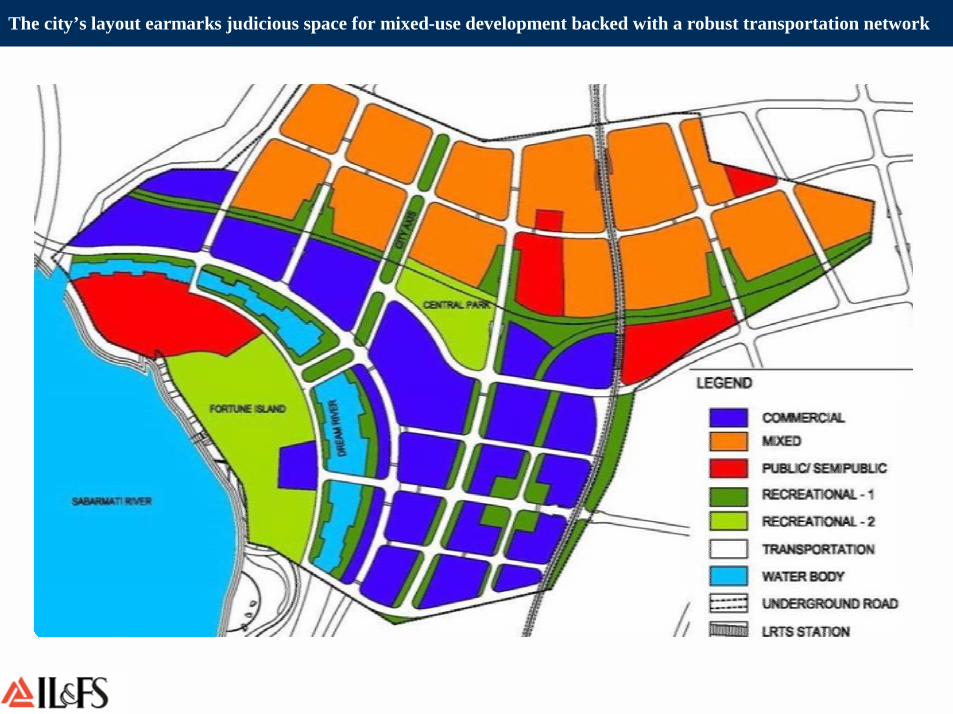
The city’s layout earmarks judicious space for mixed-use development backed with a robust transportation network
43

44
What is the Project Configuration?

45
Real Estate would be a key feature of GIFT’s development plan
Height of 3 landmark buildings above 250 m , 11 buildings above 150 m
45
• Real Estate at GIFT has been planned to cater to 0.3 million working population and 50,000 resident population
• Commercial development is the primary focus of development with ~70% built up space dedicated to it
• However due emphasis would be given towards residential development and social infrastructure as they are vital to keeping the city alive
• GIFT enjoys FSR of 3.65 which would be predominantly used vertically thereby maximizing open spaces and green areas (65% space)
• GIFT’s tallest building, Diamond Towers, would dominate the city skyline with a height of 400 m
0.3%18.2%Transportation
Built Up Area (%)Land Use (%)
67.8%21.6%Commercial
100%
506 acres
1.1%
30.0%
12.8%
16.5% 20.4%Mixed*
Public & Semi -
Public11.3%
Recreational -
Utilities 0.2%
Total100% 75
mn sq ft
* Mixed Use Development to comprise of Residential and Commercial including offices, retail, and recreational

46
How does GIFT compare Internationally?

47
The City has been designed to be at par or above with Globally Benchmarked IFCs
In terms of scale and sheer physical scope, GIFT is being designed to be at or above par with presently acknowledged Globally Benchmarked International Financial Centers (IFCs)
In terms of scale and sheer physical scope, GIFT is being designed to be at or above par with presently acknowledged Globally Benchmarked International Financial Centers (IFCs)
Paris La Defense
Tokyo London Pudong GIFT
Land use Scale (sq km) 1.6 1.6 1.05 1.7 2.02
Construction Scale (in mn sq m) 2.5 1.6 1.1 4.5 7.5
Floor-area Ratio 1.56 1.00 1.05 2.65 3.65
Greenbelt (in thousand sq m) 40 120 50 363 615
Height (m) 200 250 250 490 410
Paris La Defense Tokyo (Shinjuku) London Dockyards Pudong (Lujiazui) GIFT

48
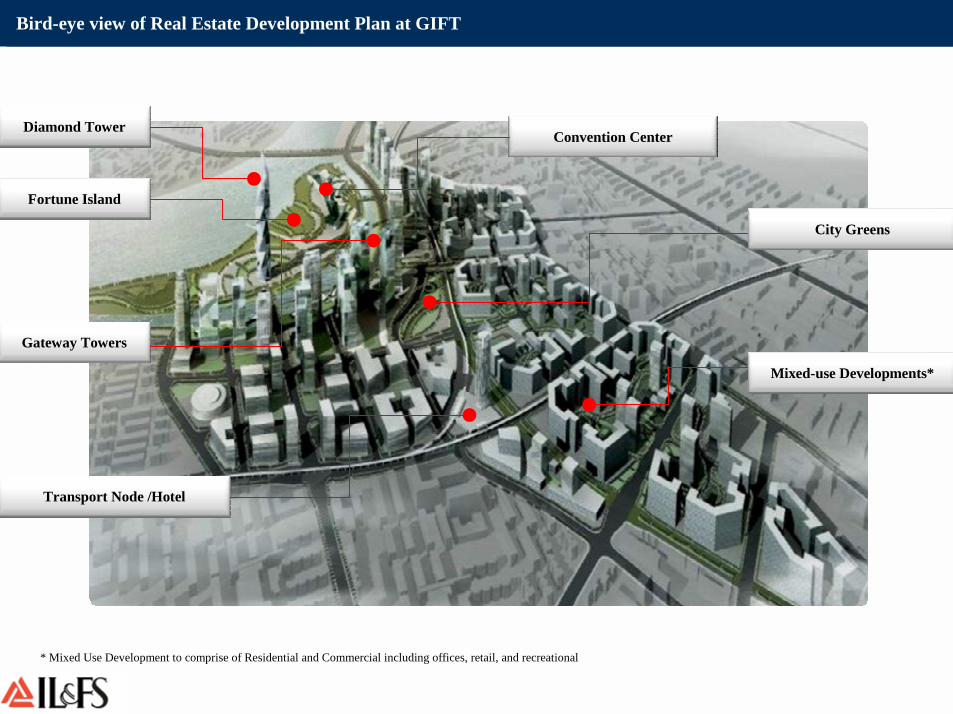
How does GIFT look?
49 49
Diamond Tower
Transport Node /Hotel
Gateway Towers
Fortune Island
Convention Center
Mixed-use Developments*
City Greens
Bird-eye view of Real Estate Development Plan at GIFT
* Mixed Use Development to comprise of Residential and Commercial including offices, retail, and recreational

50
What are the Land Mark Buildings?

51
Diamond TowerDiamond TowerThe dominant feature of the cityThe dominant feature of the city
Height Height -- 400 m400 m
Gateway TowersGateway TowersMark entrance to the city from arterial streetsMark entrance to the city from arterial streets
creating identity for the city axis creating identity for the city axis
Some of the Signature Developments at GIFT
51

52
Dream River Dream River
Makes identifiable meeting places with 15m wide promenade.Makes identifiable meeting places with 15m wide promenade.
This promenade will also function as a major spine for pedestriThis promenade will also function as a major spine for pedestrians and will ans and will be a significant recreational facility. be a significant recreational facility.
Convention Center•The low rise building along the river edge on the Fortune Island marks a landmark with the proposed art galleries and museum
Transportation Hub•Transportation Hubs mark the edge of the city
52
Some of the Signature Developments at GIFT

53
What is the Infrastructure Story?

54
GIFT Infrastructure Overview
• All infrastructure services to support businesses including connectivity, IT, walk-to-work housing, security and services to support a globally acceptable quality of life have been integrated into the design of the city
• Common aspects of infrastructure needs and requirements are integrated to ensure planning for sustainable and affordable development to meet the growth of GIFT.
• Modern and innovative technology in infrastructure provision is utilized to improve service levels and to attain a high quality environment.
• All infrastructure and utilities service providers are controlled & coordinated and Targets for quality – waste, water and energy resources – are set within GIFT.
Investment Opportunities for Infrastructure Developers:
• Core Infrastructure- Site Development- Landscaping- Maintenance Systems
• Transportation & Utilities- Roads and Transportation- Water Systems- ICT- Power Generation and
Distribution- HVAC- Domestic Gas Distribution- Waste Management Systems
55
What is the Transportation Linkage?

56
GIFT Infrastructure: Transport
• Transit oriented transport –Walk to work after exiting a major node of the public transport system• Segregated vehicular and pedestrian movement and abundant parking provision• Aim to achieve a modal split of (10:90) between private & public transport• Road network of freeways, expressways, highways, arterial roads, collector streets, and pedestrian paths• Intra-City Travel
• Combination of LRTS and CRT Bus Lanes linking neighborhoods and districts• Max trip time estimated at 30 minutes between the farthest points of the city
• Inter City Travel • – LRTS at GIFT to be linked to the proposed MRTS between Ahemdabad and Gandhinagar
(independent Govt. plan) thereby linking GIFT with other urban regions in Gujarat
Completely developed site with high quality internal roads and landscaping
Rationalized and efficient transport planning, design and engineering resulting in
• Reduced stress on land as resource; • Reduced air and noise pollution; • Energy efficiency; • Increased green belts
Accessibility and linkages:• LRTS, CRT• Underground arterial road• Abundant parking Space

57
What is the Road, Water, Landscaping Plan?
58
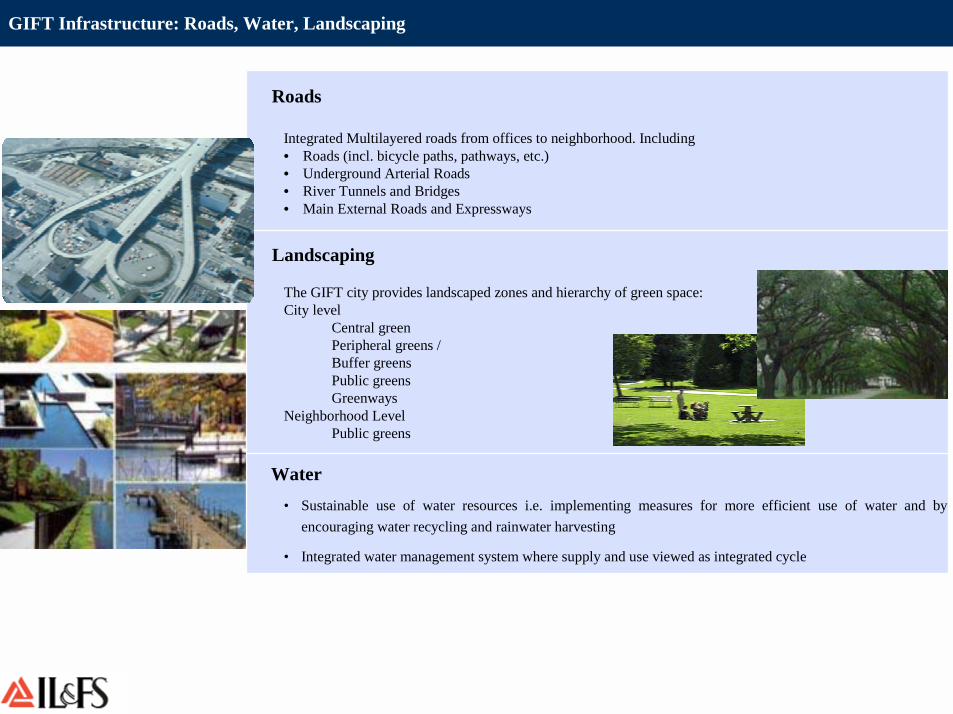
GIFT Infrastructure: Roads, Water, Landscaping
Roads
Integrated Multilayered roads from offices to neighborhood. Including • Roads (incl. bicycle paths, pathways, etc.)• Underground Arterial Roads• River Tunnels and Bridges• Main External Roads and Expressways
Landscaping
The GIFT city provides landscaped zones and hierarchy of green space:City level
Central greenPeripheral greens /Buffer greensPublic greensGreenways
Neighborhood LevelPublic greens
Water • Sustainable use of water resources i.e. implementing measures for more efficient use of water and by
encouraging water recycling and rainwater harvesting
• Integrated water management system where supply and use viewed as integrated cycle
59
What is the support on Utilities?
60
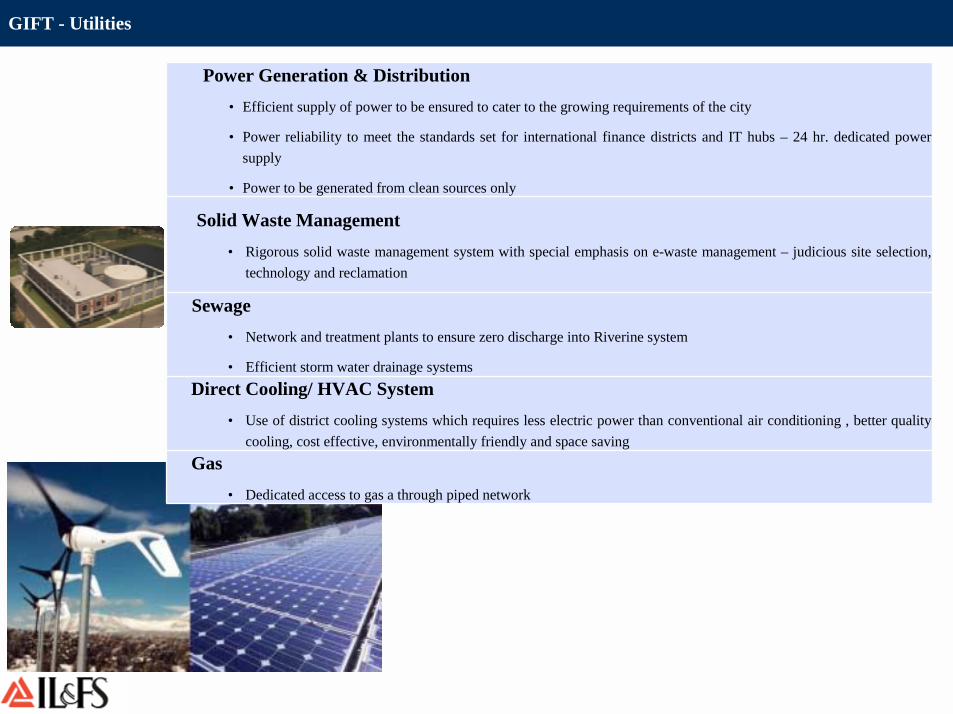
GIFT - Utilities
Direct Cooling/ HVAC System• Use of district cooling systems which requires less electric power than conventional air conditioning , better quality
cooling, cost effective, environmentally friendly and space saving
Sewage• Network and treatment plants to ensure zero discharge into Riverine system
• Efficient storm water drainage systems
Power Generation & Distribution• Efficient supply of power to be ensured to cater to the growing requirements of the city
• Power reliability to meet the standards set for international finance districts and IT hubs – 24 hr. dedicated power supply
• Power to be generated from clean sources only
Solid Waste Management• Rigorous solid waste management system with special emphasis on e-waste management – judicious site selection,
technology and reclamation
Gas• Dedicated access to gas a through piped network

61
How good is the Telecom Connectivity?

62
GIFT - ICT
• Access to high speed network and cutting edge IP based networks allowing seamless voice, video and data integration and use of advanced end user applications.
• Greater bandwidth (due to wired city fibre connected) – a bandwidth of 100 Mbit/s scalable to Gbit/s would be possible from the start.
• Residential and intelligent building services such as high speed internet access, telephony services (VoIP, PSTN), IPTV, video on demand, home security (CCTV alarms), automation (lighting & heating control, energy management, appliances and remote control, etc.)
• A robust tier IV date centre with guaranteed SLAs for uptime with properly backed up remote disaster recovery site as fall back.
• Local area networking, intra office/building wireless access, video conferencing.• A self contained network management and operations to support the services and performance SLAs.
Access to high speed network infrastructure and modern technology
Secured and converged network – lower cost of ownership and improved employee productivity
Universal access gateways and interfaces for citizens on the move, anytime, anywhere
Additional features such as intelligent buildings, e government, etc
Speedy setting-time for businesses with Plug-and-Play services
63
Does GIFT have an SEZ status?
64
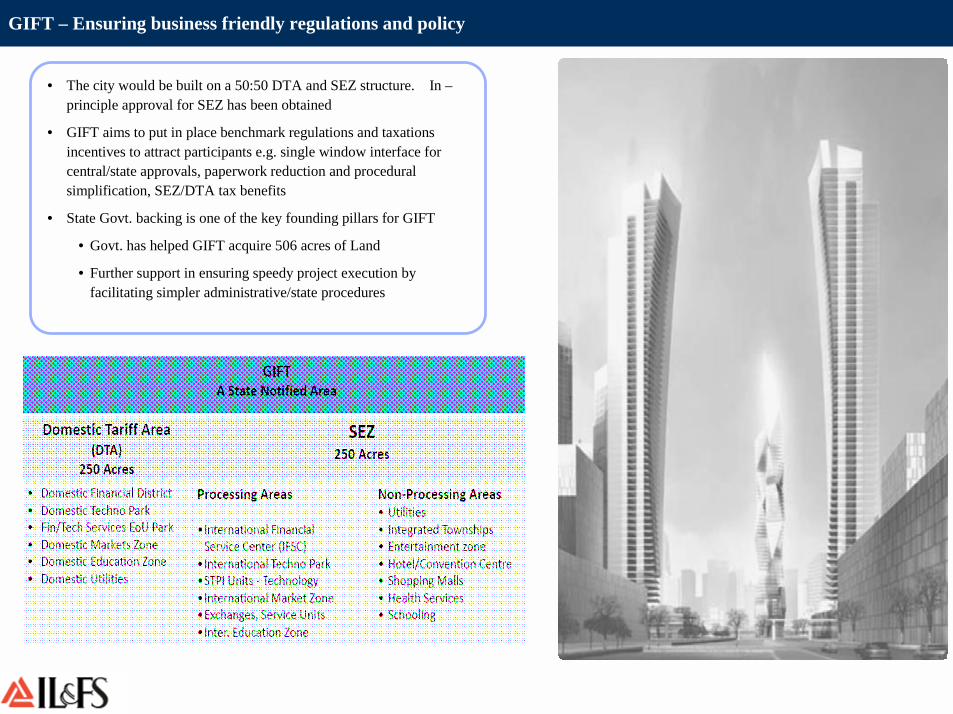
GIFT – Ensuring business friendly regulations and policy
• The city would be built on a 50:50 DTA and SEZ structure. In –principle approval for SEZ has been obtained
• GIFT aims to put in place benchmark regulations and taxations incentives to attract participants e.g. single window interface for central/state approvals, paperwork reduction and procedural simplification, SEZ/DTA tax benefits
• State Govt. backing is one of the key founding pillars for GIFT
• Govt. has helped GIFT acquire 506 acres of Land
• Further support in ensuring speedy project execution by facilitating simpler administrative/state procedures
65
What does GIFT have in store for the Investors?
66
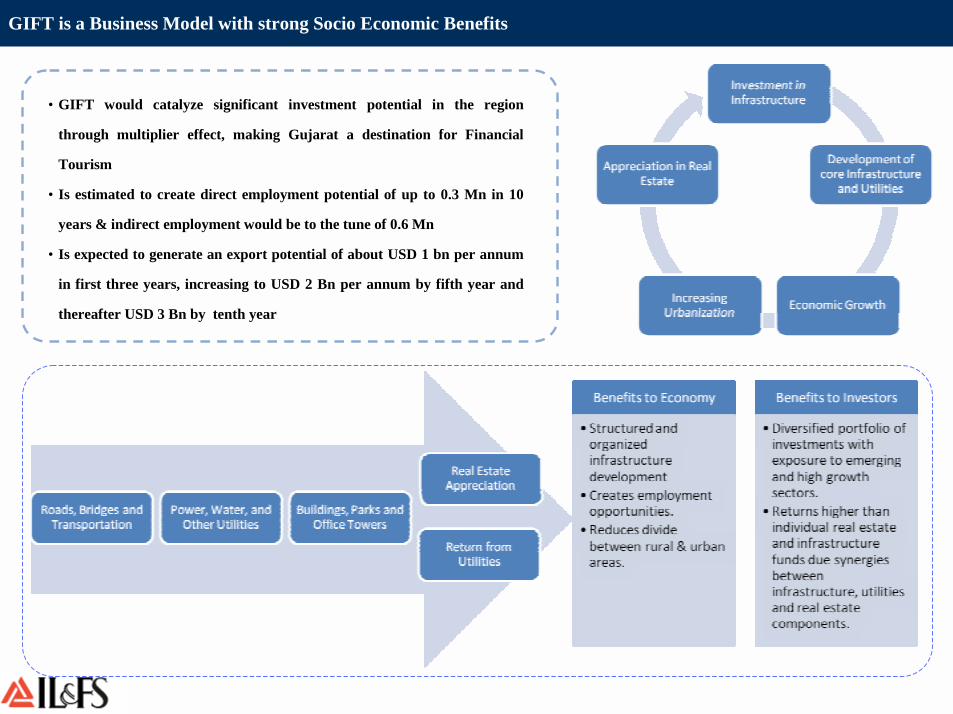
GIFT is a Business Model with strong Socio Economic Benefits
• GIFT would catalyze significant investment potential in the region
through multiplier effect, making Gujarat a destination for Financial
Tourism
• Is estimated to create direct employment potential of up to 0.3 Mn in 10
years & indirect employment would be to the tune of 0.6 Mn
• Is expected to generate an export potential of about USD 1 bn per annum
in first three years, increasing to USD 2 Bn per annum by fifth year and
thereafter USD 3 Bn by tenth year

67
What is the Cost and Phasing?

68
GIFT would be developed in between 2007-2017 at a total cost of ~ US $ 16.33 bn
Core Infrastructure 1.35
Semi Viable Infrastructure 1.37
Utilities 8.31
Buildings 5.31
Total Project Value 16.33
Estimated Project Cost
US Billion

69
How is GIFT being Organized?
70
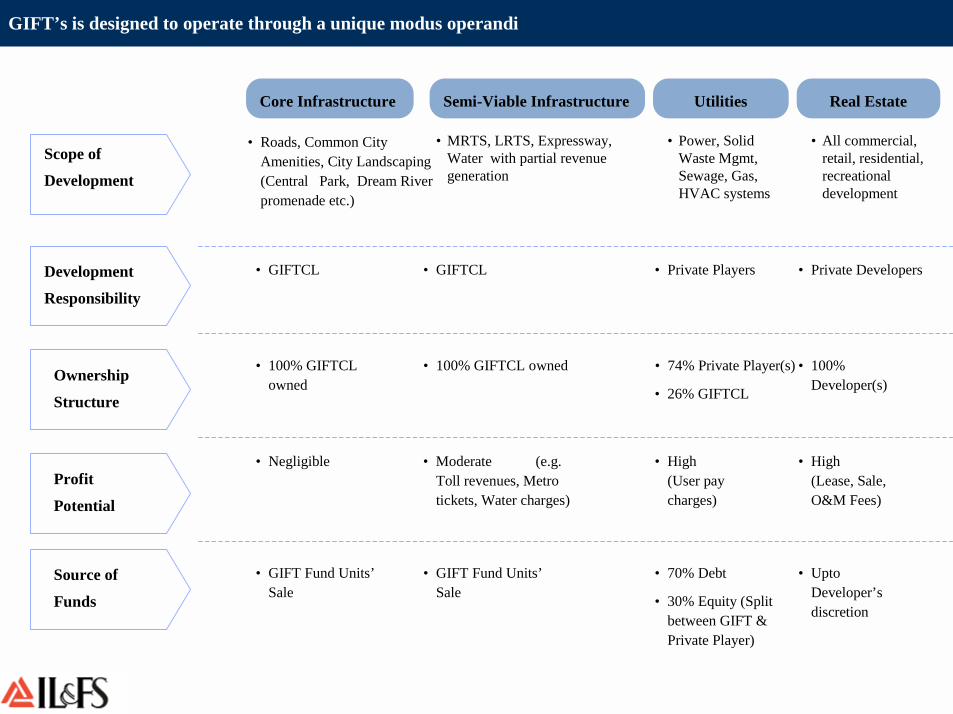
GIFT’s is designed to operate through a unique modus operandi
Real EstateCore Infrastructure
Scope of
Development
Ownership
Structure
• Private Players
Semi-Viable Infrastructure Utilities
Source of
Funds
• Roads, Common City Amenities, City Landscaping (Central Park, Dream River promenade etc.)
• MRTS, LRTS, Expressway, Water with partial revenue generation
Development
Responsibility
• GIFTCL • GIFTCL • Private Developers
• 100% GIFTCL owned
• 100% GIFTCL owned • 74% Private Player(s)
• 26% GIFTCL
• Power, Solid Waste Mgmt, Sewage, Gas, HVAC systems
Profit
Potential
• Negligible • Moderate (e.g. Toll revenues, Metro tickets, Water charges)
• High (User pay charges)
• High (Lease, Sale, O&M Fees)
• All commercial, retail, residential, recreational development
• 100% Developer(s)
• GIFT Fund Units’Sale
• GIFT Fund Units’Sale
• 70% Debt
• 30% Equity (Split between GIFT & Private Player)
• Upto Developer’s discretion

71
What are the Components of the Project cost?
72
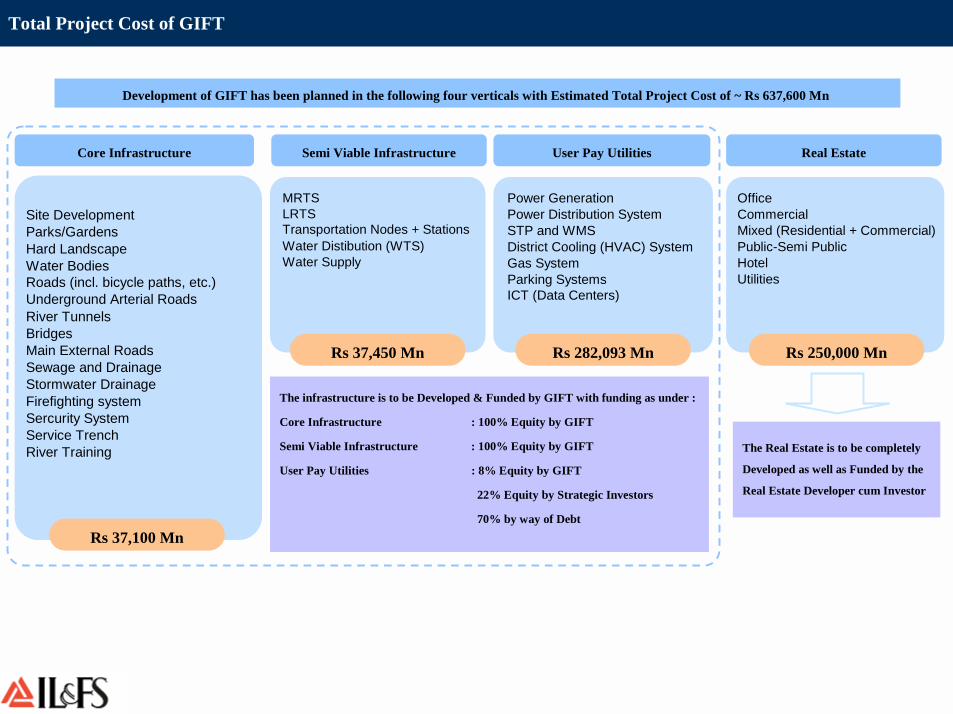
Total Project Cost of GIFT
MRTSLRTS Transportation Nodes + StationsWater Distibution (WTS)Water Supply
Power GenerationPower Distribution SystemSTP and WMSDistrict Cooling (HVAC) SystemGas SystemParking SystemsICT (Data Centers)
OfficeCommercialMixed (Residential + Commercial)Public-Semi Public HotelUtilities
Core Infrastructure Semi Viable Infrastructure User Pay Utilities Real Estate
Rs 37,100 Mn
Rs 37,450 Mn Rs 282,093 Mn Rs 250,000 Mn
Development of GIFT has been planned in the following four verticals with Estimated Total Project Cost of ~ Rs 637,600 Mn
The infrastructure is to be Developed & Funded by GIFT with funding as under :
Core Infrastructure : 100% Equity by GIFT
Semi Viable Infrastructure : 100% Equity by GIFT
User Pay Utilities : 8% Equity by GIFT
22% Equity by Strategic Investors
70% by way of Debt
The Real Estate is to be completely
Developed as well as Funded by the
Real Estate Developer cum Investor
Site DevelopmentParks/GardensHard LandscapeWater BodiesRoads (incl. bicycle paths, etc.)Underground Arterial RoadsRiver TunnelsBridgesMain External RoadsSewage and DrainageStormwater DrainageFirefighting systemSercurity SystemService TrenchRiver Training
73
What is the Value Proposition
74
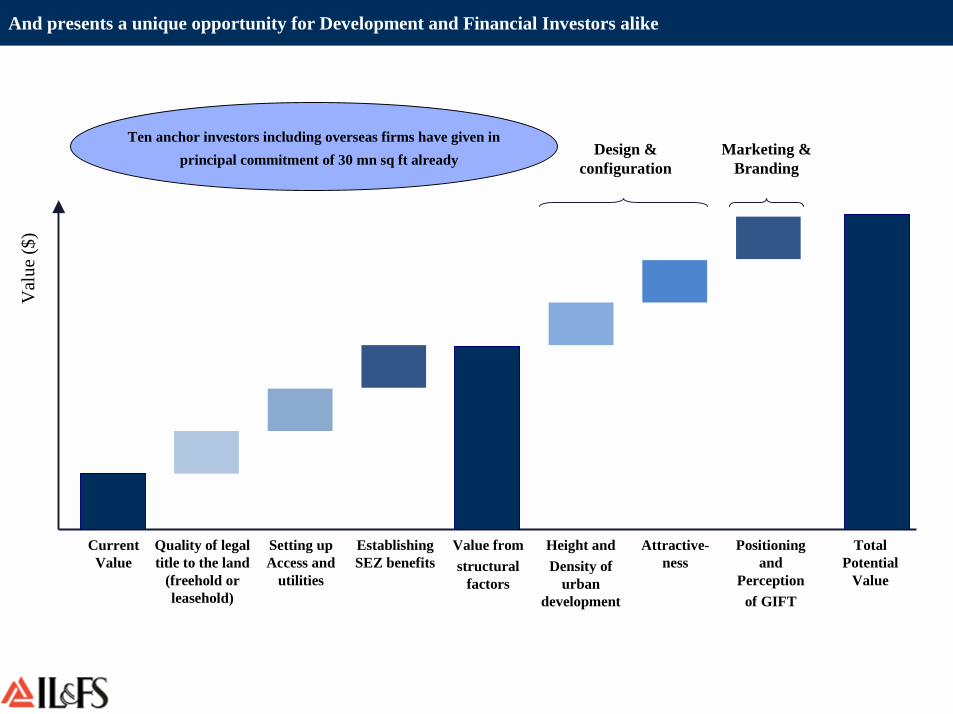
And presents a unique opportunity for Development and Financial Investors alike V
alue
($)
Current Value
Value fromstructural
factors
Design & configuration
Marketing & Branding
Height andDensity of
urban development
Attractive-ness
Positioning and
Perceptionof GIFT
Quality of legal title to the land
(freehold or leasehold)
Setting up Access and
utilities
Establishing SEZ benefits
Total Potential
Value
Ten anchor investors including overseas firms have given in principal commitment of 30 mn sq ft already

75
What is the Team for the Project?
76
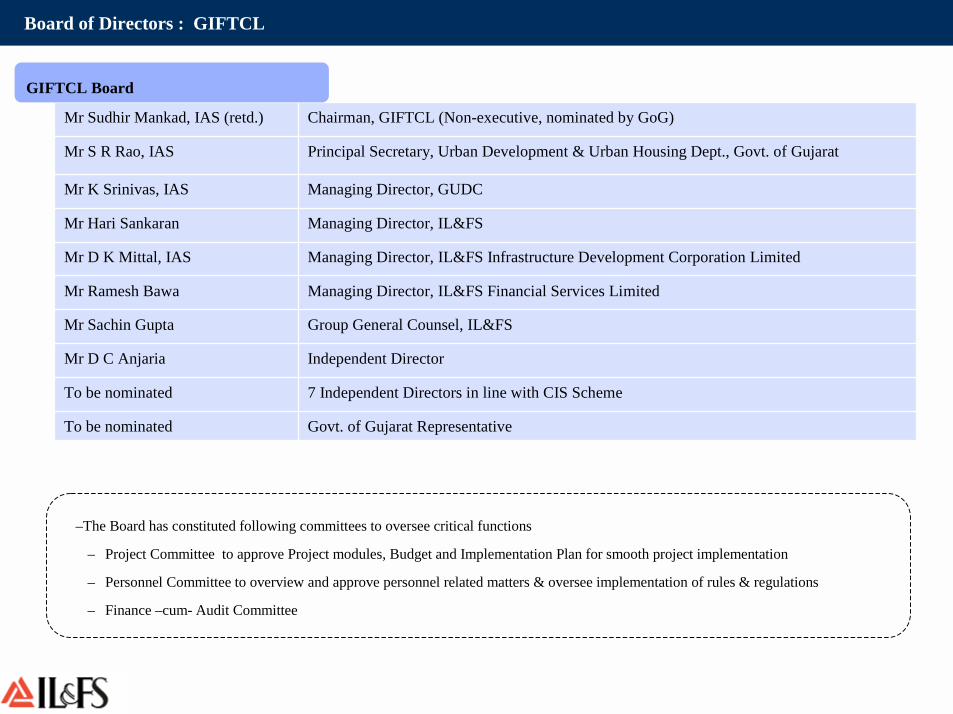
Board of Directors : GIFTCL
Independent DirectorMr D C Anjaria
7 Independent Directors in line with CIS SchemeTo be nominated
Managing Director, IL&FS Infrastructure Development Corporation LimitedMr D K Mittal, IAS
Principal Secretary, Urban Development & Urban Housing Dept., Govt. of GujaratMr S R Rao, IAS
Managing Director, GUDCMr K Srinivas, IAS
Mr Sudhir Mankad, IAS (retd.) Chairman, GIFTCL (Non-executive, nominated by GoG)
Mr Hari Sankaran Managing Director, IL&FS
Mr Ramesh Bawa Managing Director, IL&FS Financial Services Limited
Mr Sachin Gupta Group General Counsel, IL&FS
To be nominated Govt. of Gujarat Representative
GIFTCL Board
–The Board has constituted following committees to oversee critical functions
– Project Committee to approve Project modules, Budget and Implementation Plan for smooth project implementation
– Personnel Committee to overview and approve personnel related matters & oversee implementation of rules & regulations
– Finance –cum- Audit Committee

77
What is the current Project status?

78
Legend
Activity Start Activity DurationActivity End Activity (Continue)
Project Development Activities
Project Activities 2007-08 2010-11Jan-Mar Apr-Jun Jul-Sept Oct-Dec Jan-Mar Apr-Jun Jul-Sept Oct-Dec Jan-Mar Apr-Jun
PROJECT DEVELOPMENTPreparation of Master PlanConcept Design
BuildingsInfrastructure
Approvals & ClearancesHigh Rise ClearanceEnvironmental Studies & ClearanceMaster Plan including GDCR
Detailed DesignBuilding ArchitectureInfrastructure Component
2008-09 2009-10
AprilApril
JuneMay
April
JuneJune
Completed
OngoingOngoing
OngoingOngoingOngoing
C
Continue

79
Legend
Activity Start Activity DurationActivity End
Project Finance and Marketing Activities
Project Activities 2007-08Jan-Mar Apr-Jun Jul-Sept Oct-Dec Jan-Mar Apr-Jun Jul-Sept Oct-Dec Jan-Mar
PROJECT FINANCING & MARKETINGProject StructuringGift FundingSelection of Strategic Partner (PSP)
Viable Infrastructure on PPP ModelSemi-Viable Infrastructure on PPP Model
Project Marketing
2008-09 2009-10
Feb Sept
JuneAprilApril June
SeptOngoing
80
Legend
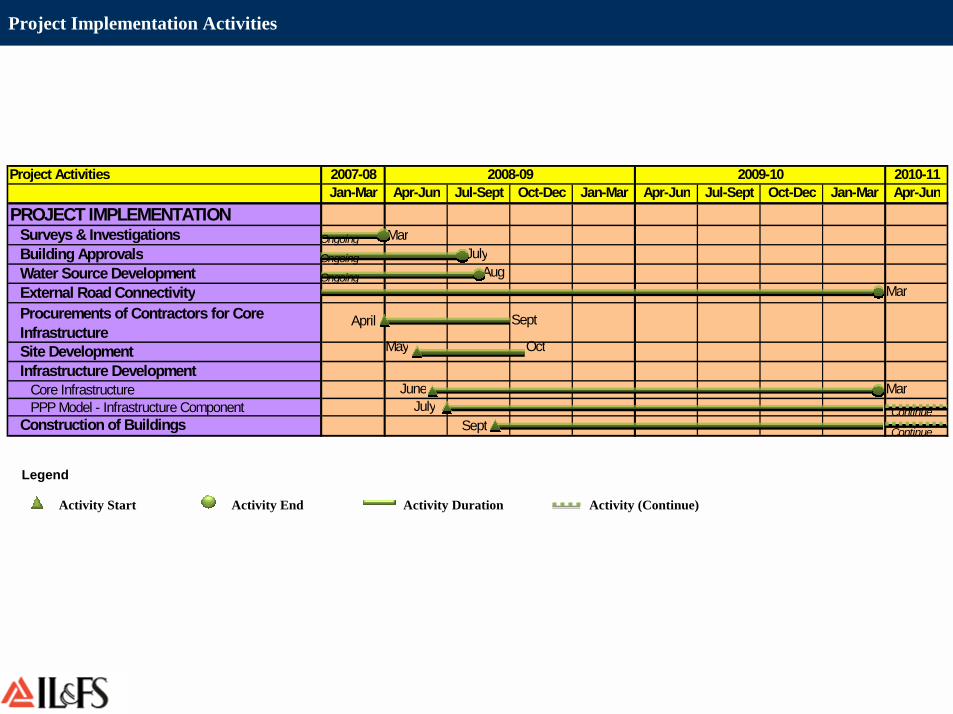
Activity Start Activity DurationActivity End Activity (Continue)
Project Implementation Activities
Project Activities 2007-08 2010-11Jan-Mar Apr-Jun Jul-Sept Oct-Dec Jan-Mar Apr-Jun Jul-Sept Oct-Dec Jan-Mar Apr-Jun
PROJECT IMPLEMENTATION Surveys & InvestigationsBuilding ApprovalsWater Source DevelopmentExternal Road ConnectivityProcurements of Contractors for Core InfrastructureSite DevelopmentInfrastructure Development
Core InfrastructurePPP Model - Infrastructure Component
Construction of Buildings
2008-09 2009-10
MarJuly
AugMar
SeptApril
May Oct
JuneJuly
Sept
Mar
Ongoing
Ongoing
Ongoing
Continue
Continue
81
Way Forward
Thank You


![Gujarat Arts & Science College, Ahmedabad Computer … · Gujarat Arts & Science College, Ahmedabad Computer Science Department ... Ahmedabad Computer Science Department[Self Finance]](https://static.fdocuments.in/doc/165x107/5ada6c2a7f8b9a137f8d72c4/gujarat-arts-science-college-ahmedabad-computer-arts-science-college-ahmedabad.jpg)