Guidelines to Assess Sustainability of Biomass Utilisation in · PDF fileGuidelines to Assess...
89
ERIA Research Project Report 2008 No. 8-2 Guidelines to Assess Sustainability of Biomass Utilisation in East Asia Edited by Masayuki Sagisaka 2009
Transcript of Guidelines to Assess Sustainability of Biomass Utilisation in · PDF fileGuidelines to Assess...
ERIA Research Project Report 2008
No. 8-2
Guidelines to Assess Sustainability of Biomass Utilisation in East Asia
Edited by
Masayuki Sagisaka
2009
Working Group Leader SAGISAKA Masayuki : Dr. Eng., Deputy Director, Research Institute of
Science for Safety & Sustainability, National Institute of Advanced Industrial Science & Technology (AIST), Japan
Working Group Members: (in alphabetical order) CHEN Sau Soon : PhD, Senior General Manager, Environment &
Bioprocess Technology Centre, SIRIM, Malaysia Jessie C. ELAURIA : PhD, Professor, Institute of Agricultural Engineering,
College of Engineering and Agro-industrial Technology, University of the Philippines Los Banos College, The Philippines
Shabbir H. GHEEWALA : Dr. Eng., Associate Professor, The Joint Graduate
School of Energy and Environment (JGSEE), King Mongkut‘s University of Technology Thonburi, Thailand
Udin HASANUDIN : Dr. Eng., Head, Department of Agroindustrial
Technology, University of Lampung, Indonesia KHOO Hsien Hui : PhD, Research Fellow, Institute of Chemical &
Engineering Sciences (ICES), Singapore SADAMICHI Yucho : Dr. Eng., Lecturer, Life Cycle Management Centre,
Chiang Mai University, Thailand Vinod K. SHARMA : PhD, Professor, Indira Gandhi Institute of Development
Research (IGIDR), India
TABLE OF CONTENTS
1. INTRODUCTION
1.1 Background ............................................................................................................. 1
1.2 Discussion ................................................................................................................ 1
1.3 Biomass in East Asian Countries in 2008 .............................................................. 2
1.4 Worldwide Discussion on Sustainable Bioenergy .................................................. 6
2. GLOBAL DISCUSSIONS ON SUSTAINABILITY OF BIOMASS DERIVED FUEL
2.1 Introduction ............................................................................................................. 8
2.2 Salient features of guidelines and directives ....................................................... 13
3. SUSTAINABILITY ASSESSMENT METHODOLOGY
3.1 ENVIRONMENTAL IMPACT - Life Cycle Approach to Develop Greenhouse
Gas Inventory -
3.1.1 Introduction .................................................................................................... 15
3.1.2 Conducting an LCI Analysis of Bioenergy ..................................................... 16
3.1.3 Recommendations ........................................................................................... 23
3.2 ECONOMIC IMPACT - Methodologies Used in the Calculation of Indices for
Economic Assessment -
3.2.1 Introduction .................................................................................................... 28
3.2.2 Economic Assessment of Biomass Utilisation ............................................... 29
REFERENCES ........................................................................................................... 34
3.3 SOCIAL IMPACT
3.3.1 Introduction .................................................................................................... 36
3.3.2 HDI and Social Development ......................................................................... 37
3.3.3 Estimation of SDIS ......................................................................................... 39
3.3.4 Data and Assumptions ................................................................................... 40
3.3.5 Methodology for Estimation ........................................................................... 40
3.3.6 Summary of Results ....................................................................................... 43
3.3.7 Conclusions ..................................................................................................... 45
REFERENCES ........................................................................................................... 46
Appendix 1: Calculations of HDI ............................................................................... 47
4. INTEGRATION OF SUSTAINABILITY INDICATORS
4.1 Approaches for integration ................................................................................... 51
4.2 Integrated of indicators for assessing biomass utilisation .................................. 54
REFERENCES .............................................................................................................. 56
5. POLICY RECOMMENDATIONS .............................................................................. 57
6. CONCLUSION ........................................................................................................... 59
APPENDIX[1] PILOT STUDY‐ENVIRONMENT ................................................. 60
APPENDIX[2-1]PILOT STUDY‐ECONOMICS ........................................................ 71
APPENDIX[2-2]PILOT STUDY‐COCONUT ............................................................ 74
APPENDIX[3] PILOT STUDY‐SOCIAL ................................................................ 81
1
1. INTRODUCTION
1.1 Background
A Working Group (WG) of experts and researchers, supported by ERIA since 2007,
is engaged in research and discussions on “Sustainable Biomass Utilisation Vision in
East Asia.” The WG produced a report 1 , which listed seven major policy
recommendations for sustainability of bioenergy in the East Asian region.
Based on these policy recommendations and the background studies conducted by
the WG, “Asia Biomass Energy Principles” were framed and reported to the East Asian
Summit of Energy Ministers and endorsed by the Ministers in August 2008. The
Ministers requested ERIA to develop a methodology for assessing the environmental,
economic and social sustainability in production and utilisation of biomass taking into
account specific regional circumstances at the meeting. In response to this, the WG
initiated investigations for developing “Guidelines to Sustainability Assessment of
Biomass Utilisation in East Asia.”
1.2 Discussion
Sustainable development is of utmost importance and a serious concern world over.
Any development activity that is not appropriately implemented and managed could
lead to environmental disaster. There is a possibility of negative environmental
impacts of using biomass as feedstock for production of biofuels. And therefore, policy
makers should think about the sustainability of biomass projects prior to framing the
relevant policies. The assessment methodology for the sustainability is a key
decision-support tool. The WG adopted the definition of “sustainable development”
from “Our Common Future” of the UN World Commission on Environment and
1 “Sustainable Biomass Utilisation Vision in East Asia”; ERIA Working Group, ERIA Research Project
2007 No.6-3, pp1-148, 2007
2
Development (WCED) report published in 1987, which defines the sustainable
development as the "development that meets the needs of the present without
compromising the ability of future generations to meet their own needs."
The triple bottom line approach, focusing on "People, Planet, Profit," is based upon
economic, environmental and social criteria. To ascertain the sustainability of
bioenergy development, these aspects are necessary and must be considered to
overcome or at least minimise the problems that may occur with the expansion of
biomass energy utilisation. In view of the above, the WG, continued research and
discussions in 2008. Based upon this research and the previous year’s achievements
WG produced this report titled as “Guidelines to Assess Sustainability of Biomass
Utilisation in East Asian Countries”.
1.3 Biomass in East Asian Countries in 2008
Some of the major policy interventions on biomass utilisation, as adopted by
selected countries in the East Asian region in 2008, are as follows.
(India)
The Union Cabinet approved the National Policy on Biofuel prepared by the
Ministry of New and Renewable Energy in September, 2008. Salient features of the
National Biofuel Policy are as follows:
・An indicative target of 20% by 2017 for the blending of biofuels, i.e. bioethanol and
bio-diesel, has been proposed.
・Bio-diesel production will be taken up from non-edible oil seeds in waste / degraded /
marginal lands.
・The focus would be on indigenous production of bio-diesel feedstock and import of
Free Fatty Acid (FFA) based such as oil, palm etc. would not be permitted.
・Bio-diesel plantations on community / Government / forest waste lands would be
encouraged while plantation in fertile irrigated lands would not be encouraged.
・Minimum Support Price (MSP) with the provision of periodic revision for bio-diesel oil

3
seeds would be announced to provide fair price to the growers. The details about the
MSP mechanism, enshrined in the National Biofuel Policy, would be worked out
carefully subsequently and considered by the Bio-fuel Steering Committee.
・Minimum Purchase Price (MPP) for the purchase of bio-ethanol by the Oil Marketing
Companies (OMCs) would be based on the actual cost of production and import price
of bio-ethanol. In case of biodiesel, the MPP should be linked to the prevailing retail
diesel price.
・The policy envisages that bio-fuels, namely, biodiesel and bio-ethanol may be brought
under the ambit of declared Goods by the Government to ensure unrestricted
movement of biofuels within and outside the States.
・It is also stated in the Policy that no taxes and duties should be levied on bio-diesel.
(Indonesia)
Starting January 1st 2009, users and fuel distributors are obligated to use biofuel,
with products such as biodiesel, bioethanol, and biokerosene. This mandatory use is
stipulated in Minister of Energy and Mineral Resources Decree no 32/2008. "This
mandatory use is a way of increasing biofuel usage for the transport, industry, and
power sectors". Besides supporting the energy diversification program, this step is also
expected to contribute in reducing fuel subsidy costs. The government mandates the
use of biodiesel at a minimum of 1% for the transportation sector (both PSO i.e public
service obligation and non PSO), while the industrial and commercial sectors are
targeted at 2,5% and power plants at 0.25%.
The government has mandated the use of bioethanol at a minimum of 1% for the
PSO transportation sector, 5% for the non PSO transportation sector, and another 5%
for the industry and commercial sectors. Biofuel as a source of alternative energy is
targeted to fulfil 0.25% of the power plant fuel needs, while low and medium rpm
operating machines of the industrial and sea transport are targeted at 1% each,
starting January 2010.
These numbers are set by the government in order to implement the targeted

4
usage of Biofuel of 5% by 2025. This biofuel will be domestically supplied, and not
imported. Main problem on the implementation of biofuels’ utilisation is their price.
Fossil fuel price in Indonesia have subsidy, and therefore, biofuels are not competitive
in the market. Government now has initiated a new regulation system like subsidy
system for biodiesel and bioethanol.
Related to biomass waste from agro-industries, this year, Ministry of Environment,
Republic of Indonesia, started developing a program "Agro-industry to zero-waste
programs". The objectives of this program are to reduce negative impact of
agro-industries (such as soil and water pollutions, GHGs emissions, etc.) and increase
revenue from the utilisation of biomass waste from agro-industries.
(Japan)
Government of Japan launched “Technology Innovation Plan for Biofuels” in 2008.
The final target of the plan is to achieve 50% reduction in the GHG emissions during
the lifecycle of biofuels and the target cost is less than 40 Japanese yen per liter of the
biofuels. Some R & D projects have been initiated to realise the above plan.
(Malaysia)
The National Biofuel Policy is the main biodiesel policy in Malaysia. It was
launched by The Federal Government on 10th August 2005. The policy is primarily
aimed at reducing the country’s fuel import bill, promoting further the demand for
palm oil, which will be the primary commodity for biofuel production (alongside
regular diesel), as well as to shore up the price of palm oil especially during periods of
low export demand.
The National Biofuel Policy is complemented by Malaysian Biofuel Industry Act
2007 (Act 666) that was enforced this year and will enable the orderly development
and regulation of the industry. In addition, the Act also allows the Government to
mandate the use of biofuel for any activity in the country. It prescribes the type of
biofuel and its percentage by volume to be blended in any fuel. The Act also deals with

5
the provisions relating to revocation or suspension of biofuel plant license, It empowers
the licensing authority to revoke or suspend any license if the licensee has ceased to
carry on or operate any biofuel activity for which the license is issued
In October 2008, Malaysia implemented the mandate of a 5% palm methyl ester
blend with fossil diesel (B5), gradually starting with its use in government vehicles in
2009 and extending it to the industrial and transportation sectors in 2010. The use of
the B5 blend in the country would consume 500,000 tonnes of palm oil.
(The Philippines)
In the Philippines, the overall vision of the government on biofuels’ use includes
the reduced dependence on imported energy and broader resource base with an
indigenous, inexhaustible and environmentally desirable options such as the use of
renewable energy (RE) including biomass energy. Biomass will be used in “Support of
Alternative Transport Fuels Program” of the government.
For the next decade, the country through the Department of Energy (DOE) is set
to pursue an aggressive RE program and includes under its goals the following:
increase renewable energy-based capacity by 100% in 10 years, use of 5% CME blend
with diesel fuel for vehicles in 2010, and 10% ethanol blend with gasoline fuel for
vehicles by 2007 to reach 25% in 2010. It also includes the installation of 130 to 250
MW capacity of biomass, solar and ocean energies. To support its objectives, the
government passed two bills into laws, namely, RA 9367 or the Biofuels Law that
mandates the use of biodiesel and bioethanol nationwide and RA 9513 or the
Renewable Energy Act.
(Thailand)
The target proposed by the Ministry of Energy is "Increasing the proportion of
using alternative energy to 20 percent of the national final energy consumption by
2022". The objectives are to reduce oil imports, enhance energy security, environmental
benefits and energy efficiency.

6
The plan will be implemented in three phases, i.e.
Short Term (2008-2011): Focusing on promoting the proven alternative energy
technologies with high potential sources such as: biofuels, heat and power generation
from biomass and biogas. The financial support measures will be fully implemented.
Medium Term (2012-2016): Promoting the alternative energy technology industry
and supporting the development on new prototype of alternative energy technology for
a higher cost-effectiveness. This includes promoting new technologies for biofuel
production.
Long Term (2017-2022): Promoting new technologies of alternative energy which
are cost-effective. Supporting Thailand to become the hub of biofuel export and
exporting the alternative energy technology in the ASEAN region
Table 1-1: Alternative Energy Target of Thailand
Alternative Energy Target of 20.4% in 2022 (data only for biomass)
Energy Type Potential Existing 2008-2011 2012-2016 2017-2022
Electricity from biomass (MW) 4,400 1,597 2,800 3,235 3,700
Electricity from biogas (MW) 190 29 60 90 120
Electricity from MSW (MW) 320 5 100 130 160
Heat from biomass (ktoe) 7,400 2,340 3,544 4,915 6,725
Heat from biogas (ktoe) 600 79 470 540 600
Heat from MSW (ktoe) 78 1 16 25 35
Ethanol (mL/day) 3.3 1 3 6.2 9
Biodiesel (mL/day) 3.3 1.39 3 3.64 4.5
1.4 Worldwide Discussion on Sustainable Bioenergy
The EU adopted the “Directive on Renewable Energy” to set standards for biofuel
with regard to reduction of greenhouse gas emissions and environmental impacts in
December 2008. GBEP (Global Bioenergy Partnership), which was established by the
G8 Summit, is developing international sustainability standards for biofuels. ISO
(International Standardisation Organisation) is going to start discussion on standard
7
of “Sustainability Criteria for Biofuels”. Some other organisations are also discussing
this issue worldwide and details of this are given in Chapter 2.
These discussions and developing criteria must be quite meaningful but the
opportunity to participate in such discussions should be given to all stakeholders.
Since the East Asian region has a large potential for production and consumption of
biomass resources, the concerns of the region should be part of the above discussions.
Also, such concerns should be backed by scientific considerations and local experiences
as well as state of development. The discussion within the WG of the ERIA and this
report are expected to contribute towards the scientific base and the concerns on
bioenergy that may emerge from the region.

8
2. GLOBAL DISCUSSIONS ON SUSTAINABILITY OF BIOMASS DERIVED FUEL
2.1 Introduction
Global energy demand is propelled by two main sectors namely electricity
generation and transportation. Net electricity generation has been forecasted to
increase from 18 trillion kWh in 2006 to 31.8 tillion kWh by 20302. Transportation
sector is projected to consume 127.7 quadrillion Btu of energy by 2030, an increase of
about 39% from 20062. At the same time, projection of increase in world energy-related
CO2 emissions will accelerate from 29 billion metric ton in 2006 to 40.4 billion metric
ton in 20302.
It is against these two scenarios of escalating energy demand and global warming
that energy security and greenhouse gas (GHG) reduction have become global concerns
and the global approach seems to be targeted at renewable energy (RE). For example,
policy targets for renewable energy exist in at least 66 countries worldwide3 among
the more challenging ones is the EU-wide target of 20% RE target in the final energy
demand, and 10% biofuel target in the transport energy demand by 2020. Aside from
the target-setting policies, there are other forms of RE promotion policies broadly
categorised3 under:
o Feed-in tariff
o Renewable portfolio standard
o Capital subsidies, grants or rebates
o Investment or other tax credits
o Sales tax, energy tax, excise tax, or VAT reduction
o Tradable renewable energy certificates 2 Energy Information Administration, International Energy Outlook 2009,
http://www.eia.doe.gov/oiaf/ieo/index.html. 3 REN21.2008 “Renewables 2007 Global Status Report” (Paris:REN21 Secretariat and
Washington, DC:Worldwatch Institute)

9
o Energy production payments or tax credits
o Net metering
o Public investment, loans or financing
o Public competitive bidding
In terms of the two major energy-consumption sectors i.e. power generation and
transport, bioenergy or biofuel has made greater in-roads into the transport sector
evident by the biofuel policies with mandates for blending biofuels ranging from E1
(1% blend) to E25 (25% blend) for bioethanol and B1 to B20 for biodiesel with target
time frames of up to 2015.
While policies to support growth of the biofuel industry is on the rise especially
among the developing countries that have seen RE as a potential fast-growing
economic sector. There is also an increasing awareness that the ‘carbon neutral’
perspective of biofuel at the point of combustion may be negated by emissions from the
production process, especially when viewed from a life cycle perspective beginning with
the biomass feedstock material and land-use change. Figure 1 shows that
transportation and electricity (& heat) sectors account for about 40% of the world GHG
emission. The prospect of capping or reducing GHG emission through RE to fulfil
obligations of Annex I countries under Kyoto Protocol is also one of the drivers for the
RE growth.

10
4Figure 2-1: World greenhouse gas emission by sector, power and transportation sectors account for ~40% of the world GHG emission.
Central to the discussion of environmental sustainability versus energy security or
the carbon and energy balance is the rising concern that the reduction in the life cycle
GHG emission of bioenergy may not be significant enough to warrant the investment,
exemptions and subsidies that have propelled the growth of the RE sector, including
the biofuel industry.
As natural disasters attributed to global warming and climate change become
more evident, the pressure to reduce GHG emissions has transcended from policy
makers to society at large, especially in the developed countries where awareness of
these phenomenon are higher. This has given rise to strategies such as developing
carbon footprint or ecolabelling of products that will enable purchasers to exercise
4 Source: UNEP G.R.I.D Arendal,
http://maps.grida.no.go.graphic/world-greenhouse-gas-emissions-by-sector
11
their purchasing power for goods that emit less GHG or has less environmental
impact.
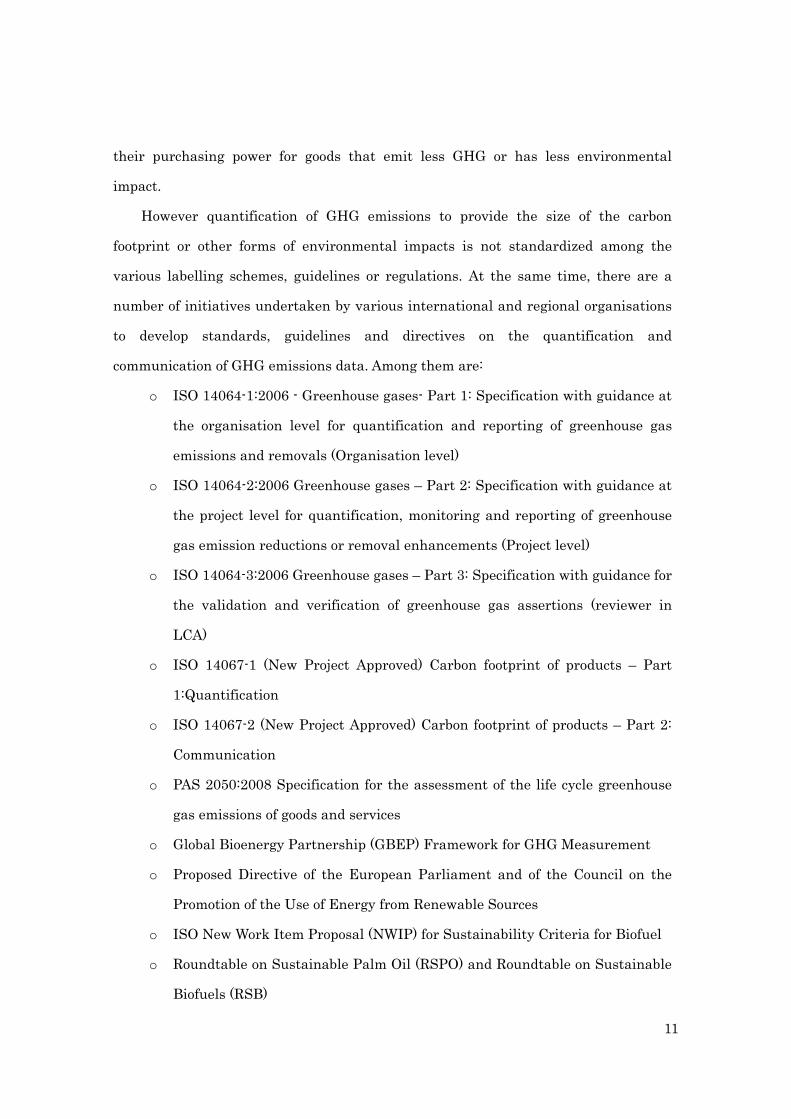
However quantification of GHG emissions to provide the size of the carbon
footprint or other forms of environmental impacts is not standardized among the
various labelling schemes, guidelines or regulations. At the same time, there are a
number of initiatives undertaken by various international and regional organisations
to develop standards, guidelines and directives on the quantification and
communication of GHG emissions data. Among them are:
o ISO 14064-1:2006 - Greenhouse gases- Part 1: Specification with guidance at
the organisation level for quantification and reporting of greenhouse gas
emissions and removals (Organisation level)
o ISO 14064-2:2006 Greenhouse gases – Part 2: Specification with guidance at
the project level for quantification, monitoring and reporting of greenhouse
gas emission reductions or removal enhancements (Project level)
o ISO 14064-3:2006 Greenhouse gases – Part 3: Specification with guidance for
the validation and verification of greenhouse gas assertions (reviewer in
LCA)
o ISO 14067-1 (New Project Approved) Carbon footprint of products – Part
1:Quantification
o ISO 14067-2 (New Project Approved) Carbon footprint of products – Part 2:
Communication
o PAS 2050:2008 Specification for the assessment of the life cycle greenhouse
gas emissions of goods and services
o Global Bioenergy Partnership (GBEP) Framework for GHG Measurement
o Proposed Directive of the European Parliament and of the Council on the
Promotion of the Use of Energy from Renewable Sources
o ISO New Work Item Proposal (NWIP) for Sustainability Criteria for Biofuel
o Roundtable on Sustainable Palm Oil (RSPO) and Roundtable on Sustainable
Biofuels (RSB)
12
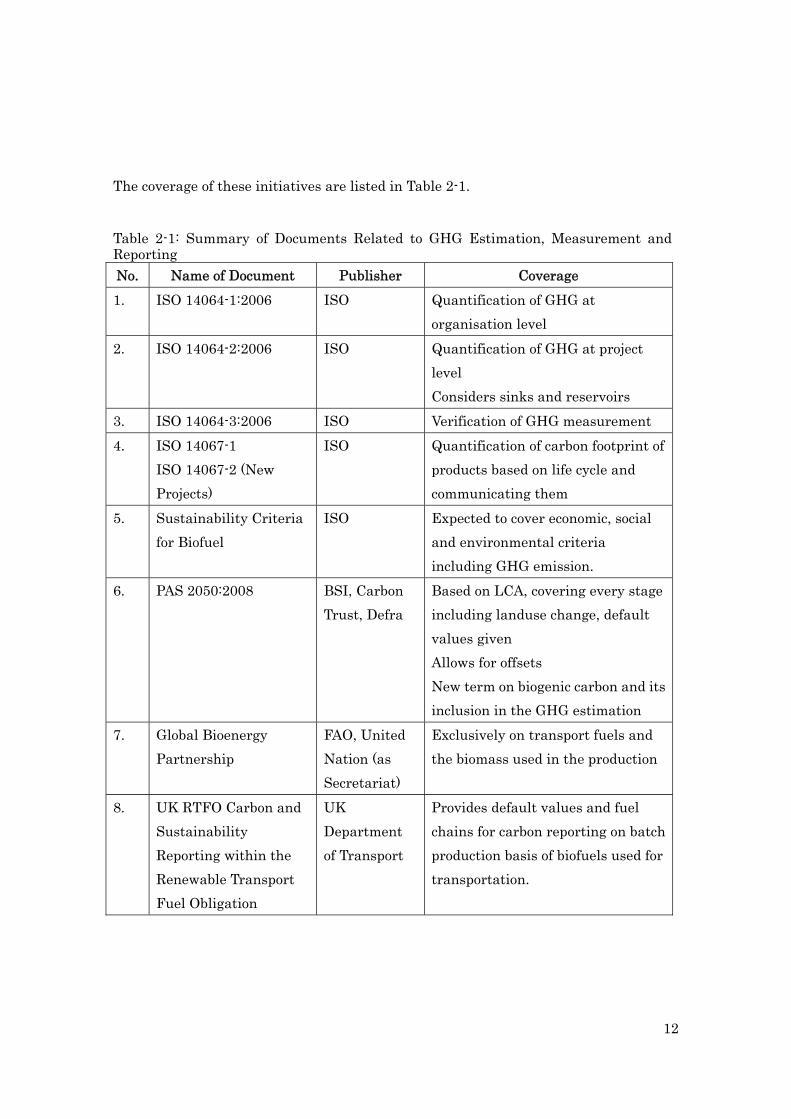
The coverage of these initiatives are listed in Table 2-1.
Table 2-1: Summary of Documents Related to GHG Estimation, Measurement and Reporting
No. Name of Document Publisher Coverage
1. ISO 14064-1:2006 ISO Quantification of GHG at
organisation level
2. ISO 14064-2:2006 ISO Quantification of GHG at project
level
Considers sinks and reservoirs
3. ISO 14064-3:2006 ISO Verification of GHG measurement
4. ISO 14067-1
ISO 14067-2 (New
Projects)
ISO Quantification of carbon footprint of
products based on life cycle and
communicating them
5. Sustainability Criteria
for Biofuel
ISO Expected to cover economic, social
and environmental criteria
including GHG emission.
6. PAS 2050:2008 BSI, Carbon
Trust, Defra
Based on LCA, covering every stage
including landuse change, default
values given
Allows for offsets
New term on biogenic carbon and its
inclusion in the GHG estimation
7. Global Bioenergy
Partnership
FAO, United
Nation (as
Secretariat)
Exclusively on transport fuels and
the biomass used in the production
8. UK RTFO Carbon and
Sustainability
Reporting within the
Renewable Transport
Fuel Obligation
UK
Department
of Transport
Provides default values and fuel
chains for carbon reporting on batch
production basis of biofuels used for
transportation.
13
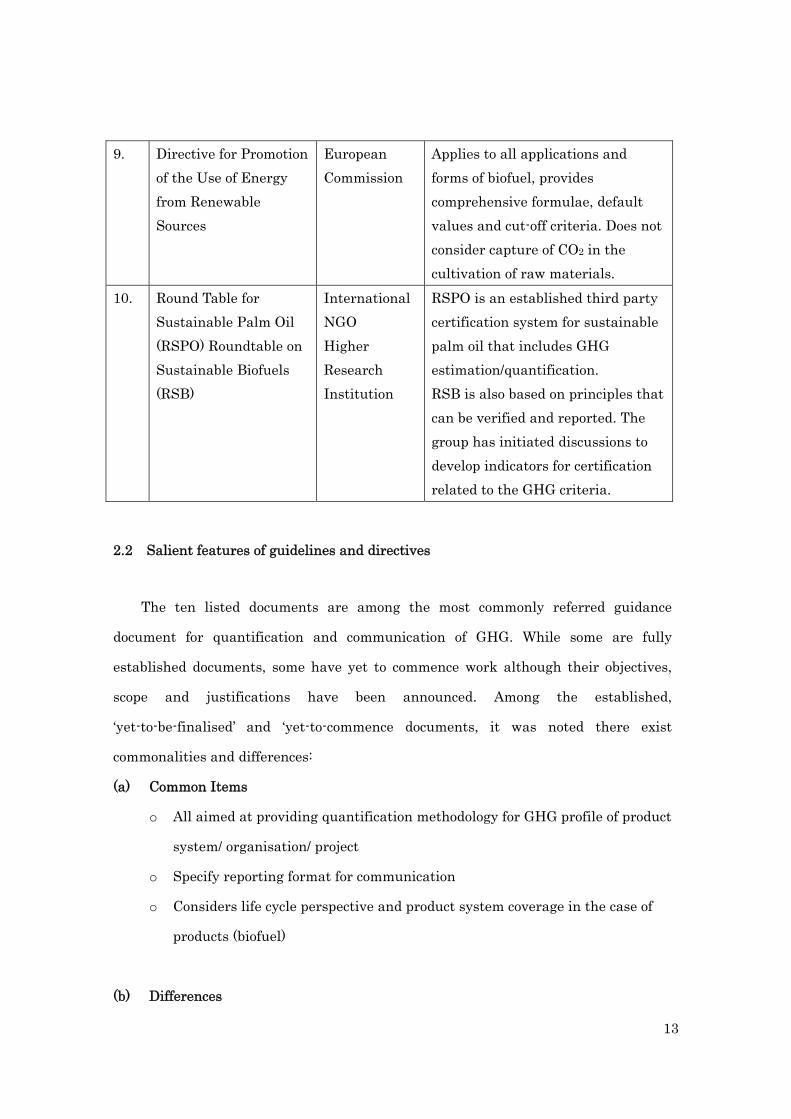
9. Directive for Promotion
of the Use of Energy
from Renewable
Sources
European
Commission
Applies to all applications and
forms of biofuel, provides
comprehensive formulae, default
values and cut-off criteria. Does not
consider capture of CO2 in the
cultivation of raw materials.
10. Round Table for
Sustainable Palm Oil
(RSPO) Roundtable on
Sustainable Biofuels
(RSB)
International
NGO
Higher
Research
Institution
RSPO is an established third party
certification system for sustainable
palm oil that includes GHG
estimation/quantification.
RSB is also based on principles that
can be verified and reported. The
group has initiated discussions to
develop indicators for certification
related to the GHG criteria.
2.2 Salient features of guidelines and directives
The ten listed documents are among the most commonly referred guidance
document for quantification and communication of GHG. While some are fully
established documents, some have yet to commence work although their objectives,
scope and justifications have been announced. Among the established,
‘yet-to-be-finalised’ and ‘yet-to-commence documents, it was noted there exist
commonalities and differences:
(a) Common Items
o All aimed at providing quantification methodology for GHG profile of product
system/ organisation/ project
o Specify reporting format for communication
o Considers life cycle perspective and product system coverage in the case of
products (biofuel)
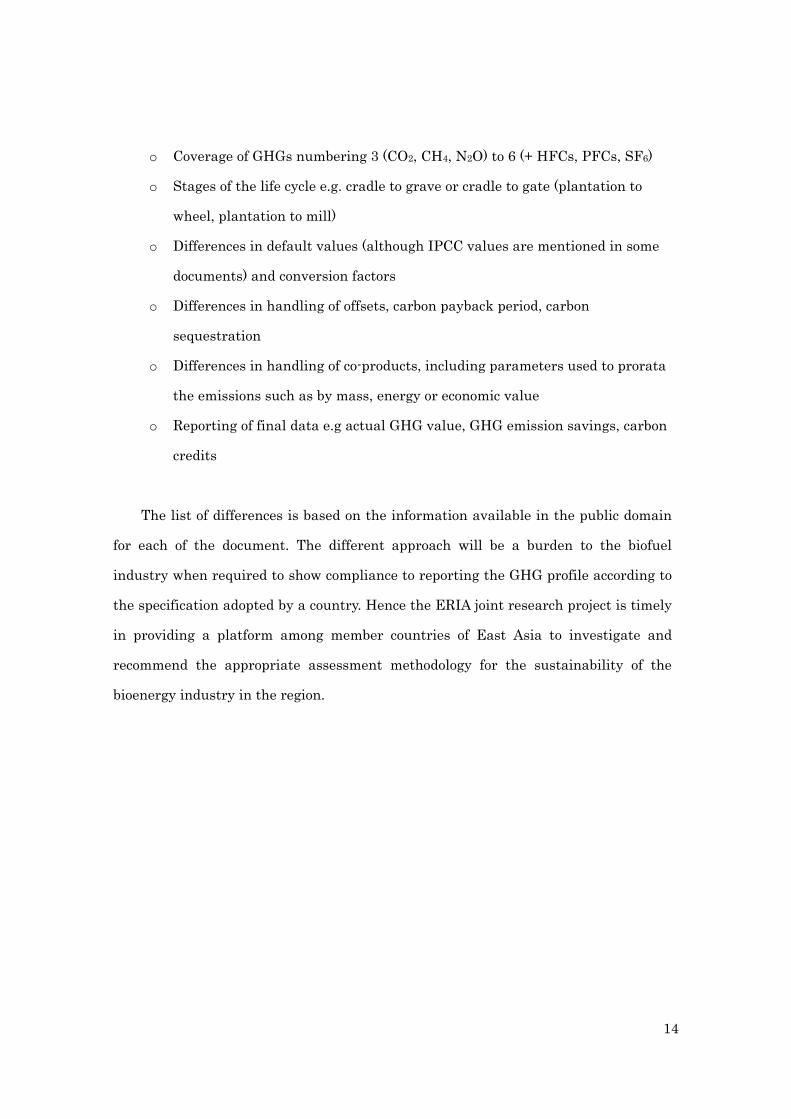
(b) Differences
14
o Coverage of GHGs numbering 3 (CO2, CH4, N2O) to 6 (+ HFCs, PFCs, SF6)
o Stages of the life cycle e.g. cradle to grave or cradle to gate (plantation to
wheel, plantation to mill)
o Differences in default values (although IPCC values are mentioned in some
documents) and conversion factors
o Differences in handling of offsets, carbon payback period, carbon
sequestration
o Differences in handling of co-products, including parameters used to prorata
the emissions such as by mass, energy or economic value
o Reporting of final data e.g actual GHG value, GHG emission savings, carbon
credits
The list of differences is based on the information available in the public domain
for each of the document. The different approach will be a burden to the biofuel
industry when required to show compliance to reporting the GHG profile according to
the specification adopted by a country. Hence the ERIA joint research project is timely
in providing a platform among member countries of East Asia to investigate and
recommend the appropriate assessment methodology for the sustainability of the
bioenergy industry in the region.
15
3. SUSTAINABILITY ASSESSMENT METHODOLOGY
3.1 ENVIRONMENTAL IMPACT - Life Cycle Approach to Develop Greenhouse Gas Inventory -
3.1.1 Introduction
Life Cycle Assessment (LCA) is increasingly being promoted as a technique for
analysing and assessing the environmental performance of a product system and is
suited for environmental management and long-term sustainability development.
Although LCA can be used to quantitatively assess the extent of impact of a product
system toward environmental issues of concern such as acidification, eutrophication,
photooxidation, toxicity and biodiversity loss, these impact categories are currently not
in the limelight as compared to climate change, a phenomenon that is associated with
the increasing frequency of extreme weather conditions and disasters. Effects of
climate change have been attributed directly to the increased atmospheric
concentration of GHG released by anthropogenic activities.
One of the widely accepted climate change mitigation approach is the propagation
of renewable energy for GHG avoidance, and concurrently address the issue of energy
security. Biomass that is converted to bioenergy is a source of renewable energy. Hence,
the impact of using bioenergy in the transport and power generation sectors will be
significant provided the life cycle release is reduced compared to fossil fuel. The cradle
to grave life cycle of a type of bioenergy, used for transportation or power generation is
shown in Figure 3-1-1.

16
Based on the two main ISO standards on LCA, ISO 14040 and ISO 140445,
conducting a LCA study consists of four phases. However, in estimating GHG emission
specific for biomass energy, only the procedures associated with life cycle inventory
(LCI) analysis involving compilation and quantification of inputs and outputs for a
given biomass energy throughout its life cycle will be carried out.
The LCI for bioenergy should cover CO2 and non-CO2 greenhouse namely CH4 and
N2O that are released directly or indirectly from agricultural activities. The GHG
inventory will be reported as CO2equi and the summation of contribution from non-CO2
gases will be based on the Global Warming Potential (GWP) for a 100-year time
horizon of CH4 and N2O at 25 and 298 times, respectively.
3.1.2 Conducting an LCI Analysis of Bioenergy
The life cycle stages of a bioenergy are comprised of the following:
o Agriculture
5 ISO 14040 Environmental management – Life cycle assessment – Principles and
framework ISO 14044 Environmental management – Life cycle assessment – Requirements and
guidelines
Agriculture
Electricity
Use Conversion
Processing
feedstock
Natural Produce
Water
Chemicals
Fuel
Wastewater
Solid waste
Air emission
Distribution
Figure 3-1-1: System boundary for the cradle to grave life cycle inventory of bioenergy
17
o Feedstock processing
o Conversion
o Distribution
o Use
Of the five stages, the cultivation of feedstock materials, summed under
agriculture has in most cases contributed to highest emission of GHG. It is in fact
highlighted as the stage that requires the most intervention from policy makers. At the
same time, it is also the most complex stage where input and output data are not easily
measured, and are subjected to estimates and modelling. Hence, the agriculture stage
will also be discussed in greater details as compared to the other stages.
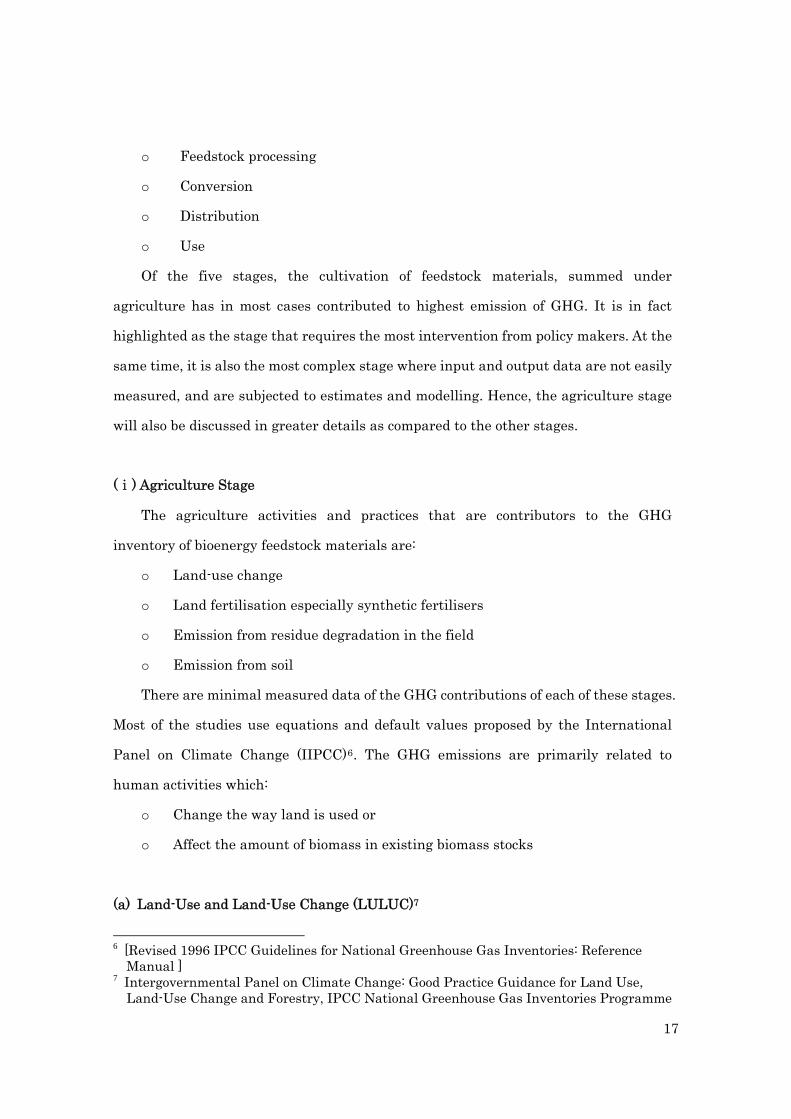
(ⅰ) Agriculture Stage
The agriculture activities and practices that are contributors to the GHG
inventory of bioenergy feedstock materials are:
o Land-use change
o Land fertilisation especially synthetic fertilisers
o Emission from residue degradation in the field
o Emission from soil
There are minimal measured data of the GHG contributions of each of these stages.
Most of the studies use equations and default values proposed by the International
Panel on Climate Change (IIPCC)6. The GHG emissions are primarily related to
human activities which:
o Change the way land is used or
o Affect the amount of biomass in existing biomass stocks
(a) Land-Use and Land-Use Change (LULUC)7
6 [Revised 1996 IPCC Guidelines for National Greenhouse Gas Inventories: Reference
Manual ] 7 Intergovernmental Panel on Climate Change: Good Practice Guidance for Land Use,
Land-Use Change and Forestry, IPCC National Greenhouse Gas Inventories Programme
18
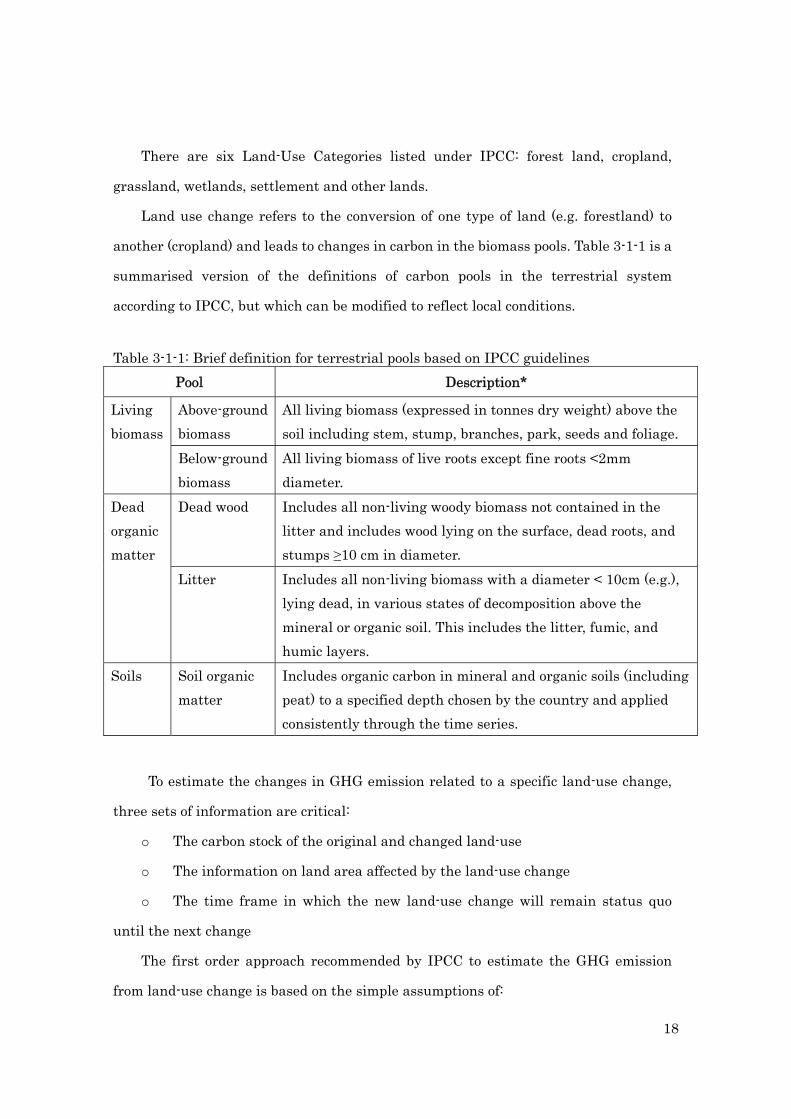
There are six Land-Use Categories listed under IPCC: forest land, cropland,
grassland, wetlands, settlement and other lands.
Land use change refers to the conversion of one type of land (e.g. forestland) to
another (cropland) and leads to changes in carbon in the biomass pools. Table 3-1-1 is a
summarised version of the definitions of carbon pools in the terrestrial system
according to IPCC, but which can be modified to reflect local conditions.
Table 3-1-1: Brief definition for terrestrial pools based on IPCC guidelines
Pool Description*
Living
biomass
Above-ground
biomass
All living biomass (expressed in tonnes dry weight) above the
soil including stem, stump, branches, park, seeds and foliage.
Below-ground
biomass
All living biomass of live roots except fine roots <2mm
diameter.
Dead
organic
matter
Dead wood Includes all non-living woody biomass not contained in the
litter and includes wood lying on the surface, dead roots, and
stumps ≥10 cm in diameter.
Litter Includes all non-living biomass with a diameter < 10cm (e.g.),
lying dead, in various states of decomposition above the
mineral or organic soil. This includes the litter, fumic, and
humic layers.
Soils Soil organic
matter
Includes organic carbon in mineral and organic soils (including
peat) to a specified depth chosen by the country and applied
consistently through the time series.
To estimate the changes in GHG emission related to a specific land-use change,
three sets of information are critical:
o The carbon stock of the original and changed land-use
o The information on land area affected by the land-use change
o The time frame in which the new land-use change will remain status quo
until the next change
The first order approach recommended by IPCC to estimate the GHG emission
from land-use change is based on the simple assumptions of:
19
o the change in carbon stock related to land-use change
o biological responses of vegetation and soils following the land-use change
The input data required to establish the GHG inventory for land-use change will
be extracted primarily from the IPCC manual. Of the six categories of land identified
under IPCC, land that supplies biomass feedstock materials for use or conversion to
bioenery can be referred to as ‘cropland’. Within the remainder five categories, it is
logical to assume the land-use change will take the form of:
o forest land to cropland
o grassland to cropland
o cropland of one type of crop to cropland of another type of crop
o wetland to cropland
o cropland remaining cropland
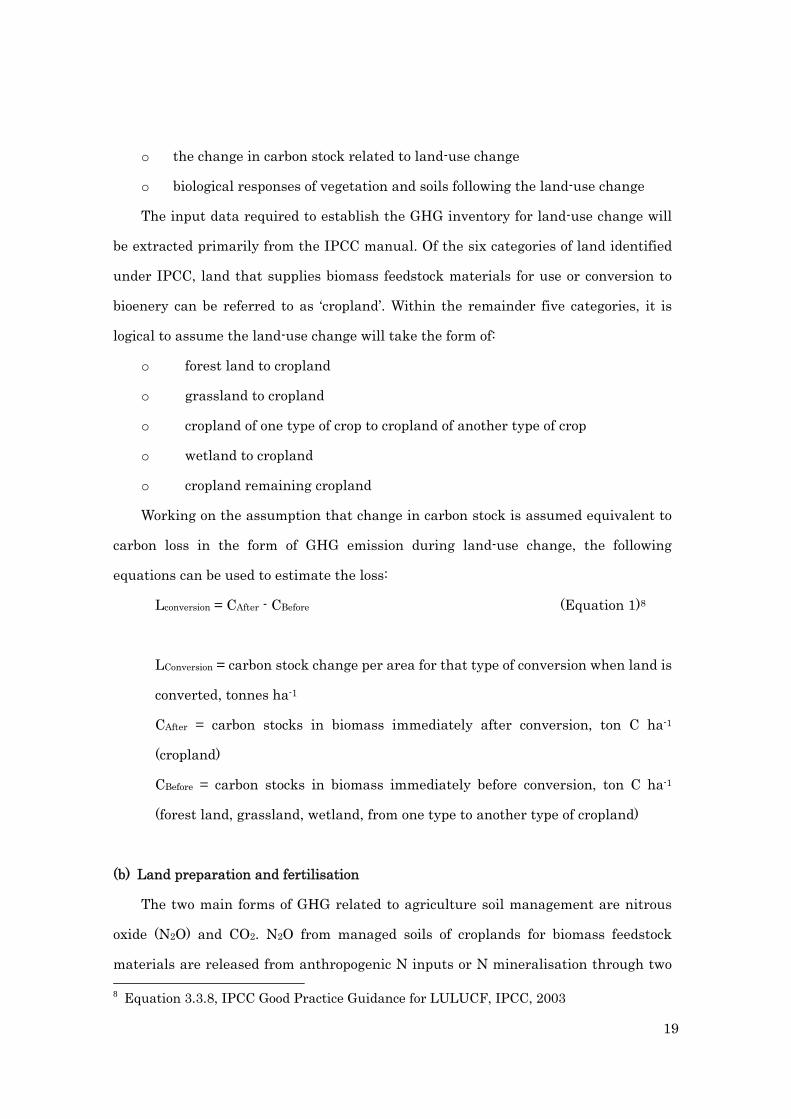
Working on the assumption that change in carbon stock is assumed equivalent to
carbon loss in the form of GHG emission during land-use change, the following
equations can be used to estimate the loss:
Lconversion = CAfter - CBefore (Equation 1)8
LConversion = carbon stock change per area for that type of conversion when land is
converted, tonnes ha-1
CAfter = carbon stocks in biomass immediately after conversion, ton C ha-1
(cropland)
CBefore = carbon stocks in biomass immediately before conversion, ton C ha-1
(forest land, grassland, wetland, from one type to another type of cropland)
(b) Land preparation and fertilisation
The two main forms of GHG related to agriculture soil management are nitrous
oxide (N2O) and CO2. N2O from managed soils of croplands for biomass feedstock
materials are released from anthropogenic N inputs or N mineralisation through two 8 Equation 3.3.8, IPCC Good Practice Guidance for LULUCF, IPCC, 2003

20
primary pathways9:
o direct emissions from the soil through the natural process of nitrification and
denitrification of available N in the soil;
o indirect emissions through the same natural process as above on NH4+ and
NO3- that have deposited in the soil through two routes involving volatilisation, and
leaching and runoff.
Figure 3-1-2 summarises some of the default emission factors obtained from 2006
IPCC Guidelines to estimate direct and indirect emissions of N2O with respect to N
inputs.
Figure 3-1-2: IPCC method for estimation of N2O emission based on range of conversion values related to activities and region.
(c) Contribution from liming and other natural events
Agricultural lime (aglime) in the form of crushed limestone (CaCO3) and crushed
dolomite (MgCa(CO3)2) are applied to agricultural soils to increase soil pH. Following
the supposition by IPCC that all C in aglime is eventually released as CO2 to the
atmosphere, the CO2 emissions from addition of carbonate limes to soils are estimated
based on amount (Mx) and default emission factors (EFx) of CO2 for two major types of
9 IPCC Guidelines for National Greenhouse Gas Inventories, Chp. 11, 2006
N
Applied
N in
crop +
residues
N fertiliser NH3
0.2–5% of N in NH3 N2O
N2O
Direct emission
1.25% of N in residues
Leaching/runoff
10-80% of N-applied
Harvest N in harvested crop
N in residues
Volatisation
3-30% of N-budget
Direct soil emission
0.3-3% of N-applied
N2O
N2O
Direct soil emission
0-24 kg N2O-N per ha N2O
21
aglime i.e. limestone and dolomite. The Annual C emissions from lime applications,
tonnes C yr-1 denoted as CO2-C Emission is estimated as follows:
CO2-C Emission = (MLimestone*EFLimestone) + (MDolomite*EFDolomite) (Equation 2)
There are two other sources of emission during the agriculture stage namely
emission from residue degradation in the field, and emission from soil. Contribution
from residue degradation is estimated based on change in carbon stock change and
emissions resulting from natural decay or burning during land clearing. However only
CH4 and N2O, released during these activities is absorbed into the GHG accounting for
agriculture activities as CO2 is emitted is considered neutral.
(d) Emission from soil
Land conversion to cropland that entails intensive management will usually result
in losses of C in soil organic matter and dead organic matter. IPCC Guidelines assumes
any litter and dead wood pools should be assumed oxidized following land conversion
and changes in soil organic matter.
∆CLCSoils = ∆CLCMineral - ∆CLCorganic - ∆CLCLiming (All parameters in tonnes C yr-1)
(Equation 3)
∆CLCSoils = change in carbon stocks in soils in land converted to cropland
∆CLCMineral = change in carbon stocks in mineral soils in land converted to cropland
∆CLCorganic = C emission from cultivated organic soils converted to cropland
∆CLCLiming = emissions from lime application on land converted to cropland
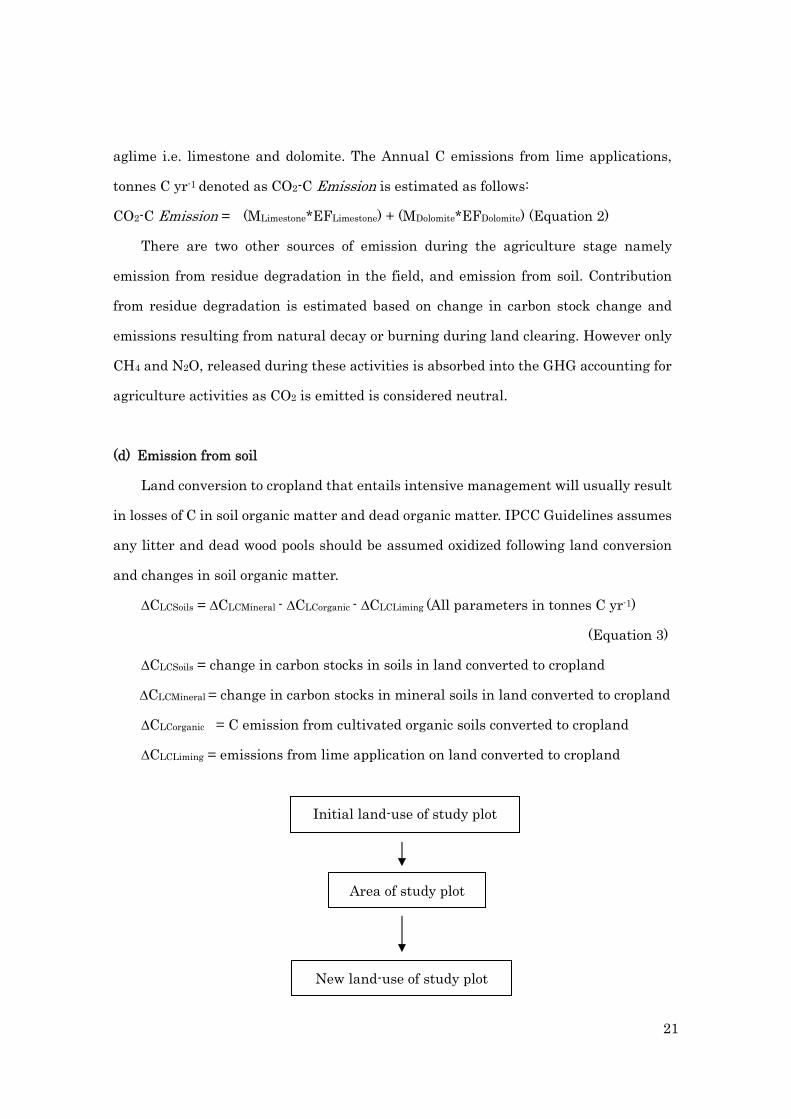
Initial land-use of study plot
Area of study plot
New land-use of study plot

22
Figure 3-1-3: Flow diagram of data acquisition required to calculate the GHG emission related to land-use and crop management of biomass feedstock materials.
Although a laborious process, the GHG inventory related to agricultural activities
beginning with land preparation such as Land Use and Land-Use Change (LULUC)
has been viewed as a significant contribution to GHG emission in the cultivation of
biomass feedstock material. Its’ inclusion in the GHG-LCI of bioenergy is necessary to
ensure the carbon footprint values calculated according to this guideline is considered
credible. Figure 3-1-3 summarises the steps for estimating the GHG emission for
production of biomass feedstock.
In completing the LCI for agriculture stage, emissions related to the production of
materials, chemicals, conventional fuels and other manufactures, including fuel for
transportation are included, as is normally calculated in the LCA methodology.
Change in carbon stock/ carbon pool due
to land-use change, land fertilization,
residue degradation and soil emission
Conversion of change in carbon stock to CO2
Determine time frame needed to recover carbon loss
GHG emission/ha attributed to
gate-to-gate activities at agriculture stage

23
(ⅱ) Processing, Conversion, Transformation and Utilisation Stages
The GHG emissions from the production processes generally differ by technologies,
efficiencies and management practices. Direct measurements for input and output
data are more readily available and less complex than the agriculture stage.
Irrespective of the technologies and processes, GHG inventory:
o Resource consumption: fossil fuels, minerals, water, chemicals
o Electricity consumption
o Air pollution (including GHGs) emissions
o Wastewater discharge
o Solid waste generation
Within this product system is the emission from transportation and distribution.
Emission from open ponding treatment system may require more tedious
measurement to obtain average data. In general, an appropriately structured
questionnaire will guide collection of input and output data relevant to develop the LCI
of a type of bioenergy from agriculture to the biofuel production stage. The end-of-life
stage for biofuel is not included in the LCI as burning of biofuel whether for
transportation or power generation is considered CO2 neutral.
3.1.3 Recommendations
The drivers for the development of Biomass Utilisation as Bionergy in East Asia
have been energy security and development of a potential new economic sector. In
this respect, environmental criteria of biomass derived fuel has not been emphasised
greatly unless required by the export market. Environmental aspects should be given
due attention with the rapid expansion of bioenergy, in particular life cycle GHG
profile or carbon footprint.
Eight recommendations are forwarded as a result of the ERIA sponsored project on
“Investigation on Guidelines for Life Cycle Green House Gas Calculation in the
Utilisation of Biomass for Bioenergy”.
24
(ⅰ) LCA is a relevant tool to develop the GHG profile or carbon footprint of bioenergy
LCA is one of the relevant methodologies, which can assist policy makers to
establish the significance of environmental issues in relation to economical and social
factors. The cradle to grave approach incorporates contributions from every source in
the bioenergy pathway including emissions from the use of fossil fuels at some stages
of the life cycle and also land-use change.
Although the full LCA methodology is not needed since the LCI phase is sufficient
to quantify the GHG profile of bioenergy, it is recommended that the implementation of
the LCI phase be carried out in accordance with ISO 14040 and ISO 14044 as far as is
practicable. Justification should be given for deviation from the standard
recommendation.
(ⅱ) Issues on land-use
It is recommended that the six land-use categories introduced by IPCC be adopted
by all member countries namely forest land, cropland, grassland, wetland, settlement
and other land. This adoption is required to enable comparison of GHG profile of
bioenergy from land-use change perspective. However it is pertinent that East Asia
establish data on the type of land-use prevalent in the region, including land-use
change such as logged over and secondary forest that are being converted to cropland.
In spite of the high uncertainty associated with the IPCC emission factors, they will
still be used until regional or local data are obtained scientifically.
(ⅲ) Indirect Land-Use Change
There are increasing pressures from some legislative framework, especially from
EU to consider indirect land-use change when computing the GHG profile of a
bioenergy. Direct land-use change occurs as part of a specific supply chain while
‘indirect’ land use change is a consequence of market forces. Proposed methodologies
that quantify GHG emission related to indirect land-use change modify the
25
conventional LCA technique and contain attributes that are more policy-based than
science-based. The approach does not fall under the LCA methodology prescribed by
the ISO standard and should not be included in the life cycle inventory.
(ⅳ) Peatland Management
In recent years, land-use change for conversion of peatland into cropland such as
oil palm plantation has been hotly debated in particular on the potential magnitude of
GHG emission. While there is little agreement on emission rate of GHG from
converted peatland due to limited measured data, it is accepted that drainage of
peatland for agriculture purpose does potentially reduce a carbon reservoir. In view of
the existence of substantial areas of peatland in some parts of East Asia, it is
recommended that any effort to increase understanding of the CO2 flux of peatland
should be highly supported.
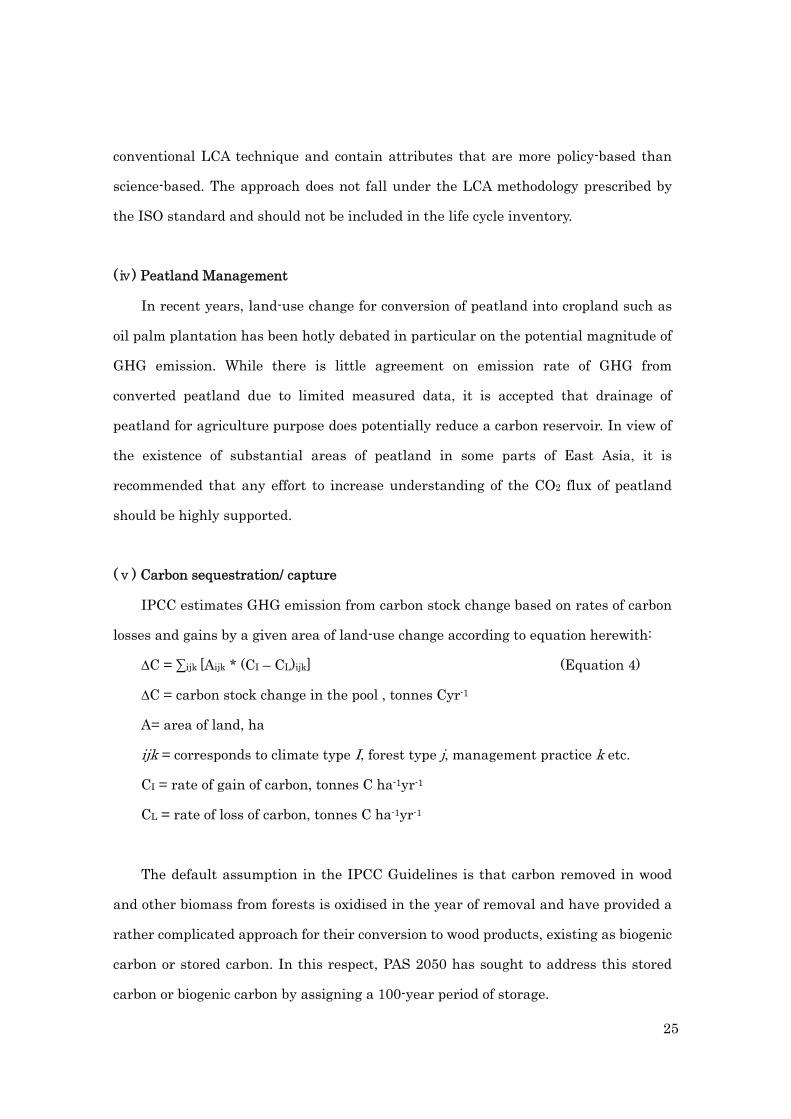
(ⅴ) Carbon sequestration/ capture
IPCC estimates GHG emission from carbon stock change based on rates of carbon
losses and gains by a given area of land-use change according to equation herewith:
∆C = ∑ijk [Aijk * (CI – CL)ijk] (Equation 4)
∆C = carbon stock change in the pool , tonnes Cyr-1
A= area of land, ha
ijk = corresponds to climate type I, forest type j, management practice k etc.
CI = rate of gain of carbon, tonnes C ha-1yr-1
CL = rate of loss of carbon, tonnes C ha-1yr-1
The default assumption in the IPCC Guidelines is that carbon removed in wood
and other biomass from forests is oxidised in the year of removal and have provided a
rather complicated approach for their conversion to wood products, existing as biogenic
carbon or stored carbon. In this respect, PAS 2050 has sought to address this stored
carbon or biogenic carbon by assigning a 100-year period of storage.

26
Since carbon capture or sequestration has a significant impact on the life cycle
footprint of biomass derived energy, it is important that this carbon removal cycle at
the feedstock supply stage be studied and any principles to be proposed must represent
the East Asian region. The importance of biogenic carbon introduced by PAS 2050 is
relevant to the development of the GHG estimation system for East Asia especially
felled biomass that are not used as fuel but transformed into panels and furniture.
(ⅵ) Reference data/ values at regional level
Development of a regional database on LCI data for bioenergy would assist the
carbon footprinting of bioenergy. For example the European Reference Life Cycle10
Database (ELCD) has under its Energy section data sets on electricity, fuels, thermal
energy and pressurised air that can be used quite appropriately for anyone doing LCA
within the EU region.
Similarly developing and transition countries of East Asia would require
background data and conversion factors to enable them estimate life cycle data of GHG
emission or release. The data sharing will also enable some form of standardisation
among the 16 countries such as terminologies, methodologies, cut-off criteria, time
frame (including for annualising) and fundamentals such as form of reporting,
functional units, allocation principles, carbon offsets and capture.
(ⅶ) Tier Approach to Data Collection
It is proposed that data collection follow the IPCC three methodological tiers for
estimating GHG emissions and removals by each contributing source. Tiers correspond
to a progression from the use of simple equations with default data to country-specific
data in more complex national systems. The three general tiers are briefly described in
Table 3-1-2.
10 M.A.Wolf et.al., Meeting Among Int. Partners on The International Reference Life Cycle
Data System, Nov. 2008, JRC European Commission

27
Table 3-1-2: Summary of the Three Tier Levels for Estimation of GHG Emissions for Landuse Change11
Tier 1 o Applies equation 3 for changes in two carbon pools namely
‘aboveground biomass’ and carbon in the top 0.3 m of the soil
o Carbon accounting required only for wood harvested as biofuels for
estimating non-CO2 gases.
o Use default emission factors provided by IPCC (until East Asia
values are established).
o Use activity data that are spatially coarse, such as nationally or
globally available estimates of deforestation rates, agricultural
production statistics, and global land cover maps.
Tier 2 Same methodological approach as Tier 1 but applies emission factors and
activity data that are country-specific including specialised land-use
categories.
Tier 3 Higher order methods are used including models and inventory
measurement systems tailored to address national circumstances, i.e.
detailed country-specific data. Provides estimates of greater certainty
than tiers 1 and 2.
(ⅷ) Reporting vs Targets-Setting
The GHG profile that is eventually calculated should not include offsets for fossil
fuels replacement nor report in terms of carbon payback period. Comparative
performance based on the GHG profiles of different bioenergy is one of the approaches
to encourage improvement of production of feedstock materials, e.g. improved
plantation management practices, and improved processing technologies that will
reduce use of fossil fuel through energy efficiencies and waste minimisation, including
utilisation of process wastes.
For comparative performance, a number of functional units such as kg CO2/MJ of
the fuel should be made available for objective evaluation among different forms of
bioenergies and their production methods.
11 IPCC Good Practice Guidance for Land Use and Land-use Change and Forestry

28
3.2 ECONOMIC IMPACT - Methodologies Used in the Calculation of Indices for Economic Assessment -
3.2.1 Introduction
Economic sustainability of biomass utilisation relates to the exploitation of
biomass resources in a manner by which the benefits derived by the present generation
are ascertained without depriving such opportunity to the future generation. In the
assessment of sustainability, it is equally important to determine the actual level and
degree of the economic benefits brought about by the biomass industry. Specific
economic indices would have to be taken into consideration to measure the scope of the
benefits. Existing methodologies in quantifying such indicators would have to be
adopted and evaluated as well. Economic indicators ultimately provide for an accurate
measurement of the economic performance of a particular industry such as biomass.
Previous studies have identified a number of benefits arising from biomass
production and processing. For instance, a number of studies have described and
estimated these impacts as follows. An article published at the Geo-energy website
dated 2005 mentioned that the U.S. geothermal industry supported some 11,460 full
time jobs in 2004. Tax revenues from geothermal activities amounted to $12 million
supplying 25% of the tax base for a rural town in California. Other economic
contributions mentioned in the article were reduction in foreign oil imports, price
stability, and fuel supply diversification. The American Solar Energy Society cited
that renewable energy and energy efficiency industries created a total of 8.5 million
jobs in 2006 throughout the United States. A case study in Columbia County accounted
for 170 full time jobs during construction and 39 full time permanent operations jobs
generated by the existing wind facilities. Additionally, wind facilities contributed $1.3
million in annual tax revenues. In 2008, an article about the benefits of landfill gas
energy stated that cost savings which can be translated to millions of dollar savings

29
could be realized through the replacement of expensive fossil fuels by landfill gas use.
In an article entitled “Rural communities can gain big economic benefits from wind
energy” in 2001, it was pointed out that wind farms on rural land can earn more money
per acre for farmers and ranchers than many traditional agricultural activities.
Based on the various literature reviewed, the most common economic
contributions of biomass utilisation are value addition, job creation, tax revenue
generation, and foreign trade impacts. The same indicators were taken into
consideration in establishing the guidelines in economic impact assessment specifically
for this study.
3.2.2 Economic Assessment of Biomass Utilisation
(ⅰ) Gross Value Added or Total Profit before Taxes
Value addition refers to the increase in worth of a biomass product in terms of
profit by undergoing certain processes or conversion to come up with a marketable
energy product. Gross value added, as used in this study, is the sum of the value
addition or net profit before tax generated out of the main product and the by-products
from conversion or processing. The following equation was adopted to compute value
addition:
GVA = VAa + VAb; where,
VAa – value added from main product
VAb – value added from by-products
The value added for both the main products and the by-products can be computed
using the following equation:
VAa = GRa – TCa; and,
VAb = GRb – TCb; where,
GR – Gross or Total Revenue
TC – Total Cost
a – Main Product
30
b – By-products
Quantifying gross revenue was relatively easier as compared to quantifying the
total cost. Gross revenue is simply the product of price and quantity (applies to both
main product and by-products). Total cost, on the other hand, was calculated in every
stage of the conversion process – from the initial up to the final product. This can be
better illustrated by dividing the cost calculation into three stages. First stage is
regarded as the Production stage. This stage accounts for the costs incurred in the
actual production process of the raw material or initial product. The costs associated
in this stage can be collectively described as the farming costs. The formula adopted
is as follows:
TC = Direct Costs + Indirect Costs; where,
Direct Costs – Planting material, fertilizer, direct labor (hauling,
transplanting, weeding, fertilizing, and other maintenance operations)
Indirect/Other Costs – Land preparation, harvesting, transportation
The second stage can be termed as Primary Processing. In this stage, the raw
material or initial product undergoes processing up to the point in which the output is
already a convertible material for biodiesel production. The costs associated in this
stage can be distinguished as the extraction costs. The following equation was used for
calculation:
TC = Direct Costs + Indirect Costs; where,
Direct Costs – Costs of raw material, direct labor
Indirect/Other Costs – Administrative costs, utilities such as electricity and
water, miscellaneous overhead such as helper, fuel, fees and local taxes and
loan interest, selling cost such as depreciation of fixed assets, and trucking
The third stage is Secondary Processing. From the readily convertible material in
the second stage of production, certain processes such as esterification are undertaken
to produce the final product which is biodiesel. The costs associated in this stage can be
referred to as the biodiesel production costs. Total cost was computed as follows:
TC = Direct Costs + Indirect Costs; where,
31
Direct Costs – Raw material costs, Direct operating labor
Indirect/Other Costs – Plant maintenance and repair, operating supplies,
utilities, fixed charges such as depreciation, property taxes and insurance,
and plant overhead costs
(ⅱ) Employment
Job creation is another indicator for assessing the economic impact of the biomass
industry. In a study concerning the sustainability criteria and indicators for bioenergy,
it was cited that one of the possible indicators for job creation is the number of jobs or
position per unit of energy produced throughout the entire chain of production. The
same concept was adopted by this study in determining the employment impact of the
biomass industry. The number of jobs generated with the presence of the energy
project was computed as follows:
Employment = Total Production x Labor Requirement for every unit produced
In most cases, labor requirement is expressed in terms of mandays. As such,
necessary conversion may be done to express mandays into number of persons hired.
The resulting figure is a more concrete representation or estimation of the employment
impact.
(ⅲ) Tax Revenues
Government revenues in terms of taxes collected from the different key players of
the biomass industry prove to be another economic benefit worthy of valuation. For
instance, take into account the coconut industry of the Philippines as the biomass
industry under consideration. Mature coconut (Production stage) is processed into
copra. Copra is then processed into coconut oil (Primary Processing). Finally, coconut
oil is processed into the final product – coconut methyl ester (Secondary Processing).
Taxable sectors of the industry may include the farmers and the various sectors in the
production chain. However, under the Philippine agrarian reform program, farmers
are exempted from paying taxes. Therefore, tax-generating sectors include those

32
players under the primary and secondary processing stages only. The total taxable
income under these stages of production shall be multiplied by the prevailing tax rate
to obtain the actual amount of tax revenues. This can be further illustrated by the
following equation:
Tax = Total Taxable Income x Tax Rate; where,
Total Taxable Income = income from main product (profit per unit x volume)
+ income from by-product (profit per unit x volume)
(ⅳ) Foreign Exchange
Biomass production and processing has positive effects on foreign trade which is
determined by two factors, foreign exchange earnings and foreign exchange savings.
Foreign exchange earnings arise from the gains of exporting the readily convertible
material for biodiesel production. As in the Philippines, the exportable input to
biodiesel production is coconut oil. Even before the advent of the biofuel industry, the
country is already benefiting from coconut oil exports – one of its major dollar earners.
This could likewise be the case for other countries producing biodiesel such rapeseed
oil, palm oil, and others.
Foreign exchange savings can be accumulated from reduced diesel imports with
the presence of the energy project. Since biodiesel is expected to at least displace if
not replace a fraction of the overall diesel consumption of an economy, eventually
imports will decrease. For both foreign exchange earnings and savings, the methods of
computation are as follows:
Foreign Exchange Earnings = Price per unit of convertible material x Total
volume of exports
Foreign Exchange Savings = Amount (in weight) of biomass x Density of
biomass x Forex savings per diesel displacement
In the event that portions of the convertible material are both exported and
consumed locally for biodiesel production, a tradeoff occurs. A fraction of the exportable
amount would be diverted as input to biodiesel production. As a result, foreign
33
exchange earnings would be reduced. The net effect of this tradeoff or net foreign
exchange (Forex) earnings is valuated as follows:
Net Foreign Exchange Earnings = Reduced Forex Earnings + Forex Savings
(ⅴ) Total Value Added to the Economy
Total value added to the economy refers to the total contribution of the biomass
industry to the economy in terms of net profit after tax of stakeholders in the
production and processing of biomass; total employment cost or wages and salaries
paid to the employees in the biomass industry; tax revenues collected from the
different key players of the biomass industry; foreign exchange earnings from
exporting the readily convertible material for biodiesel production and foreign
exchange savings from reduced diesel imports with the presence of the biomass energy
project. The formula is:
Total value added to the economy = net profit after tax + wages and salaries paid
+ tax revenues + net forex earnings
where net profit after tax is equal to net profit before tax less tax revenues. The
formula can be written as:
Total value added to the economy = net profit before tax + wages and salaries
paid + net forex earnings
The economic indices, along with the methods of computation enumerated in this
section, serve as guidelines in assessing the benefits brought about by biomass
production and processing. This study aims to quantify the level and degree of the
economic benefits by imputing actual values to provide a concrete overview of such
benefits. Consequently, policymakers could have a grasp as to what aspects of the
biomass industry are to be addressed in accordance with the purpose of boosting the
national economy. A more important case in point is that biomass utilisation practices
must gear toward achieving economic sustainability.

34
REFERENCES
ABLES, R. 2006. CME biodiesel or coco-biodiesel. Philippine Coconut Authority
(PCA) Report.
BANZON, J.A. and J. R. VELASCO, Coconut: Production and Utilization, 1982
COCONUT INDUSTRY KIT. 2005.
DOE (Department of Energy) Philippine Energy Plan 2005-2014 (2006 Update)
ELAURIA, J.C., M.L.Y. CASTRO, M.M. ELAURIA, S.C. BHATTACHARYA and P.
ABDUL SALAM. Assessment of Sustainable Energy Potential of
Non-Plantation Biomass Resources in the Philippines. Volume 29. September
2005. pp. 191-198.
Lower snake river wind energy project. www.snakeriverwind.com/LSRW_031109.html.
March 11, 2009.
LOZADA, E. 2002. RDE investments in the processing sector. Coconut Investment
Plan 2002.
MAGAT, S. 2007. Coconut-cereal (corn) cropping model: Technology notes. Quezon
City: Agricultural Research Management Department, Philippine Coconut
Authority.
MAKARYAN, R. Defining community and economic benefits associated with large
energy infrastructure projects: LNG Case Study. April 27, 2009.
NSCB (National Statistical Coordination Board). 2007. Regional Statistics.
PARSONS, L. Funding for clean energy projects. www.eesi.org/121708_stimulus.
December 17, 2008.
PCA REGION IV-A. Magnitude of the industry: CALABARZON region. Retrieved
September 13, 2007 from PCA Region IV on-line database on the World Wide
Web: http://www.pcaagribiz.da.gov.ph/r4a/
PIMO(Provincial Information Management Office). 2006. Agriculture. Retrieved
September 11, 2007 from Quezon Provincial Government on-line database on
the World Wide Web: http://www.quezon.gov.ph/profile/agriculture

35
PUNCHIHEWA P. and R. ARANCON. 1996. Asian and Pacific Coconut Community
(APCC) paper.
QUICOY, C., M. ELAURIA, and C. MAMARIL. 2004. Economic analysis of CME as a
fuel additive for diesel engine. Department of Agricultural Economics, CEM,
UPLB.
RDEB-PCA (Research, Development and Extension Branch – Philippine Coconut
Authority). 2000.
ROSS, J. Benefits of wind energy are mapped out. www.geni.org/globalenergy. January
31, 2009.
SPIK (Samahan sa Pilipinas ng mga Industriyang Kimika). 2003. Oleochemicals
industry. Retrieved September 24, 2007 from SPIK on-line database on the
World Wide Web: http://www.spik-ph.org/basic_oleochem.html
The British Wind Energy Association. Benefits of wind energy. BWEA Briefing Sheets.
July 2004.
The Coconut Committee. 1992. The Philippines recommends for coconut. Los Baños,
Laguna: PCARRD, PARRFI, and PCRDF 1993. 234 p. (Philippines
Recommends Serires No. 2-B/1993).
The Economic impact of Calpine’s Geothermal Development Projects, Siskiyou County.
www.geo-energy.org/aboutGE/economicBenefits. Aug 31, 2005.
U.S. ENVIRONMENTAL PROTECTION AGENCY. Benefits of LFG energy.
www.epa.gov/lmop/benefits.htm. May 22, 2008.
WILLIAMS, S. K., M. Goldberg and M. Greve. Estimating the economic benefits of
wind energy projects using Monte Carlo simulation with economic input/output
analysis. Wind Energy, Vol. 11, pp.397-414. March 2008.
WORLD AGROFORESTRY CENTER. Marketing of coconut in Quezon province,
Philippines. Date not given.

36
3.3 SOCIAL IMPACT
3.3.1 Introduction
Social issues in the growing markets for bioenergy are expected to become
prominent as the producers and consumers of bioenergy may belong to different
countries. Major social benefits of bioenergy include greater energy security,
employment opportunities and improved health from reduced air pollution. On the
other hand, possible negative social impacts of bioenergy, such as the food insecurity,
need to be considered seriously. While there could be some relief on energy front, the
food insecurity and food prices, particularly in developing economies, may aggravate the
negative social impact on people.
Measurement of social development significantly differs from economic
development. Also, compared to social indicators, a plenty of economic indicators are
more frequently available for all countries. But in many cases, particularly in case of
some developing economies, they reflect a rosy picture which is far away from the
reality. For example, looking at the GDP growth rate, India is one of the fastest
growing country in the world, but country’s social devlopment indicators fall way
behind even many small economies. To capture the holistic picture of development
across countries, the UNDP has used the Human Development Index (HDI). This
essentally take into account the measures for Per Capita Income, Life Expectancy and
Literacy. However, it is to be noted that while development of these indices using
UNDP system is well defined and uniformly applied to all countries, some of the
factors, which could be either region specific for East Asia or country specific for any
country within this region need to be considered differently. Further, development of
bioenergy has different factors, such as technical, social, economic and policy, for
various regions. Hence, using the same yard-stick for assessing the sustainability of
bioenergy for all regions of the world may be incorrect.
37
This section focuses on methodology for estimating social impacts of biomass
utilisation for energy production. Taking a case study of biodiesel production from
jatropha plantation in India, estimation of social development indicators (SDIs) are
made. The methodology suggested here could be helpful in developing guidelines for
sustainability of biomass energy in the East Asia region.
3.3.2 HDI and Social Development
As per the UNDP system, the main indicator of social development is Human
Development Indicator (HDI), which essentially measures three social factors, namely,
life expectancy at birth, as an index of population, health and longevity; adult literacy
rate (with two-thirds weighting) and the combined primary, secondary, and tertiary
gross enrolment ratio (with one-third weighting); and the gross domestic product
(GDP) per capita at purchasing power parity (PPP) in US dollars. These three factors,
expressed as respective three sub-indices in HDI. Since values measuring these social
factors have different units, it is necessary to standardise them which allows them to
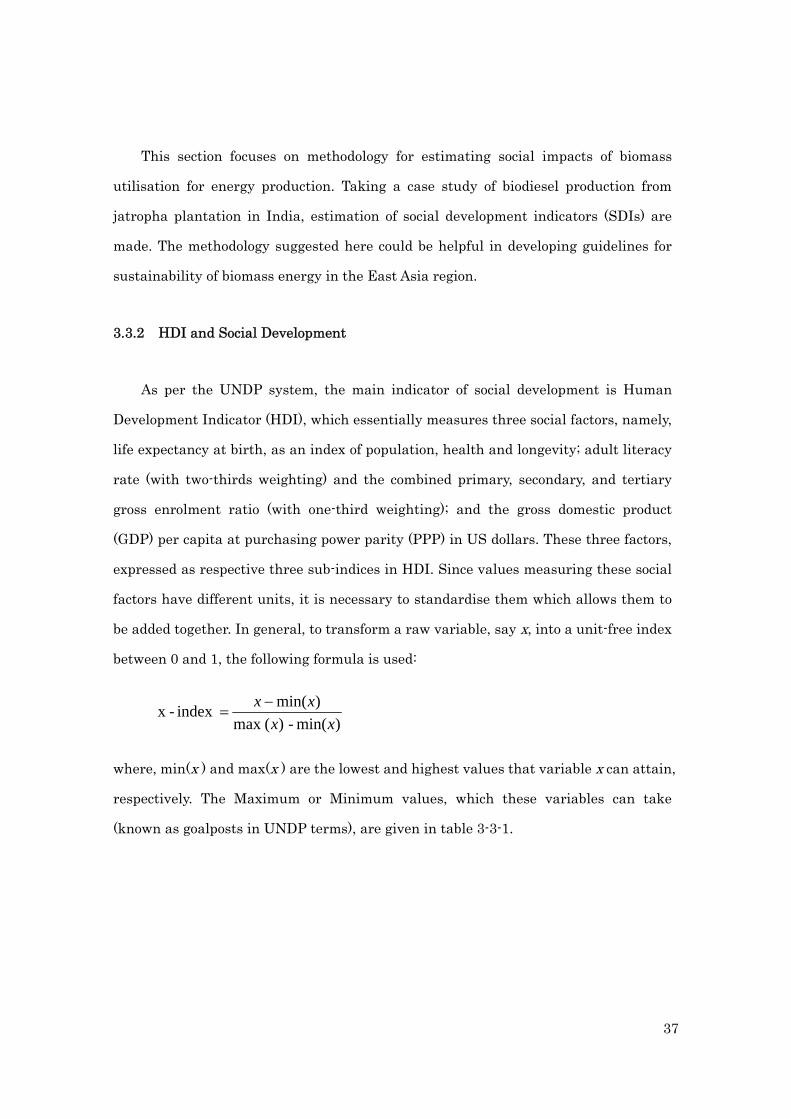
be added together. In general, to transform a raw variable, say x, into a unit-free index
between 0 and 1, the following formula is used:
)min(-)(max
)min( index -x
xx
xx
where, min(x ) and max(x ) are the lowest and highest values that variable x can attain,
respectively. The Maximum or Minimum values, which these variables can take
(known as goalposts in UNDP terms), are given in table 3-3-1.
38
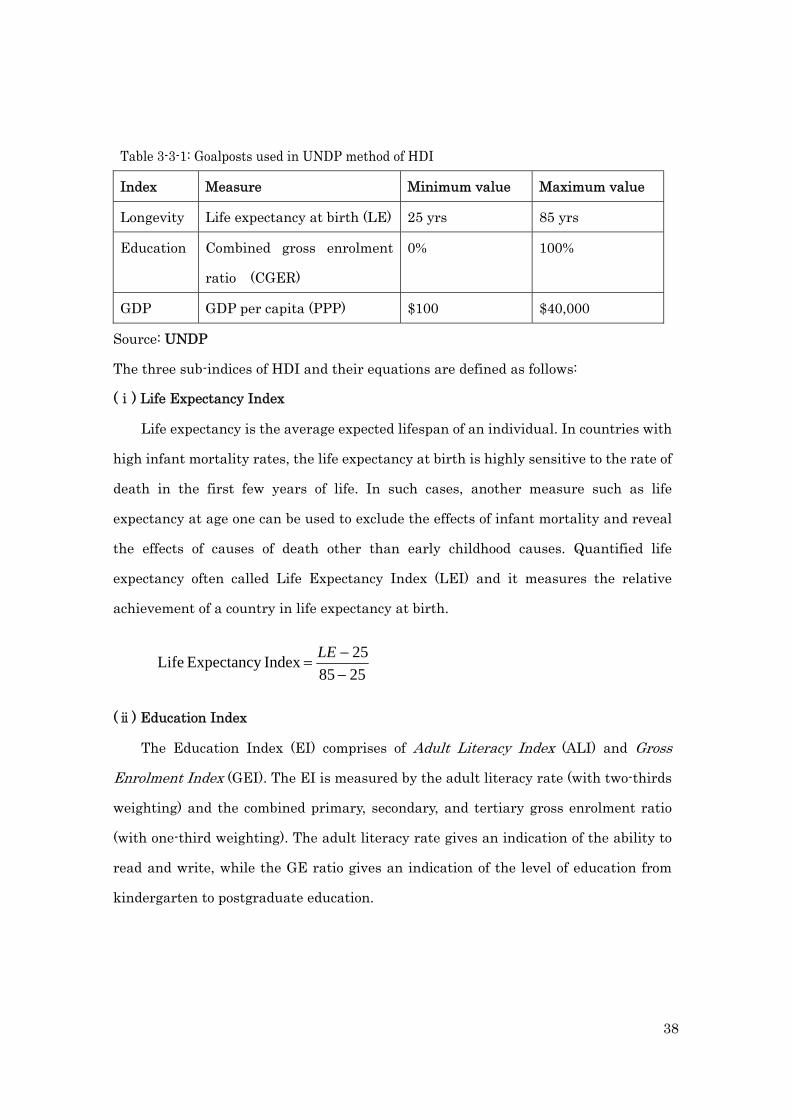
Table 3-3-1: Goalposts used in UNDP method of HDI
Index Measure Minimum value Maximum value
Longevity Life expectancy at birth (LE) 25 yrs 85 yrs
Education Combined gross enrolment
ratio (CGER)
0% 100%
GDP GDP per capita (PPP) $100 $40,000
Source: UNDP
The three sub-indices of HDI and their equations are defined as follows:
(ⅰ) Life Expectancy Index
Life expectancy is the average expected lifespan of an individual. In countries with
high infant mortality rates, the life expectancy at birth is highly sensitive to the rate of
death in the first few years of life. In such cases, another measure such as life
expectancy at age one can be used to exclude the effects of infant mortality and reveal
the effects of causes of death other than early childhood causes. Quantified life
expectancy often called Life Expectancy Index (LEI) and it measures the relative
achievement of a country in life expectancy at birth.
2585
25 Index Expectancy Life
LE
(ⅱ) Education Index
The Education Index (EI) comprises of Adult Literacy Index (ALI) and Gross
Enrolment Index (GEI). The EI is measured by the adult literacy rate (with two-thirds
weighting) and the combined primary, secondary, and tertiary gross enrolment ratio
(with one-third weighting). The adult literacy rate gives an indication of the ability to
read and write, while the GE ratio gives an indication of the level of education from
kindergarten to postgraduate education.
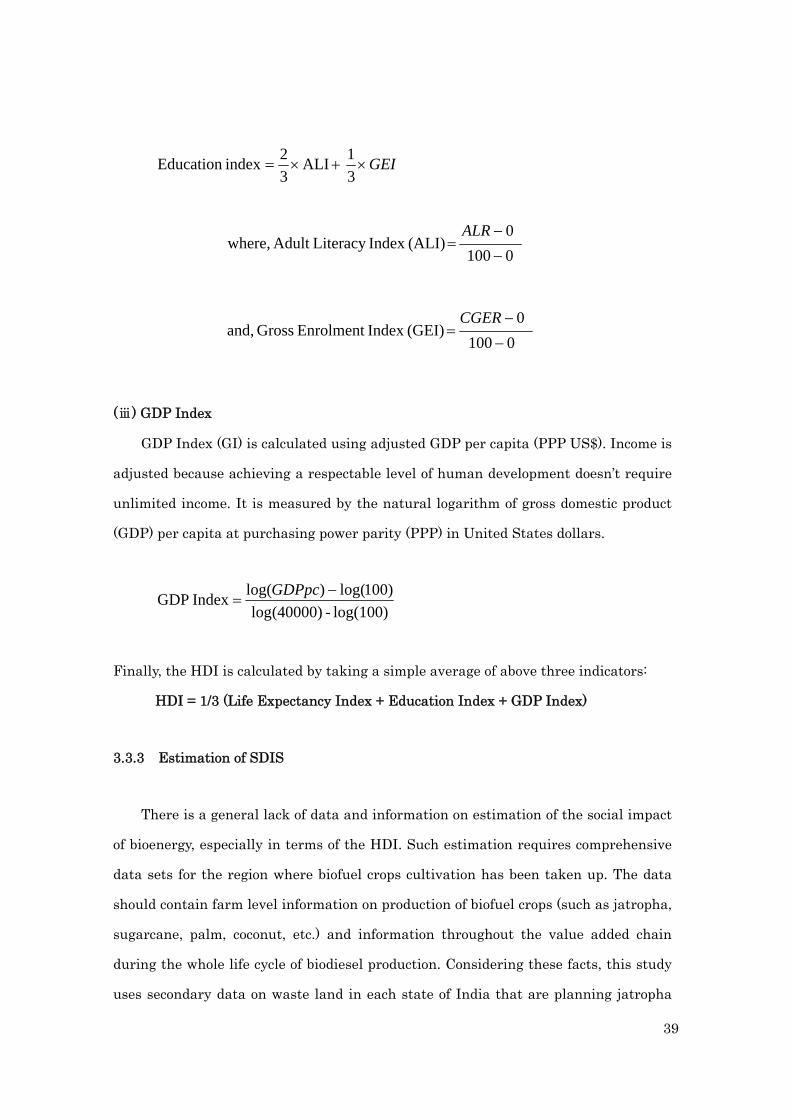
39
ALI3
2indexEducation GEI
3
1
0100
0 (ALI)Index Literacy Adult where,
ALR
0100
0 (GEI)Index Enrolment Gross and,
CGER
(ⅲ) GDP Index
GDP Index (GI) is calculated using adjusted GDP per capita (PPP US$). Income is
adjusted because achieving a respectable level of human development doesn’t require
unlimited income. It is measured by the natural logarithm of gross domestic product
(GDP) per capita at purchasing power parity (PPP) in United States dollars.
log(100)-(40000)log
)100log()log( Index GDP
GDPpc
Finally, the HDI is calculated by taking a simple average of above three indicators:
HDI = 1/3 (Life Expectancy Index + Education Index + GDP Index)
3.3.3 Estimation of SDIS
There is a general lack of data and information on estimation of the social impact
of bioenergy, especially in terms of the HDI. Such estimation requires comprehensive
data sets for the region where biofuel crops cultivation has been taken up. The data
should contain farm level information on production of biofuel crops (such as jatropha,
sugarcane, palm, coconut, etc.) and information throughout the value added chain
during the whole life cycle of biodiesel production. Considering these facts, this study
uses secondary data on waste land in each state of India that are planning jatropha

40
cultivation and which are potentially fit for this biofuel crop. Two micro level data sets
have been used to calculate the values of HDI and project them to national level.
3.3.4 Data and Assumptions
Some of the points about the data used for estimation of SDIs and assumptions
made are as follows.
Secondary data give information about the planned cultivation of jatropha or
planned production of biodiesel. But in order to calculate the exact impact, the
actual data on area under jatropha cultivation and biodiesel production should
be considered rather than projected.
Selection of control group is really difficult, as we need to consider two areas
which have same climatic condition, same socio-economic structure and above
all successful implementation of jatropha cultivation. This is only possible by
conducting a primary pilot survey in such areas.
For calculating the social impact of jatropha cultivation, the data are available
for income generation only. But subsequent relationship between income and
life expectancy/education is required, which is not available at micro level.
However, this information is available at macro level, which has been used for
micro level estimations.
For calculating gender-related development index, data about political and
social status of women is required. There is no data available that can give
political or social status of women with jatropha intervention.
3.3.5 Methodology for Estimation
Considering the above limitations of data, social development indicators (HDI and
GDI) at micro (district level) and macro (state level) are calculated, which could also be
used to project SDIs at India level. In this study a “bottom-up approach” has been

41
followed to estimate the effective social returns on bioenergy production. Two potential
districts are identified in India, namely, Adilabad in the state of Andhra Pradesh and
Ahmednagar in the state of Maharashtra. The statistics of Jatropha cultivation in
these districts is given in the Appendix 1 (Table A). The steps (1 to 8) used to calculate
the SDIs at micro and additional steps (9 to 10) are used to project SDIs at macro level
are mentioned below.
Step 1: Calculation of direct employment from jatropha cultivation.
The direct employment for any district say, A, includes persons employed in site
preparation, jatropha plantation and post plantation work. For this district
employment in person days per hectare is calculated for consecutive 5 years.
Step 2: Calculation of indirect employment from jatropha cultivation and biodiesel
production.
This includes employment in post harvest activities such as seed collection, oil
extraction, transportation and other related activities. It is also calculated in person
days per hectare of jatropha crop.
Step 3: Aggregating the cost of direct and indirect employment.
This is done by taking minimum wage determined by International Labour
Organization (ILO) and area concerned and summing the cost of steps 1 and 2. This
gives us total cost per hectare of jatropha cultivation and total cost per ton of biodiesel
production. The conversion factors used here is that “1 hectare of jatropha cultivation
produces 1892 litre of biodiesel and 1 ton of biodiesel = 1267 litre.” For calculating cost
per ton of biodiesel production, the same 5 years’ term is taken for cost calculation as in
the case of calculating cost per hectare of jatropha cultivation. The calculations of
employment in terms of cost and person days are shown in Appendix 1 (Table B).
Step 4: Calculation of GDP (PPP) per capita
For calculating GDP (PPP) per capita, data from step 3 (say, Rs. X / ha of jatropha) or
(Rs. Y / ton of biodiesel) are used to calculate total income generated from Z ha of land.
Therefore, Rs.(XZ) or Rs.(YZ) is divided by total population of the area plus actual GDP
of place which gives GDP (PPP) per capita. It can be suitably converted into US dollars
42
($) to ease the calculation of HDI.
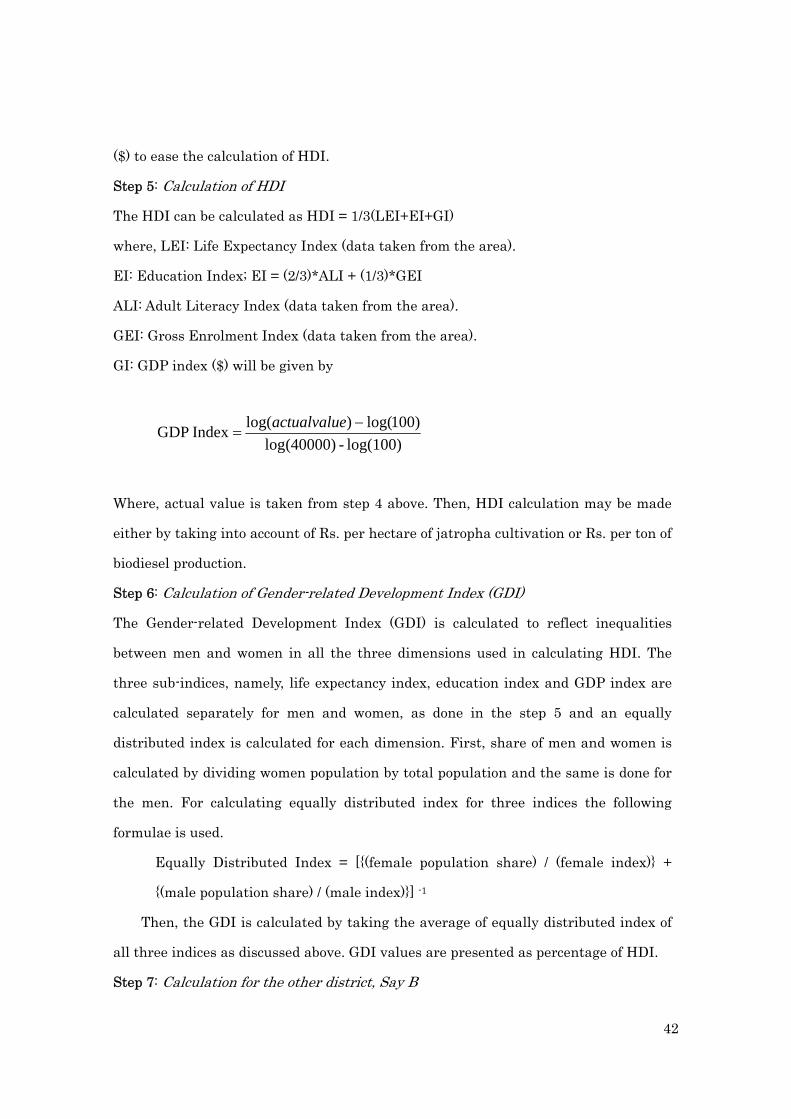
Step 5: Calculation of HDI
The HDI can be calculated as HDI = 1/3(LEI+EI+GI)
where, LEI: Life Expectancy Index (data taken from the area).
EI: Education Index; EI = (2/3)*ALI + (1/3)*GEI
ALI: Adult Literacy Index (data taken from the area).
GEI: Gross Enrolment Index (data taken from the area).
GI: GDP index ($) will be given by
log(100)-(40000)log
)100log()log( Index GDP
eactualvalu
Where, actual value is taken from step 4 above. Then, HDI calculation may be made
either by taking into account of Rs. per hectare of jatropha cultivation or Rs. per ton of
biodiesel production.
Step 6: Calculation of Gender-related Development Index (GDI)
The Gender-related Development Index (GDI) is calculated to reflect inequalities
between men and women in all the three dimensions used in calculating HDI. The
three sub-indices, namely, life expectancy index, education index and GDP index are
calculated separately for men and women, as done in the step 5 and an equally
distributed index is calculated for each dimension. First, share of men and women is
calculated by dividing women population by total population and the same is done for
the men. For calculating equally distributed index for three indices the following
formulae is used.
Equally Distributed Index = [{(female population share) / (female index)} +
{(male population share) / (male index)}] -1
Then, the GDI is calculated by taking the average of equally distributed index of
all three indices as discussed above. GDI values are presented as percentage of HDI.
Step 7: Calculation for the other district, Say B
43
Step 1 to 6 is repeated for the other district.
Step 8: Calculation of change in HDI
Average of HDI for district A and district B gives the HDI that incorporates jatropha
cultivation. The change in HDI can be calculated by subtracting current HDI for India,
which is 0.609 (HDR, 2008).
Based on the above method, the change in HDI for per hectare of jatropha
cultivation and per ton of biodiesel production is given in the Appendix 1 (Tables C and
D).
Step 9: Projection of population (male and female)
The data on actual population for India are available only for 2001 (Census, 2001 data).
But other data such as cultivation area, literacy rate, etc. are available for the year
2008. This required population projection for the year 2008 assuming a constant
exponential growth rate. Same process is repeated for male and female population
taking growth rate constant. Then, the share of male and female population is
calculated.
Step 10: Calculation of HDI and GDI for jatropha cultivation and biodiesel production.
For macro (state) level calculations the same method is followed as discussed for the
micro (district) level. HDI and GDI for jatropha cultivation and biodiesel production
were calculated separately.
Finally, overall HDI is calculated by taking average of all states and union
territories, and then to find change in HDI = 0.609 (value of HDI for India in 2008) is
subtracted from the given value. This gives changes in HDI due to jatropha
intervention.
The values of HDI for various states, both in terms of jatropha cultivation and
biodiesel production, and the values of GDI are given in the Appendix 1 (Table E).
3.3.6 Summary of Results
This section suggests guidelines for estimating Indicators of Social Impact of
44
Biomass Utilisation in East Asia. A method of calculating the change in SDIs, due to
bioenergy production in India, is mentioned that may be useful for developing
guidelines for the East Asian region. In biodiesel production, plantation of jatropha
will be the most dominant item of expenditure. It is estimated that an employment of
123 person days per hectare of jatropha plantation in the first year and 322 person
days in five years will be generated.
To calculate the change in SDIs, both micro (district) and macro (state) level cases
are considered. The case study of Adilabad district of Andhra Pradesh indicates that
overall monetary gains, due to employment generation, for the region will be
Rs.4221360. The GDP (PPP) per capita with the jatropha intervention and other
existing factors gives a value of Rs.21224. This gives a GDP index of 0.420 and fitting
the data of life expectancy and education gives a HDI value of 0.647. Thus, the change
in HDI is 0.038 (0.647-0.609), where, 0.609 is the value of HDI for India in 2006, as per
UNDP estimates. Similarly, the change in HDI when biodiesel production is taken into
account comes out to be 0.038. The GDI for Adilabad district is 0.518 in case of only
jatropha cultivation and 0.537 for biodiesel production, which is 80% and 82.9% of HDI,
respectively.
The case study of Ahmednagar district indicates a total monetary gain for the
region, due to the employment generation as Rs.23544562. The GDP (PPP) per capita,
with jatropha intervention and other existing factors gives a value of Rs.18054 and a
GDP index of 0.376. Fitting the data about life expectancy and education, the HDI for
Ahmednagar for jatropha cultivation only comes out to be 0.617. Hence, the change in
HDI is 0.008 (0.617-0.609). However, taking into account biodiesel production, HDI is
0.647, which is much higher than the results coming only from jatropha cultivation.
Ahmednagar GDI is 94.8 % of HDI when only jatropha cultivation is considered and it
is 92.8% of HDI taking into account of biodiesel production.
The aggregate HDI of states (macro level) due to Jatropha cultivation, considering
other development indicators constant, comes out to be 0.621. Therefore, the change in
HDI due to jatropha cultivation is (0.621-0.609=0.012). Similarly, when biodiesel
45
production is taken into consideration then the total HDI for India comes out to be
0.622, giving a positive deviation of (0.622-0.609=0.013). The GDI value for India is
projected as 0.571 which is 91.8 % of the HDI.
3.3.7 Conclusions
A case study of jatropha cultivation in two districts of India indicates that
geographical location and field conditions have tremendous effect on survival rates of
jatropha plants. Under adverse conditions, survival rate of jatropha plant are very low.
On the other hand, some other native oil trees such as Pongamia and Neem may hold
promises better. Estimations of HDI due to jatropha cultivation and biodiesel
production indicate that the HDI change in whole life cycle of biodiesel production is
higher than only in jatropha cultivation.
This study is based on secondary data and to calculate exact change in SDIs,
actual data at microscopic level (such as village) are needed. Hence, it is suggested that
in the next phase of the project a pilot study on “Estimation of Social impact of
Jatropha and other Oil Trees cultivation for Bio-diesel Production in India” is taken up.
The pilot study should focus on collecting data and information through survey of
various stakeholders involved during various stages of jatropha cultivation and
bio-diesel production. Data should be collected through a questionnaire administered
to various focus groups. A combination of interview techniques such as face-to-face
personal interview, discussion on telephone, correspondence through email, fax and
normal mail, etc. will be used for collecting the data and information. A draft of the
questionnaire on social issues proposed for the pilot study is given in Appendix [3].
46
REFERENCES
ADB (2007). Key Indicators 2007. Asian Development Bank, Manila, Philippines
BIS (2006-07): Annual Report of the Bureau of Indian Standards.
CEA (2006): Central Electricity Authority, New Delhi.
HDR, (2008): Human Development Report 2007-2008, United Nations Development
Programmes.
Hill J., Tilman, D., and C. Lehman. (2006): Carbon-Negative Biofuels from Low-
Input High-Diversity Grassland Biomass.Science 314 (5805): 1598-1600.
Keller, G., M. Mintz, C. Saricks, M. Wang, and H. Ng, (2007): Acceptance of
Biodiesel as a Clean-Burning Fuel: A Draft Report in Response to Section
1823 of the Energy Policy Act of 2005, Center for Transportation Research,
Argonne National Laboratory, prepared for Office of Freedom CAR and Vehicle
Technologies, U.S. Department of Energy, Oct.
MNRE (2007): Annual Report of Ministry of New and Renewable Energy, Govt. of
India, 2006-07.
MoEF (2008): Minsitry of Environment and Forest, Govt. of India, website
(www.envfor.nic.in).
National Biodiesel Board, 2007, FAQs: How Much Biodiesel Has Been Sold in the U.S.?
available at http://www.biodiesel.org/resources/faqs/, accessed Nov. 2007.
Planning Commission (2003): Report of the Committee on Development of Biofuel,
Planning Commission, GoI, New Delhi-110 001.
Sagisaka M. (2007) Editor: Report on “Sustainable Biomass Utilisation Vision in
East Asia” prepared for JETRO and ERIA.
UN-Energy (2007): A UN document on “Sustainable Bio-energy: A Framework for
Decision Makers.”
UNCTAD (2006): “An Assessment of the Biofuels Industry in India” prepared by
Joseph B. Gonsalves, consultant to United Nations Conference on Trade and
Development, Geneva, 2006.
UNDP (2008): Human Development Report 2007-08, United Nations Development
Programmes.
WEO (2006): World Energy Outlook, International Energy Agency.
WDR (2008): World Development Report 2008: Agriculture for Development, the World
Bank, Washington DC, USA.

47
Appendix 1: Calculations of HDI
Table A: Jatropha cultivation in Adilabad (AP) and Ahmednagar (MS)
Particulars Adilabad Ahmednagar
Sample Village (No) 7 10
Area Proposed (ha) 380.4 2025.6
Area Covered (ha) 312.0 1091.6
Jatropha sown (No.) 1358070 4960230
Plant density (per ha) 4353 4544
Survival (%) 2.19 2.96
Source: GFU, 2005
Table B: Employment from jatropha cultivation and Oil production
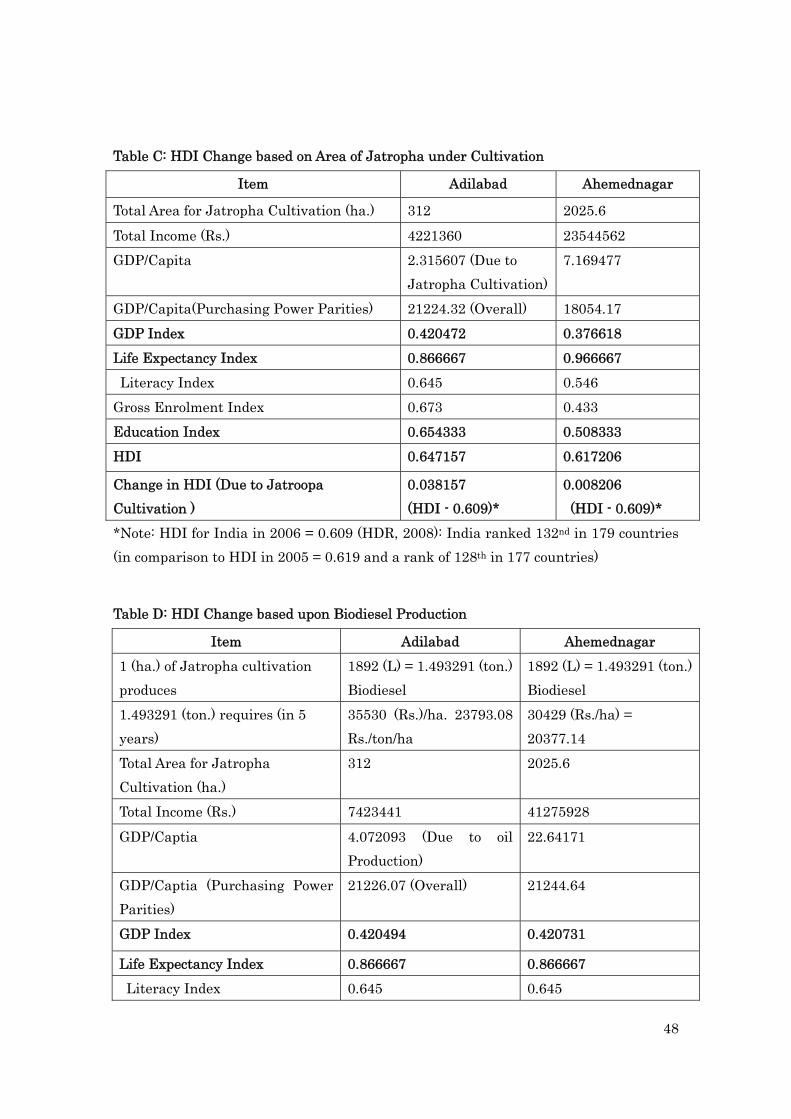
48
Table C: HDI Change based on Area of Jatropha under Cultivation
Item Adilabad Ahemednagar
Total Area for Jatropha Cultivation (ha.) 312 2025.6
Total Income (Rs.) 4221360 23544562
GDP/Capita 2.315607 (Due to
Jatropha Cultivation)
7.169477
GDP/Capita(Purchasing Power Parities) 21224.32 (Overall) 18054.17
GDP Index 0.420472 0.376618
Life Expectancy Index 0.866667 0.966667
Literacy Index 0.645 0.546
Gross Enrolment Index 0.673 0.433
Education Index 0.654333 0.508333
HDI 0.647157 0.617206
Change in HDI (Due to Jatroopa
Cultivation )
0.038157
(HDI - 0.609)*
0.008206
(HDI - 0.609)*
*Note: HDI for India in 2006 = 0.609 (HDR, 2008): India ranked 132nd in 179 countries
(in comparison to HDI in 2005 = 0.619 and a rank of 128th in 177 countries)
Table D: HDI Change based upon Biodiesel Production
Item Adilabad Ahemednagar
1 (ha.) of Jatropha cultivation
produces
1892 (L) = 1.493291 (ton.)
Biodiesel
1892 (L) = 1.493291 (ton.)
Biodiesel
1.493291 (ton.) requires (in 5
years)
35530 (Rs.)/ha. 23793.08
Rs./ton/ha
30429 (Rs./ha) =
20377.14
Total Area for Jatropha
Cultivation (ha.)
312 2025.6
Total Income (Rs.) 7423441 41275928
GDP/Captia 4.072093 (Due to oil
Production)
22.64171
GDP/Captia (Purchasing Power
Parities)
21226.07 (Overall) 21244.64
GDP Index 0.420494 0.420731
Life Expectancy Index 0.866667 0.866667
Literacy Index 0.645 0.645

49
Gross Enrolment Index 0.673 0.673
Education Index 0.654333 0.654333
HDI 0.647165 0.647244
Change in HDI (Due to Oil
Production)
0.038165
(HDI - 0.609)*
0.038244
(HDI - 0.609)*
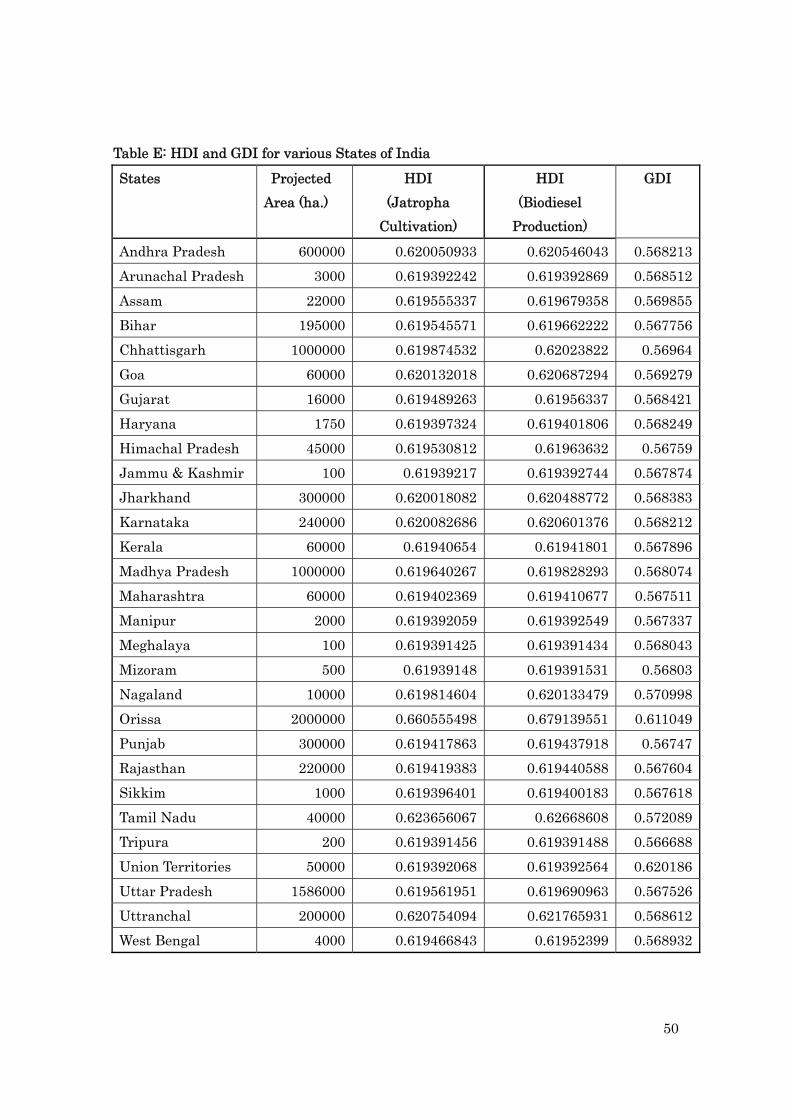
50
Table E: HDI and GDI for various States of India
States Projected
Area (ha.)
HDI
(Jatropha
Cultivation)
HDI
(Biodiesel
Production)
GDI
Andhra Pradesh 600000 0.620050933 0.620546043 0.568213
Arunachal Pradesh 3000 0.619392242 0.619392869 0.568512
Assam 22000 0.619555337 0.619679358 0.569855
Bihar 195000 0.619545571 0.619662222 0.567756
Chhattisgarh 1000000 0.619874532 0.62023822 0.56964
Goa 60000 0.620132018 0.620687294 0.569279
Gujarat 16000 0.619489263 0.61956337 0.568421
Haryana 1750 0.619397324 0.619401806 0.568249
Himachal Pradesh 45000 0.619530812 0.61963632 0.56759
Jammu & Kashmir 100 0.61939217 0.619392744 0.567874
Jharkhand 300000 0.620018082 0.620488772 0.568383
Karnataka 240000 0.620082686 0.620601376 0.568212
Kerala 60000 0.61940654 0.61941801 0.567896
Madhya Pradesh 1000000 0.619640267 0.619828293 0.568074
Maharashtra 60000 0.619402369 0.619410677 0.567511
Manipur 2000 0.619392059 0.619392549 0.567337
Meghalaya 100 0.619391425 0.619391434 0.568043
Mizoram 500 0.61939148 0.619391531 0.56803
Nagaland 10000 0.619814604 0.620133479 0.570998
Orissa 2000000 0.660555498 0.679139551 0.611049
Punjab 300000 0.619417863 0.619437918 0.56747
Rajasthan 220000 0.619419383 0.619440588 0.567604
Sikkim 1000 0.619396401 0.619400183 0.567618
Tamil Nadu 40000 0.623656067 0.62668608 0.572089
Tripura 200 0.619391456 0.619391488 0.566688
Union Territories 50000 0.619392068 0.619392564 0.620186
Uttar Pradesh 1586000 0.619561951 0.619690963 0.567526
Uttranchal 200000 0.620754094 0.621765931 0.568612
West Bengal 4000 0.619466843 0.61952399 0.568932

51
4. INTEGRATION OF SUSTAINABILITY INDICATORS
4.1 Approaches for integration
Indicators are useful for presenting relatively complex situations in a simplified
form to facilitate understanding. The previous chapter introduced indicators for
assessment of the environmental, social and economic performance of biomass
utilisation systems. Within each category, several parameters were needed for
assessment. So, for sustainability assessment of biomass utilisation systems, a suite of
indicators need to be considered. From the scientific point of view, such a system of
indicators would be useful to make an overall assessment of sustainability. But from
the point of view of communication as well as decision-making integration of the
indicators is sometimes sought (Dahl, 1997). Clear-cut decisions are usually difficult to
make based on a plethora of indicators; thus decision-makers would prefer to have a
single index by which they can “unambiguously” evaluate a system to arrive at a
decision. The ‘pyramid of indicator sets’ in Figure 4-1 displays the hierarchy of data to
indices.
Figure 4-1: Relationship between indicators, data and information: the OECD ‘pyramid of indicator sets’ Source: Braat, 1991
increasing condensationof data
public
policy‐makers/managers
scientists and technicians
Total quantity of information
INDICES
INDICATORS
DATA

52
High-level decision-makers are often unwilling to accept that something as
complex as sustainable development can be represented adequately by a single index.
The apparent "lack of ambiguity" associated with a single index is misleading as such
an index is based on the inherent assumption that the indicators being integrated are
actually tradable. Thus we are implicitly faced with the situation where we equate, for
example, a ton of greenhouse gases with a certain number of jobs. This is the major
reason why integration is not acceptable to many scientists and technicians; how
meaningful is it to add up apples and oranges to a single number coefficient? On the
other hand, even a moderately successful attempt at developing a small set of indices
would at least encourage sustainable development goals to be included in policy and
decision-making.
Integration of indicators is to be done at two levels – within the environmental,
social and economic categories as well as across the three categories. Integration
within a category has been done for environmental impacts in life cycle assessments
using normalization and weighting techniques (Baumann and Tillman, 2004). Here,
the various impact categories are normalized to a single unit, for instance person
equivalents based on the impacts of an average person in a year and then weighting
factors assigned based on the relative importance of the impact categories (which
clearly can be quite subjective). Another approach has been to model impacts at the
‘end-point’ or ‘damage’ level relating environmental emissions to areas of protection
such as human health, ecosystem quality and resources (Goedkoop and Spriensma,
2001). Yet again there are integration techniques based on monetization – money is a
unit which is quite easy to understand for a varied audience. One major effort in this
regard at the EU level was the ExternE project (ExternE, 2005). The underlying
assumption with monetization of course is that everything can be monetized which
apart from reservations based on scientific considerations also has strong ethical
implications (Stirling, 1997). All the above integration techniques are numerical ones
yielding a limited number of indices or a single index to facilitate decision-making.
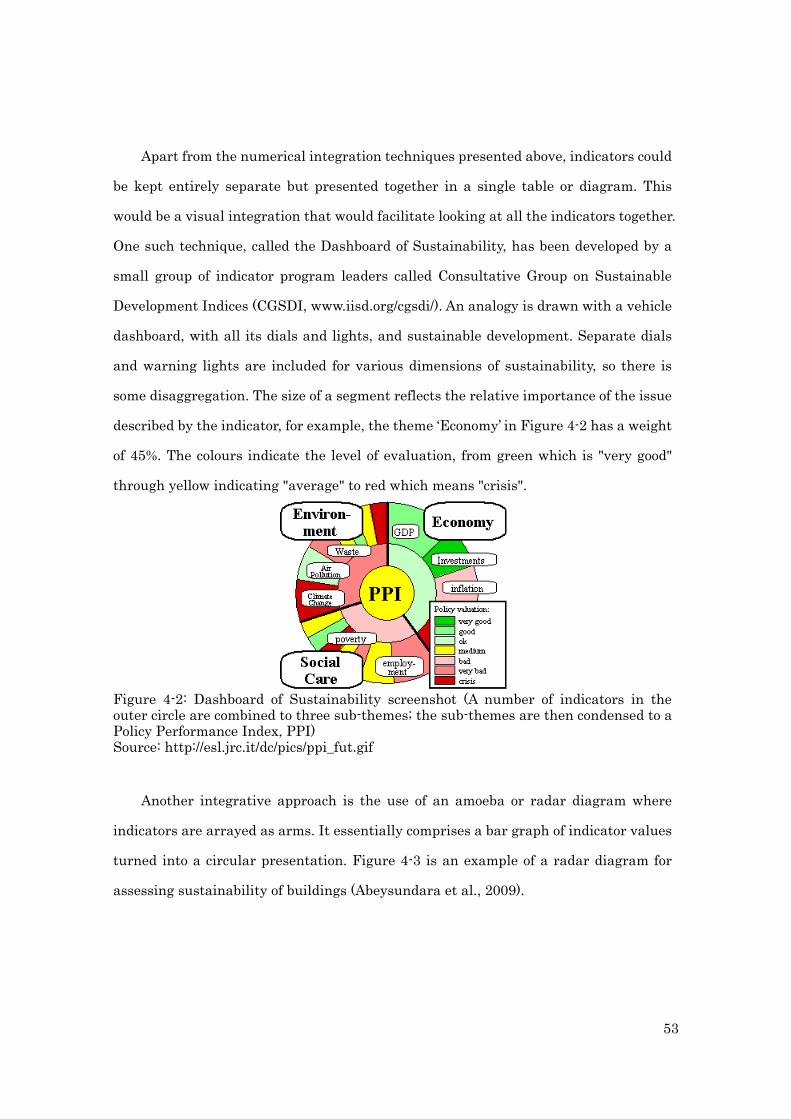
53
Apart from the numerical integration techniques presented above, indicators could
be kept entirely separate but presented together in a single table or diagram. This
would be a visual integration that would facilitate looking at all the indicators together.
One such technique, called the Dashboard of Sustainability, has been developed by a
small group of indicator program leaders called Consultative Group on Sustainable
Development Indices (CGSDI, www.iisd.org/cgsdi/). An analogy is drawn with a vehicle
dashboard, with all its dials and lights, and sustainable development. Separate dials
and warning lights are included for various dimensions of sustainability, so there is
some disaggregation. The size of a segment reflects the relative importance of the issue
described by the indicator, for example, the theme ‘Economy’ in Figure 4-2 has a weight
of 45%. The colours indicate the level of evaluation, from green which is "very good"
through yellow indicating "average" to red which means "crisis".
Figure 4-2: Dashboard of Sustainability screenshot (A number of indicators in the outer circle are combined to three sub-themes; the sub-themes are then condensed to a Policy Performance Index, PPI) Source: http://esl.jrc.it/dc/pics/ppi_fut.gif
Another integrative approach is the use of an amoeba or radar diagram where
indicators are arrayed as arms. It essentially comprises a bar graph of indicator values
turned into a circular presentation. Figure 4-3 is an example of a radar diagram for
assessing sustainability of buildings (Abeysundara et al., 2009).
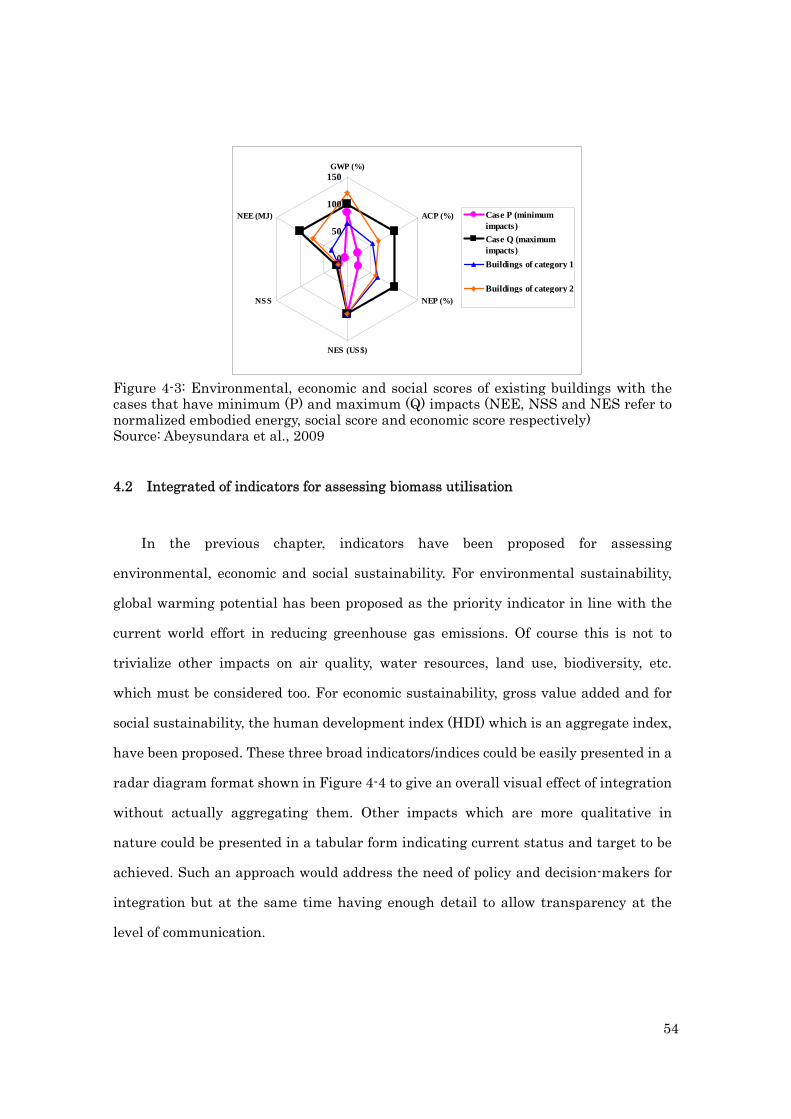
54
0
50
100
150GWP (%)
ACP (%)
NEP (%)
NES (US$)
NSS
NEE (MJ) Case P (minimumimpacts)
Case Q (maximumimpacts)
Buildings of category 1
Buildings of category 2
Figure 4-3: Environmental, economic and social scores of existing buildings with the cases that have minimum (P) and maximum (Q) impacts (NEE, NSS and NES refer to normalized embodied energy, social score and economic score respectively) Source: Abeysundara et al., 2009
4.2 Integrated of indicators for assessing biomass utilisation
In the previous chapter, indicators have been proposed for assessing
environmental, economic and social sustainability. For environmental sustainability,
global warming potential has been proposed as the priority indicator in line with the
current world effort in reducing greenhouse gas emissions. Of course this is not to
trivialize other impacts on air quality, water resources, land use, biodiversity, etc.
which must be considered too. For economic sustainability, gross value added and for
social sustainability, the human development index (HDI) which is an aggregate index,
have been proposed. These three broad indicators/indices could be easily presented in a
radar diagram format shown in Figure 4-4 to give an overall visual effect of integration
without actually aggregating them. Other impacts which are more qualitative in
nature could be presented in a tabular form indicating current status and target to be
achieved. Such an approach would address the need of policy and decision-makers for
integration but at the same time having enough detail to allow transparency at the
level of communication.
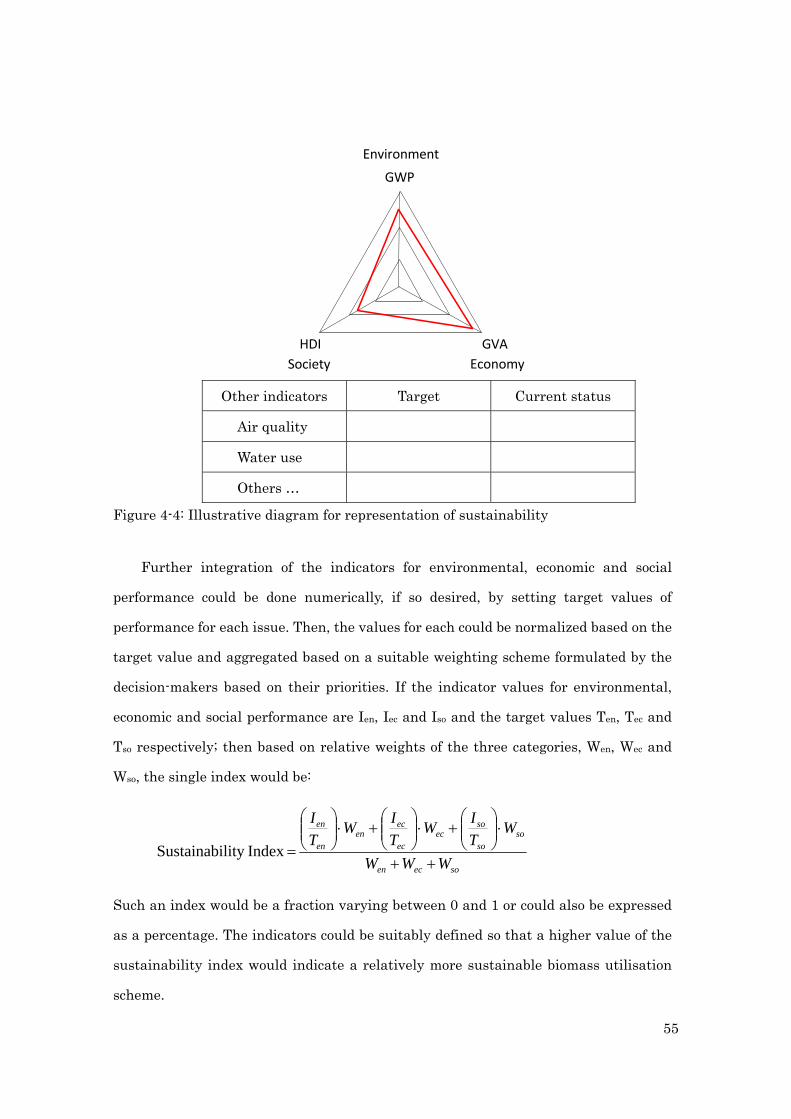
55
GWP
HDI GVA
Environment
Society Economy
Other indicators Target Current status
Air quality
Water use
Others … Figure 4-4: Illustrative diagram for representation of sustainability
Further integration of the indicators for environmental, economic and social
performance could be done numerically, if so desired, by setting target values of
performance for each issue. Then, the values for each could be normalized based on the
target value and aggregated based on a suitable weighting scheme formulated by the
decision-makers based on their priorities. If the indicator values for environmental,
economic and social performance are Ien, Iec and Iso and the target values Ten, Tec and
Tso respectively; then based on relative weights of the three categories, Wen, Wec and
Wso, the single index would be:
soecen
soso
soec
ec
ecen
en
en
WWW
WT
IW
T
IW
T
I
Index lity Sustainabi
Such an index would be a fraction varying between 0 and 1 or could also be expressed
as a percentage. The indicators could be suitably defined so that a higher value of the
sustainability index would indicate a relatively more sustainable biomass utilisation
scheme.

56
REFERENCES
Abeysundara, U G Y, Babel, S, Gheewala, S H (2009) 'A matrix in life cycle perspective
for selecting sustainable materials for buildings in Sri Lanka', Building and
Environment, 44:997–1004
Baumann, H and Tillman, A (2004) 'The Hitch Hiker's guide to LCA : an orientation in
life cycle assessment methodology and application', Studentlitteratur AB,
Lund, 543 p.
Braat, L (1991) ‘The predictive meaning of sustainability indicators’, in Kuik, O and
Verbruggen, H (eds), In Search of Indicators of Sustainable Development,
Kluwer Academic Publishers, Dordrecht, pp 57-70.
Dahl, A L (1997) ‘The Big Picture: Comprehensive Approaches. Part One –
Introduction’, in Moldan, B, Billharz, S and Matravers, R (eds), Sustainability
Indicators: A Report on the Project on Indicators of Sustainable Development,
John Wiley and Sons, Chichester, pp 69-83.
ExternE (2005) Externalities of Energy - Methodology 2005 Update Bickel, P and
Friedrich, R (eds), Stuttgart University, Germany
Goedkoop, M and Spriensma, R (2001) 'The Eco-indicator 99 A damage oriented
method for Life Cycle Impact Assessment', Methodology Report, PRé
Consultants b.v., Amersfoot, The Netherlands, 132 p.
Stirling, A (1997) ' Limits to the value of external costs', Energy Policy, 25(5):517-54.

57
5. POLICY RECOMMENDATIONS
This report on “Guidelines to Assess Sustainability of Biomass Utilisation in East
Asia,” is based upon a study conducted during the second phase of the ERIA project. It
builds upon the outcome of the first phase of the project entitled “Investigation on
Sustainable Biomass Utilisation Vision in East Asia.”
The study develops guidelines for sustainable biomass utilisation in the East
Asian region. The objective of these guidelines is to facilitate biofuel policy formulation
in the region that may be used at the stage of decision making. The study follows the
CEBU declaration on the “East Asian Energy Security,” collectively endorsed by the
concerned political leaders, to promote sustainable production and consumption of
biofuels in the region.
(ⅰ) Adopting of Pilot Studies
The results of this study are based on the secondary data, which highlight the
planned or projected figures but do not depict the factual situation. It is suggested that,
in the next phase of the project, some pilot scale studies should be taken up in the
region, which would focus on collecting the actual data and information through field
surveys of various stakeholders involved in biofuel programs.
(ⅱ) Advancing Methodologies
Lifecycle GHG emissions are highly focused and based on some major
international frameworks. However, several factors have a high degree of uncertainty
to estimate the emissions. East Asian countries should develop and share common
methodologies and necessary data to support scientific assessment.
(ⅲ) Forming task team to cope with worldwide standardisation
East Asian countries should take into consideration the guidelines of ISO, GBEP,

58
and similar other international organizations while implementing and enforcing their
own policy framework developed for biomass utilisation. It is suggested that an expert
working group be formed in East Asia, which meets regularly to discuss the relevant
issues. Outcome of such discussions would be conveyed to the representatives of the
member countries at various international forums.

59
6. CONCLUSION
The WG of ERIA, through an extensive research and elaborate discussions,
developed the guidelines for “Sustainability Assessment of Biomass Utilisation in East
Asia,” which are based on the three pillars of sustainability i.e. social, economic and
environmental perspectives. The WG members hope that this report would assist
worldwide discussions on sustainable biomass utilisation and enhance understanding
of the East Asian opinion and approach.
These guidelines will be tested with the help of some pilot scale studies on actual
biomass utilisation projects to be conducted in 2009. The WG is planning to come out
with the results of these studies and present them in an international workshop in
2010. The announcement will be uploaded on homepage of the ERIA. We invite the
participation of individuals who would like to contribute to this effort.

60
Appendix[1] PILOT STUDY‐ENVIRONMENT
Introduction
Life Cycle Assessment is a compilation and evaluation of the inputs, outputs and the
potential environmental impacts of a product system throughout its life cycle (ISO
14040). The LCI data can be used to establish the environmental sustainability of the
specific bioenergy with respect to green house gas emission and climate change.
In developing the LCI GHG database on Biomass derived bioenergy, ERIA Project
Team seeks your cooperation to fill in the attached questionnaire to the best of your
ability. The questionnaire has been divided into the various compartments of the life
cycle of a bionergy beginning from:
o Feedstock supply (crop production/ cultivation)
o Processing/ treatment of feedstock material
o Intermediate conversion(s)
o Biofuel production
o Storage/ packaging
o Utilisation
o Transportation and distribution is needed for every stage as part of the product
system Not every stage is needed and conversion/transformation to the final form of the biofuel from the agricultural feedstock material can take more than one stage. Ⅰ. GENERAL COMPANY INFORMATION 1.1. Name
1.2. Address
Phone
FAX
1.3. Name/position of contact person
1.4. Type of biomass feedstock material:
1.5. Completed by:
1.6. Date of data compilation Ⅱ. Seedling Stage 2.1. Name of nursery 2.2. Location 2.3. Type of nursery
QUESTIONNAIR
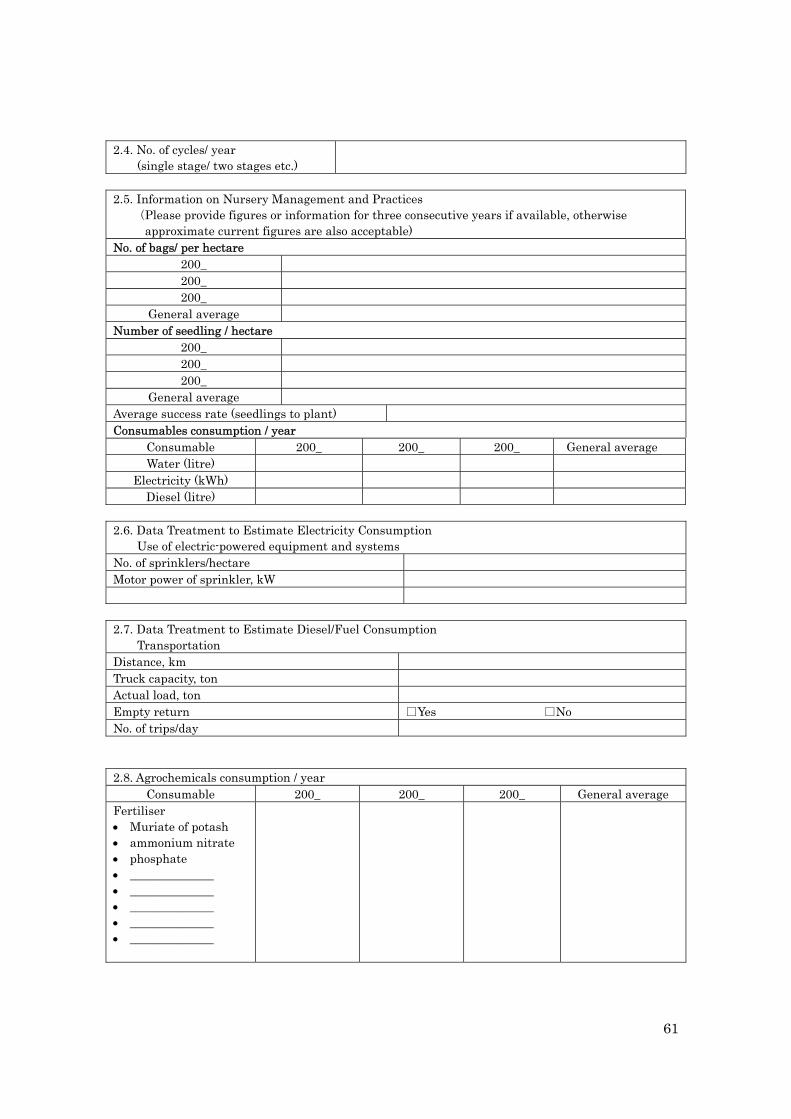
61
2.4. No. of cycles/ year (single stage/ two stages etc.)
2.5. Information on Nursery Management and Practices
(Please provide figures or information for three consecutive years if available, otherwise approximate current figures are also acceptable)
No. of bags/ per hectare 200_ 200_ 200_
General average Number of seedling / hectare
200_ 200_ 200_
General average Average success rate (seedlings to plant) Consumables consumption / year
Consumable 200_ 200_ 200_ General average Water (litre)
Electricity (kWh) Diesel (litre)
2.6. Data Treatment to Estimate Electricity Consumption Use of electric-powered equipment and systems No. of sprinklers/hectare Motor power of sprinkler, kW 2.7. Data Treatment to Estimate Diesel/Fuel Consumption Transportation Distance, km Truck capacity, ton Actual load, ton Empty return □Yes □No No. of trips/day 2.8. Agrochemicals consumption / year
Consumable 200_ 200_ 200_ General average Fertiliser Muriate of potash ammonium nitrate phosphate ______________ ______________ ______________ ______________ ______________
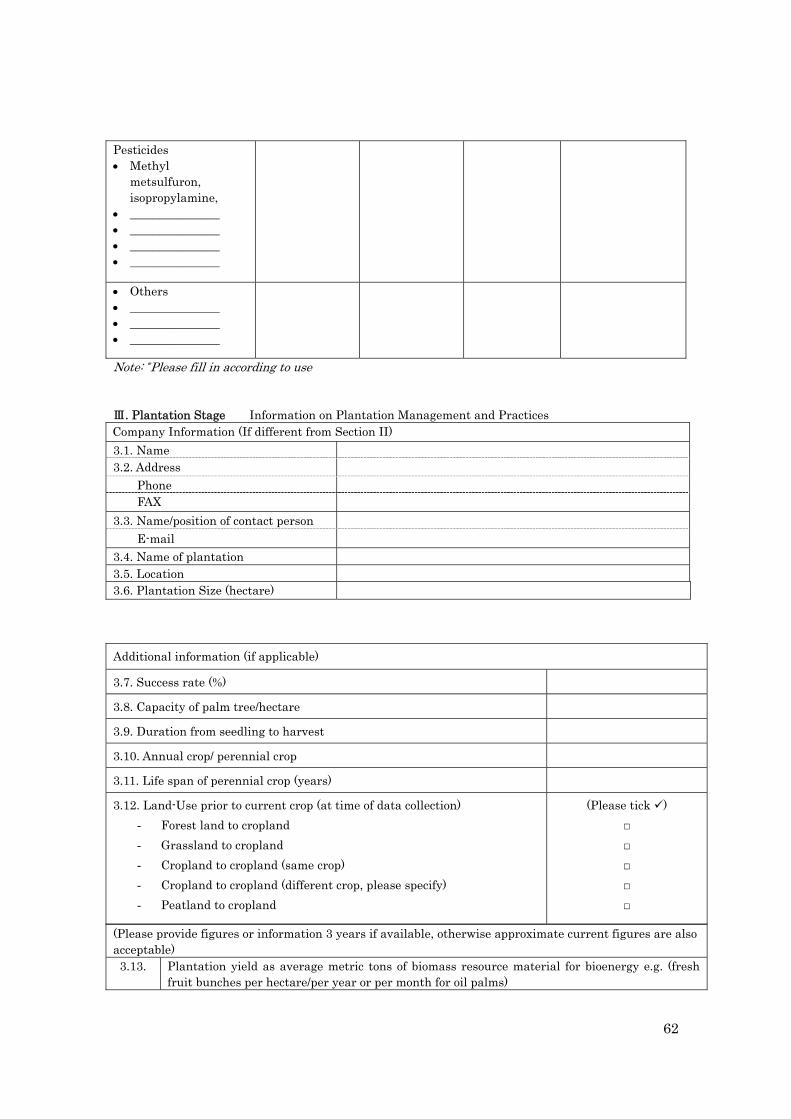
62
Pesticides Methyl
metsulfuron, isopropylamine,
_______________ _______________ _______________ _______________
Others _______________ _______________ _______________
Note: *Please fill in according to use Ⅲ. Plantation Stage Information on Plantation Management and Practices Company Information (If different from Section II)
3.1. Name 3.2. Address
Phone FAX
3.3. Name/position of contact person
3.4. Name of plantation 3.5. Location 3.6. Plantation Size (hectare)
(Please provide figures or information 3 years if available, otherwise approximate current figures are also acceptable) 3.13. Plantation yield as average metric tons of biomass resource material for bioenergy e.g. (fresh
fruit bunches per hectare/per year or per month for oil palms)
Additional information (if applicable)
3.7. Success rate (%)
3.8. Capacity of palm tree/hectare
3.9. Duration from seedling to harvest
3.10. Annual crop/ perennial crop
3.11. Life span of perennial crop (years)
3.12. Land-Use prior to current crop (at time of data collection)
- Forest land to cropland
- Grassland to cropland
- Cropland to cropland (same crop)
- Cropland to cropland (different crop, please specify)
- Peatland to cropland
(Please tick )
□
□
□
□
□
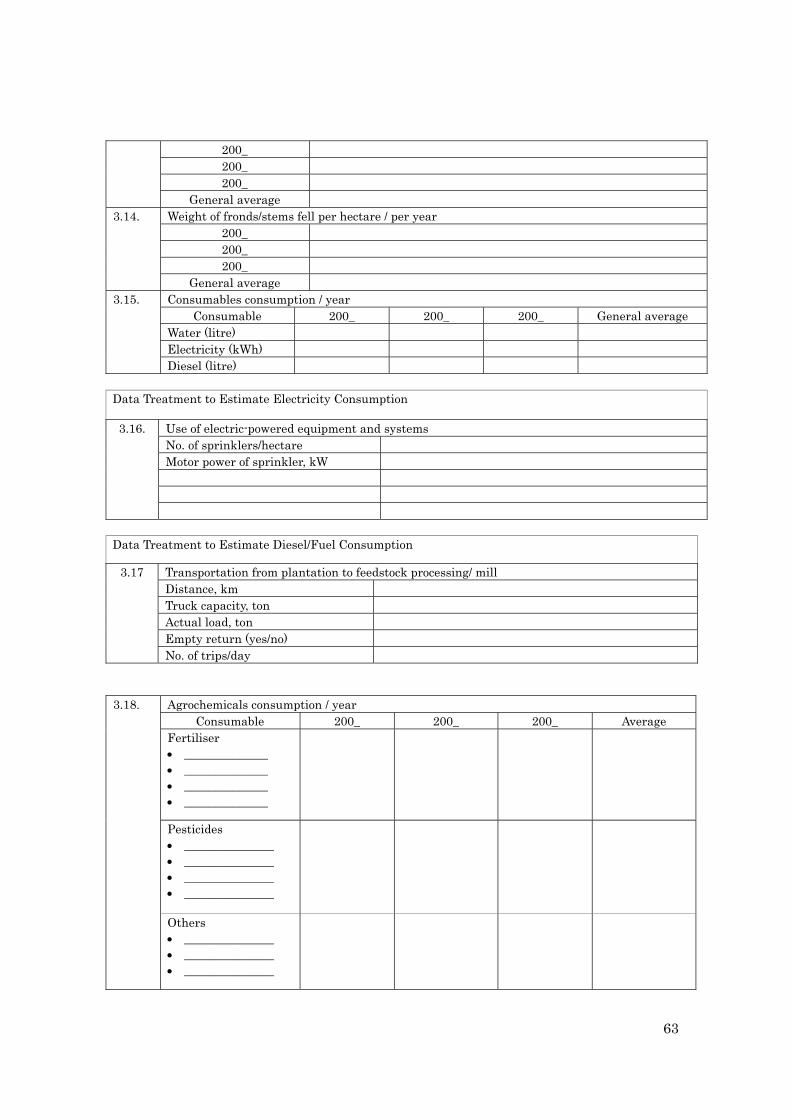
63
200_ 200_ 200_
General average 3.14. Weight of fronds/stems fell per hectare / per year
200_ 200_ 200_
General average 3.15. Consumables consumption / year
Consumable 200_ 200_ 200_ General average Water (litre) Electricity (kWh) Diesel (litre)
Data Treatment to Estimate Electricity Consumption
3.16. Use of electric-powered equipment and systems No. of sprinklers/hectare Motor power of sprinkler, kW
Data Treatment to Estimate Diesel/Fuel Consumption
3.17 Transportation from plantation to feedstock processing/ mill Distance, km Truck capacity, ton Actual load, ton Empty return (yes/no) No. of trips/day
3.18. Agrochemicals consumption / year
Consumable 200_ 200_ 200_ Average Fertiliser ______________ ______________ ______________ ______________
Pesticides _______________ _______________ _______________ _______________
Others _______________ _______________ _______________
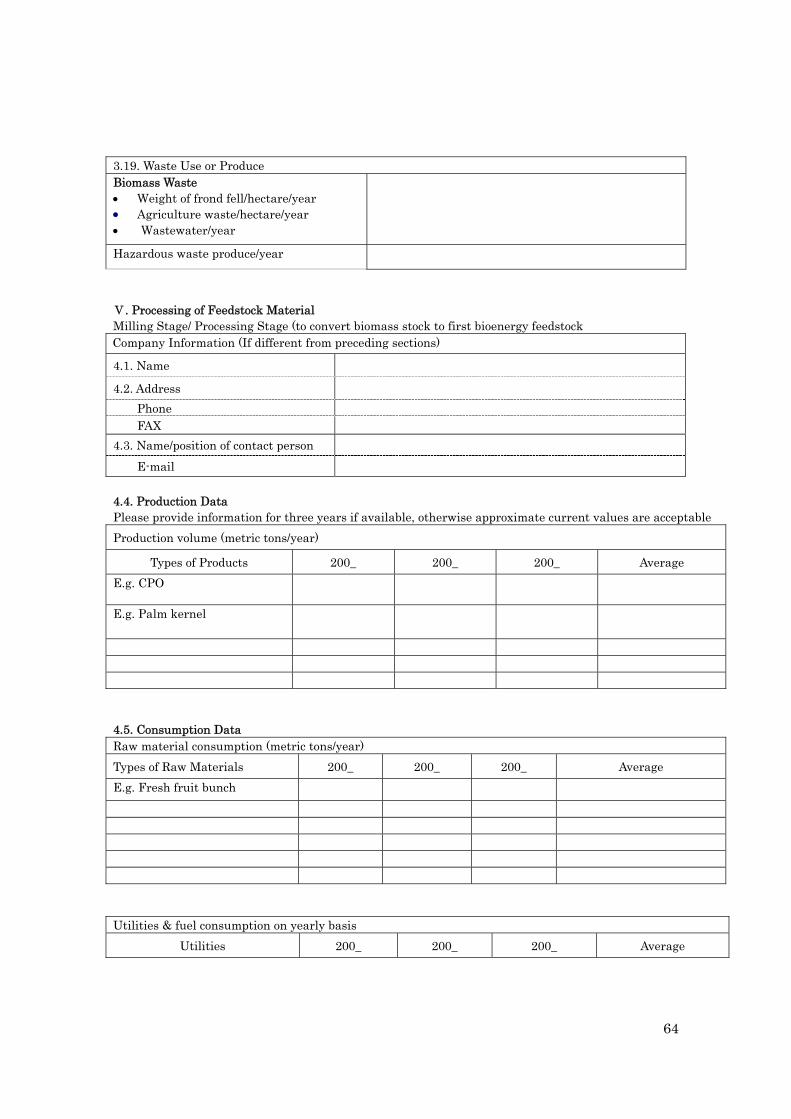
64
3.19. Waste Use or Produce Biomass Waste Weight of frond fell/hectare/year Agriculture waste/hectare/year Wastewater/year
Hazardous waste produce/year
Ⅴ. Processing of Feedstock Material Milling Stage/ Processing Stage (to convert biomass stock to first bioenergy feedstock Company Information (If different from preceding sections)
4.1. Name
4.2. Address
Phone FAX
4.3. Name/position of contact person
4.4. Production Data Please provide information for three years if available, otherwise approximate current values are acceptable
Production volume (metric tons/year)
Types of Products 200_ 200_ 200_ Average
E.g. CPO
E.g. Palm kernel
4.5. Consumption Data Raw material consumption (metric tons/year)
Types of Raw Materials 200_ 200_ 200_ Average
E.g. Fresh fruit bunch
Utilities & fuel consumption on yearly basis
Utilities 200_ 200_ 200_ Average
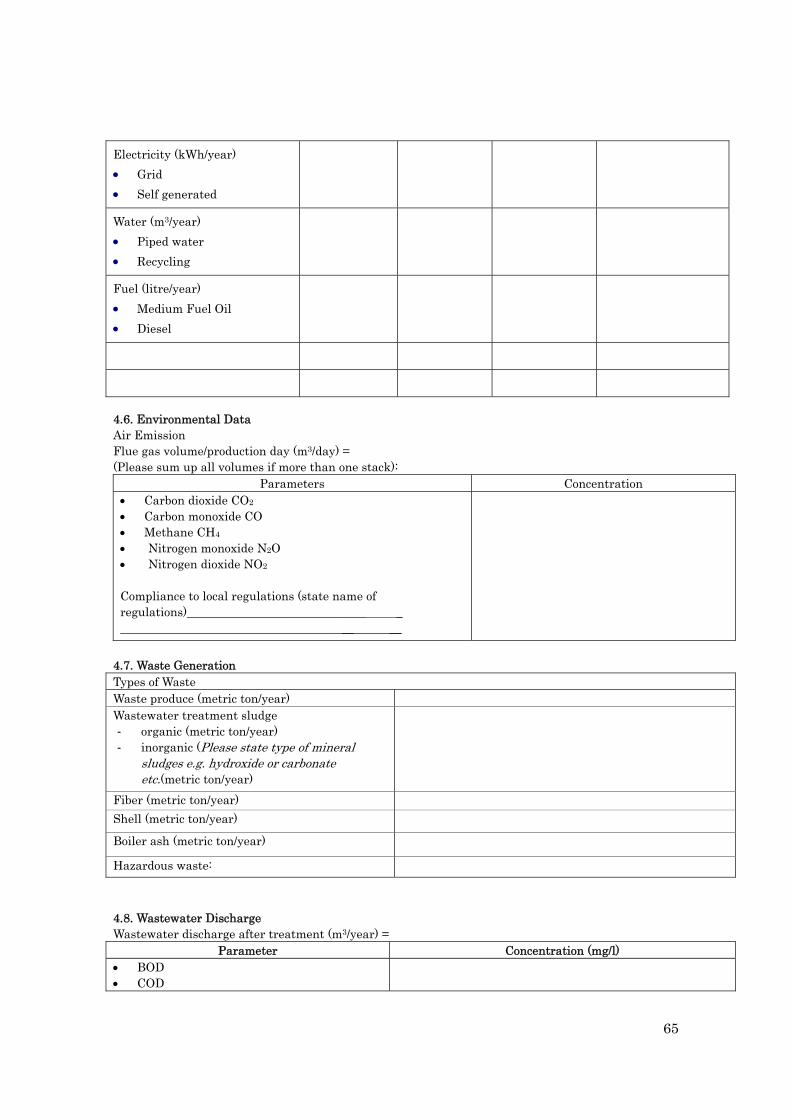
65
Electricity (kWh/year)
Grid
Self generated
Water (m3/year)
Piped water
Recycling
Fuel (litre/year)
Medium Fuel Oil
Diesel
4.6. Environmental Data Air Emission Flue gas volume/production day (m3/day) = (Please sum up all volumes if more than one stack):
Parameters Concentration Carbon dioxide CO2 Carbon monoxide CO Methane CH4 Nitrogen monoxide N2O Nitrogen dioxide NO2 Compliance to local regulations (state name of regulations)______________________________ _ _______________________________________ __
4.7. Waste Generation Types of Waste Waste produce (metric ton/year) Wastewater treatment sludge - organic (metric ton/year) - inorganic (Please state type of mineral
sludges e.g. hydroxide or carbonate etc.(metric ton/year)
Fiber (metric ton/year)
Shell (metric ton/year)
Boiler ash (metric ton/year)
Hazardous waste:
4.8. Wastewater Discharge Wastewater discharge after treatment (m3/year) =
Parameter Concentration (mg/l) BOD COD
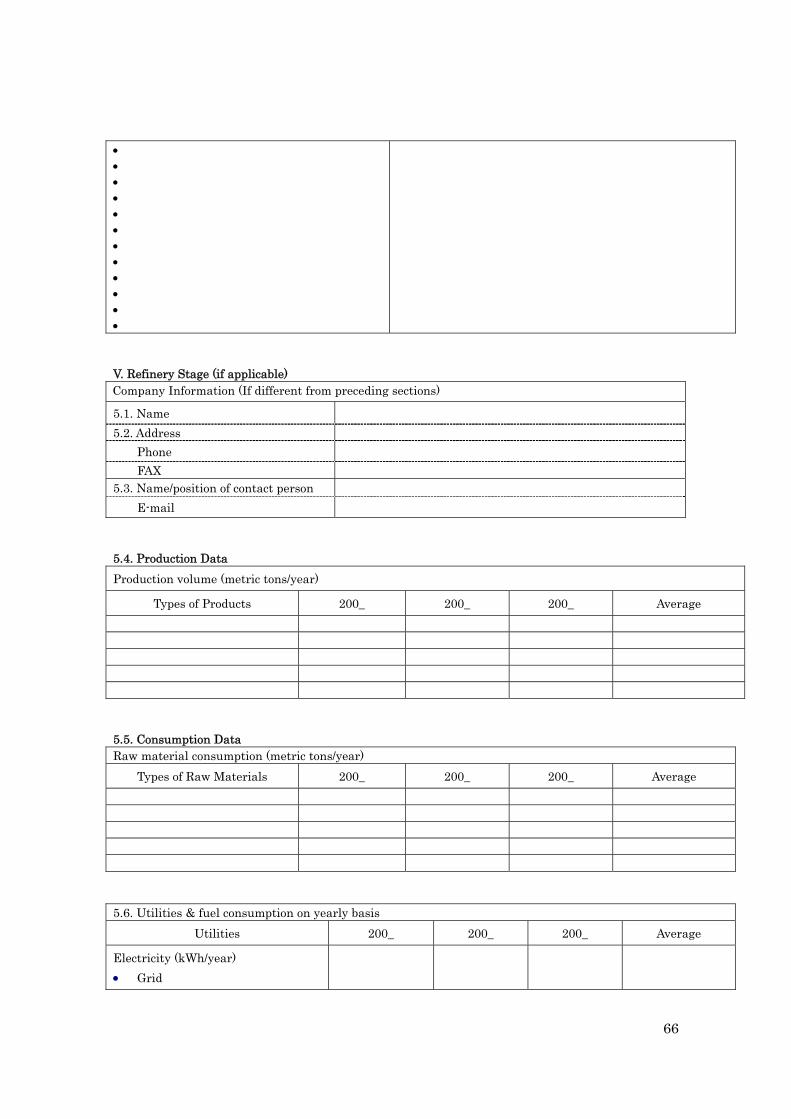
66
V. Refinery Stage (if applicable) Company Information (If different from preceding sections)
5.1. Name
5.2. Address
Phone
FAX 5.3. Name/position of contact person
5.4. Production Data
Production volume (metric tons/year)
Types of Products 200_ 200_ 200_ Average
5.5. Consumption Data Raw material consumption (metric tons/year)
Types of Raw Materials 200_ 200_ 200_ Average
5.6. Utilities & fuel consumption on yearly basis
Utilities 200_ 200_ 200_ Average
Electricity (kWh/year)
Grid

67
Self-generated
Water (m3/year)
Piped water
Other source____________
Fuel
Medium Fuel Oil (litre/year)
Diesel (litre/year)
Natural Gas (vol/year)
Coal (ton/year
Biomass (ton/year)
5.7. Environmental Data Air Emission Flue gas volume/production day (m3/day) = (Please sum up all volumes if more than one stack) :
Parameters Concentration Carbon dioxide CO2 Carbon monoxide CO
Methane CH4 Nitrogen monoxide N2O Nitrogen dioxide NO2
Compliance to local regulations? □Yes □No
Name of regulation___________________
5.8. Waste Generation Types of Waste Waste produce (ton/year)
Wastewater treatment sludge - organic (metric ton/year) - inorganic (Please state type of mineral
sludges e.g. hydroxide or carbonate etc.(metric ton/year)
Hazardous waste (ton/year)
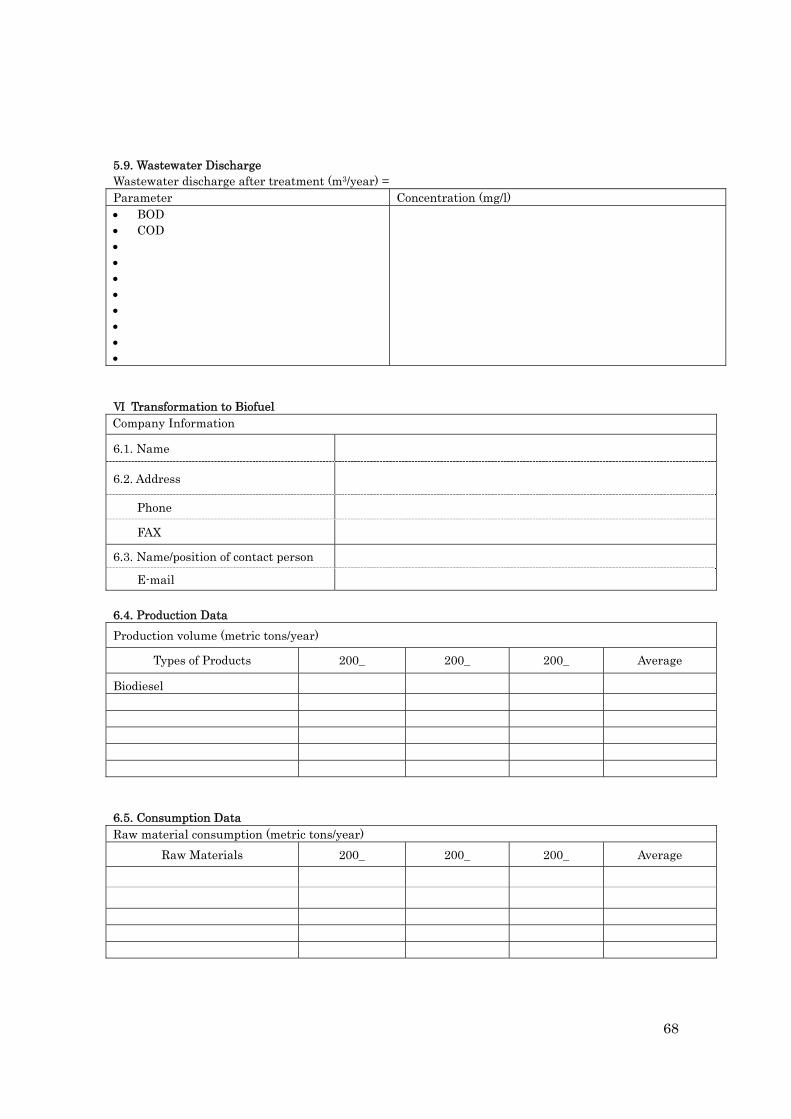
68
5.9. Wastewater Discharge Wastewater discharge after treatment (m3/year) = Parameter Concentration (mg/l) BOD COD
Ⅵ Transformation to Biofuel Company Information
6.1. Name
6.2. Address
Phone
FAX
6.3. Name/position of contact person
6.4. Production Data
Production volume (metric tons/year)
Types of Products 200_ 200_ 200_ Average
Biodiesel
6.5. Consumption Data Raw material consumption (metric tons/year)
Raw Materials 200_ 200_ 200_ Average
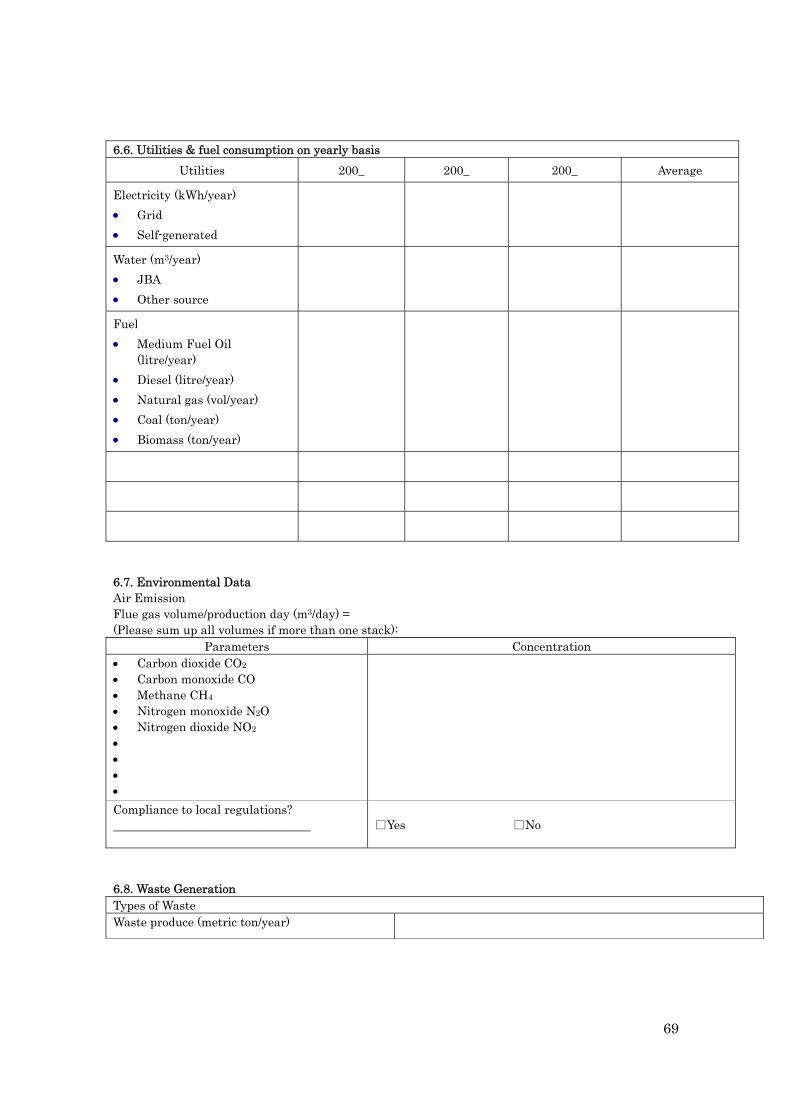
69
6.6. Utilities & fuel consumption on yearly basis
Utilities 200_ 200_ 200_ Average
Electricity (kWh/year)
Grid
Self-generated
Water (m3/year)
JBA
Other source
Fuel
Medium Fuel Oil (litre/year)
Diesel (litre/year)
Natural gas (vol/year)
Coal (ton/year)
Biomass (ton/year)
6.7. Environmental Data Air Emission Flue gas volume/production day (m3/day) = (Please sum up all volumes if more than one stack):
Parameters Concentration Carbon dioxide CO2 Carbon monoxide CO Methane CH4 Nitrogen monoxide N2O Nitrogen dioxide NO2
Compliance to local regulations? _________________________________ □Yes □No
6.8. Waste Generation Types of Waste Waste produce (metric ton/year)
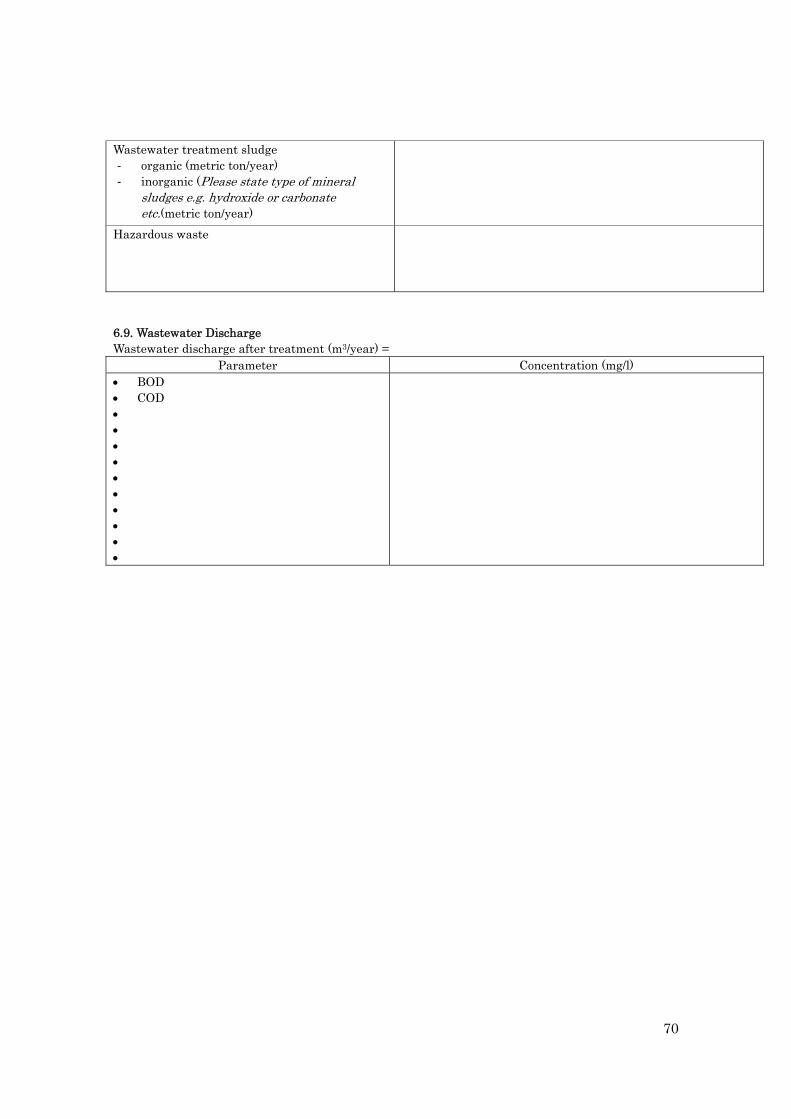
70
Wastewater treatment sludge - organic (metric ton/year) - inorganic (Please state type of mineral
sludges e.g. hydroxide or carbonate etc.(metric ton/year)
Hazardous waste
6.9. Wastewater Discharge Wastewater discharge after treatment (m3/year) =
Parameter Concentration (mg/l) BOD COD

71
Appendix[2] Appendix[2-1]PILOT STUDY‐ECONOMICS Ⅰ. GENERAL INFORMATION 1.1. Name (optional) (First Name)
(Middle Name)
(Last Name)
Age
Gender □Male □Female
Educational Attainment □Elementary □College □High school □Vocational □Post Graduate
Civil Status □Married □Widowed □Single □Separated
1.2. Main Source of Income Monthly Income
Other Sources Monthly Income
1.3. Years in Farming:___ _ Source of capital__ _ _ __ Initial capital(P)____ ___ 1.4. Membership in Organization
Name of Organization Position Number of Years Involvement in Organization
1.5 Are you involved in community activities? □Yes □No 1.5a. If yes, what activities? 1.6. Household information
Relationship with Respondent Gender Age Civil
StatusEducational Attainment
Occupation Monthly Income
II. Plant/Firm Inputs 2.1. Plant size 2.2. Acquisition Cost
2.3. Total number of employees 2.4. Plant capacity
2.5. Raw material(s) processed 2.6 Products produced
2.7. Initial Investment Cost
Inventory of Fixed Assets Quantity Year acquired Life span Acquisition cost
Land
Building Tools and Equipment
QUESTIONNAIRE FOR TRADERS/PROCESSORS
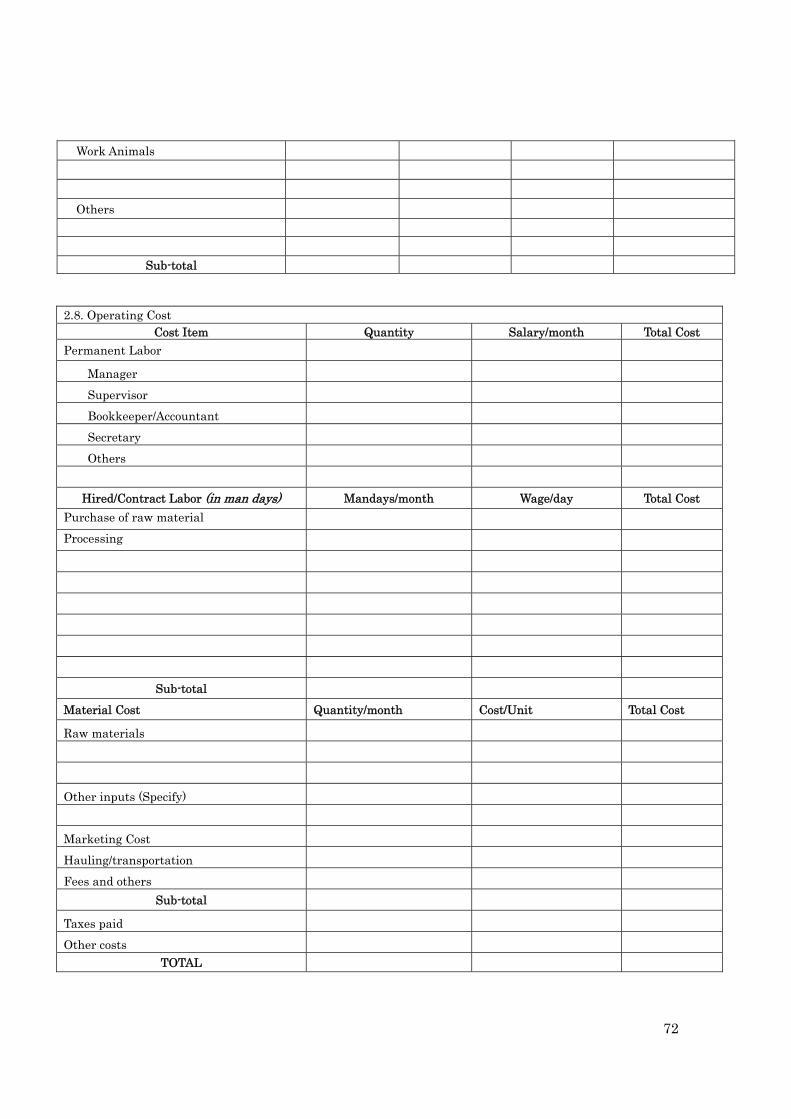
72
2.8. Operating Cost Cost Item Quantity Salary/month Total Cost
Permanent Labor
Manager
Supervisor
Bookkeeper/Accountant
Secretary
Others
Hired/Contract Labor (in man days) Mandays/month Wage/day Total Cost
Purchase of raw material
Processing
Sub-total
Material Cost Quantity/month Cost/Unit Total Cost
Raw materials
Other inputs (Specify)
Marketing Cost
Hauling/transportation
Fees and others
Sub-total
Taxes paid
Other costs
TOTAL
Work Animals
Others
Sub-total
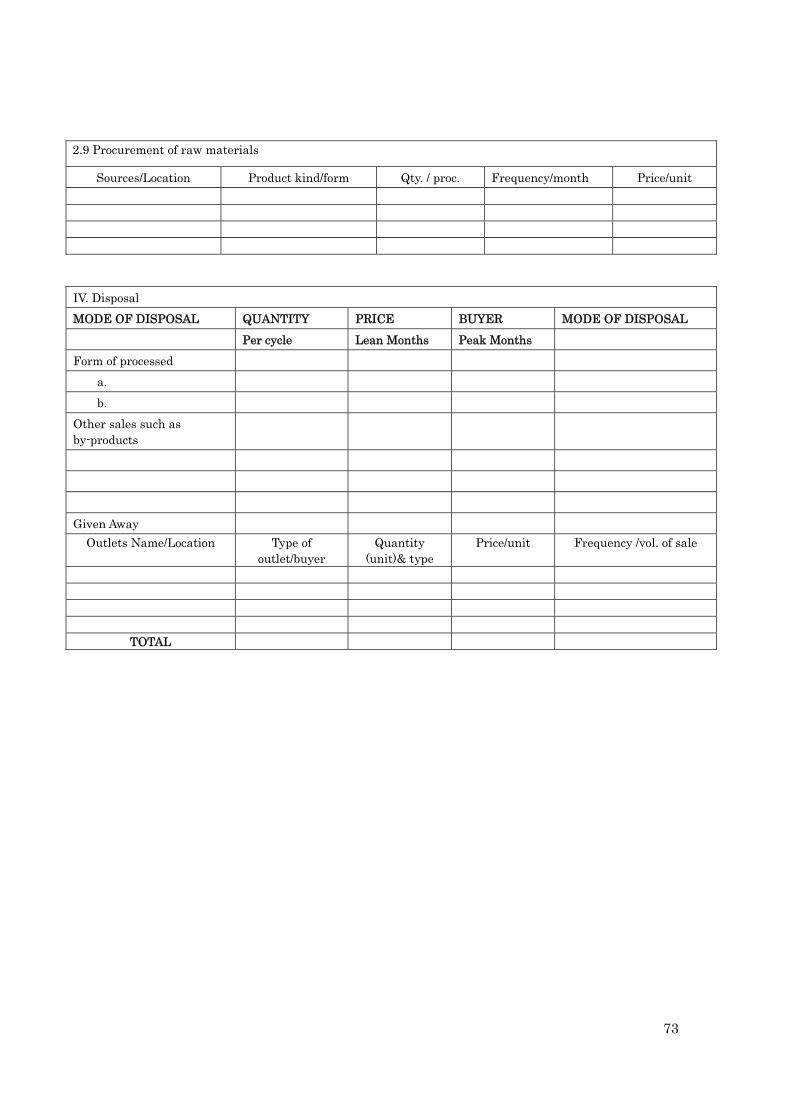
73
2.9 Procurement of raw materials
Sources/Location Product kind/form Qty. / proc. Frequency/month Price/unit
IV. Disposal
MODE OF DISPOSAL QUANTITY PRICE BUYER MODE OF DISPOSAL
Per cycle Lean Months Peak Months
Form of processed
a.
b.
Other sales such as by-products
Given Away
Outlets Name/Location Type of outlet/buyer
Quantity (unit)& type
Price/unit Frequency /vol. of sale
TOTAL
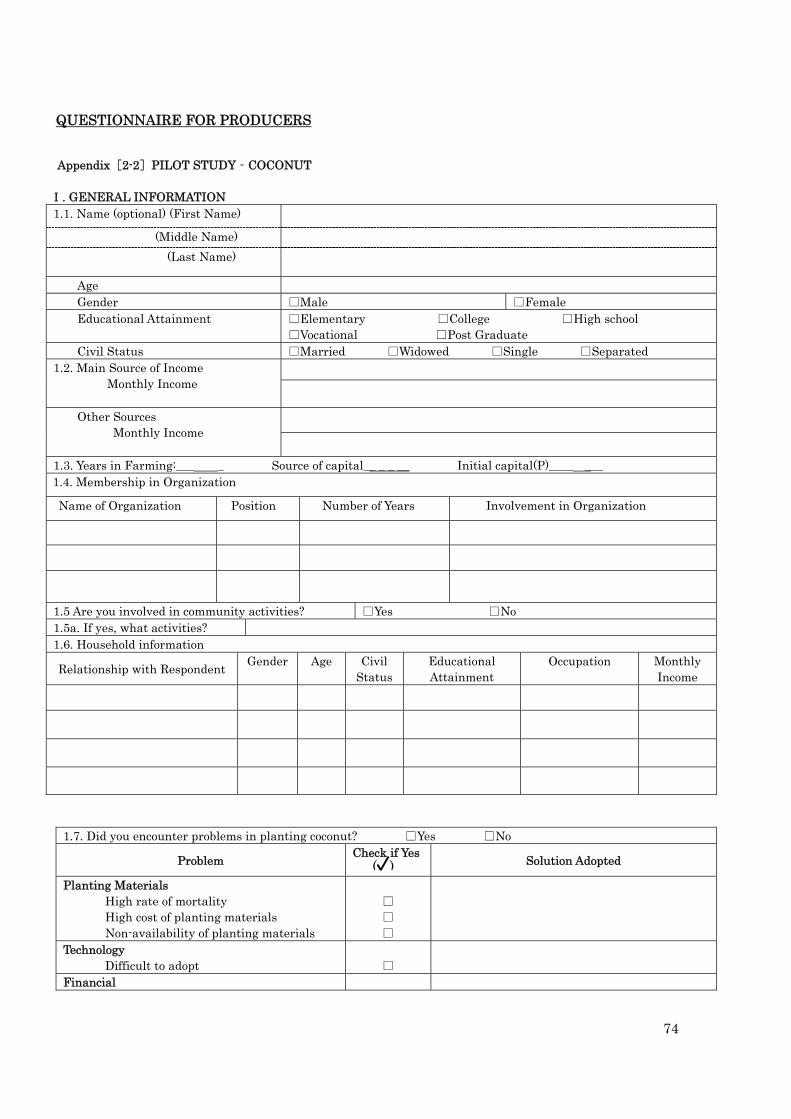
74
Appendix[2-2]PILOT STUDY‐COCONUT
Ⅰ. GENERAL INFORMATION 1.1. Name (optional) (First Name)
(Middle Name)
(Last Name)
Age Gender □Male □Female Educational Attainment □Elementary □College □High school
□Vocational □Post Graduate Civil Status □Married □Widowed □Single □Separated
1.2. Main Source of Income Monthly Income
Other Sources Monthly Income
1.3. Years in Farming:___ _ Source of capital__ _ _ __ Initial capital(P)____ ___ 1.4. Membership in Organization
Name of Organization Position Number of Years Involvement in Organization
1.5 Are you involved in community activities? □Yes □No 1.5a. If yes, what activities? 1.6. Household information
Relationship with Respondent Gender Age Civil
StatusEducational Attainment
Occupation Monthly Income
1.7. Did you encounter problems in planting coconut? □Yes □No
Problem Check if Yes
Solution Adopted
Planting Materials High rate of mortality High cost of planting materials Non-availability of planting materials
□ □ □
Technology Difficult to adopt
□
Financial
QUESTIONNAIRE FOR PRODUCERS
( )

75
Lack of financial support Higher interest rate on loans
□ □
Market Lesser access to market
□
Pest and Diseases
Harvest/Post-Harvest
Processing
II. Farm Inputs 2.1. When did you first plant coconut?
No. of pieces planted: Source: 2.2. After your 1st purchase did you buy more? How many?
Comment on Price 2.3. When was the last purchase? Qty Amount paid:
2.3.1. If price is lower, how many would you buy?
2.4. Farm size: 2.4.1. Acquisition Cost: _____________________ 2.4.2. Total number of palms: 2.4.3. Number of bearing palms: _______________ System of planting: □Monocrop □Backyard planting
□Intercrop with other crops (specify)_______________________ □Intercrop with coconut (specify number of macapuno relative to coconut)
2.5. Investment Cost
Cost Item Quantity Price/Unit Total Cost
Labor
Land preparation (man day)
Planting (man day)
Fertilization (man day)
Weeding (man day)
Material Cost
Seedlings or any planting material
Fertilizer (bag)
Pesticides (bag)
Other chemicals
Other Establishment Costs
Ex. Fencing, licensing etc.

76
Sub-total
Inventory of Fixed Assets Quantity Year acquired Life span Acquisition cost
Land
Building
Tools and Equipment
Work Animals
Others
Sub-total
2.6. Operating Cost
Cost Item Quantity/month Cost/Unit Total Cost
Hired Labor (in man days)
Farm overseer (man day)
Grass cutting (man day)
Watering (man day)
Ringweeding
Fertilization
Deleafing
Pesticide spraying
Harvesting
Collecting/piling
Sub-total
Material Cost Quantity/month Cost/Unit Total Cost
Water (liters)
Fertilizer (bag)
Pesticides (bag)
Other inputs (Specify)
Marketing Cost
Sub-total
TOTAL
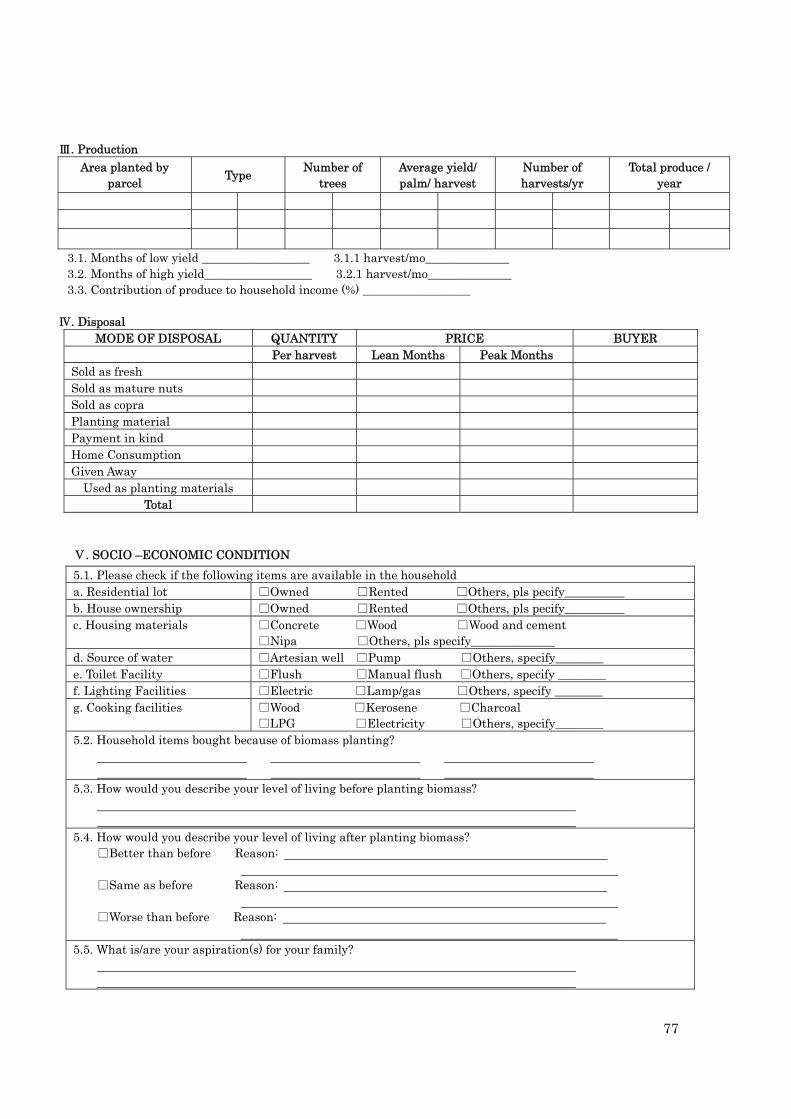
77
Ⅲ. Production
Area planted by parcel
Type Number of
trees Average yield/ palm/ harvest
Number of harvests/yr
Total produce / year
3.1. Months of low yield __________________ 3.1.1 harvest/mo______________ 3.2. Months of high yield__________________ 3.2.1 harvest/mo______________ 3.3. Contribution of produce to household income (%) __________________
Ⅳ. Disposal
MODE OF DISPOSAL QUANTITY PRICE BUYER Per harvest Lean Months Peak Months Sold as fresh Sold as mature nuts Sold as copra Planting material Payment in kind Home Consumption Given Away
Used as planting materials Total
5.1. Please check if the following items are available in the household a. Residential lot □Owned □Rented □Others, pls pecify__________ b. House ownership □Owned □Rented □Others, pls pecify__________ c. Housing materials □Concrete □Wood □Wood and cement
□Nipa □Others, pls specify______________ d. Source of water □Artesian well □Pump □Others, specify________ e. Toilet Facility □Flush □Manual flush □Others, specify ________ f. Lighting Facilities □Electric □Lamp/gas □Others, specify ________ g. Cooking facilities □Wood □Kerosene □Charcoal
□LPG □Electricity □Others, specify________ 5.2. Household items bought because of biomass planting? 5.3. How would you describe your level of living before planting biomass? 5.4. How would you describe your level of living after planting biomass?
□Better than before Reason:
□Same as before Reason:
□Worse than before Reason: 5.5. What is/are your aspiration(s) for your family?
Ⅴ. SOCIO –ECONOMIC CONDITION

78
5.6. Do you think the planting of biomass will help you with the attainment of your aspirations? □Yes □No
If yes, in what way? If no, why not?
Ⅵ. CHANGES IN THE ENVIRONMENTAL CONDITIONS/ELEMENTS Please check based on your perception and state reasons for the choice/response 5.7. Are there changes in the following properties of the soil in your farm after you planted biomass?
Soil properties
Rating (please check) (5-very dark, 4-dark, 3-slightly dark,
2-light, 1- very light) Reason for the Rating
1 2 3 4 5 1.1. Color BA
AA
Soil properties
Rating (please check) (5-very fast infiltration,
4-fast infiltration, 3-slightly fast, 2-slow, 1-very slow)
Reason for the Rating
1 2 3 4 5 1.2. Porosity or ease of infiltration of water
BA AA
Soil properties
Rating (please check) (5-very abundant,4-more abundant,
3-abundant,2-less, 1-least) Reason for the Rating
1 2 3 4 5
1.3. Abundance of humus or organic matter
BA AA
Soil properties
Rating (please check) (5-least acidic,4-less acidic,
3-acidic,2-more acidic,1-very acidic) Reason for the Rating
1 2 3 4 5
1.4. Acidity BA
AA
Soil properties
Rating (please check) (5-very low,4-low,3-high, 2-moer high,1-very high)
Reason for the Rating
1 2 3 4 5 1.5. Occurrence and extent of soil erosion
BA AA
Soil properties
Rating (please check) (5-very deep,4-moredeep,3-deep,
2-shallow,1-very shallow) Reason for the Rating
1 2 3 4 5 1.6. Depth of litter/gradient of
BA AA
BA = Before Adoption AA = After Adoption
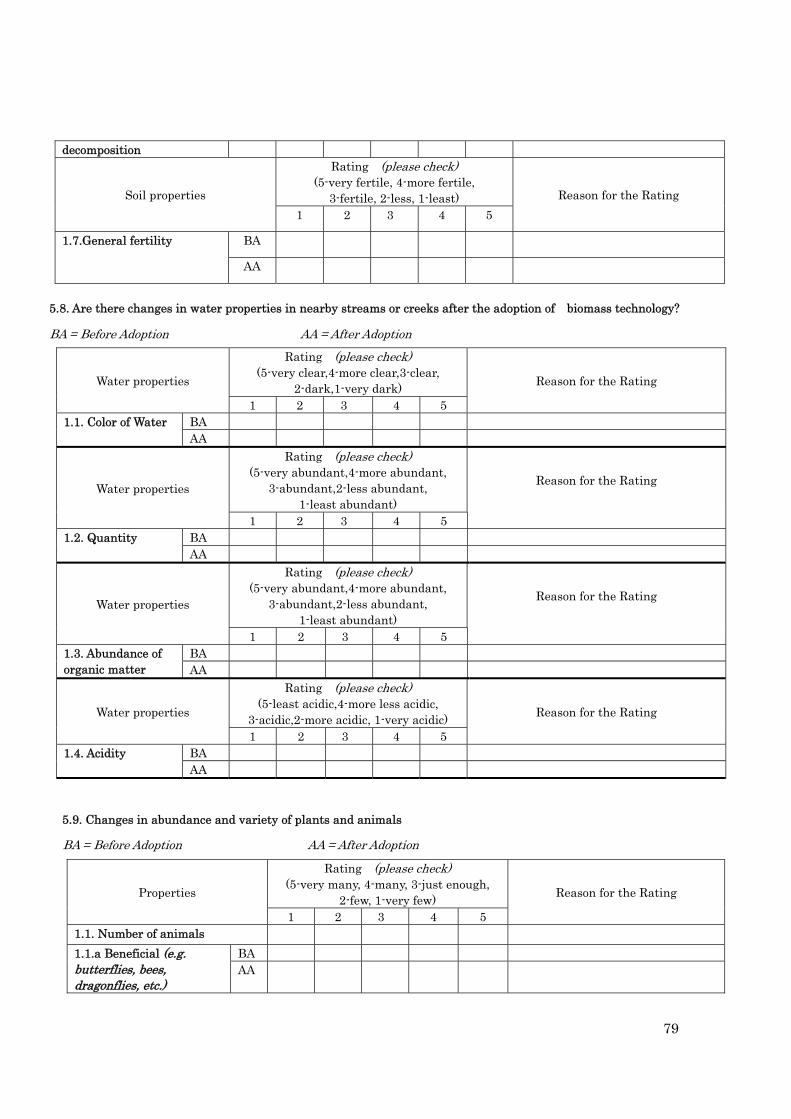
79
decomposition
Soil properties
Rating (please check) (5-very fertile, 4-more fertile,
3-fertile, 2-less, 1-least) Reason for the Rating
1 2 3 4 5
1.7.General fertility BA
AA
5.8. Are there changes in water properties in nearby streams or creeks after the adoption of biomass technology?
Water properties
Rating (please check) (5-very clear,4-more clear,3-clear,
2-dark,1-very dark) Reason for the Rating
1 2 3 4 5 1.1. Color of Water BA
AA
Water properties
Rating (please check) (5-very abundant,4-more abundant,
3-abundant,2-less abundant, 1-least abundant)
Reason for the Rating
1 2 3 4 5 1.2. Quantity BA
AA
Water properties
Rating (please check) (5-very abundant,4-more abundant,
3-abundant,2-less abundant, 1-least abundant)
Reason for the Rating
1 2 3 4 5 1.3. Abundance of organic matter
BA AA
Water properties
Rating (please check) (5-least acidic,4-more less acidic,
3-acidic,2-more acidic, 1-very acidic) Reason for the Rating
1 2 3 4 5 1.4. Acidity BA
AA
5.9. Changes in abundance and variety of plants and animals
Properties
Rating (please check) (5-very many, 4-many, 3-just enough,
2-few, 1-very few) Reason for the Rating
1 2 3 4 5 1.1. Number of animals
1.1.a Beneficial (e.g. butterflies, bees, dragonflies, etc.)
BA AA
BA = Before Adoption AA = After Adoption
BA = Before Adoption AA = After Adoption

80
5.10. Other changes in the environment
Properties Before
adoption
Reason After
adoption Reason
Presence of chemicals not properly disposed
Presence of waste not properly disposed
Littered plastics and other non-biodegradable materials like plastics
Presence of impermeable structures (e.g. pathways, buildings, cemented structures)
1.1.b Harmful (e.g. snakes, rodents, mosquitoes)
BA AA
Properties
Rating (please check) (5-very many, 4-many, 3-just enough,
2-few, 1-very few) Reason for the Rating
1 2 3 4 5 1.2. Number of plants
1.2.a Vegetation BA AA
1.2.b Undergrowth BA AA
( ) ( )

81
Appendix[3] PILOT STUDY‐SOCIAL
Ⅰ. PERSONAL AND GENERAL INFORMATION 1.1. Name of the Respondent
(individual/ firm)
1.2. Address
Phone
FAX
1.3. Age /Date of incorporation
1.4. Qualification (Self/ Head)
1.5. Occupation (Self/ Head)
1.6. If individual, total number of family members Males Females Children Infants
1.7. In case of individual, Income per month (in Rs) Personal Family Expenditure Savings
1.8. For Individual, how much do you spend your income (in percent) Food Cloth Housing Education Health Other items(specify)
1.9. In case of Firm, Type of Facility No. of workers Annual Turnover Expenditure Net Income
1.10. Location of Biofuel crops farm
1.11. Location of Biodiesel production unit
Ⅱ. CULTIVATION AND SEED COLLECTION STAGE
2.1. Are you a Farmer or Worker at Biofuel Crops Farm?
2.1.1. If farmer, how did you hear about Jatropha/ Oil-Tree cultivation?
2.2. Do you own biofuel crop farms? □Yes □No_______________
2.2.1. If yes, what is the type of crop Jatropha/ Pongamia/ others_________________
2.3. Is your farm rainfed or irrigated?
2.4. What are other input? (water/ fertilizers/ pesticides etc.)
2.5. Is it on a waste land or cultivable land or both?
2.6. What is the size of your farm? Waste Land ___________cultivable land ___________
QUESTIONNAIRE
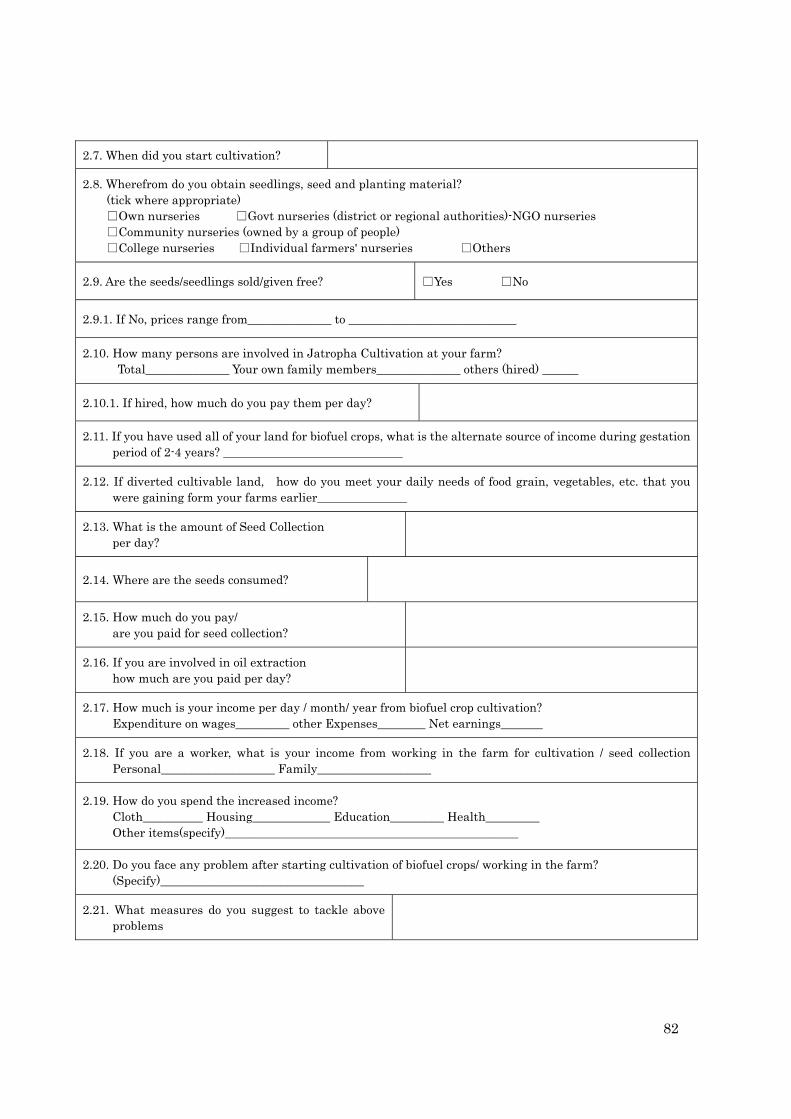
82
2.7. When did you start cultivation?
2.8. Wherefrom do you obtain seedlings, seed and planting material? (tick where appropriate)
□Own nurseries □Govt nurseries (district or regional authorities)-NGO nurseries □Community nurseries (owned by a group of people) □College nurseries □Individual farmers' nurseries □Others
2.9. Are the seeds/seedlings sold/given free? □Yes □No
2.9.1. If No, prices range from______________ to ____________________________
2.10. How many persons are involved in Jatropha Cultivation at your farm? Total______________ Your own family members______________ others (hired) ______
2.10.1. If hired, how much do you pay them per day?
2.11. If you have used all of your land for biofuel crops, what is the alternate source of income during gestation period of 2-4 years? ______________________________
2.12. If diverted cultivable land, how do you meet your daily needs of food grain, vegetables, etc. that you were gaining form your farms earlier_______________
2.13. What is the amount of Seed Collection per day?
2.14. Where are the seeds consumed?
2.15. How much do you pay/ are you paid for seed collection?
2.16. If you are involved in oil extraction how much are you paid per day?
2.17. How much is your income per day / month/ year from biofuel crop cultivation? Expenditure on wages_________ other Expenses________ Net earnings_______
2.18. If you are a worker, what is your income from working in the farm for cultivation / seed collection Personal___________________ Family___________________
2.19. How do you spend the increased income? Cloth__________ Housing_____________ Education_________ Health_________ Other items(specify)_________________________________________________
2.20. Do you face any problem after starting cultivation of biofuel crops/ working in the farm? (Specify)__________________________________
2.21. What measures do you suggest to tackle above problems

83
Ⅲ. OIL EXTRACTION AND BIODIESEL PRODUCTION STAGE
3.1. Status of Company (Govt., Pvt., Partnership, etc.)
3.2. Production Capacity (TPD) Installed_______________ Actual_____________
3.3. Technology available for biodiesel conversion (indigenous/ imported)
3.3.1. If imported, wherefrom?
3.4. What is the electricity consumption of the biodiesel plant, MWh/year
3.5. What is the fossil fuel consumption of the biodiesel plant, if any, tones/year? And what kind of fuel(s) (gas, coal, diesel, biodiesel, other:)?
3.6. What is the mass of methanol consumed in the biodiesel plant, tones/year?
3.7. Quality of Biodiesel produced (as per standards of)
3.8. Quality of by-products produced (as per standards of)
3.9. Raw Material Requirement per day__________ seed_________ oil____________
3.10. Type of Raw Material required Jatropha__________ Pongamia______________ Others (specify share of each)_________________________________________
3.11. Source of Raw Material (oil /seeds) (Owned/ Contract Farming/other)
3.11.1. If Owned / contract farming, areas under cultivation _______________________
3.12. Cost incurred per hectare / ton on raw material, if owned ___________________
3.13. Cost of Raw material per ton if purchased from market ______________________
3.14. Raw material available is just enough/ insufficient/ over supplied______________
3.15. No. of workers employed in Cultivation _______________wage per day________
3.16. No. of workers employed for Seed Collection__________ wage per day ________
3.17. No. of workers Employed in Oil Extraction_____________ wage per day _______
3.18. No. of workers Employed in Biodiesel Production______ wage per day _______
3.19. No. of workers Employed in Other Activities______ wage per day ___________
3.20. List the output (quantity and name like biodiesel & main by-products) ________________________________________________________________________ ________________________________________________________________________
3.21. Producing biodiesel for local market or exports____________________________
3.21.1. If exports, to which country (ies)_______________________________________
3.22. If for local market, how do you reach consumers (self/ through distribution chain, specify details)_______________________________________________________
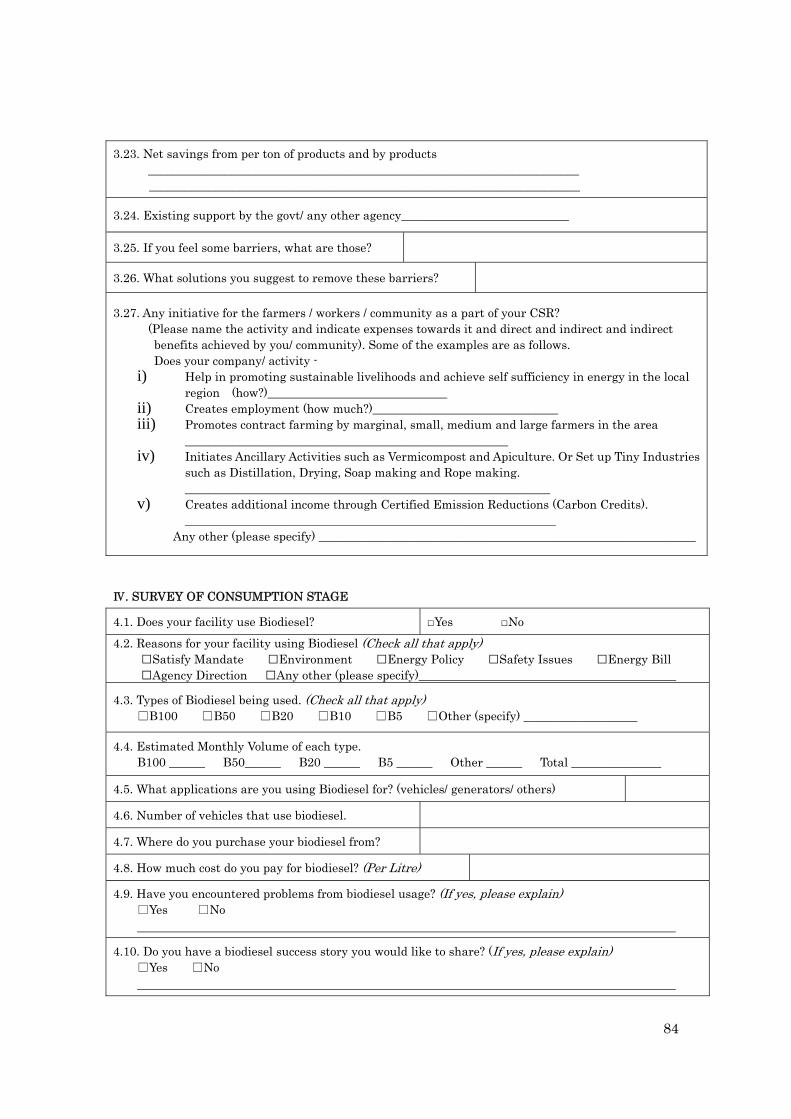
84
3.23. Net savings from per ton of products and by products ________________________________________________________________________ ________________________________________________________________________
3.24. Existing support by the govt/ any other agency____________________________
3.25. If you feel some barriers, what are those?
3.26. What solutions you suggest to remove these barriers?
3.27. Any initiative for the farmers / workers / community as a part of your CSR? (Please name the activity and indicate expenses towards it and direct and indirect and indirect benefits achieved by you/ community). Some of the examples are as follows. Does your company/ activity -
i) Help in promoting sustainable livelihoods and achieve self sufficiency in energy in the local region (how?)______________________________
ii) Creates employment (how much?)_______________________________ iii) Promotes contract farming by marginal, small, medium and large farmers in the area
______________________________________________________ iv) Initiates Ancillary Activities such as Vermicompost and Apiculture. Or Set up Tiny Industries
such as Distillation, Drying, Soap making and Rope making. _____________________________________________________________
v) Creates additional income through Certified Emission Reductions (Carbon Credits). ______________________________________________________________
Any other (please specify) _______________________________________________________________
Ⅳ. SURVEY OF CONSUMPTION STAGE
4.1. Does your facility use Biodiesel? □Yes □No
4.2. Reasons for your facility using Biodiesel (Check all that apply) □Satisfy Mandate □Environment □Energy Policy □Safety Issues □Energy Bill □Agency Direction □Any other (please specify)___________________________________________
4.3. Types of Biodiesel being used. (Check all that apply) □B100 □B50 □B20 □B10 □B5 □Other (specify) ___________________
4.4. Estimated Monthly Volume of each type. B100 ______ B50______ B20 ______ B5 ______ Other ______ Total _______________
4.5. What applications are you using Biodiesel for? (vehicles/ generators/ others)
4.6. Number of vehicles that use biodiesel.
4.7. Where do you purchase your biodiesel from?
4.8. How much cost do you pay for biodiesel? (Per Litre)
4.9. Have you encountered problems from biodiesel usage? (If yes, please explain) □Yes □No
4.10. Do you have a biodiesel success story you would like to share? (If yes, please explain) □Yes □No

85
Ⅴ. OTHER INFORMATION
5.1. Do you know about merits and demerits of biodiesel over petro-diesel? □Yes □No
5.1.1. If yes, what are those?
5.2. Is biodiesel available locally/ nearby easily?
5.3. Price of biofuel that you are paying________________________________________
5.4. Is government providing any help in Biodiesel promotion? □Yes □No
5.4.1. If yes, what are those?
5.4.2. If not, what do you expect?
5.5. Do you feel there is any change in Eco restoration and land degradation(preventing) due to use of biofuel crops cultivation______________________________________
5.6. Is any extra effort necessary for biofuel crop in comparison to other crop?
5.7. Do you see any change in rural electrification and energy security due to use of biofuel in your areas____________________________________________________
5..8. Any additional information that you may want to provide here, ____________________________________________________________________