GUIDELINES FOR SELECTION OF APPROPRIATE PEDESTRIAN...
26
GUIDELINES FOR SELECTION OF APPROPRIATE PEDESTRIAN CROSSING FACILITY AT MID-BLOCK SECTIONS Udit Jain Research Scholar Indian Institute of Technology Roorkee
Transcript of GUIDELINES FOR SELECTION OF APPROPRIATE PEDESTRIAN...
GUIDELINES FOR SELECTION OF
APPROPRIATE PEDESTRIAN CROSSING
FACILITY AT MID-BLOCK SECTIONS
Udit Jain
Research Scholar
Indian Institute of Technology Roorkee

Need of the Study
• Pedestrian fatalities highest in road users
• 90% fatalities in Kota & Mumbai at Mid-Block
• 75% pedestrian crashes due to no facility (UK)
• Remaining 25% due to improper facility
• In India, IRC 103: 2012 does not recommend the type of crossing facility to be provided
• Solution: Develop Pedestrian Crossing Warrant Guidelines for Indian Conditions

PV2 Based Warrants
• P – Peak Hour Pedestrian Volume (ped/hr)
• V – Peak Hour Vehicular Volume (veh/hr)
• PV2 based crossing warrants first introduced in
UK in 1987
• Also used in other countries like India and Iran

PV2 Based Warrants in UK
• Graphical Form
• PV2 thresholds –
PV2 = 1 x 10⁸
PV2 = 2 x 10⁸
• Recommends crossing
facilities
• Based on peak traffic
flows of 1980s

Adaptations of PV2 Based Warrants
• Several counties in UK modified this criteria after
LTN-1/95
• Maintains balance between PV2 & pedestrian
characteristics
• Uses factors like Age, Waiting Time, Gap Size to
suggest facilities based on Adjusted PV2 values
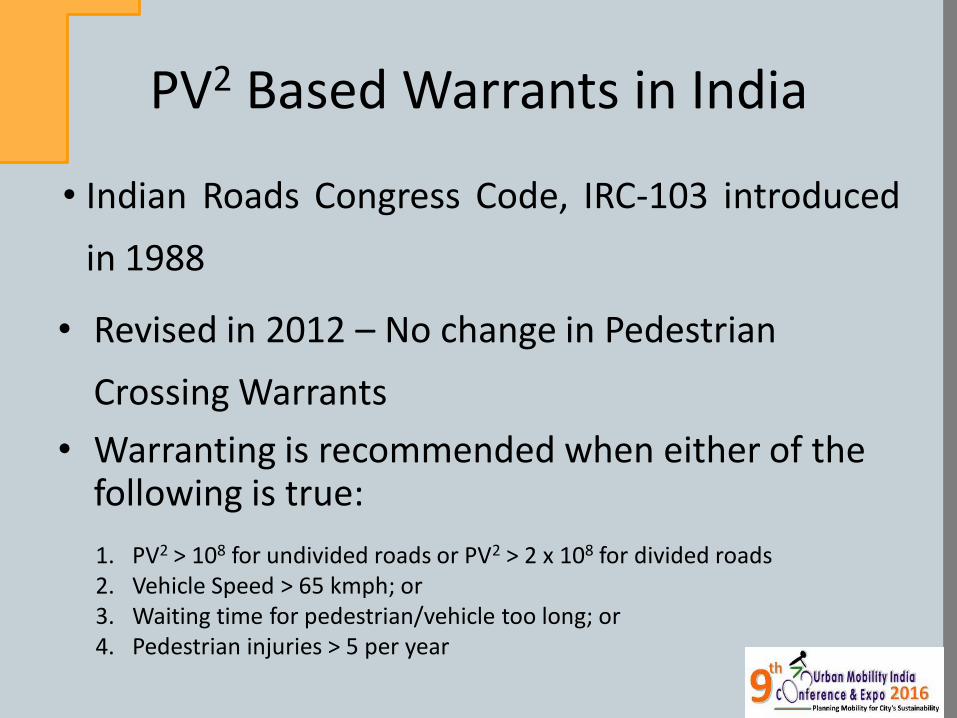
PV2 Based Warrants in India
• Indian Roads Congress Code, IRC-103 introduced
in 1988
• Revised in 2012 – No change in Pedestrian
Crossing Warrants
• Warranting is recommended when either of the following is true:
1. PV2 > 108 for undivided roads or PV2 > 2 x 10⁸ for divided roads 2. Vehicle Speed > 65 kmph; or 3. Waiting time for pedestrian/vehicle too long; or 4. Pedestrian injuries > 5 per year

PV2 Based Warrants in India
• Limitations –
Threshold values same as UK
No warrant chart or graph
No recommendation of facility type
Ambiguity in parameters used
Based on traffic flows of 1980s
• Need of revision of pedestrian crossing warrants

Objectives
• Develop warrants based on existing traffic flow
conditions
• Re-examine the existing threshold values of PV2
• Identify the type of crossing facilities to be
installed

Methodology
• Maximum Hourly Vehicle Flow (V)
• Maximum Hourly Pedestrian Flow (P)
– Critical Gap
– Follow Up Time
• PV2 Matrices - Upper Limits ‘P’ and ‘V’
• PV2 Values Data Set
• New PV2 Threshold Values
– Cluster Analysis
• Pedestrian Crossing Warrants

Data Requirements
1. Maximum Hourly Vehicle Flow (V)
– Vehicle Flow
– Vehicle Speed
2. Maximum Hourly Pedestrian Flow (P)
– Pedestrian Flow
– Critical Gap
– Follow up Time
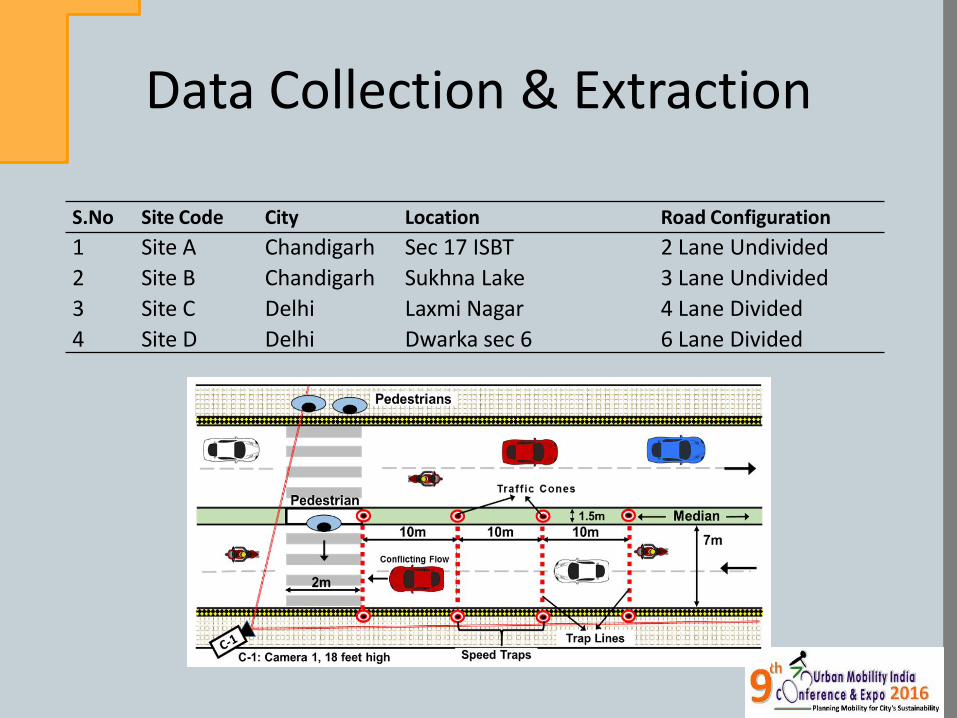
Data Collection & Extraction
S.No Site Code City Location Road Configuration
1 Site A Chandigarh Sec 17 ISBT 2 Lane Undivided
2 Site B Chandigarh Sukhna Lake 3 Lane Undivided
3 Site C Delhi Laxmi Nagar 4 Lane Divided
4 Site D Delhi Dwarka sec 6 6 Lane Divided

Data Collection & Extraction
• Videography with Trap markings
Aerial View of the Site

Data Collection & Extraction
• Frame by frame data extraction
Camera View of the Site

Max Hourly Vehicle Flow (V)
• Max Hourly Vehicle Flow using Greenshields
model
Site Code Roadway Configuration Max Hourly Vehicle
Flow (PCU/hr)
Site A 2 Lane 2 Way Undivided 3,018
Site B 3 Lane 2 Way Undivided 4,672
Site C 4 Lane 2 Way Divided 8,172
Site D 6 Lane 2 Way Divided 12,630
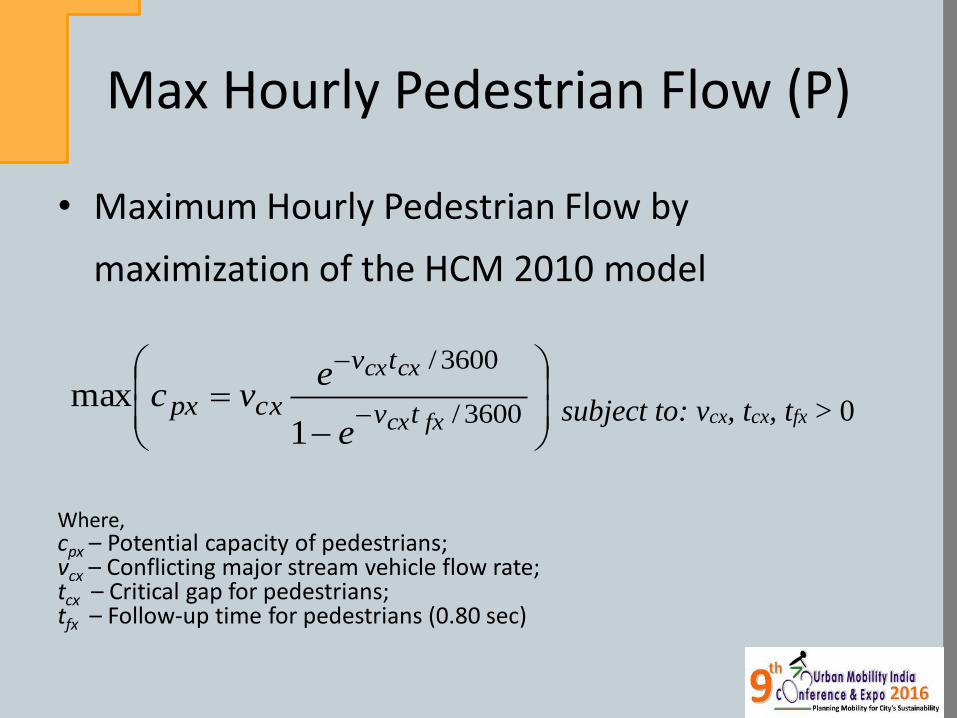
Max Hourly Pedestrian Flow (P)
• Maximum Hourly Pedestrian Flow by
maximization of the HCM 2010 model
Where, cpx – Potential capacity of pedestrians; vcx – Conflicting major stream vehicle flow rate; tcx – Critical gap for pedestrians; tfx – Follow-up time for pedestrians (0.80 sec)
3600/
3600/
1max
fxcx
cxcx
tv
tv
cxpxe
evc
subject to: vcx, tcx, tfx > 0

Critical Gap Analysis – Raff’s Method

Max Hourly Pedestrian Flow (P)
• Maximum hourly pedestrian flow ~ 4,500 ped/hr for all four road configurations
• Verification based on IRC:103 (2012)
– Pedestrian flow rate for high densities (LOS E) = 36 ped/min/meter
– For crosswalk width of 2 meters
– Maximum Hourly Flow similar to HCM estimates
3600/
3600/
1max
fxcx
cxcx
tv
tv
cxpxe
evc
subject to: vcx, tcx, tfx > 0

P\V 100 200 300 .. .. .. .. .. ‘V’
100 1.0.E+06 4.0.E+06 9.0.E+06 .. .. .. .. .. ..
200 2.0.E+06 8.0.E+06 1.8.E+07 .. .. .. .. .. ..
300 3.0.E+06 1.2.E+07 2.7.E+07 .. .. .. .. .. ..
.. .. .. .. .. .. .. .. .. ..
.. .. .. .. .. .. .. .. .. ..
.. .. .. .. .. .. .. .. .. ..
.. .. .. .. .. .. .. .. .. ..
.. .. .. .. .. .. .. .. .. ..
.. .. .. .. .. .. .. .. .. ..
.. .. .. .. .. .. .. .. .. ..
‘P’ .. .. .. .. .. .. .. .. PV2
PV2 Analysis – Matrices

PV2 Analysis – Clustering
• K-means clustering technique suitable for dense data sets (Wu et al., 2009)
• Number of clusters (k) identified using cluster validation indices
– Davies-Bouldin Index
– Silhouette Index
– Calinski-Harabasz Index
– Dunn Index
– R Squared Index
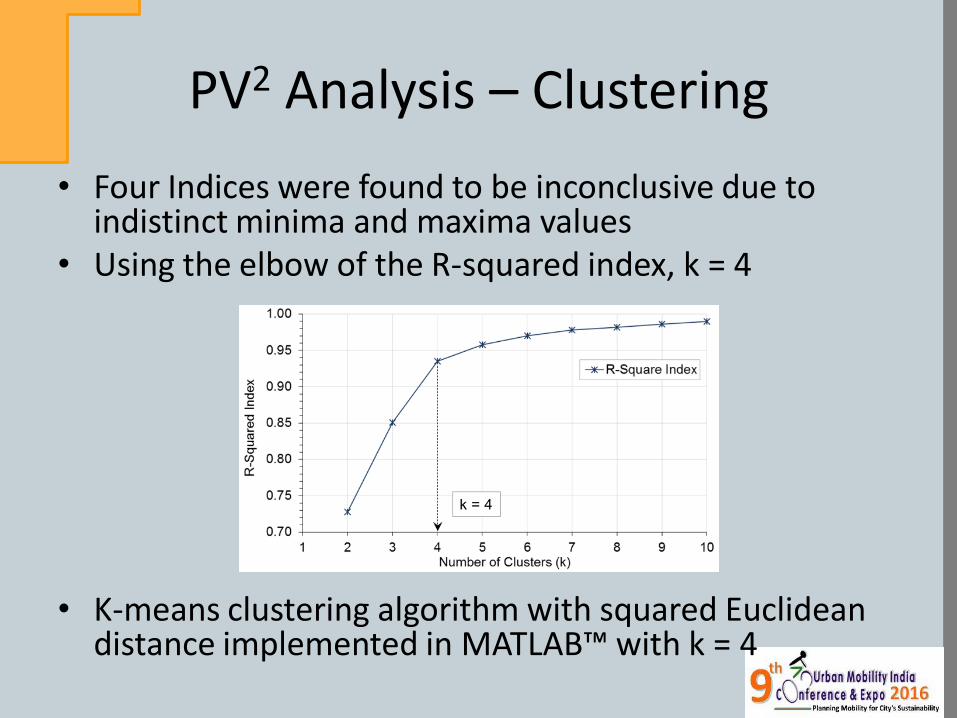
PV2 Analysis – Clustering
• Four Indices were found to be inconclusive due to indistinct minima and maxima values
• Using the elbow of the R-squared index, k = 4
• K-means clustering algorithm with squared Euclidean distance implemented in MATLAB™ with k = 4

PV2 Analysis – Clustering

PV2 Analysis – Clustering
Cluster 2-Lane
2-Way
4-Lane
2-Way
6-Lane
2-Way
8-Lane
2-Way
1 4.30 x 10⁹ 9.63 x 10⁹ 3.16 x 10¹⁰ 7.61 x 10¹⁰
2 1.44 x 10¹⁰ 3.24 x 10¹⁰ 1.07 x 10¹¹ 2.55 x 10¹¹
3 2.65 x 10¹⁰ 5.95 x 10¹⁰ 1.96 x 10¹¹ 4.68 x 10¹¹
4 4.09 x 10¹⁰ 9.09 x 10¹⁰ 3.00 x 10¹¹ 7.17 x 10¹¹
Crossing Facility** PV2 Value Ranges*
2-Lane 2-Way 4-Lane 2-Way 6-Lane 2-Way 8-Lane 2-Way
No Facility < 1.00 x 10⁸ < 1.00 x 10⁸ < 2.00 x 10⁸ < 2.00 x 10⁸
Zebra Crossing 1.00 x 10⁸ – 4.30 x 10⁹ 1.00 x 10⁸ – 9.63 x 10⁹ 2.00 x 10⁸ – 3.16 x 10¹⁰ 2.00 x 10⁸ – 7.61 x 10¹⁰
Zebra with Speed Table 4.30 x 10⁹ – 1.44x 10¹⁰ 9.63 x 10⁹ – 3.24 x 10¹⁰ 3.16 x 10¹⁰ – 1.07 x 10¹¹ 7.61 x 10¹⁰ – 2.55 x 10¹¹
Signal Controlled 1.44 x 10¹⁰ – 2.65 x 10¹⁰ 3.24 x 10¹⁰ – 5.95 x 10¹⁰ 1.07 x 10¹¹ - 1.96 x 10¹¹ 2.55 x 10¹¹ – 4.68 x 10¹¹
Grade Separated > 2.65 x 10¹⁰ > 5.95 x 10¹⁰ > 1.96 x 10¹¹ > 4.68 x 10¹¹
*Where ‘P’ is the Peak Hour Pedestrian Flow & ‘V’ is the Peak Hour Vehicle Flow of both directions
**It is recommended that the design specifications of these facilities should be as per IRC-103:2012

Warrant Charts

Application & Validation
Site Location Lanes P
(Ped/hr) V
(PCU/hr) PV2 Existing Facility Recommended Facility
A Sector-17 ISBT 2 Lane 4,080 1,276 6.55E+09 Unprotected Zebra w/ speed table
B Sukhna Lake Road 3 Lane 3,780 3,266 4.03E+10 Zebra Crossing Zebra w/ speed table
C Laxmi Nagar 4 Lane 2,760 7,248 1.45E+11 Zebra Crossing Signal Controlled
D Dwarka Sector-6 6 Lane 3,360 4,604 7.12E+10 Unprotected Zebra Crossing
E Prithviraj Road 4 Lane 1,760 4,286 3.23E+10 Signal Controlled Zebra w/ speed table
F Aurobindo Marg 6 Lane 3,960 8,061 2.57E+11 Signal Controlled Signal Controlled
G Old Fort 6 Lane 1,880 7,885 1.17E+11 Signal Controlled Zebra w/ speed table
H ITO PWD Headquarter 6 Lane 1,840 8,624 1.37E+11 Grade Separated Zebra w/ speed table
I Kotla Mubarakpur 6 Lane 1,260 7,422 6.94E+10 Grade Separated Zebra Crossing
J Anand Vihar ISBT 6 Lane 4,398 10,755 5.09E+11 Grade Separated Grade Separated

Limitations
• Warrants based on peak flows observed in India
• Factors like delay and gap size can also be explored as a part of the warrant criteria
Thank You
Provide appropriate crossing facilities to ensure pedestrian safety at crossing locations
Udit Jain
Research Scholar, IIT Roorkee