Guide for sensory analysis of fish and shellfish - · PDF fileNMKL PROCEDURE No 21 (2008)...
27
NMKL PROCEDURE No 21 (2008) Guide for sensory analysis of fish and shellfish Page: 1 (27) Version: 1 Date: 2008-02-26 Approved: Ole Bjørn Jensen NORDIC COMMITTEE ON FOOD ANALYSIS Guide for sensory analysis of fish and shellfish Contents Preface ...................................................................................... 2 1 Introduction...................................................................... 3 1.1 Fish .......................................................................... 3 1.1.1 Texture and muscle anatomy of fish .................. 3 1.1.2 Odour and flavour of fish .................................. 3 1.1.3 Differences between species .............................. 3 1.1.4 Differences between individuals........................ 3 1.2 Shellfish .................................................................. 3 1.3 Scales ...................................................................... 3 1.4 Off-flavours and taints ............................................ 3 2 Test room or testing areas ................................................ 3 3 Sensory analysis of seafood ............................................. 3 3.1 Preparation of fish samples ..................................... 3 3.1.1 Sample Cut ........................................................ 3 3.1.2 Replicates........................................................... 3 3.2 Preparation of heat treated samples......................... 3 3.2.1 Oven cooked ...................................................... 3 3.2.2 Cooked in water bath ......................................... 3 3.2.3 Steam cooked..................................................... 3 3.3 Different types of fish products............................... 3 3.3.1 Smoked fish ....................................................... 3 3.3.2 Marinated fish .................................................... 3 3.3.3 Salted fish and dry salted fish ............................ 3 3.3.4 Dried fish, stockfish ........................................... 3 3.4 Preparation of whole iced fish................................. 3 3.5 Preparation of shellfish samples.............................. 3 3.5.1 Prawns and shrimps ........................................... 3 3.5.2 Prawn broth........................................................ 3 4 Sessions ........................................................................... 3 4.1 Number of samples in a session .............................. 3 4.2 Palate cleanser between samples ............................. 3 5 Selection and training of assessors .................................. 3 5.1. Selection ........................................................................ 3 5.2. Training ......................................................................... 3 5.3. Attributes ....................................................................... 3 6 References........................................................................ 3
Transcript of Guide for sensory analysis of fish and shellfish - · PDF fileNMKL PROCEDURE No 21 (2008)...

NMKL PROCEDURE No 21 (2008)
Guide for sensory analysis of fish and shellfish Page: 1 (27) Version: 1 Date: 2008-02-26 Approved: Ole Bjørn Jensen
NORDIC COMMITTEE ON FOOD ANALYSIS
Guide for sensory analysis of fish and shellfish Contents Preface ...................................................................................... 2 1 Introduction...................................................................... 3
1.1 Fish.......................................................................... 3 1.1.1 Texture and muscle anatomy of fish.................. 3 1.1.2 Odour and flavour of fish .................................. 3 1.1.3 Differences between species.............................. 3 1.1.4 Differences between individuals........................ 3
1.2 Shellfish .................................................................. 3 1.3 Scales ...................................................................... 3 1.4 Off-flavours and taints ............................................ 3
2 Test room or testing areas................................................ 3 3 Sensory analysis of seafood............................................. 3
3.1 Preparation of fish samples ..................................... 3 3.1.1 Sample Cut ........................................................ 3 3.1.2 Replicates........................................................... 3
3.2 Preparation of heat treated samples......................... 3 3.2.1 Oven cooked ...................................................... 3 3.2.2 Cooked in water bath ......................................... 3 3.2.3 Steam cooked..................................................... 3
3.3 Different types of fish products............................... 3 3.3.1 Smoked fish ....................................................... 3 3.3.2 Marinated fish.................................................... 3 3.3.3 Salted fish and dry salted fish............................ 3 3.3.4 Dried fish, stockfish........................................... 3
3.4 Preparation of whole iced fish................................. 3 3.5 Preparation of shellfish samples.............................. 3
3.5.1 Prawns and shrimps ........................................... 3 3.5.2 Prawn broth........................................................ 3
4 Sessions ........................................................................... 3 4.1 Number of samples in a session .............................. 3 4.2 Palate cleanser between samples............................. 3
5 Selection and training of assessors .................................. 3 5.1. Selection........................................................................ 3 5.2. Training......................................................................... 3 5.3. Attributes....................................................................... 3
6 References........................................................................ 3

NMKL PROCEDURE No 21 (2008)
Guide for sensory analysis of fish and shellfish Page: 2 (27) Version: 1 Date: 2008-02-26 Approved: Ole Bjørn Jensen
Preface A working group established by the Nordic Committee on Food Analysis has elaborated this guide. Members
of the group come from Seafood Research Institutes, and have been working with sensory analysis of
seafood for several years.
The following persons participated in the project group:
Denmark: Grethe Hyldig, The Technical University of Denmark, National Institute of Aquatic Resources
(Project leader)
Norway: Mats Carlehög, Fiskeriforskning
Iceland: Emilia Martinsdóttir, Kolbrún Sveinsdóttir, Matís (Icelandic Food Research)
Finland: Leena Lilleberg, Finnish Food Safety Authority Evira
Furthermore, the members of NMKL Sub Committee 4 have been an advisory team for the project group.
Denmark: Anette K. Thybo, Camilla Bejerholm
Norway: Marit Rødbotten, Urd Bente Andersen, Per Lea, Steffen Solem
Iceland: Kristín Halldórsdóttir
Sweden: Halina Agerhem, Gunnar Forsgren
The guide is based on Nordic and international standards, as well as the many years of experience among the
members of the working group and Sub 4. The guide is focused on what one has to pay special attention to in
sensory analysis of fish and shellfish.
For inexperienced sensory analysts, NMKL Procedures 6, 12 and 14 are highly recommended as
supplements to this guide. Furthermore, if using the sensory analysis in quality control, NMKL Procedure 16
is recommended.
The procedure is available from: The General Secretariat of NMKL, N-0033 OSLO, NORWAY E-mail: [email protected] WEB: www.nmkl.org NMKL invites all readers and users of the procedure to submit comments and views on its contents to the General Secretariat of NMKL (address above).
© NMKL

NMKL PROCEDURE No 21 (2008)
Guide for sensory analysis of fish and shellfish Page: 3 (27) Version: 1 Date: 2008-02-26 Approved: Ole Bjørn Jensen
1 Introduction Sensory evaluation is applied in research, in quality control, in product development and in consumer
studies. Several conditions are unique for the sensory analysis of seafood. Seafood is a highly perishable
food with limited shelf life. The sensory changes which occur during the rather short shelf life of fish are
very rapid. The early sensory changes of fish after having been caught/slaughtered and during storage, are
most prominent in appearance and texture. The characteristic flavour and odour of the species is normally
developed during the first days of storage in ice.
When selecting and training assessors for sensory analysis, it is very important to be aware that some people
cannot (blind) taste rancid flavour, iodine, or geosmin, and some have a very low response to cold-storage
flavour and rancidity. Also, some people are allergic or hypersensitive to different fish-proteins, shellfish or
histamine.
Interpretation of the stimulus and response must be trained very carefully, in order to receive objective
responses. It is not difficult to give an objective answer to the question: Is the fish in rigor (completely
stiff)? However, more training is needed if the assessor has to decide whether the fish is in a post- or pre-
rigor state.
There are many different fish species and shellfish to cover, and many of them need a specific sensory
method to be evaluated. This guide, however, will only present the most common species and their methods.
1.1 Fish
Each species is identified by a scientific name consisting of two parts - the genus and the specific epithet
(binominal nomenclature). As an example, the scientific (species) name of the common cod is Gadus morhua.
Most fish become sexually mature when they reach a size characteristic of the species, and this is not necessarily
directly correlated with age. In general, this critical size is reached earlier in males than in females. Every year,
mature fish use energy to build up the gonads (the roe and milk). This gonadal development causes a depletion
of the protein and lipid reserves of the fish, since it takes place during a period of low or no food intake. The
length and occasion of the spawning season varies greatly between species.

NMKL PROCEDURE No 21 (2008)
Guide for sensory analysis of fish and shellfish Page: 4 (27) Version: 1 Date: 2008-02-26 Approved: Ole Bjørn Jensen
1.1.1 Texture and muscle anatomy of fish
Texture is one of the most important quality parameters for fish for producers, processors, and consumers.
Processors want a texture that makes the fish easy to process and gives good quality products with high yields all
year round.
The gross structure of fish muscle is different from that of meat muscle. The fish body trunk muscle is mostly
segmented, and each segment (myomere) is a disc that constitutes a separate muscle (Fig 1.). Myomeres are
mainly made up of fibres. These muscle fibres are single cells and during growth, it is the size of each muscle
cell that increases, rather than the number of muscle cells. Within each myomere, the muscle fibres run
approximately parallel to each other, and at the ends, they are inserted into broad sheets of connective tissue
known as myocommata. The myocommata are medially attached to the adjacent vertebrae, and laterally attached
to the skin. The muscle mass on each side of the fish makes up the fillet, of which the upper part is termed the
dorsal muscle and the lower part the ventral muscle.
Figure 1. The muscle is constructed of adjacent muscle blocks (myomeres), separated from each other by sheets
of collagenous tissue (myocommata).
NMKL PROCEDURE No 21 (2008)
Guide for sensory analysis of fish and shellfish Page: 5 (27) Version: 1 Date: 2008-02-26 Approved: Ole Bjørn Jensen
The most dramatic change is the onset of rigor mortis. Immediately after death, the muscle is totally relaxed and
the limp elastic texture usually persists for some hours, where after the muscle will contract. When it becomes
hard and stiff, the whole body becomes inflexible and the fish is in rigor mortis. This condition usually lasts for
a day or more, and then rigor resolves. The resolution of rigor mortis makes the muscle relax again and it
becomes limp, but no longer as elastic as before rigor. The rate in onset and resolution of rigor varies from
species to species, and is affected by temperature, handling, size and physical condition of the fish.
Measurements can be performed on whole fillets, different fillet cuts, and minces. Mincing the fish results in
lower coefficients of variation, but destroys the texture in a way that makes it impossible to say anything about
the texture of the intact fillet. Moreover, in cooked fish, the muscle segments tend to slide upon compression.
Fish generally has a flaky structure and during heating, the connective tissue that holds the flakes together,
disintegrates. This makes the fish muscle very fragile to any handling after cooking, and it separates easily into
flakes.
1.1.2 Odour and flavour of fish
At the beginning of their storage time, lean fish are generally described by sweet, boiled milk odours and
watery, metallic and meaty flavours when cooked. Fresh fatty fish are generally described by fatty odours,
like butter, fresh fish oil and margarine, but also meaty, slightly bitter or metallic flavours when cooked.
After 3-4 days, there is a loss of the characteristic odour and taste. The flesh becomes neutral, but has no
off-flavours. Later, depending on the species and the type of spoilage, there will be signs of spoilage and a
range of volatile, unpleasant-smelling substances are produced. One of the volatile compounds may be
trimethylamine (TMA) derived from the bacterial reduction of trimethyl-aminoxide (TMAO). TMA has a
very characteristic "fishy" smell. Other compounds develop flavours like sour, fruity and slightly bitter,
especially in fatty fish. During the later stages, a sickly sweet, cabbage-like, ammoniacal, sulphurous and
rancid smell develop. The texture becomes either soft and watery, or tough and dry.
1.1.3 Differences between species
Differences in the fish muscle have consequences for the commercial value due to the effect on shelf life. In
many fish species, most of the muscle is white or has a light colour, but depending on the species, many fish
will have a certain amount of dark tissue of a brown or reddish colour. The dark muscle is located just under

NMKL PROCEDURE No 21 (2008)
Guide for sensory analysis of fish and shellfish Page: 6 (27) Version: 1 Date: 2008-02-26 Approved: Ole Bjørn Jensen
the skin along the body side, and the proportion of dark muscle varies with the activity of the fish. An
example of a fish species with a high level of activity, such as the pelagic herring, can contain up to nearly
50% of dark muscle. The two muscle types, white and dark, are different in chemical composition, e.g. there
are higher levels of lipids and myoglobin in the dark muscle. From a technological point of view, the high
lipid content of the dark muscle is important and can give high intensities of desirable sensory attributes, but
a shorter shelf life due to lipid oxidation resulting in negative sensory properties such as train-oil and rancid
flavours.
Demersal species with a low activity level, such as cod, has a white, flaky and tender muscle, and here,
textural changes such as toughness and chewiness are the most noticeable problems during storage.
The reddish meat colour found in e.g. salmon and sea trout is due to the red carotenoid, astaxanthin. The
accumulation of pigment in the muscle functions as a depot needed at the time of spawning, when the male
develops a strong red colour in the skin, and the female transport carotenoids into the roe. It is clearly seen that
the muscle colour of salmonids fades at the time of spawning.
1.1.4 Differences between individuals
There are not only differences between species, but also a considerable variation between individuals. These
variations must be taken into account when designing experiments using sensory analysis to characterise fish
and fish products. In farmed salmon, for example, the lipid content can differ from 10 - 19% in fish from the
same farm.
Also, for herring there is a wide variation in lipid content within catches. A single catch can contain herring
with lipid contents ranging from 1 - 25%.
1.2 Shellfish
This is a broad term used for all aquatic animals that have a shell of some kind. Both saltwater and
freshwater invertebrates are considered shellfish. Shellfish is a misnomer, because these invertebrates are
definitely not fish. The term finfish is sometimes used to distinguish ordinary (vertebrate) fish from shellfish.
Shellfish are separated into two basic categories – crustaceans and molluscs.

NMKL PROCEDURE No 21 (2008)
Guide for sensory analysis of fish and shellfish Page: 7 (27) Version: 1 Date: 2008-02-26 Approved: Ole Bjørn Jensen
Crustaceans have elongated bodies and jointed, soft (crust-like) shells. The crustacean family includes crabs,
crayfish, barnacles, lobsters, prawns and shrimps.
Molluscs are invertebrates with soft bodies covered by a shell consisting of one or more pieces. Molluscs are
further divided into gastropods, bivalves and cephalopods.
A gastropod is often referred to as a univalve, and can be any of several molluscs with a single (univalve)
shell and single muscle. Among the more common gastropods are the abalone, limpet, periwinkle, snail and
whelk.
A bivalve is any soft-bodied mollusc, such as a clam, scallop, oyster or mussel, which has two shells hinged
together by a strong muscle.
The name cephalopod refers to a class of molluscs that includes the octopus, squid and cuttlefish. It is the
most biologically advanced type of molluscs. All cephalopods share two common characteristics - tentacles
attached to the head, and ink sacs, which they use to evade their predators.
As mentioned in the introduction, seafood is a highly perishable food with a limited shelf life. For shellfish,
this is even more relevant. The explanation for this is that the water, in which they normally live, contains a
large amount of bacteria. After harvesting, shellfish will naturally contain a large amount of bacteria in the
digestive system, and care must be taken in further storage and preparations.
Since shellfish includes such a variety of species, there are great variations in shellfish texture and muscle
anatomy, as well as other sensory descriptors such as odour and flavour. In the following, no specific aspects
of the analysis of shellfish will be touched upon. Instead, the reader is referred to specialist literature on
shellfish.
1.3 Scales
Different types of scales can be used, the most common being the line scale and the 9-point scale or the 5-
point scale of quality scoring, but these scales are not specific to sensory analysis of seafood. Scales specially
designed for seafood testing are the Torry scale and the category scale used in the Quality Index Method
(QIM), and the grading in the EU scheme.

NMKL PROCEDURE No 21 (2008)
Guide for sensory analysis of fish and shellfish Page: 8 (27) Version: 1 Date: 2008-02-26 Approved: Ole Bjørn Jensen
The EU scheme consist of three quality levels: E (Extra), A, and B, where E is the highest quality and B is
the level where fish is unfit for human consumption. In the EU scheme, differences between species are not
taken into account, as it only uses general parameters, and there are also problems with mixing subjective
and objective sensory terms in the scheme.
The Quality Index Method (QIM) is based on significant sensory parameters for whole fish using many
weighted parameters and a score system assigning from 0 to 3 demerit points. The scores for all the
characteristics are summed to give an overall sensory score, the so-called Quality Index (QI). If a score for
one of the parameters is missing, it is not possible to calculate the total sum and thereby the QI for the
assessed fish. If this situation occurs (for example if damaged eyes make it impossible to assess this
attribute), the best way to deal with it is to leave that particular fish out and take another sample. The QIM
gives scores of zero for very fresh fish and an increasingly larger total result as the fish deteriorate
(Martinsdottír et al 2001). Several studies have shown that the Quality Index Method (QIM) has proven to be
more reliable in assessing sensory changes on different fish species, compared to the EU grading scheme.
The Torry scale is a 10-point scale developed for cooked fish samples. The score 10 is given for very fresh
taste and odour, and the score 3 is given for spoiled samples. It is considered unnecessary to have
descriptions for scores below 3, as the fish is then not fit for human consumption. The average score of 5.5
may be used as the limit for consumption. The Torry scale has been developed for lean, medium fat and fat
fish species.
Colour can be very important for seafood, and for assessing colour, it is helpful to use standards, such as the
natural colour system NCS® or, for smoked salmon, the SalmoFanTM ruler from Roche.
1.4 Off-flavours and taints
Occasionally, wild and farmed fish contain off-flavours. In certain areas, this is a fairly common
phenomenon. Several of these off-flavours can be attributed to their feeding on different compounds or
organisms. A very well known off-flavour is the muddy-earthy taint in many freshwater fish. This flavour is
mainly caused by two compounds: geosmin and 2-methyl-iso-borneol, which also are parts of the chemical
profile of wine with cork flavour. Geosmin is detectable in concentrations of 0.01-0.1 µg/L. An iodine-like

NMKL PROCEDURE No 21 (2008)
Guide for sensory analysis of fish and shellfish Page: 9 (27) Version: 1 Date: 2008-02-26 Approved: Ole Bjørn Jensen
flavour is found in some fish and shrimp species in the marine environment. This is caused by volatile
bromophenolic compounds.
Oil taint may be found in fish flesh in areas of the world where offshore exploitation of oil is intensive, or in
areas where large oil spills occur. The fraction of the crude oil that is soluble in water is responsible for the
off-flavours.
2 Test room or testing areas There are international and national standards and guidelines for the design and construction of sensory
assessment rooms (ISO 8589, 1988; ISO 8586-1, 1993; ISO 11035, 1994; NMKL Procedure No. 6, 1998;
Meilgaard et al, 2001). The recommendations in these publications are intended for establishments or
situations where sensory evaluation is a major activity, e.g. R & D laboratories of food companies and
research institutes.
Sensory evaluation of whole fish is generally carried out by trained assessors in the reception or processing
halls of fish factories, or at auction sites. In quality control procedures, special facilities or rooms are
preferred for sensory evaluation, but this is not always possible. In the industry in general, and at auctions,
the testing area should adhere to the ISO 8589 standard as closely as possible.
3 Sensory analysis of seafood Sampling for sensory analysis must be as representative as possible, and therefore consideration must be
given not only to how and where the samples are cut, but also to the effect of the chosen method for heat
treatment. The preparation must have a minimal sensory impact on the “innate” characteristics of the
samples.
The following chapters contain examples of preparation methods for sensory analysis.

NMKL PROCEDURE No 21 (2008)
Guide for sensory analysis of fish and shellfish Page: 10 (27) Version: 1 Date: 2008-02-26 Approved: Ole Bjørn Jensen
3.1 Preparation of fish samples
For information on the design of sampling procedures, see NMKL Procedure No. 12 (2002), and CAC/GL
50-2004.
If the fish is frozen post rigor, the thawing should be as quickly as possible, e.g. under running tap water (8-
10 °C). But if the fish has been frozen pre-rigor, it is necessary to thaw the fish slowly and carefully (Nielsen
and Jessen, 2007).
3.1.1 Sample Cut
Samples from large fish species such as cod, salmon and saithe, are cut from the loin part in 8 x 4 x 2 cm
pieces each weighing approximately 50 - 75 g. Smaller fish species such as rainbow trout, herring and plaice,
require a whole fillet, which give samples of approximately 40 – 50 g for plaice and herring, and
approximately 75 – 100 g for rainbow trout.
For fat fish species, it is important to consider if the samples should be with or without skin. The dark muscle
is right under the skin, and if the fillets are skinned, some of the dark muscle will be removed. This may have
significant influence on rancid flavour due to the high lipid content in the dark muscle.
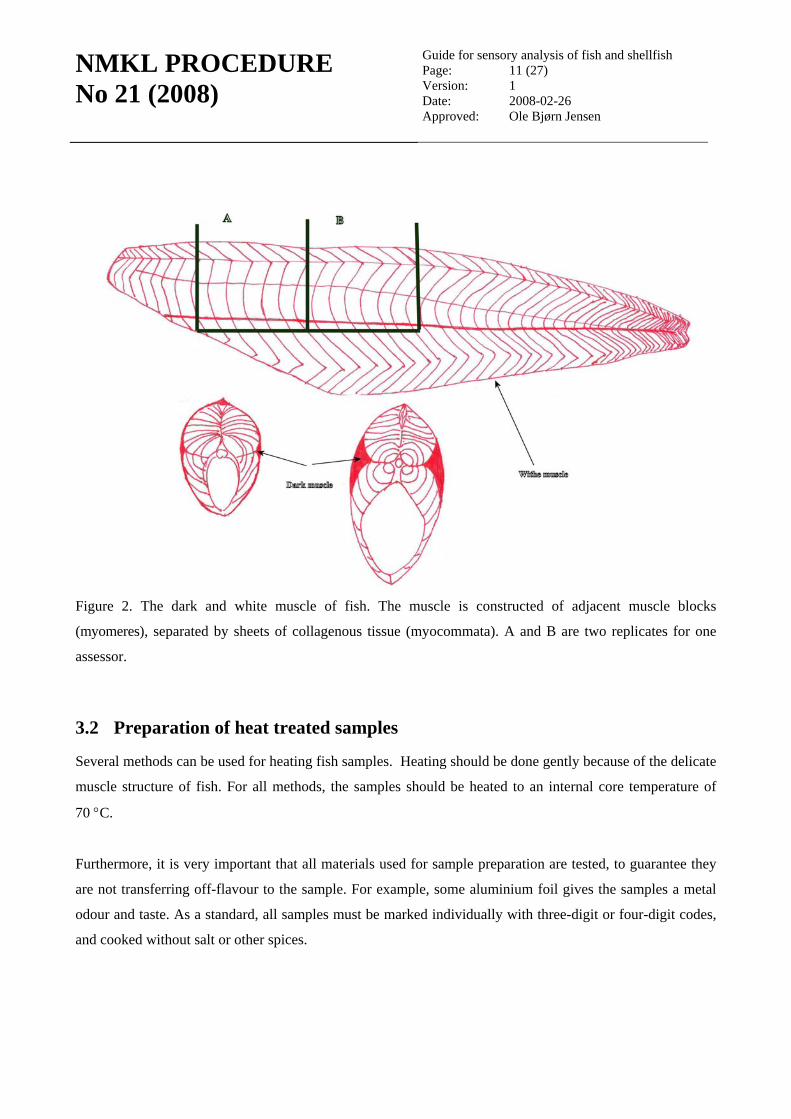
Loin samples are cut from the dorsal muscle, and cutlet samples across the whole fish as shown in Figure 2.
3.1.2 Replicates
Replicates can be created on batch level or individual level, depending on which possibilities are available
and on which level one wants the replicates to be. On batch level, all samples are mixed and it is not possible
to say which sample comes from which fish. For replicates on individual level, each assessor has to evaluate
samples from the same position of each fillet (Fig. 2). In this way, it is possible to have a replicate on
individual assessor level, and it may be possible to identify whether there are any differences between
assessors, or between samples from different parts of the fish.
If the texture is of no importance, it is possible to make minced fish samples to eliminate the differences
between individuals.
NMKL PROCEDURE No 21 (2008)
Guide for sensory analysis of fish and shellfish Page: 11 (27) Version: 1 Date: 2008-02-26 Approved: Ole Bjørn Jensen
Figure 2. The dark and white muscle of fish. The muscle is constructed of adjacent muscle blocks
(myomeres), separated by sheets of collagenous tissue (myocommata). A and B are two replicates for one
assessor.
3.2 Preparation of heat treated samples
Several methods can be used for heating fish samples. Heating should be done gently because of the delicate
muscle structure of fish. For all methods, the samples should be heated to an internal core temperature of
70 °C.
Furthermore, it is very important that all materials used for sample preparation are tested, to guarantee they
are not transferring off-flavour to the sample. For example, some aluminium foil gives the samples a metal
odour and taste. As a standard, all samples must be marked individually with three-digit or four-digit codes,
and cooked without salt or other spices.

NMKL PROCEDURE No 21 (2008)
Guide for sensory analysis of fish and shellfish Page: 12 (27) Version: 1 Date: 2008-02-26 Approved: Ole Bjørn Jensen
3.2.1 Oven cooked
Samples are placed in individual porcelain bowls and covered with porcelain lids, and then heated in a
convection oven in their own juice. Or, samples are placed in aluminium boxes and cooked at 95 – 100 °C in
a pre-warmed oven (Convotherm Elektrogeräte GmbH, Eglfing, Germany or equivalent) with air circulation
and steam.
3.2.2 Cooked in water bath
In general, 1.5 cm thick cutlets or loin parts are packaged in diffusion tight plastic bags under vacuum, and
placed in a water bath at a temperature of approximately 85 °C.
3.2.3 Steam cooked
Wrap all samples in aluminium foil, which is tested for off-flavours, and place them on a wire rack
suspended over boiling water. Or, cook individually packed fish medallions of approx. 100 g in boiling bags
or aluminium foil over boiling water in a steam kettle.
3.3 Different types of fish products
Different types of fish products require different methods for sample preparation. The following chapters
contain some examples of various types of processed fish.
3.3.1 Smoked fish
When profiling samples of smoked fish, it is necessary to decide at which temperature the samples should be
assessed, and how to cut the samples. Cold smoked salmon can be cut into 0.5 cm thick slices at a right angle
to the fillet surface. This gives a part of the dorsal muscle and also a part of the belly flap. The samples are
then served in Petri dishes at room temperature. Hot smoked salmon can be served as a fraction from the
anterior, mid-dorsal part of the fillet at room temperature. If cooled smoked samples are sliced, each slice
can be individually repacked in aluminium foil or in Petri dishes, and then be served to the assessors.

NMKL PROCEDURE No 21 (2008)
Guide for sensory analysis of fish and shellfish Page: 13 (27) Version: 1 Date: 2008-02-26 Approved: Ole Bjørn Jensen
3.3.2 Marinated fish
Assessing marinated fish is demanding due to the intense flavour of the brine, and this is necessary to take
into account when deciding how to serve the samples. The following procedure is suggested for herring
(Clupea harengus) that are marinated in a solution of 7% acetic acid and 16% salt (1.5 parts herring to 1 part
brine) and stored in plastic containers at 2 °C for a minimum of 4 weeks. Before sensory analysis, it is most
important that the samples are dewatered in a 1% salt solution for 2 days at 2 °C (1 part herring to 1 part
brine). The middle part of the fillet is cut into two pieces (approx. 10-15 g each), and served in replicate to
the same assessor. The samples are served (skin side up) in porcelain trays with lids.
3.3.3 Salted fish and dry salted fish
The main difference between these two products is that after they have both been salt-matured, dry salted
fish is dried to water content below 50%. The most common species used is cod, saithe, ling and tusk. Both
products have to be desalted prior to consumption. The desalting process is influenced by a whole range of
factors, but the main goal is to get the desired concentration of salt in the final product. The salty taste of a
product with 0.4% salt is easily detectable, but a product with 2.0% salt content has a very strong salty taste
which may predominate over other flavour characteristics of the product. A salt content of around 1.0
(±0.3)% is most commonly desired.
The most important factors influencing the desalting process are: water temperature, proportion of fish to
water, number of times the desalting water is changed, total time the fish is immersed in water, desalting
with or without the skin, and whether or not the fish is cut into smaller pieces. Figure 3 describes a
commonly used standard method for dry salted fish. It is developed in order to achieve a salt content of the
samples which is as even as possible. The method can be used on salted fish as well, but these samples will
be ready earlier in the desalting process. Start by removing the skin and cutting the fish into smaller pieces,
2-4 cm wide. Then put the samples on a net or a grate that holds them 2-4 cm above the bottom of the
container. For further instructions, follow the description in Figure 3.

NMKL PROCEDURE No 21 (2008)
Guide for sensory analysis of fish and shellfish Page: 14 (27) Version: 1 Date: 2008-02-26 Approved: Ole Bjørn Jensen
Figure 3. A description of a commonly used standard method for dry salted fish.
If any doubts occur during the process, it is recommended to simply taste the salt content. After desalting, the
samples can be prepared according to described procedures in chapter 3.2.
3.3.4 Dried fish, stockfish
Dried fish is a varied product, produced from a range of different fish species (catfish, haddock, cod, pollock,
blue whiting or halibut), and can either be consumed dry as a snack, or be re-hydrated and used in warm
dishes.
1 change of water. Use water at a temperature of 10 °CProportion fish to water = 1:7Stored in a refrigerator at 10 °C
Samples are put in water at a temperature of 10 °CProportion fish to water = 1:7Stored in a refrigerator at 10 °C
2 change of water. Use water at a temperature of 10 °CProportion fish to water = 1:7Stored in a refrigerator at 10 °C
Ready after 48 hours of desalting
3 change of water. Use water at a temperature of 10 °CProportion fish to water = 1:7Stored in a refrigerator at 10 °C
Day 0 at 08:00
Day 1 08:00
Day 1 14:00
Day 2 08:00
Day 0 at 14:00

NMKL PROCEDURE No 21 (2008)
Guide for sensory analysis of fish and shellfish Page: 15 (27) Version: 1 Date: 2008-02-26 Approved: Ole Bjørn Jensen
Species used for dry consumption are wolffish, haddock, cod, pollock, blue whiting and halibut, and these
can be dried using various methods. Prior to drying, the fish is often salted, and a salt content of 1.5-2.0% is
common in the end product, though approx. 4% is not unusual. This product is generally packed as whole
fillets with or without skin. The fillets are deskinned and cut into pieces, each sample being approx. 6 cm
long and 2-3 cm wide, before being served to the assessors. A variation of this product is fish mince that has
been formed and dried into pieces/cubes of approx. 2 x 2 x 1 cm3 (without skin). Two cubes should be served
as one sample to each assessor. The samples are served dry at room temperature in containers with lids.
The most common species of dried fish used for warm dishes, are cod and saithe. The drying process can
either be performed the traditional way outside during winter or inside in an industrial dryer the whole year
round. The finished product has to be rehydrated before consumption. This is a time-consuming and
complicated process, which requires knowledge and skill by the person doing it. One possible method is the
following: Leave the fish in a container filled with pure water for 8 days and keep it in a cool place at
2 – 4 °C. Change the water daily, and clean the fish by removing the skin, big and smaller bones, and
discoloured or diverging muscle. After re-hydration, the samples can be prepared according to the described
procedures in chapter 3.2.2.
3.4 Preparation of whole iced fish
The panel leader prepares the evaluation by assigning the fish samples three-digit codes to avoid bias, and
places the fish in random order on a table. The assessors must not see the samples being placed on the table.
The samples are kept cool either by placing them on a cooling plate or on ice. The boxes from which the
samples have been taken, must also be removed from the testing area, because this might enhance
expectation error. The order of presentation should be random and balanced. The assessors must be told in
which order they should evaluate the samples.
3.5 Preparation of shellfish samples
The next chapters contain examples of the most common shellfish. Unit sizes may vary within the same type
of shellfish, necessitating special considerations. Take shrimps, which can vary so much in size that the
largest can be assessed in one mouthful, whereas others are so small, the assessors need several to make up
one mouthful. As a general advice, shrimps should be assessed three or four at a time.

NMKL PROCEDURE No 21 (2008)
Guide for sensory analysis of fish and shellfish Page: 16 (27) Version: 1 Date: 2008-02-26 Approved: Ole Bjørn Jensen
3.5.1 Prawns and shrimps
Frozen raw prawns and shrimps must either be thawed for 1 hour at room temperature before cooking, or
they can be added directly to the boiling water (depending on the size). Cooking time in fresh boiling water
is 3 min. After cooking, the prawns/shrimps are drained, cooled with cold water, peeled and kept at 7-10°C
until serving the same day.
3.5.2 Prawn broth
If the aim is to make a sensory profiling of whole prawns, it is possible to make a broth where both shell and
meat are assessed at the same time. Frozen prawns, for example kuruma prawns (Penaeus monodon) or
black-tiger prawns (Penaeus monodon), are thawed, and 190 g meat and/or 30 g shell are cut into 1 cm
pieces. After adding 400 ml of deionised distilled water, the mixture is boiled for 30 min. The broth is
obtained by filtering the boiled mixture through three layers of cotton gauze. The broth is divided into 35 ml
portions, and preserved in 50 ml glass vials at ca. 50°C shortly before sensory evaluation.
4 Sessions It is important to serve the heated samples warm and in containers with lids or covers. In this way, the
assessors get the full impression of the odour immediately after opening the container. When samples are
cooked in closed plastic bags, odour attributes are assessed immediately after opening the vacuum bags,
while flavour and texture are evaluated after removing the samples from the bag. All samples must be served
to each assessor in a randomised order, thus making the possible carry-over effects parts of the random error.
In storage experiments, extra samples can be included in each sensory session in a randomised order, to
prevent the assessors from presuming that it is a storage experiment and therefore guessing the sensory
scores instead of assessing them. If the samples are from farmed fish, it is possible to overcome this problem
by planning the time of slaughter. The degree of freshness of the extra samples should differ between
sensory sessions, and data from these samples should not be included in the statistical analysis.
Hunger or satiation can influence the performance of the assessors. The assessors must not eat or smoke
during the last hour prior to the sensory evaluation. The assessors must be quiet and focused during the
evaluation.

NMKL PROCEDURE No 21 (2008)
Guide for sensory analysis of fish and shellfish Page: 17 (27) Version: 1 Date: 2008-02-26 Approved: Ole Bjørn Jensen
During evaluations with continuous assessment of odour, assessors become insensitive to the odours after
some time. People become de-sensitised to odours as the receptors in the olfactory senses become saturated.
Therefore, it is necessary to rest and breathe fresh air between samples when evaluating odour. Also, by
taking a deep breath, the airflow through the olfactory senses increases, and the odour becomes easier to
detect. It is important to give the assessors a short break - 1 to 3 min - between each sample.
The assessor must evaluate all the parameters involved in the scheme (he/she cannot determine which
parameters are most important).
4.1 Number of samples in a session
The number of samples for each session depends on the number of attributes evaluated and the type of
product served. For samples with high intensity of flavours, such as cold or hot smoked samples, the
assessors may get tired after four samples, but for cooked samples without any spices added, the assessors
can evaluate up to six or eight samples, depending on the number of attributes evaluated, within one session.
If there are many attributes, it is necessary to reduce the number of samples in each session.
4.2 Palate cleanser between samples
Depending on which products/species the samples are taken from, different cleaning items can be used to
dissipate residual flavours and particles between evaluations. Table 1 shows suitable palate cleaners.
Table 1. Palate cleaners.
Types of samples Liquid Solid
Cooked samples Tasteless tap water or distilled
water at room temperature
Unsalted crackers or crisp bread
Smoked samples Tasteless tap water, diluted apple
juice or mineral water
Neutral bread
Samples with high lipid content or
strong flavours
Tasteless tap water at 45-50 °C Neutral bread
Samples with off-flavour or taint Citric acid (0.03% solution) Unsalted soda crackers, pieces of
apple

NMKL PROCEDURE No 21 (2008)
Guide for sensory analysis of fish and shellfish Page: 18 (27) Version: 1 Date: 2008-02-26 Approved: Ole Bjørn Jensen
5 Selection and training of assessors
5.1. Selection
Assessors must be selected based on their ability to evaluate appearance, colour, odour and texture.
Assessors must also be healthy and possess normally sensitive taste and odour senses (ISO 8586-1 1993; ISO
11035 1994). Special consideration must be given to a number of factors: the assessors must not be afraid of
fish bones; some flavours are very special, e.g. iodine (from bromophenols) and muddy flavours (from
geosmin or 2-methyl-iso-borneol) and must be known to the assessors. Personal characteristics are also very
important, such as conscientiousness and accuracy, and they must be able to work in a group without
disturbing the other assessors with noises, talking or grimacing.
5.2. Training
Interpretation of the stimulus and response must be trained very carefully in order to receive objective
responses. It is not difficult to give an objective answer to the question: Is the fish in rigor (completely
stiff)? However, more training is needed if the assessor has to decide whether the fish is post- or pre-rigor.
Training is essential as it provides the assessors with a common vocabulary, thus decreasing the risk of
different quantitative and qualitative interpretations of descriptors (ISO 8586-1, ISO 11035). Furthermore,
continuous training during long-term projects, preferably using reference material, can reduce the risk of
drifting. By serving the same product as a reference before each session, assessors can recapitulate the
descriptors easily, and are able to recalibrate their evaluations to the same scale. The additional use of coded
reference samples served together with the actual samples makes it possible to monitor the performance of
the panel.
For validation of assessors, see NMKL Procedure No. 14.
5.3. Attributes
Criteria for the selection of attributes, which can discriminate between samples, must be relevant to the
specific seafood, non-redundant, and cognitively clear to the assessors. To be cognitively clear and to be able

NMKL PROCEDURE No 21 (2008)
Guide for sensory analysis of fish and shellfish Page: 19 (27) Version: 1 Date: 2008-02-26 Approved: Ole Bjørn Jensen
to make references samples, it is necessary to have a definition of the sensory attribute. Reference samples
for the different attributes are not only found in seafood samples, but are also often of different origin, such
as cucumber and boiled potato. Another example is the sensory attribute warm milk. Here it is important to
know that milk should only be heated and not boiled, as a sulphurous odour develops when milk boils.
Table 2 contains a description of the appearance, odour and flavour/taste attributes described in literature.
Table 2. Description of some sensory attributes
Attribute Definition Appearance
Flaky - Visible flakiness of steak when cut with a knife - Tissue parts into flakes by pressing with fork Fat droplets in water - Quantity and size of fat droplets in the liquid Shiny - Gloss of tissue caused by oil Discolouration - Colour distribution uneven or defective colour Gaping - Flakes between the raw muscle segments Mucus, cloudy mucus - Mucus on the outer surface of the sample
- Related to the deterioration of the fish - Mucus turns cloudy and opaque with time
Shrunken - Surface of the sample is wrinkled Freezer burn - Spots and damages on the surface of the sample caused by freezing
process Bruises - Bruises in the flesh caused by the handling of the fish Parasites, changes caused by parasites
- Parasites in the sample - Changes in the inner and outer surfaces of the sample caused by parasites
Odour Attribute Definition Acid - Vinegar Amine - A solution of trimethylamine Cucumber-like - Grated cucumber Earthy - Intensity of any earthy/peaty odour Farmyard - Intensity of manure/cow-dung odour Fish oil - Intensity of oily (fish oil) odour Fishy - Trimethylamine crystals (marine fish off-odour notes) Green - Green aroma as in plants Green aroma - Freshly cut grass Medicine - Dentist, chemical Metallic - Warm metal, blood Muddy - Earthy odourant 2-methylisoborneol Rancid - Rancid fish, painty, varnish Rotten seaweed - Rotten seaweed Seaweed - Fresh seaweed Sewage - Smell of sewage

NMKL PROCEDURE No 21 (2008)
Guide for sensory analysis of fish and shellfish Page: 20 (27) Version: 1 Date: 2008-02-26 Approved: Ole Bjørn Jensen
Sour - Sour dishcloth, sour socks - Fermented
Sourish - Acidic, acetic acid, citric acid Sweet - Sucrose-like Odourless/neutral - Related to the deterioration of the fish
- Loss of the characteristic odour Foreign odour - Odour foreign to the sample Uncharacteristic - Odour atypical to the sample Hydrogen sulphide Ammoniacal
- Associated with the deterioration of the sample - Sulphurous, like rotten eggs
Flavour/taste Attribute Definition Acidulous - Fruity acid-like flavour Bitter - Quinine- or caffeine-like Earthy flavour - Intensity of any earthy/peaty flavour Farmyard flavour - Intensity of manure/cow-dung flavour Fishy flavour - Intensity of any other fish-like flavours Metallic - Warm metal, blood
- Flavour associated with metal Musty - Flavour associated with damp earth Oily - Intensity of fish oil flavour Rancid - Rancid fish, paint, varnish Salty - Intensity of salt-like flavour Smoky - Intensity of smoky flavour Sourish - Acidic, acetic acid, citric acid Sweet - Sucrose-like Tasteless/neutral - Related to the deterioration of the fish (phase 2)
- Loss of characteristic flavour Chemical/medicine - Flavour of chemicals /medicine Pine soap - Flavour of pine soap Watery - Water like
- Weak Alkaline - Lye-like
- NaOH Foreign - Foreign flavour to the sample Uncharacteristic - Atypical flavour to the sample Feedy - Flavour of feed Decomposed - Spoiled flavour
Table 3 contains a description of the texture attributes used in literature.

NMKL PROCEDURE No 21 (2008)
Guide for sensory analysis of fish and shellfish Page: 21 (27) Version: 1 Date: 2008-02-26 Approved: Ole Bjørn Jensen
Table 3. Description of some texture properties evaluated using sensory analysis
Property Definition - Resistance to breakdown on chewing to a state suitable for swallowing
- The force required to compress the sample between the molar teeth or with the front teeth
Firmness/ Hardness
- The force required to compress the material between the molar teeth, or between the tongue and the palate
- The force required to compress a substance between the molar teeth (in the case of solids) or between the tongue and the palate (semisolids)
Elasticity/ Springiness
- The ability of the material to return rapidly to its original shape after deformation. Judged by compressing the substance slightly between the molars, or between the tongue and the palate, and noting to what extent the material returns to its original shape.
- Degree to which the sample sticks to the mouth surface Adhesiveness - Force required to remove the material that adheres to the mouth during the normal eating process - Number of chews required to prepare the sample for swallowing Chewiness - Length of time to prepare sample for swallowing
Tough - The sample remains in one lump after several chewings - The sensation of a progressive increase of free fluids in the oral cavity during mastication
- Amount of juice released during mastication with molars
Juiciness
- Increase in free liquids in mouth during mastication - The initial impression of moistness (free water, flavour juices, liquid fat, oil, and
saliva) of the sample on initial chewing (1, 2, or 3 chews) - The total impression of succulence in the mouth just prior to swallowing Moistness - The perceived degree of oil and/or water in the sample during chewing Greasiness - Sensation of fattiness in the mouth Oiliness - Degree to which oil is perceived after chewing Flaky/ Flakiness
- The sample parts into flakes by pressing with fork or with the tongue against the palate
Fibrousness - Impression of fibres in the sample during chewing Gelatinous, jelly-like - Sensation of gelatin or jelly in the mouth during chewing Mealy
- Impression of meal or powder in the sample during chewing
Crumbly - Describes a brittle or friable structure that tends to fall apart when chewing or bending the sample with a finger

NMKL PROCEDURE No 21 (2008)
Guide for sensory analysis of fish and shellfish Page: 22 (27) Version: 1 Date: 2008-02-26 Approved: Ole Bjørn Jensen
6 References Anon. 1995. Multilingual Dictionary of Fish and Fish Products. Dictionnaire Multilangue des Poissons et Produits de la Pêche. 4th edition. OECD/OCDE. Fishing News Books. Anon. 1996. Council Regulation (EC) No. 2406/96 of 26. November 1996 laying down common marketing standards for certain fishery products. Official Journal of the European Communities, No. L334:1-14. Anthoni U, Borresen T, Christophersen C, Gram L and Nielsen PH. 1990. Is trimethylamine oxide a reliable indicator for the marine origin of fishes. Comparative Physiology and Biochemistry 97B:569-571. Bech AC, Kristensen K, Juhla HJ and Poulsen CS. 1997. Development of farmed smoked eel in accordance with consumer demands. In Seafood from Producer to Consumer, Integrated Approach to Quality. Luten JB, Børresen T and Oehlenschläger J (Eds.). Elsevier Science B.V., pp 3-19. Besteiro I, Rodríguez CJ, Tilve-Jar C and Pascual C. 2000. Selection of attributes for the sensory evaluation of anchovies during the ripening process. Journal of sensory studies 15: 65-77. Bett KL, Ingram DA, Grimm CC, Vinyard BT, Boyette KDC and Dionigi CP. 2000. Alteration of the sensory perception of the muddy/earthy odorant 2-methylisoborneol in channel catfish Ictalurus punctatus fillet tissues by addition of seasonings. Journal of Sensory Studies 15:459-472. Bjerkeng B, Refstie, Fjalestad KT, Storebakken T, Røbotten M and Roem AJ. 1997. Quality parameters of the flesh of Atlantic salmon (Salmo salar) as affected by dietary fat content and full-fat soybean meal as a partial substitute for fishmeal in the diet. Aquaculture 157:297-309 Bøkness N, Jensen KN, Guldager HS, Østerberg C, Nielsen J and Dalgaard P. 2002. Thawed chilled Barents Sea cod fillets in modified atmosphere packaging - appreciation of multivariate data analysis to select key parameters in good manufacturing practice. Lebensm. –Wiss. U. – Technol. 35:436-443. CAC/CL 31 – 1999. Sensory Evaluation of Fish and Shellfish in Laboratories. CAC/GL 50 – 2004. General Guidance on sampling. CAC/RCP 18-1978. Molluscan Shellfish. CAC/RCP 24 -1979. Lobsters. CAC/RCP 25 -1979. Smoked Fish. CAC/RCP 26 – 1979. Salted Fish. CAC/RCP 28 – 1983. Crabs. CAC/RCP 35 – 1985. Frozen Battered and/or Breaded Fishery Products. CAC/RCP 52 – 2003. Code of Practice for Fish and Fishery Products.

NMKL PROCEDURE No 21 (2008)
Guide for sensory analysis of fish and shellfish Page: 23 (27) Version: 1 Date: 2008-02-26 Approved: Ole Bjørn Jensen
Cardello AV, Sawyer MF, Prell P, Maller O and Kapsalis J. 1983. Sensory Methodology for the Classification of Fish According to “Edibility Characteristics”. Lebensm. –Wiss. U. – Technol. 16:190-194. Cardinal M, Gunnlaugsdottir H, Bjoernevik M, Ouisse A, Vallet JL and Leroi F. 2004. Sensory characteristic of cold-smoked Atlantic salmon (Salmo salar) from the European market and relationships with chemical, physical and microbiological measurements. Food Research International 37:181-193. CODEX STAN 119 – (1981) 1995. Canned Finfish. CODEX STAN 165 – (1989) 1995. Quick Frozen Blocks of Fish, Fillets, Minced Fish Flesh and Mixtures of Fillets and Minced Fish Flesh. CODEX STAN 166 – (1989) 2005. Quick Fish Sticks (Fish Fingers), Fish Portions and Fish Fillets – Breaded or in Batter. CODEX STAN 167 – (1989) 1995. Salted Fish and Dried Salted Fish of Gadidae Family of Fishes. CODEX STAN 189 – 1993. Dried Shark Fins. CODEX STAN 190 – 1995. Quick Frozen Fish Fillets. CODEX STAN 191 – 1995. Quick Frozen Raw Squid. CODEX STAN 222 – 2001. Crackers from Marine and Freshwater Fish, Crustaceans and Molluscan Shellfish. CODEX STAN 236 – 2003. Codex Standard for Boiled Dried Salted Anchovies. CODEX STAN 244 – 2004. Standard for Salted Atlantic Herring and Salted Sprat. CODEX STAN 3 - (1981) 1995. Canned Salmon. CODEX STAN 36 - (1981) 1995. Quick Frozen Finfish, Eviscerated or Uneviscerated. CODEX STAN 37 - (1981) 1995. Canned Shrimps or Prawns. CODEX STAN 70 – (1981) 1995. Canned Tuna and Bonito. CODEX STAN 92 - (1981) 1995. Quick Frozen Shrimps or Prawns. CODEX STAN 94 - (1981) 1995. Sardines and Sardine-Type Products. CODEX STAN 95 – (1981) 1995. Quick Frozen Lobsters. Connell JJ. 1975. Control of fish quality. Fishing News (Books) Ltd. Farnham, Surrey, UK. Doré, I., 1991. Fish and Shellfish Quality Assessment. A guide for retailers and restaurateurs. An Osprey Book. Van Nostrand Reinhold. N.Y. USA.

NMKL PROCEDURE No 21 (2008)
Guide for sensory analysis of fish and shellfish Page: 24 (27) Version: 1 Date: 2008-02-26 Approved: Ole Bjørn Jensen
Edmunds WJ and Lillard DA. 1979. Sensory characteristics of oysters, clams and cultured and wild shrimp. Journal of Food Science 44: 368-373. Einen O and Skrede G. 1998. Quality characteristics in raw and smoked fillets of Atlantic salmon, Salmo salar, fed high-energy diets. Aquaculture Nutrition 4:99-108. Einen O, Thomassen MS. 1998. Starvation prior to slaughter in Atlantic salmon (Salmo salar) II. White muscle composition and evaluation of freshness, texture and colour characteristics in raw and cooked fillets. Aquaculture 169:37-53. Farmer LJ, McConnell JM and Kilpatrick, DJ. 2000. Sensory characteristics of farmed and wild Atlantic salmon. Aquaculture 187:105-125. Fletcher GC, Summers G, Corrigan V, Cumarasamy S and Dufour JP. 2002. Spoilage of King Salmon (Oncorhynchus tshawytscha) fillets stored under different atmospheres. Journal of Food Science 57:2362-2374. Ginés R, Valdimarsdottir T, Sveinsdottir K and Thorarensen H. 2004. Effect of rearing temperature and strain on sensory characteristics, texture, colour and fat of Arctic charr (Salvelinus alpinus) Hemre G-I, Karlsen Ø, Eckhoff K, Tveit K, Mangor-Jensen A and Rosenlund G. 2004. Effect of season, light and diet on muscle composition and selected quality parameters in farmed Atlantic cod, Gadus morhuaL. Aquaculture Research 35:683-697. Hong LC, Leblanc EL, Hawrysh ZJ and Hardin RT. 1996. Quality of Atlantic Mackerel (Scomber scombrus L.) Fillets during Modified Atmosphere Storage. Journal of Food Science 61:646-651. Howgate P, Johnston A and Whittle KJ. 1992. Multilingual Guide to EC Freshness Grades for Fishery Products, Torry Research Station, Aberdeen. Howgate P. 2004.Tainting of farmed fish by geosmin and 2-methyl-iso-borneol: a review of sensory aspects and of uptake/depuration. Aquaculture 234:155-181 Hyldig,G., Nielsen, J. 2004. QIM - a tool for determination of fish freshness. Seafood Quality and Safety. Advances in the New Millennium, Ed. Shahidi, F., Simpson, B.K. ScienceTech Publishing Company, 81-89. Hyldig G and Green-Petersen DMB. 2005. Quality index Method – An objective Tool for Determination of Sensory Quality. Journal of Aquatic Food Product Technology, Vol. 13 (4), 71-80. Hyldig, G. 2007. Sensory profiling of fish, fish product and shellfish. In Nollet, L.M.L., Boylston, T., Chen, F., Coggins, P.C., Gloria, M.B., Hyldig, G., Kerth, C.R., McKee, L.H. and Hui, Y.H. (eds.) ”Handbook of Meat, Poultry and Seafood Quality”. PP 511-528. Blackwell Publ. USA. Hyldig, G. and Nielsen, D. 2007. Texture of fish, fish products and shellfish. In Nollet, L.M.L., Boylston, T., Chen, F., Coggins, P.C., Gloria, M.B., Hyldig, G., Kerth, C.R., McKee, L.H. and Hui, Y.H. (eds.) ”Handbook of Meat, Poultry and Seafood Quality. PP 549-562. Blackwell Publ. USA. Hyldig, G., Bremner, A., Martinsdóttir, E. and Schelvis, R. 2007. Quality Index Methods. In Nollet, L.M.L., Boylston, T., Chen, F., Coggins, P.C., Gloria, M.B., Hyldig, G., Kerth, C.R., McKee, L.H. and Hui, Y.H. (eds.) ”Handbook of Meat, Poultry and Seafood Quality. PP 529-548. Blackwell Publ. USA.

NMKL PROCEDURE No 21 (2008)
Guide for sensory analysis of fish and shellfish Page: 25 (27) Version: 1 Date: 2008-02-26 Approved: Ole Bjørn Jensen
Hyldig, G., Larsen, E. and Green-Petersen, D. 2007. Fish and Sensory Analysis in the Fish Chain. In Nollet, L.M.L., Boylston, T., Chen, F., Coggins, P.C., Gloria, M.B., Hyldig, G., Kerth, C.R., McKee, L.H. and Hui, Y.H. (eds.) ”Handbook of Meat, Poultry and Seafood Quality. PP 499-510. Blackwell Publ.. USA. ISO 11035. 1994. Sensory analysis – Identification and selection of descriptors for establishing a sensory profile by a multidimensional approach. International Organization for Standardization. Switzerland. ISO 5492. 1992. Sensory analysis – Vocabulary. International Organization for Standardization, Geneva, Switzerland. ISO 6658. 2005. Sensory analysis – Methodology – General guidance. ISO 8586-1. 1993. Sensory analysis – General guidance for the selection, training and monitoring of assessors – Part 1: Selected assessors. International Organization for Standardization. Switzerland. ISO 8589. 1988. Sensory analysis – General guidance for the design of test rooms Johansson L, Kiessling A, Kiessling K-H and Berglund. 2000. Effects of altered ration levels on sensory characteristics, lipid content and fatty acid composition of rainbow trout (oncorhynchus mykiss). Food Quality and preference 11: 247-254. Luten, J. B., Børresen, J., Oehlenschläger, J. 1997. Seafood from Producer to Consumer, Integrated Approach to Quality. Elsevier Science. Amsterdam. The Netherlands. Martinsdóttir, E. Sveinsdottir, K., Luten, J. Schelvis-Smit R., and Hyldig, G. 2001. Sensory evaluation of fish freshness. A reference manual for the fish industry. Available in 11 European languages from www.qim-eurofish.com Martinsen C, Lauby B, Nevissi A and Brannon E. 1992. The influence of crude oil and dispersant on the sensory characteristics of steelhead (Oncorhychus mykiss) in marine waters. Journal of Aquatic Food Product Technology 1:37-51. Morita K, Kubota K and Aishima T. 2001. Sensory characteristics and volatile components in aroma of boiled prawns prepared according to experimental designs. Food Research International 34:473-481. Morita K, Kubota, K and Aishima T. 2003. Comparison of aroma characteristics of 16 fish species by sensory evaluation and gas chromatographic analysis. Journal of the Science of Food and Agriculture 83:289-297. Nielsen D, Hyldig G, Nielsen HH and Nielsen J. 2004. Sensory Properties of Marinated Herring (Clupea harengus) – Influence of Fishing Ground and Season. Journal of Aquatic Food Product Technology, Vol. 13 pp3-24. Nielsen D and Hyldig G. 2004. Influence of handling procedures and biological factors on the QIM evaluation of whole herring (Clupea harengus L.) Food Research International, Vol 37/10 pp 975-983. Nielsen D, Hyldig G, Nielsen J and Nielsen HH. 2005. Sensory properties of marinated herring (Clupea harengus) processed from raw material from commercial landings. Journal of the Science of Food and Agriculture, 85,1, 127-134.

NMKL PROCEDURE No 21 (2008)
Guide for sensory analysis of fish and shellfish Page: 26 (27) Version: 1 Date: 2008-02-26 Approved: Ole Bjørn Jensen
Nielsen D, Hyldig G, Nielsen HH and Nielsen J. 2005. Lipid content in herring (Clupea harengus L) – Influence of biological factors and comparison of different methods of analyses: solvent extraction, Fatmeter, NIR and NMR. Lebensm.-Wiss. U. Technol. 38, pp 537-548 Nielsen D, Hyldig G, Nielsen HH and Nielsen J. 2005. Lipid holding capacity and Instrumental and Sensory Texture Properties of herring (Clupea harengus L) Related to Biological and Chemical Parameters. Journal of Texture Studies, vol 36 pp 119-138. Nielsen D, Hyldig G and Sørensen R. 2005. An effective way to minimize drifting and monitor the performance of a sensory panel during long-term projects – A case study from a project on herring quality. Journal of Sensory Studies, vol. 20 pp 35-47. Nielsen, J and Jessen, F. 2007. Quality of Frozen Fish. In Nollet, L.M.L., Boylston, T., Chen, F., Coggins, P.C., Gloria, M.B., Hyldig, G., Kerth, C.R., McKee, L.H. and Hui, Y.H. (eds.) ”Handbook of Meat, Poultry and Seafood Quality. PP 549-562. Blackwell Publ. USA. NMKL PROCEDURE No. 12 (2002). Guide on Sampling. NMKL PROCEDURE No. 14 (2004). English version 2005. SENSVAL: Guidelines for internal control in sensory analysis NMKL PROCEDURE No. 16 (2005). Sensory quality control NMKL PROCEDURE NR 6 (1998). Generelle retningslinier for kvalitetssikring af sensoriske laboratorier. (Available in Danish only) Nortvedt R and Tuene S. 1998. Body composition and sensory assessment of three weight groups of Atlantic halibut (Hippoglossus hippoglossus) fed three pellet sizes and three dietary fat levels. Aquaculture 161:295-313. Papadopoulos LS and Finne G. 1986. Effect of Environmental Salinity on Sensory Characteristics of Penaeid Shrimp. Journal of Food Science 51:812-814. Rasmussen RS, Ostenfeld TH, Rønsholdt B and McLean E. 2000. Manipulation of end-product quality of rainbow trout with finishing diets. Aquaculture Nutrition 6:17-23. Refsgaard HH, Brockhoff PB and Jensen B. 1998. Sensory and Chemical Changes in Farmed Atlantic Salmon (Salmo salar) during frozen storage. Journal of Agricultural and Food Chemistry 46:3473-3479. Richards M and Hultin HO. 2001. Rancidity development in a fish model system as affected by phospholipids. Journal of Food Lipids 8:215-230. Rørå AMB, Kvåle A, Mørkøre T, Rørvik KA, Stein SS and Thomassen MS. 1998. Process yield, colour and sensory quality of smoked Atlantic salmon (Salmo salar) in relation to raw material characteristics. Food Research International 31:601-609. Schubring R and Oehlenschläger J. 1997. Comparison of the ripening process in salted Baltic and North Sea herring as measured by instrumental and sensory methods. Z. Lebensm Unters Forsch A 205:89-92.

NMKL PROCEDURE No 21 (2008)
Guide for sensory analysis of fish and shellfish Page: 27 (27) Version: 1 Date: 2008-02-26 Approved: Ole Bjørn Jensen
Sérot T, Regot C, Prost C, Robin J and Arzel J. 2001. Effect of dietary lipid sources on odour-active compounds in muscle of turbot (Psetta maxima). Journal of the science of Food and Agriculture 81:1339-1346. Sivertsvik M, Rosnes JT, Vorre A, Randell K, Ahvenainen R and Bergslien H. 1999. Quality of whole gutted salmon in various bulk packages. Journal of Food Quality 22:387-402. Stohr V, Joffraud JJ, Cardinal M and Leroi F. 2001. Spoilage potential and sensory profile associated with bacteria isolated from cold-smoked salmon. Food Research International 34:797-806. Sveinsdóttir K, Hyldig G, Martinsdóttir E, Jørgensen B and Kristbergsson K. 2003. Development of Quality Index Method (QIM) Scheme for Farmed Atlantic Salmon (Salmo salar). Food Quality and Preferences 14:237-245. Thybo, A. K. & Martens, M. (2000) Analysis of sensory assessors in texture profiling of potatoes by multivariate modelling. Food Quality and Preference 11:283-288. Triqui R and Bouchriti N. 2003. Freshness Assessment of Moroccan Sardine (Scardina pilchardus): Comparison of Overall Sensory Changes to Instrumentally Determined Volatiles. Journal of Agricultural and Food Chemistry, 51:7540-7546 Warm K, Nielsen J and Hyldig G. 2000. Sensory Quality Criteria for Five Fish Species. Journal of Food Quality 23:583-601. Whitfield FB, Drew M, Helidoniotis F and Svoronos D. 1999b. Distribution of Bromophenols in Species of Marine Polychaetes and Bryozoans from Eastern Australia and the Role of Such Animals in the Flavour of Edible Ocean Fish and Prawns (Shrimp). Journal of Agriculture and Food Chemistry 47:4756-4762. Whitfield FB, Helidoniotis F and Smith D. 2002. Role of feed ingredients in the bromophenol content of cultured prawns. Food Chemistry 79: 355-365. Whitfield FB, Helidoniotis F, Shaw KJ and Svoronos D. 1997. Distribution of Bromophenols in Australian Wild-Harvested and Cultivated Prawns (Shrimp). Journal of Agriculture and Food Chemistry 45:4398-4405. Whitfield FB, Helidoniotis F, Shaw KJ and Svoronos D. 1999a. Distribution of Bromophenols in Species of Marine Algae from Eastern Australia. Journal of Agriculture and Food Chemistry 47:2367-2373.