GUIDANCE INCREASED TO $95 MILLION AND COMPANY UPDATE
29
Level 12, 1 Willeston Street, Wellington 6011, New Zealand PO Box 5963 Lambton Quay, Wellington 6145, New Zealand P. +64 4 499 6830 F. +64 4 974 5218 E. [email protected] 14 September 2021 Australian Securities Exchange Level 4, 20 Bridge Street SYDNEY NSW 2000 GUIDANCE INCREASED TO $95 MILLION AND COMPANY UPDATE The Board of Bathurst Resources Limited (ASX:BRL) today advises that as a result of the recent significant uplift in hard coking coal prices, EBITDA guidance has increased from $65 million to $95 million. This is supported by the release of an updated investor presentation post the recent release of FY21 year end results. The Board also advises that the date of the arbitration hearing regarding the second performance payment claim by L&M Coal Holdings Ltd 1 has been rescheduled from November 2021 to between April 2022 to July 2022. Authorised for release by Richard Tacon, CEO. 1 Refer to note 23 in the 30 June 2021 financial statements released on 27 August 2021, or the ASX release dated 4 May 2021 for further information on the claim.
Transcript of GUIDANCE INCREASED TO $95 MILLION AND COMPANY UPDATE
Level 12, 1 Willeston Street, Wellington 6011, New Zealand PO Box 5963 Lambton Quay, Wellington 6145, New Zealand
P. +64 4 499 6830 F. +64 4 974 5218 E. [email protected]
14 September 2021
Australian Securities Exchange Level 4, 20 Bridge Street SYDNEY NSW 2000
GUIDANCE INCREASED TO $95 MILLION AND COMPANY UPDATE
The Board of Bathurst Resources Limited (ASX:BRL) today advises that as a result of the recent significant uplift in hard coking coal prices, EBITDA guidance has increased from $65 million to $95 million. This is supported by the release of an updated investor presentation post the recent release of FY21 year end results.
The Board also advises that the date of the arbitration hearing regarding the second performance payment claim by L&M Coal Holdings Ltd1 has been rescheduled from November 2021 to between April 2022 to July 2022.
Authorised for release by Richard Tacon, CEO.
1 Refer to note 23 in the 30 June 2021 financial statements released on 27 August 2021, or the ASX release dated 4 May 2021 for further information on the claim.

BATHURST RESOURCESLIMITED
Shareholder updateASX: BRL
DISCLOSUREGeneral informationThis document is authorised for release by the board of directors of Bathurst Resources Limited (“Bathurst”) on the 14 September 2021. Bathurst’s address is Level 12, 1 Willeston Street, Wellington 6011, New Zealand.
General disclaimerThis presentation contains forward-looking statements. Forward-looking statements often include words such as “anticipate”, “expect”, “intend”, “plan”, “believe”, “guidance” or similar words in connection with discussions of future operating or financial performance, they also include all figures noted as FY22/FY22E which are forecasted financial year June 2022 results. The forward-looking statements are based on management's and directors’ current expectations and assumptions regarding Bathurst’s businesses and performance, the economy and other future conditions, circumstances and results.
As with any projection or forecast, forward-looking statements are inherently susceptible to uncertainty and changes in circumstances. Bathurst’s actual results may vary materially from those expressed or implied in its forward-looking statements. Bathurst, its directors, employees and/or shareholders shall have no liability whatsoever to any person for any loss arising from this presentation or any information supplied in connection with it. Bathurst is under no obligation to update this presentation or the information contained in it after it has been released. Nothing in this presentation constitutes financial, legal, tax or other advice.
Resources and reservesAll references to reserve and resource estimates should be read in conjunction with Bathurst’s ASX announcement – “2020 Update on Resources and Reserves” reported on the 30 October 2020, and all disclosures made in this document with reference to resources and reserves are quoted as per this announcement. Resources and marketable coal reserve tables have been included as appendices to this document.
Bathurst confirms that it is not aware of any new information or data that may materially effect the information included in this market announcement. In the case of estimates of coal resources or reserves for material mining projects, all material assumptions and technical parameters underpinning the estimates continue to apply and have not materially changed since the 30 October 2020 announcement, noting that production activity for operating mining projects has occurred between the date of the initial report and this presentation.
Consolidated financial presentationConsolidated in this document where used refers to consolidated 100 percent Bathurst and 65 percent equity share of BT Mining Limited.Financial figures noted in this document are consolidated unless otherwise noted.
2

3
OUR BOARD MEMBERS
Takitimu
Richard Tacon Russell MiddletonPeter Westerhuis Francois Tumahai
Non-executive Chairman
• Six years with Bathurst, Chairman since July 2021.
• Professional engineer with post-graduate business qualifications.
• Over 30 years of experience in the iron ore, gold and coal industries, the last 12 years at CEO and MD level.
CEO and Executive Director
•Nine years with Bathurst.•Over 40 years in almost every role in the coal mining sector, senior leadership roles held in for the past decade.
•Qualifications include first, second and third class coal mining qualifications.
Non-executive Director is a
• Joined Bathurst this year.• Over 20 years’ governance
experience in the private and not-for-profit sectors.
• CEO of a pounamu mining company. Hands on experience with heavy machinery operation, leading to a strong base in health and safety compliance.
CFO and Executive Director
• Six years with Bathurst.• More than 30 years in
the mining and construction sectors.
• Numerous executive and board positions held for ASX listed resource companies.
4
SAFETY IS IMPORTANT TO US
-
2.0
4.0
6.0
8.0
10.0
12.0
14.0
16.0
LTIFR TRIFR
12 MONTH ROLLING AVERAGE
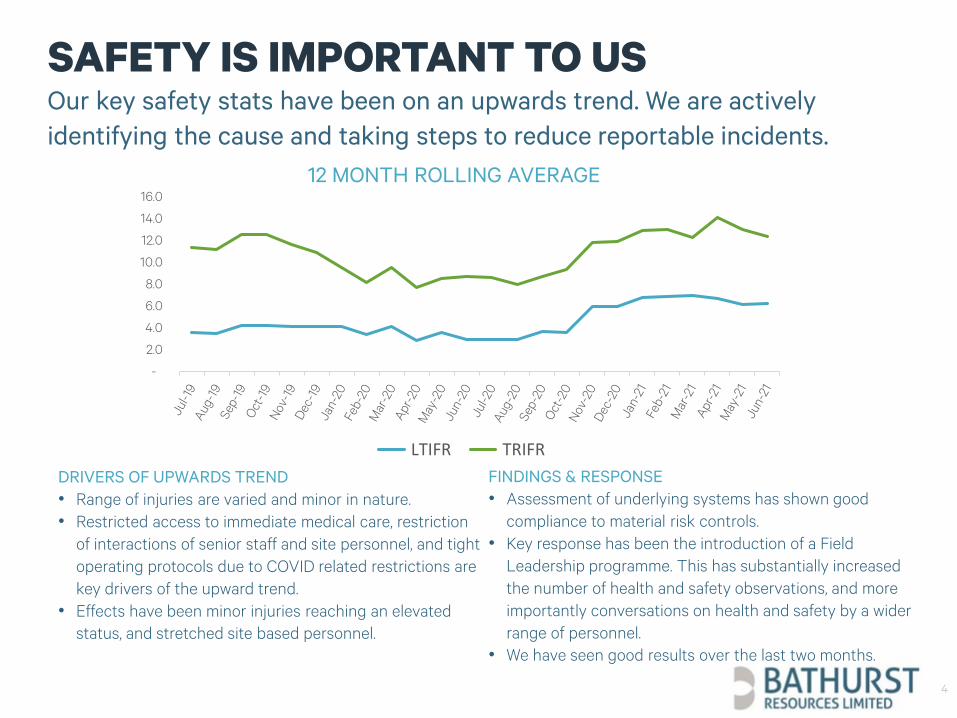
Our key safety stats have been on an upwards trend. We are actively identifying the cause and taking steps to reduce reportable incidents.
DRIVERS OF UPWARDS TREND• Range of injuries are varied and minor in nature.• Restricted access to immediate medical care, restriction
of interactions of senior staff and site personnel, and tight operating protocols due to COVID related restrictions are key drivers of the upward trend.
• Effects have been minor injuries reaching an elevated status, and stretched site based personnel.
FINDINGS & RESPONSE• Assessment of underlying systems has shown good
compliance to material risk controls.• Key response has been the introduction of a Field
Leadership programme. This has substantially increased the number of health and safety observations, and more importantly conversations on health and safety by a wider range of personnel.
• We have seen good results over the last two months.

5
ESG HIGHLIGHTS
GENDER DIVERSITY• 15% female across the total
workforce – we are aiming for 25%.• 33% female at SLT level which is
our target.• Aiming for 20% female at board
level (currently nil).
SUSTAINABLE OPERATING• Focus on coking coal as there is
currently no viable alternative to coal in steelmaking.
• Management investments in line with customer needs.
GREEN ALTERNATIVES• A concept study of electric vehicles
was undertaken at Stockton during the year.
• If approved this will see three diesel trucks replaced with two electric trucks.
REDUCING EMISSIONS• After successful trials, a new fuel will
be used across all BT Mining sites leading to approximately 600,000 litres less per year of diesel use.
• CO2e emissions will reduce by 1,600 tonnes per year.
REDUCING WASTE• We saved 26,000 cubic metres of
landfill space in FY21.• Biosolids improve soil to help with
revegetation.• Mussell shells treat acid mine
drainage.• Coal ash is blended with backfill dirt
to improve water quality.
CORPORATE VALUESValues set by directors during the year:• Be real.• Be safe.• Be accountable.• Be a team.

6
FY21 HIGHLIGHTS
Equity restored
0.68debt to equity ratio
-81%
Share consolidation
171m shares-90%
Major litigation win on LMCH claim
Energy used
0.43Gigajoules per tonne extracted
coal-12%
Net profit
$66.7m
+241%
Capital investment
$28.7m
-35%
Financial numbers noted are consolidated.

7
CONSISTENT POSITIVE CASH FLOWSNZ $m FY18 FY19 FY20 FY21 FY22E
EBITDA 93.7 106.6 76.8 59.5 95.3
Tax (11.6) (16.6) (9.3) (18.2) (10.7)
Fixed assets CAPEX (net of disposals)
(30.6) (29.9) (14.4) (6.2) (9.6)
Movement in working capital (27.6) 0.5 (0.7) 1.9 (5.7)
Free cash flow 23.9 60.7 52.4 37.0 69.4
Mining development, stripping, exploration & rehabilitation
(22.0) (29.2) (31.3) (20.5) (19.9)
Adjusted free cash flow 1.9 31.4 21.1 16.5 49.5
• Cash flows in FY18 were impacted by intensive cash out flows relating to the acquisition of the BT Mining assets, including paydown of initial debt of NZ $30m.
• Since then cash flows have been positive, even during the low part of the export pricing cycle.
Financial numbers noted are consolidated. 1 FY22E USD export HCC benchmark is the average of Bathurst’s estimated quarterly pricing based on general market consensus.
0
100
200
300
-
20
40
60
FY18 FY19 FY20 FY21 FY22E
USD/tonne1$m Free cash flow
Free cash flow USD export HCC benchmark

8
PROFIT ACHIEVED EVEN DURING LOW EXPORT PRICING
1On a 100 percent basis (not consolidated).
The export pricing benchmark hit its lowest point in five years in FY21, but our domestic business continues to provide stable cash flows.
A low cost base means margin is still made in the export segment even when pricing reduces.
-
100
200
300
400
FY18 FY19 FY20 FY21 FY22E
NZD $m
Revenue1 by product use ($m)
Process heat - DOM Electricity - DOM
Steelmaking - DOM Steelmaking - EXP
0
50
100
150
200
250
0
20
40
60
80
100
120
FY18 FY19 FY20 FY21 FY22E
NZD APR $NZD $m
Consolidated EBITDA
Domestic incl corporate Export Export APR

9
RECORD NET PROFIT & BALANCE SHEET RECOVERYItem (NZ $m except for share data)
FY21 FY20
Revenue 212.6 232.7
EBITDA 59.5 76.8
EBITDA margin 28% 33%
Net profit/(loss) 66.7 (47.4)
Earnings per share (cents) 39.0 (27.8)
Debt1 13.5 20.3
Gearing % 10% 30%
Equity 128.8 66.9
Debt to equity ratio 0.68 3.62
EARNINGS• Revenue and EBITDA both decreased from a retraction in our
export segment, driven by lower export pricing. • The COVID-19 pandemic as well as China’s import ban on
Australian coal both drove the export benchmark price down to its lowest point in five years.
SIGNIFICANT ITEMS• Significant items included in net profit are a $73.2m gain to the
income statement, from the reversal of a performance payment and interest which was recognised in FY20, as a result of a major litigation win2.
• There was also $22.2m of impairment expense. A portion of this related to a write-off of Canterbury mine assets which ceased operating in June. The remainder a write-off of a historical acquisition value for a permit adjacent to the remaining South Island domestic mine.
DEBT• Debt consists of a $10m AUD convertible bond, and funds
received in advance from customers to finance overburden stripping in new mine areas.
1Excludes finance leases of $25m ($30m FY20) which include leases bought onto the balance sheet under accounting standard IFRS 16.
2Refer slide 28

10
OPERATIONS’ FINANCIALS
Metric (100% basis) FY19 FY20 FY21 FY22E
Sales kt 905 792 717 678
EBITDA1 $m 51 49 54 48
EBITDA margin $/t 56.8 62.1 70.4 70.1
Metric (100% basis) FY19 FY20 FY21 FY22E
Sales (kt) kt 396 345 343 261
EBITDA1 $m 19 15 17 14
EBITDA margin $/t 47.5 44.5 53.1 52.6
Metric (100% basis) FY19 FY20 FY21 FY22E
Sales kt 1,178 1,077 1,042 1,083
HCC benchmark price USD/t 205 151 116 268
Benchmark realisation2 % 75% 72% 78% 75%
NZD:USD FX rate 0.67 0.64 0.70 0.73
EBITDA1 $m 104 66 29 96
EBITDA margin $/t 88.0 60.9 27.0 89.1
EXPORT (STOCKTON)
NORTH ISLAND DOMESTIC
SOUTH ISLAND DOMESTIC
1 EBITDA represents net profit/(loss) before tax, net finance costs, tax, depreciation, amortization, impairment, fair value movements on derivatives and deferred consideration, and movements in rehab provisioning.2 Coking coal sales only – excludes any thermal vessels.
• Key impacts on export earnings are the USD Hard Coking Coal premium low vol benchmark which our export pricing is set against, as well as movements in NZD:USD foreign exchange rates.
• South Island domestic sales decrease in FY22 due to the closure of the Canterbury mine in June 2021.
• North Island domestic sales decrease in FY22 due to planned changes in volumes as per customer contracts. EBITDA margin increases in FY22E compared to FY21 when the difference in freight revenue is excluded, reflecting an underlying decrease in operating cost per tonne.

59.5
95.3
43.5 (4.2) (3.5)
0
20
40
60
80
100
120
FY21 EBITDA Export North Island domesticincl. BT overheads
South Island domesticincl. BRL overheads
FY22E EBITDA
$'m
11
EBITDA GUIDANCE FY22 $95.3MAn increase of $35.8m (60%) from FY21.
An increase in the USD pricing benchmark that
our export sales are priced against.
Contracted reduction in sales volumes, partially offset by
underlying decrease in cost per tonne.
Closure of Canterbury mine in June 2021.

12
BUSINESS SNAPSHOT
Maramarua
Canterbury
Takitimu
EXPORT SALES≈ 1Mt p.a.
•PRODUCTION ≈ 2Mt p.a.•DOMESTIC SALES ≈ 1Mt p.a.
EXPLORATION JOINT VENTURE PROJECT
Production and sales tonnes under management

Maramarua
Canterbury
Stockton
Export (Stockton)
North Island
domestic
South Island
domestic
Type Open cut Open cut Open cut
Mar
ket Steelmaking Processing
heat and steelmaking
Processing heat
Infr
astr
uctu
re 1.8Mtpa CHPP, 2.5km aerial
ropeway, 2.2Mtpa rail loadout facility.
1.0Mtpa CHPP, and rail
loadout facilities.
Close to customers or rail loadout
facilities.
NZ BUSINESS SNAPSHOT
13

Over time, we have built a world class portfolio of assets against our strategic setting
14
PROVEN RECORD
PRODUCTIONUNDER MANAGEMENT
≈ 2Mt400kt
PRODUCT USES
POSITIONED FOR GROWTH
LOCATION
100% thermal energy
New Zealand
MARKETS New Zealand New Zealand & Asia
New Zealand
30% thermal energy & 70% steelmaking
JV operating mine assets acquisition
JV coking coal exploration acquisition
≈ 4Mt1
Existing business
New Zealand & Asia
New Zealand & Canada
15% thermal energy & 85% steelmaking
1Forecast production based on current operations at existing levels, plus production from the Canadian exploration project. This project is still in the exploration phase and production assumed is as per the Yield Optimisation Study results announcement by JV partner Jameson Resources HERE
NOWTHEN

ECO
NO
MIC
S • Pre-tax NPV10 USD $469m.
• FOB Vancouver USD 89.41/t. RE
SOU
RCE • 1.96Mtpa.
• Mine life 15 years.
• 66.5Mt reserve, 90.2Mt resource.
STA
TU
S • Submission for environmental application expected by end of 2021.
INV
EST
MEN
T • CAD $14.8m to date.
• 22.2% equity share.
• Option to buy-in to 50% for CAD $107m.
Crown Mountain – a premium low volatile hard coking coal exploration project, due to enter production late 2025, and produce 2Mt per year.
Refer to the announcement by joint venture partner Jameson Resources to support the above project metrics HERE
CANADIAN COKING COAL PROJECT
15
Located in British Columbia in a mature mining region, close to well established transport infrastructure. Further investment is at Bathurst’s sole discretion.
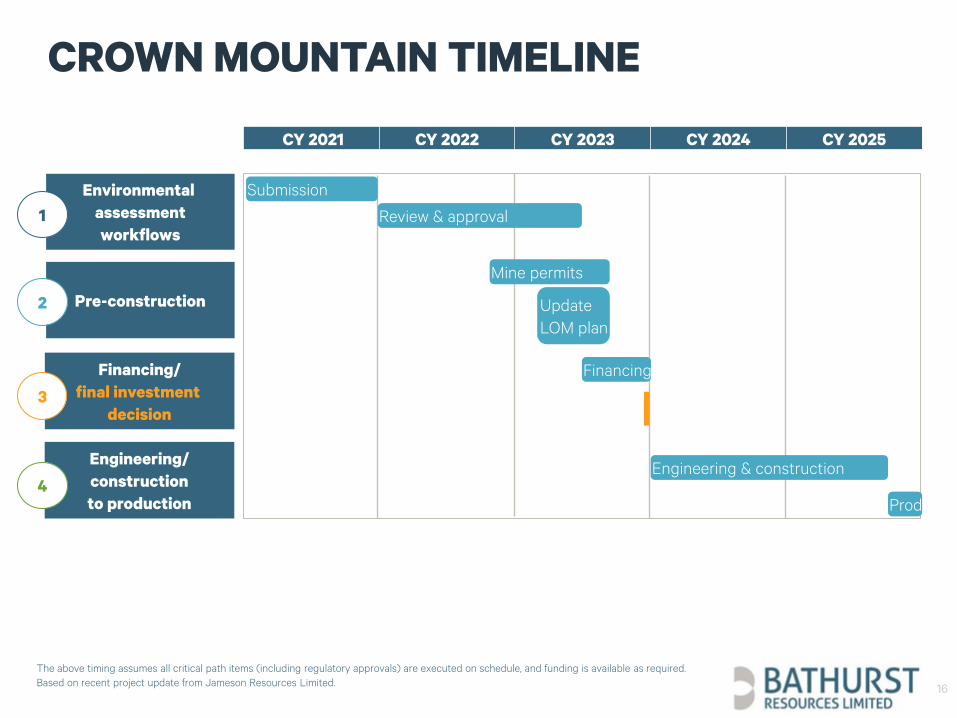
The above timing assumes all critical path items (including regulatory approvals) are executed on schedule, and funding is available as required. Based on recent project update from Jameson Resources Limited.
Environmental assessmentworkflows
CY 2021 CY 2022 CY 2023 CY 2024 CY 2025Q1 Q2 Q3 Q4 Q1 Q2 Q3 Q4 Q1 Q2 Q3 Q4 Q1 Q2 Q3 Q4 Q1 Q2 Q3 Q4
Submission
Review & approval
Pre-construction
1
Financing/final investment
decision3
Engineering/constructionto production
4
Mine permits
Financing
Engineering & construction
Productio
2
CROWN MOUNTAIN TIMELINE
16
UpdateLOM plan

17
DEMAND HAS REMAINED STRONG
1On a 100 percent basis (not consolidated).
Sales are consistent and primarily coal used for steelmaking
Our business from a demand perspective has been relatively unaffected by the disruptions of the COVID-19 pandemic.
All of our operations are deemed key utilities so they can continue to operate during any lockdowns within New Zealand.
Demand for coal for steelmaking continues and our thermal product is sold domestically to customers who are also key utilities.
71%
10%
19%
FY21 sales by product use
Steelmaking Electricity Process heat
1.1 1.3 1.1 1.0 0.9
1.01.2
1.1 1.1 1.1
0.0
0.5
1.0
1.5
2.0
2.5
FY18 FY19 FY20 FY21 FY22E
Coal sales1 (Mt)
Domestic Export

18
EXPORT STRATEGY & MARKETS
• Coal marketed on a value in use basis.• Our customers design their coke
blends around our product.
Value in use focus
• Our value in use focus means we have long-standing relationships with our customers.
• These range from the newest at three years to the oldest at 47 years.
Long-standing relationships
Product / specification realignment to match export resource and maximise sales volume.
Align resource with customers
• Very low ash content.• Almost all vitrinite.• Blend improver.• Our product helps our customers meet
their emissions targets due to the unique qualities of our coal.
Quality
India 21%
South Korea 17% and
Japan 29%
China 11%
Australia 22%
EXPORT SALES BY COUNTRY % FY22E
Forecast volumes to China reflect the re-
establishment of a pre-existing relationship
19
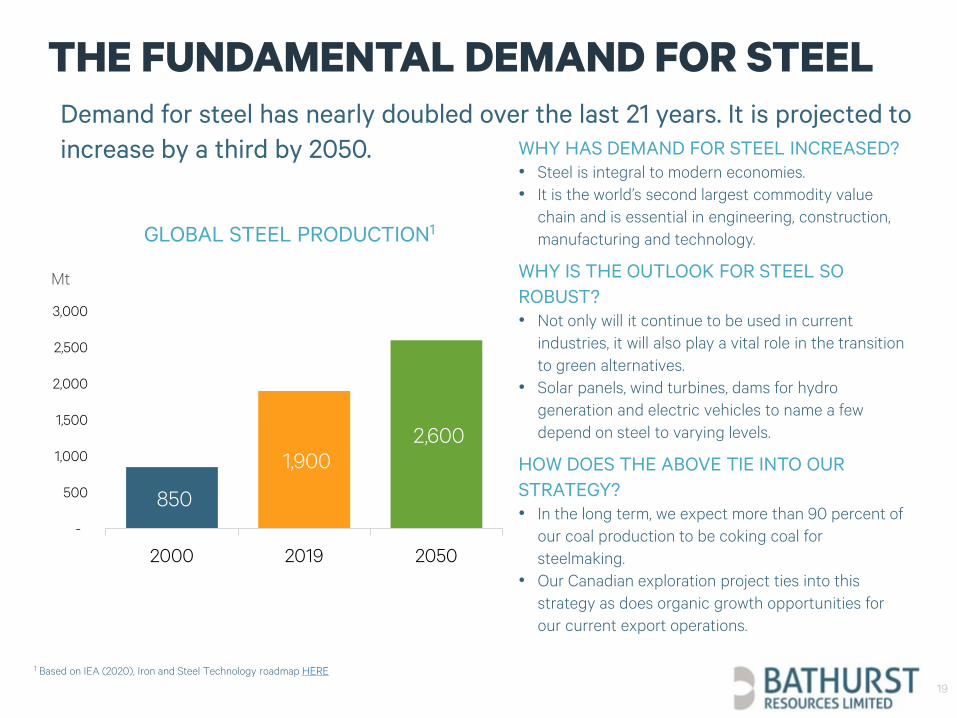
THE FUNDAMENTAL DEMAND FOR STEELDemand for steel has nearly doubled over the last 21 years. It is projected to increase by a third by 2050.
GLOBAL STEEL PRODUCTION1
1 Based on IEA (2020), Iron and Steel Technology roadmap HERE
850
1,900 2,600
-
500
1,000
1,500
2,000
2,500
3,000
2000 2019 2050
Mt
WHY HAS DEMAND FOR STEEL INCREASED?• Steel is integral to modern economies.• It is the world’s second largest commodity value
chain and is essential in engineering, construction, manufacturing and technology.
WHY IS THE OUTLOOK FOR STEEL SO ROBUST?• Not only will it continue to be used in current
industries, it will also play a vital role in the transition to green alternatives.
• Solar panels, wind turbines, dams for hydro generation and electric vehicles to name a few depend on steel to varying levels.
HOW DOES THE ABOVE TIE INTO OUR STRATEGY?• In the long term, we expect more than 90 percent of
our coal production to be coking coal for steelmaking.
• Our Canadian exploration project ties into this strategy as does organic growth opportunities for our current export operations.

20
EXPORT PRICING BENCHMARK RECOVERS
• The USD hard coking coal (“HCC”) premium low vol benchmark which our export pricing is set against started to show signs of recovery in June 2021.
• We saw this as a long awaited market correction. Despite the disruptions from the Chinese import ban on Australian coal, and the COVID-19 pandemic, fundamental market supply had remained steady, and demand for coal for steelmaking had increased.
• We are now seeing a sharp rise in the benchmark. We attribute this to a decreasing iron ore price and reduced coal stockpile levels, which are increasing demand and ability to pay higher coal prices, whilst supply has remained stable.
• 1Actual USD monthly export benchmark pricing based on S&P Global Platts Premium Low Vol benchmark daily spot pricing.
• Guidance is the pricing assumed in export’s EBITDA guidance
• Forward curve is based on the 10 September 2021 S&P Global Platts Premium Hard Coking Coal Australia FOB derivative assessment
80100120140160180200220240260280300320340360380
USD/tonne Monthly USD export benchmark pricing1
Actual Guidance Forward curve

21
DOMESTIC STRATEGY & MARKETS
India
Australia
SHAREDGOALS
STABILITY DIVERSITY
Life of mine plans are matched against committed sales volumes; new areas are only explored when there is a
strategic partnership in place.
Our domestic coal sales are used for both steel making and processing heat.
Our sales are underpinned by long term, fixed price contracts. Our major domestic customers are large
institutional New Zealand companies in essential goods supply.
“Coal remains an essential part of New Zealand’s energy mix.”

22
A SUSTAINABLE FOCUS
A global spotlight on climate change is bringing increased focus on mineral extraction activities such as mining coal.
This is part of a wider focus on corporations being held accountable for not only their financial results, but how they manage the environmental, social and governance aspects of their business.
These raise a specific set of risks that we need to manage and be proactive about.
THE NEW ZEALAND ENVIRONMENT:• Zero carbon bill legislated in 2019; net
zero carbon economy by 2050.• Emissions Trading Scheme which is
the market mechanism for offsetting Co2 emissions.
OUR POSITION• Acknowledge the transition to a net
zero carbon economy whilst supporting New Zealand’s prosperity.
• Aim to become a low-emissions company; we measure and report on our emissions annually.
• Ensure our strategy mitigates risks as much as possible.
We help users of our product lower their own environmental impact due to our low ash content which means less waste by-product, and improved efficiencies which means less coal is needed.

1 Historical average monthly closing share price per the ASX * number of shares on issue. 2 Calculated monthly average of daily USD export benchmark spot pricing per S&P Global Platts Premium Low Vol benchmark.
Acquisition of joint venture BT Mining which got Bathurst into the coking coal market.
High court announces judgment against Bathurst on LMCH claim.
COVID-19 pandemic and Court of Appeal judgment against Bathurst on LMCH claim.
SHARE PRICE IS RECOVERING
23
-
50
100
150
200
250
300
-
50
100
150
200
250
300
Dec
201
6
Feb
2017
Apr
il 20
17
June
201
7
Aug
201
7
Oct
201
7
Dec
201
7
Feb
2018
Apr
il 20
18
June
201
8
Aug
201
8
Oct
201
8
Dec
201
8
Feb
2019
Apr
il 20
19
June
201
9
Aug
201
9
Oct
201
9
Dec
201
9
Feb
2020
Apr
il 20
20
June
202
0
Aug
202
0
Oct
202
0
Dec
202
0
Feb
2021
Apr
il 20
21
June
202
1
Aug
202
1
USD $/tonneAUD $m
Market cap USD HCC benchmark
Supreme Court rules in favour of Bathurst on LMCH claim. Export coal price starts to recover.
MARKET CAP1 & EXPORT BENCHMARK2

66c 171 81% $20.2 $13.51
SHARE PRICE
AU at 13 September 2021.
MILLION SHARES
Shares on issue 171m.
These exclude a possible 20m shares
if the convertible bonds convert (strike price 49
cents) and unvested performance rights
1m.
TOP 20 HOLDINGS
Top 20 shareholders hold 81% of equity on
issue. Four substantial
shareholders (>5%) hold 49%.
MILLION CASH
Consolidated BT Mining and Bathurst, including
restricted term deposits at 30
June.
MILLION DEBT
$10m AUD convertible bond,
and funds received in advance from
customers to finance overburden
stripping in new mine areas.
.
1 Excludes finance leases of $25m which under accounting standard IFRS 16 brings leased assets previously off-balance sheet on to the balance sheet.
CAPITAL OVERVIEW CONT’D
24

Growth projects Production start date1 Status
SOUTH ISLAND DOMESTIC New Brighton FY23
NORTH ISLAND DOMESTIC
Waipuna West extension
Maramarua M1 pit
Rotowaro North
FY23
FY23
FY27
EXPORT (NZ)
Stockton organic projects2
Buller coal
FY22: HLFY23: A18FY27: UW
FY26
HL & A18UW
EXPORT (CANADA)3 Crown Mountain FY26
• 1The production start date assumes achieving key project milestones and consenting and permitting approvals and cannot be guaranteed.• 2 These consist of Hope Lyons development (“HL”), A18 fines project (“A18”), and Upper Waimangaroa projects (“UW”).
GROWTH PROJECTS OVERVIEW
25
We have a robust pipeline to extend our current operations.
Prefeasibility
Conceptual
Feasibility
Final engineering and design

$50-$100m annual EBITDA
We fundamentally view ourselves as a coal mining company, and we envisage that coking coal for steelmaking will continue to underpin our business for the foreseeable future. Noting the increasing global appetite for other minerals, we will also consider leveraging the strong coal mining core of our business and our sector expertise as producers to contemplate and potentially take advantage of other resource opportunities.
The following are the key criteria against which any potential future investments are measured against:
Stable jurisdiction
FUTURE INVESTMENTS
26
At or close to production

27
APPENDICES

Rotowaro
Maramarua
Canterbury
Takitimu
APPENDIX A: LMCH LITIGATION UPDATE
28
First performance payment claim
RESOLVED• Ruled in
favour of Bathurst
• In December 2016 LMCH initiated litigation for payment of the first USD $40m performance payment (“PP”) in a 2010 Agreement for Sale and Purchase (“ASP”).
• In July 2021 the Supreme Court ruled in favour of Bathurst, noting that whilst the performance payment had been triggered, payment could be suspended.
Second performance payment claim - change in control allegation
ONGOING• In arbitration
• In May 2020 LMCH issued a notice of proceedings for arbitration alleging that there has been a change in control triggering the second PP and issuance of shares in Bathurst under the ASP.
• We see this claim as vexatious and designed to hold the company at bay whilst the first PP claim went through the courts.
• We continue to believe we have a strong likelihood of successfully defending this claim.
Following the success in resolving the first claim in our favour, we believe we will have similar success in defending the second claim.