Telkom SA SOC Limited (Registration number … · Mobile revenue increased 72,7% to R2 347 million...
35
Telkom SA SOC Limited (Registration number 1991/005476/30) JSE share code: TKG ISIN: ZAE000044897 Group annual results For the year ended 31 March 2014 The information contained in this document is also available on Telkom’s investor relations website www.telkom.co.za/ir Group Company Secretary: Xoliswa Mpongoshe Transfer secretaries: Computershare Investor Services (Proprietary) Limited PO Box 61051, Marshalltown, 2107 Sponsor: The Standard Bank of South Africa Limited Standard Bank Centre 5 Simmonds Street, Johannesburg, 2001 Directors: JA Mabuza (Chairman), SN Maseko (Group Chief Executive Officer), JH Schindehütte (Chief Financial Officer), S Botha, Dr CA Fynn, N Kapila, I Kgaboesele, K Kweyama, L Maasdorp, K Mzondeki, F Petersen, LL Von Zeuner Special note regarding forward-looking statements Many of the statements included in this document, as well as oral statements that may be made by us or by officers, directors or employees acting on behalf of us, constitute or are based on forward-looking statements. All statements, other than statements of historical facts, including, among others, statements regarding our convergence and other strategies, future financial position and plans, objectives, capital expenditures, projected costs and anticipated cost savings and financing plans, as well as projected levels of growth in the communications market, are forward looking statements. Forward- looking statements can generally be identified by the use of terminology such as “may”, “will”, “should”, “expect”, “envisage”, “intend”, “plan”, “project”, “estimate”, “anticipate”, “believe”, “hope”, “can”, “is designed to” or similar phrases, although the absence of such words does not necessarily mean that a statement is not forward looking. These forward-looking statements involve a number of known and unknown risks, uncertainties and other factors that could cause our actual results and outcomes to be materially different from historical results or from any future results expressed or implied by such forward-looking statements. Among the factors that could cause our actual results or outcomes to differ materially from our expectations including but not limited to those risks identified in Telkom’s most recent annual report which are available on Telkom’s website at www.telkom.co.za/ir. We caution you not to place undue reliance on these forward looking statements. All written and oral forward-looking statements attributable to us, or persons acting on our behalf, are qualified in their entirety by these cautionary statements. Moreover, unless we are required by law to update these statements, we will not necessarily update any of these statements after the date of this document, either to conform them to actual results or to changes in our expectations. The information contained in this document is also available on Telkom’s investor relations website www.telkom.co.za/ir. Telkom SA SOC Limited is listed on the JSE Limited. Information may be
Transcript of Telkom SA SOC Limited (Registration number … · Mobile revenue increased 72,7% to R2 347 million...
Telkom SA SOC Limited(Registration number 1991/005476/30) JSE share code: TKGISIN: ZAE000044897
Group annual resultsFor the year ended 31 March 2014
The information contained in this document is also available onTelkom’s investor relations website www.telkom.co.za/ir
Group Company Secretary: Xoliswa Mpongoshe
Transfer secretaries: Computershare Investor Services (Proprietary)LimitedPO Box 61051, Marshalltown, 2107
Sponsor:The Standard Bank of South Africa LimitedStandard Bank Centre5 Simmonds Street, Johannesburg, 2001
Directors:JA Mabuza (Chairman), SN Maseko (Group Chief Executive Officer),JH Schindehütte (Chief Financial Officer), S Botha, Dr CA Fynn,N Kapila, I Kgaboesele, K Kweyama, L Maasdorp, K Mzondeki,F Petersen, LL Von Zeuner
Special note regarding forward-looking statementsMany of the statements included in this document, as well as oralstatements that may be made by us or by officers, directors or employeesacting on behalf of us, constitute or are based on forward-lookingstatements.
All statements, other than statements of historical facts,including, among others, statements regarding our convergence and otherstrategies, future financial position and plans, objectives, capitalexpenditures, projected costs and anticipated cost savings and financingplans, as well as projected levels of growth in the communications market,are forward looking statements. Forward- looking statements can generallybe identified by the use of terminology such as “may”, “will”, “should”,“expect”, “envisage”, “intend”, “plan”, “project”, “estimate”,“anticipate”, “believe”, “hope”, “can”, “is designed to” or similarphrases, although the absence of such words does not necessarily mean thata statement is not forward looking. These forward-looking statementsinvolve a number of known and unknown risks, uncertainties and otherfactors that could cause our actual results and outcomes to be materiallydifferent from historical results or from any future results expressed orimplied by such forward-looking statements. Among thefactors that could cause our actual results or outcomes to differmaterially from our expectations including but not limited to those risksidentified in Telkom’s most recent annual report which are available onTelkom’s website at www.telkom.co.za/ir.
We caution you not to place undue reliance on these forward lookingstatements. All written and oral forward-looking statements attributableto us, or persons acting on our behalf, are qualified in their entirety bythese cautionary statements. Moreover, unless we are required by law toupdate these statements, we will not necessarily update any of thesestatements after the date of this document, either to conform them toactual results or to changes in our expectations.
The information contained in this document is also available onTelkom’s investor relations website www.telkom.co.za/ir.
Telkom SA SOC Limited is listed on the JSE Limited. Information may be
accessed on Reuters under the symbols TKGJ.J and on Bloomberg under thesymbol TKG.SJ. Information contained on Reuters and Bloomberg is providedby a third party and is not incorporated by reference herein. Telkom hasnot approved or verified such information and does not accept anyliability for the accuracy of such information.
GROUP SALIENT FEATURESFOR THE YEAR ENDED 31 MARCH 2014
ADSL subscribers increased 6,5% to 926 944Managed data network sites increased 6,3% to 47 125Mobile sites integrated increased 22,3% to 2 428Operating revenue up 1,1% to R32,5 billionFixed-line voice and interconnection revenue decreased 7,4% to R9,4 billionFixed-line data revenue decreased 1,1% to R10,3 billionMobile revenue increased 72,7% to R2 347 millionMobile data revenue increased 80,2% to R656 million.Calling plan subscribers increased 1,3% to 867 874Active mobile subscribers increased 17,6% to 1 803 675 with a blended ARPUof R62,791 183 LTE sites integratedEBITDA excluding the once off items improved 3,8% to R8,4 billionHeadline earnings per share excluding the once off items increased35,1% to 388,0 centsOperating expenses, excluding depreciation, decreased 2,1% to R18,2 billionFree cash flow generated remains strong at R1 145 millionGroup interest-bearing debt decreased 38,5% to R4,1 billion
OVERVIEWJohannesburg, South Africa – 13 June 2014, Telkom SA SOC Limited(JSE: TKG) today announced Group annual results for the year ended31 March 2014.
Message from Telkom Group CEO Sipho MasekoOur efforts to turn Telkom around are starting to produce results. Ourheadline earnings per share from continuing operations excluding once offsfor the year was 388,0 cents, up 35,1% on the previous year. Basicearnings per share increased to 285,2 cents from 268,5 cents in the priorfinancial year.
In the past financial year, in line with our guidance to stabiliserevenues, we have achieved revenue growth of 1,1% for the year, confirmingthat we still face significant challenges largely as a result of thesustained pressure on our fixed-line revenues. Group reported revenue wasR32,5 billion compared with R32,1 billion in the prior period. Ouroperating expenses, excluding depreciation, decreased 2,1% to R18,2billion, from R18,5 billion last year, a commendable achievement when youconsider that in real terms this translates to an 8,2% reduction inoperating expenses. This can be attributed to lower employee cost, lowerbad debts as we improvedour credit vetting processes and efficienciesgained on various cost management initiatives including a reduction inmarketing expenditure and lower inventory write-offs. We began to realisesome significant efficiencies in our third party spend by improving ourfacilities management, and rationalising our property portfolio.
This resulted in an improvement in EBITDA, which grew 3,8% to R8,4billion. Our free cash flow remained strong at R1,2 billion, after capitalinvestment of R6,5 billion, which increased 12,0% year-on- year. This canbe largely attributed to the substantial investment in our Next GenerationNetwork. The Group is lowly geared, with year-on- year net debt decreasing0,8% to R2,1 billion, which will ensure that we remain in a position tofund our capital expenditure programme.
ProspectsBased on our guidance provided in November 2013, the Group plans to
reinstate the dividend in the 2015 financial year, subject to thefinancial performance of the Group, the operating environment, growthopportunities and debt and cash flow levels. The Board has decided not todeclare a dividend in respect of the financial year ended 31 March 2014.
Going forward, we expect to see continued pressure on fixed-linevoice revenues, intensified by strong competition, a challengingmacro-economic environment and effects of regulatory interventions. Ourobjective to further stabilise and grow revenue is dependent oneffectively positioning our resources to drive value and achievingefficiencies across our operating cost base to improve EBITDA margins.This will require us to focus our capital expenditure on areas thatgenerate satisfactory returns for our shareholders, and to avoidunprofitable operations.
We aim to successfully conclude the proposed MTN South Africa andBusiness Connexion transactions within the current financial year,enabling us to rapidly fill gaps in our service and product offering,which we believe will improve Telkom’s competitiveness, profitability andability to provide fully converged solutions to our customers.
Financial Guidance
2015 2016 Stabilised Stabilised to grow to growRevenueEBITDA margin (%) 26-27 27-28Capex to revenue (%) 14-17 14-17Net debt to EBITDA ≤1 ≤1
Our intention is to reinstate the dividend in the 2015 financial year
The information above has not been reviewed or reported on by ourauditors.
Further cautionaryShareholders are referred to the cautionary announcements publishedon the Securities Exchange News Service of the JSE Limited on 6 and7 March 2014 and on 23 April 2014. Shareholders are advised that Telkom andMTN South Africa remain in discussions regarding the potential extensionof their existing roaming agreement to include bilateral roaming andoutsourcing of the operation of Telkom’s radio access network, which ifsuccessfully concluded may have a material effect on the price of Telkom’ssecurities.
Accordingly, shareholders are advised to continue to exercisecaution when dealing in Telkom securities until a further announcement inthis regard is made.
Results from operationsThe Group recorded a profit after tax of R4 billion. This is significantlyhigher than the previous year and was driven by:• a R2 169 million net curtailment gain recognised on the post- retirementmedical aid liability and R246 million related tax benefit on the R878million settlement;• the R12 billion asset impairment included in the 2013 financial year;• R592 million provision for the Competition Commission finesincluded in the prior year; and• R434 million voluntary severance and early retirement costincluded in the prior year.
As we reported at our interim results, the company reassessed theunderlying assumptions used to determine the value of the post- retirementmedical aid liability for qualifying employees. The growth assumption for
the subsidisation amount at retirement was capped at 0% and employees wereoffered a settlement calculated at the economic value of their liability.This curtailment and subsequent settlement was the main contributor to anet non-cash gain of approximately R2 169 million and a reduction in thepost- retirement medical aid liability.
The once-off items above are not part of the results from coreoperations for the year under review and have therefore been excluded fromthe discussion below.
The Group recorded a profit after tax of R1 577 million (2013: R1 494million) and EBITDA of R8 370 million (2013: R8 061 million).
The changes from our transformation process are starting to positivelyimpact our financial performance. However, we still face significantchallenges in our fixed-line voice and mobile business, includingfixed-to-mobile substitution and being the fourth entrant into a highlycompetitive mobile market. Our net revenue decreased by 0,4%, driven by acontinued decline in fixed voice revenue, partially offset by lowerpayments to mobile operators which resulted from the reduction in mobiletermination rates. We recorded promising growth of 80,2% in mobile datarevenue and 69,3% in IT Business services revenue. Data revenue nowconstitutes approximately 33,8% of Group revenue which increased 1,7%from the prior reporting period. Data volumes, however, were negativelyimpacted by an increasingly competitive pricing landscape.
We managed to reduce operating cost by 2,1%. This reduction waslargely driven by lower full time and part time employee costs and bonuspayments, lower bad debts from improved credit vetting systems, andsavings on materials and maintenance from efficiencies gained from variouscost management initiatives. In addition, we reduced marketing expenditureand managed to limit inventory write-offs.
The Group generated strong cash flows, resulting in a healthy capitalstructure. In addition, interest bearing debt decreased38,5% to R4,1 billion at 31 March 2014.
Report structureIn line with the Group’s convergence strategy, key performance indicatorsare measured and evaluated on a Group-wide basis. The Group thereforeconsists of one operating segment.
However, this report provides further details of the fixed-line businesswhich offers fixed-line access and data communication services throughTelkom South Africa, and the mobile business which offers mobile voiceservices, data services and handset sales through Telkom Mobile. Thecontribution of the subsidiaries, Trudon and Swiftnet, are also shownseparately. The Telkom category represents Telkom Company’s contributionto the Group including consolidation entries.
The comparative information for March 2013 has been restated as a resultof the adoption of IAS 19R, the amendment to IAS 16, the reclassificationof iWayAfrica as a discontinued operation and to account for the change inaccounting policy regarding the Cell Captive. Refer to note 2.1 in thecondensed consolidated provisional financial statements.
In addition the following items have been reclassified to provide morerelevant disclosure:• Direct cost of R373 million and cost of sales of R1 176 millionhave been reclassified from selling, general and administrative expensesto direct cost and cost of sales, respectively.• Sundry revenue of R128 million has been reclassified from selling,general and administrative expenses to other income.• Motor insurance scheme expenses of R84 million, previously included inservice fees, has been reclassified to employee expenses.
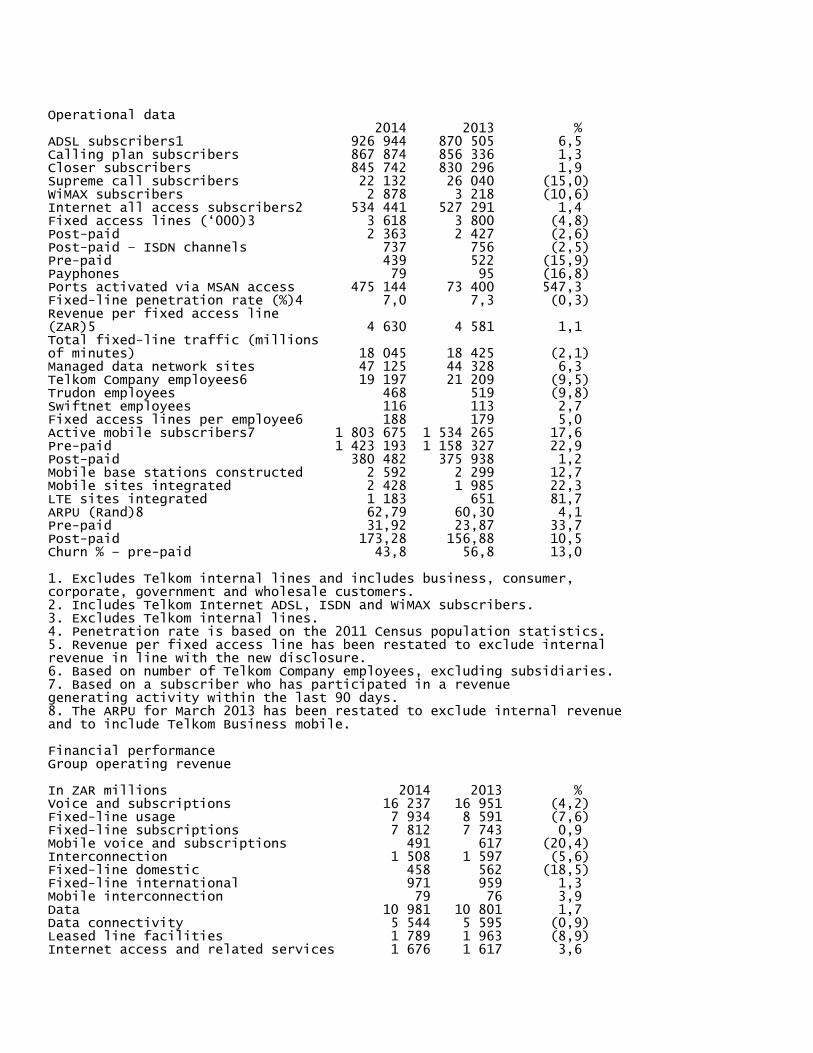
Operational data 2014 2013 %ADSL subscribers1 926 944 870 505 6,5Calling plan subscribers 867 874 856 336 1,3Closer subscribers 845 742 830 296 1,9Supreme call subscribers 22 132 26 040 (15,0)WiMAX subscribers 2 878 3 218 (10,6)Internet all access subscribers2 534 441 527 291 1,4Fixed access lines (‘000)3 3 618 3 800 (4,8)Post-paid 2 363 2 427 (2,6)Post-paid – ISDN channels 737 756 (2,5)Pre-paid 439 522 (15,9)Payphones 79 95 (16,8)Ports activated via MSAN access 475 144 73 400 547,3Fixed-line penetration rate (%)4 7,0 7,3 (0,3)Revenue per fixed access line(ZAR)5 4 630 4 581 1,1Total fixed-line traffic (millionsof minutes) 18 045 18 425 (2,1)Managed data network sites 47 125 44 328 6,3Telkom Company employees6 19 197 21 209 (9,5)Trudon employees 468 519 (9,8)Swiftnet employees 116 113 2,7Fixed access lines per employee6 188 179 5,0Active mobile subscribers7 1 803 675 1 534 265 17,6Pre-paid 1 423 193 1 158 327 22,9Post-paid 380 482 375 938 1,2Mobile base stations constructed 2 592 2 299 12,7Mobile sites integrated 2 428 1 985 22,3LTE sites integrated 1 183 651 81,7ARPU (Rand)8 62,79 60,30 4,1Pre-paid 31,92 23,87 33,7Post-paid 173,28 156,88 10,5Churn % – pre-paid 43,8 56,8 13,0
1. Excludes Telkom internal lines and includes business, consumer,corporate, government and wholesale customers.2. Includes Telkom Internet ADSL, ISDN and WiMAX subscribers.3. Excludes Telkom internal lines.4. Penetration rate is based on the 2011 Census population statistics.5. Revenue per fixed access line has been restated to exclude internalrevenue in line with the new disclosure.6. Based on number of Telkom Company employees, excluding subsidiaries.7. Based on a subscriber who has participated in a revenuegenerating activity within the last 90 days.8. The ARPU for March 2013 has been restated to exclude internal revenueand to include Telkom Business mobile.
Financial performanceGroup operating revenue
In ZAR millions 2014 2013 %Voice and subscriptions 16 237 16 951 (4,2)Fixed-line usage 7 934 8 591 (7,6)Fixed-line subscriptions 7 812 7 743 0,9Mobile voice and subscriptions 491 617 (20,4)Interconnection 1 508 1 597 (5,6)Fixed-line domestic 458 562 (18,5)Fixed-line international 971 959 1,3Mobile interconnection 79 76 3,9Data 10 981 10 801 1,7Data connectivity 5 544 5 595 (0,9)Leased line facilities 1 789 1 963 (8,9)Internet access and related services 1 676 1 617 3,6
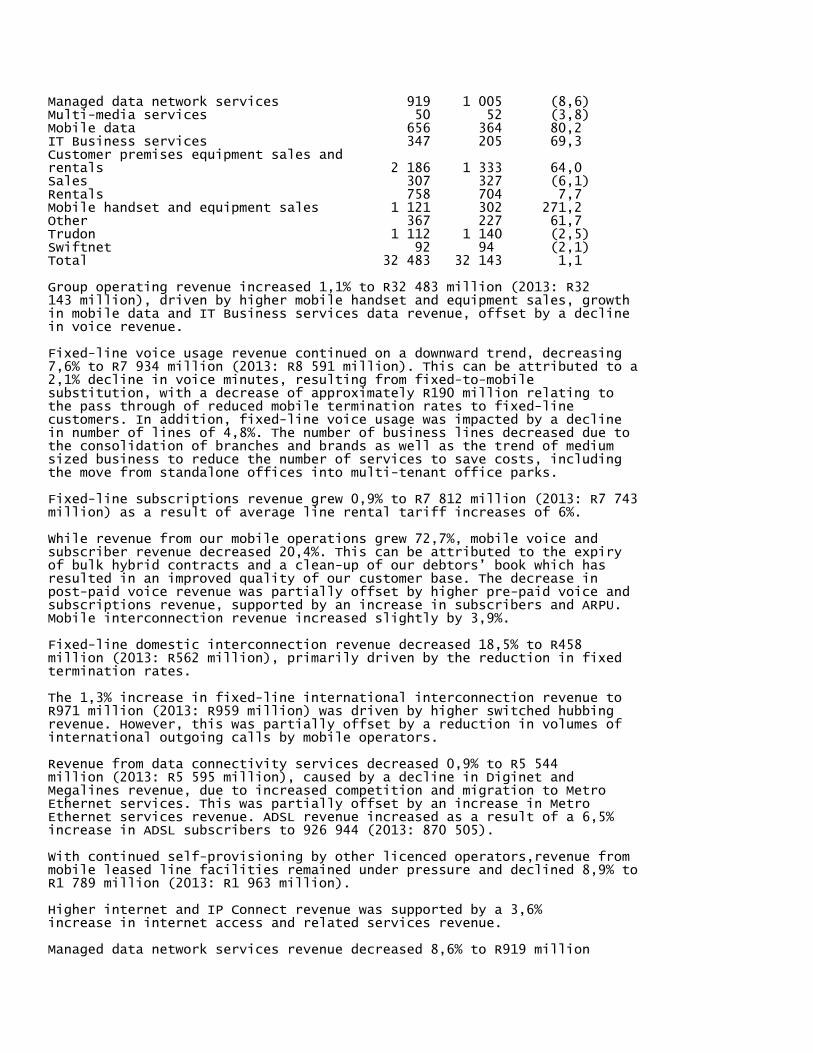
Managed data network services 919 1 005 (8,6)Multi-media services 50 52 (3,8)Mobile data 656 364 80,2IT Business services 347 205 69,3Customer premises equipment sales andrentals 2 186 1 333 64,0Sales 307 327 (6,1)Rentals 758 704 7,7Mobile handset and equipment sales 1 121 302 271,2Other 367 227 61,7Trudon 1 112 1 140 (2,5)Swiftnet 92 94 (2,1)Total 32 483 32 143 1,1
Group operating revenue increased 1,1% to R32 483 million (2013: R32143 million), driven by higher mobile handset and equipment sales, growthin mobile data and IT Business services data revenue, offset by a declinein voice revenue.
Fixed-line voice usage revenue continued on a downward trend, decreasing7,6% to R7 934 million (2013: R8 591 million). This can be attributed to a2,1% decline in voice minutes, resulting from fixed-to-mobilesubstitution, with a decrease of approximately R190 million relating tothe pass through of reduced mobile termination rates to fixed-linecustomers. In addition, fixed-line voice usage was impacted by a declinein number of lines of 4,8%. The number of business lines decreased due tothe consolidation of branches and brands as well as the trend of mediumsized business to reduce the number of services to save costs, includingthe move from standalone offices into multi-tenant office parks.
Fixed-line subscriptions revenue grew 0,9% to R7 812 million (2013: R7 743million) as a result of average line rental tariff increases of 6%.
While revenue from our mobile operations grew 72,7%, mobile voice andsubscriber revenue decreased 20,4%. This can be attributed to the expiryof bulk hybrid contracts and a clean-up of our debtors’ book which hasresulted in an improved quality of our customer base. The decrease inpost-paid voice revenue was partially offset by higher pre-paid voice andsubscriptions revenue, supported by an increase in subscribers and ARPU.Mobile interconnection revenue increased slightly by 3,9%.
Fixed-line domestic interconnection revenue decreased 18,5% to R458million (2013: R562 million), primarily driven by the reduction in fixedtermination rates.
The 1,3% increase in fixed-line international interconnection revenue toR971 million (2013: R959 million) was driven by higher switched hubbingrevenue. However, this was partially offset by a reduction in volumes ofinternational outgoing calls by mobile operators.
Revenue from data connectivity services decreased 0,9% to R5 544million (2013: R5 595 million), caused by a decline in Diginet andMegalines revenue, due to increased competition and migration to MetroEthernet services. This was partially offset by an increase in MetroEthernet services revenue. ADSL revenue increased as a result of a 6,5%increase in ADSL subscribers to 926 944 (2013: 870 505).
With continued self-provisioning by other licenced operators,revenue frommobile leased line facilities remained under pressure and declined 8,9% toR1 789 million (2013: R1 963 million).
Higher internet and IP Connect revenue was supported by a 3,6%increase in internet access and related services revenue.
Managed data network services revenue decreased 8,6% to R919 million
(2013: R1 005 million) which was caused by a reclassification of revenueto IT services revenue of approximately R62 million from 1 April 2013,discounts offered to customers and the migration of customers to lower costsolutions. We increased the number of sites by 6,3% to 47 125 (2013: 44 328).
In line with our strategy to focus on data, we offered enticing datadeals and promotional products which led to an increase in datasubscribers, and a 80,2% increase in mobile data revenue to R656 million(2013: R364 million).
We made some key strategic wins in the IT market during the year whichboosted our IT Business services data revenue which increased69,3% to R347 million (2013: R205 million).
A strategic decision was made to discontinue sales of PC and gamingequipment, which caused a 6,1% decline in customer premises equipmentsales to R307 million (2013: R327 million). Despite this, our rentalsincreased 7,7% to R758 million (2013: R704 million) due to increaseduptake in next generation equipment rentals and higher tariffs.
Mobile handset and equipment sales revenue increased 271,2%, drivenby higher bulk sales to dealers and a sharp increase in smartphone andtablet sales.
Other revenue increased 61,7% to R367 million (2013: R227 million) as werecognised higher revenue from expired cards and higher co-locationrevenue generated from an increase in the number of sites.
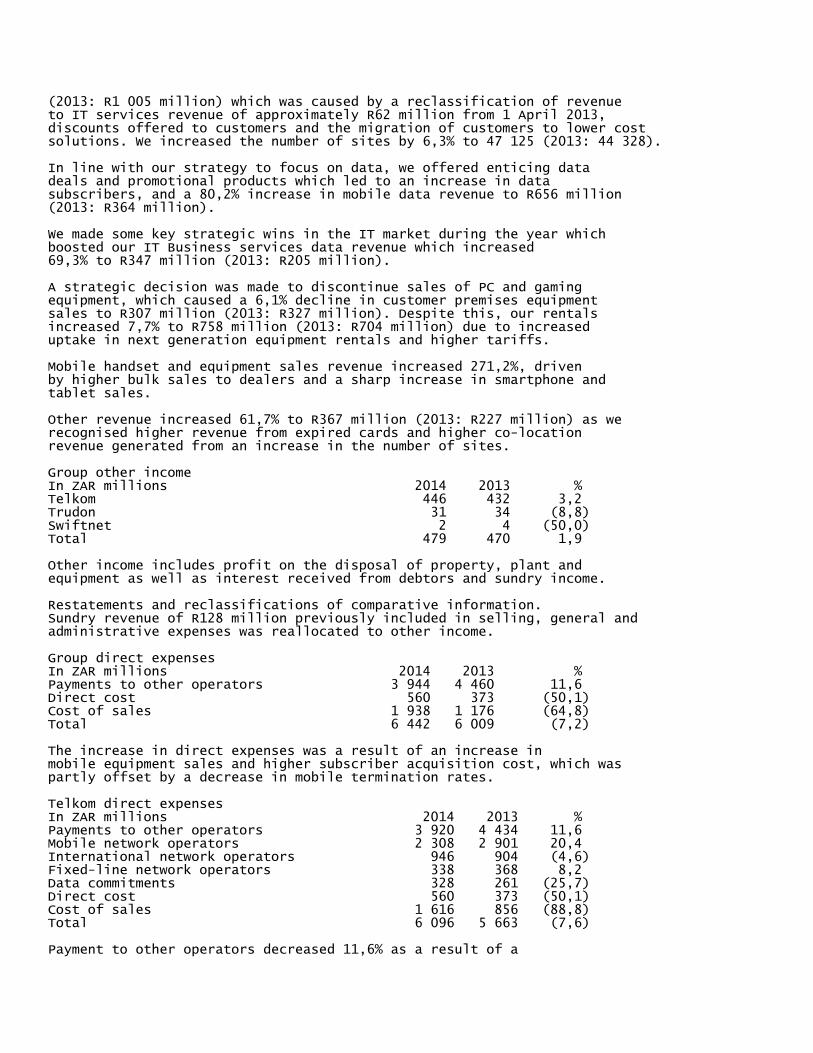
Group other incomeIn ZAR millions 2014 2013 %Telkom 446 432 3,2Trudon 31 34 (8,8)Swiftnet 2 4 (50,0)Total 479 470 1,9
Other income includes profit on the disposal of property, plant andequipment as well as interest received from debtors and sundry income.
Restatements and reclassifications of comparative information.Sundry revenue of R128 million previously included in selling, general andadministrative expenses was reallocated to other income.
Group direct expensesIn ZAR millions 2014 2013 %Payments to other operators 3 944 4 460 11,6Direct cost 560 373 (50,1)Cost of sales 1 938 1 176 (64,8)Total 6 442 6 009 (7,2)
The increase in direct expenses was a result of an increase inmobile equipment sales and higher subscriber acquisition cost, which waspartly offset by a decrease in mobile termination rates.
Telkom direct expensesIn ZAR millions 2014 2013 %Payments to other operators 3 920 4 434 11,6Mobile network operators 2 308 2 901 20,4International network operators 946 904 (4,6)Fixed-line network operators 338 368 8,2Data commitments 328 261 (25,7)Direct cost 560 373 (50,1)Cost of sales 1 616 856 (88,8)Total 6 096 5 663 (7,6)
Payment to other operators decreased 11,6% as a result of a
reduction in mobile termination rates which was moderately offset byhigher data commitments.
Direct cost grew 50,1% following an increase in mobile sales acquisitioncosts relating to an increase in active mobile subscribers.
The 88,8% increase in cost of sales is largely attributed to the increasein cost of mobile handsets and tablets sold.
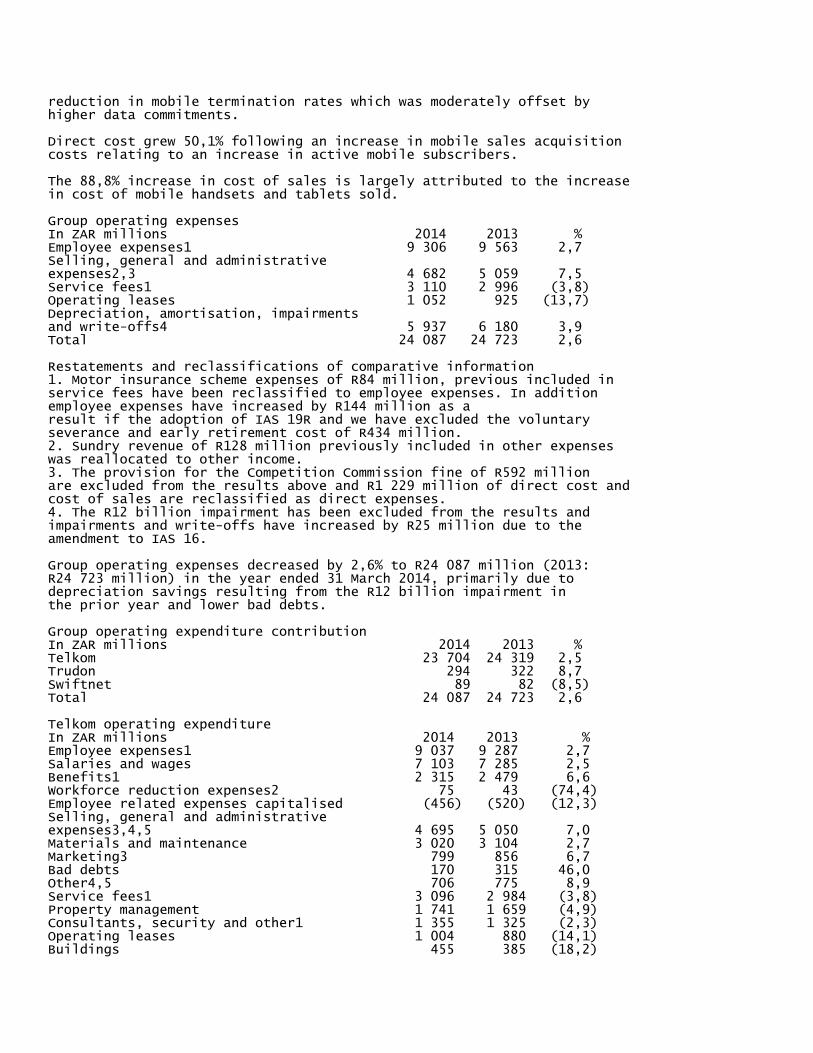
Group operating expensesIn ZAR millions 2014 2013 %Employee expenses1 9 306 9 563 2,7Selling, general and administrativeexpenses2,3 4 682 5 059 7,5Service fees1 3 110 2 996 (3,8)Operating leases 1 052 925 (13,7)Depreciation, amortisation, impairmentsand write-offs4 5 937 6 180 3,9Total 24 087 24 723 2,6
Restatements and reclassifications of comparative information1. Motor insurance scheme expenses of R84 million, previous included inservice fees have been reclassified to employee expenses. In additionemployee expenses have increased by R144 million as aresult if the adoption of IAS 19R and we have excluded the voluntaryseverance and early retirement cost of R434 million.2. Sundry revenue of R128 million previously included in other expenseswas reallocated to other income.3. The provision for the Competition Commission fine of R592 millionare excluded from the results above and R1 229 million of direct cost andcost of sales are reclassified as direct expenses.4. The R12 billion impairment has been excluded from the results andimpairments and write-offs have increased by R25 million due to theamendment to IAS 16.
Group operating expenses decreased by 2,6% to R24 087 million (2013:R24 723 million) in the year ended 31 March 2014, primarily due todepreciation savings resulting from the R12 billion impairment inthe prior year and lower bad debts.
Group operating expenditure contributionIn ZAR millions 2014 2013 %Telkom 23 704 24 319 2,5Trudon 294 322 8,7Swiftnet 89 82 (8,5)Total 24 087 24 723 2,6
Telkom operating expenditureIn ZAR millions 2014 2013 %Employee expenses1 9 037 9 287 2,7Salaries and wages 7 103 7 285 2,5Benefits1 2 315 2 479 6,6Workforce reduction expenses2 75 43 (74,4)Employee related expenses capitalised (456) (520) (12,3)Selling, general and administrativeexpenses3,4,5 4 695 5 050 7,0Materials and maintenance 3 020 3 104 2,7Marketing3 799 856 6,7Bad debts 170 315 46,0Other4,5 706 775 8,9Service fees1 3 096 2 984 (3,8)Property management 1 741 1 659 (4,9)Consultants, security and other1 1 355 1 325 (2,3)Operating leases 1 004 880 (14,1)Buildings 455 385 (18,2)
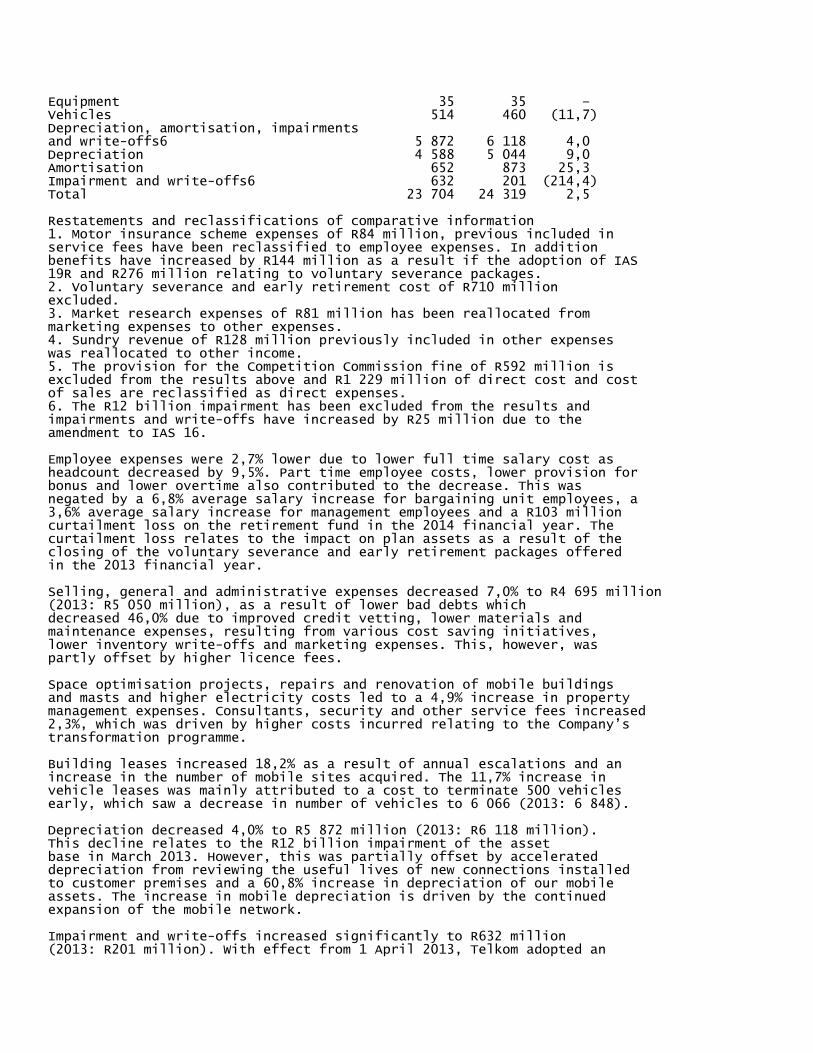
Equipment 35 35 –Vehicles 514 460 (11,7)Depreciation, amortisation, impairmentsand write-offs6 5 872 6 118 4,0Depreciation 4 588 5 044 9,0Amortisation 652 873 25,3Impairment and write-offs6 632 201 (214,4)Total 23 704 24 319 2,5
Restatements and reclassifications of comparative information1. Motor insurance scheme expenses of R84 million, previous included inservice fees have been reclassified to employee expenses. In additionbenefits have increased by R144 million as a result if the adoption of IAS19R and R276 million relating to voluntary severance packages.2. Voluntary severance and early retirement cost of R710 millionexcluded.3. Market research expenses of R81 million has been reallocated frommarketing expenses to other expenses.4. Sundry revenue of R128 million previously included in other expenseswas reallocated to other income.5. The provision for the Competition Commission fine of R592 million isexcluded from the results above and R1 229 million of direct cost and costof sales are reclassified as direct expenses.6. The R12 billion impairment has been excluded from the results andimpairments and write-offs have increased by R25 million due to theamendment to IAS 16.
Employee expenses were 2,7% lower due to lower full time salary cost asheadcount decreased by 9,5%. Part time employee costs, lower provision forbonus and lower overtime also contributed to the decrease. This wasnegated by a 6,8% average salary increase for bargaining unit employees, a3,6% average salary increase for management employees and a R103 millioncurtailment loss on the retirement fund in the 2014 financial year. Thecurtailment loss relates to the impact on plan assets as a result of theclosing of the voluntary severance and early retirement packages offeredin the 2013 financial year.
Selling, general and administrative expenses decreased 7,0% to R4 695 million(2013: R5 050 million), as a result of lower bad debts whichdecreased 46,0% due to improved credit vetting, lower materials andmaintenance expenses, resulting from various cost saving initiatives,lower inventory write-offs and marketing expenses. This, however, waspartly offset by higher licence fees.
Space optimisation projects, repairs and renovation of mobile buildingsand masts and higher electricity costs led to a 4,9% increase in propertymanagement expenses. Consultants, security and other service fees increased2,3%, which was driven by higher costs incurred relating to the Company’stransformation programme.
Building leases increased 18,2% as a result of annual escalations and anincrease in the number of mobile sites acquired. The 11,7% increase invehicle leases was mainly attributed to a cost to terminate 500 vehiclesearly, which saw a decrease in number of vehicles to 6 066 (2013: 6 848).
Depreciation decreased 4,0% to R5 872 million (2013: R6 118 million).This decline relates to the R12 billion impairment of the assetbase in March 2013. However, this was partially offset by accelerateddepreciation from reviewing the useful lives of new connections installedto customer premises and a 60,8% increase in depreciation of our mobileassets. The increase in mobile depreciation is driven by the continuedexpansion of the mobile network.
Impairment and write-offs increased significantly to R632 million(2013: R201 million). With effect from 1 April 2013, Telkom adopted an
amendment to IAS 16, property, plant and equipment (PPE) which clarifiesthat spare parts previously included in inventory be classified as PPE ifthey meet the definition of PPE. Consequently, certain legacy andtechnologically aged items were reclassified to PPE from inventory. Animpairment was recognised regarding these assets in line with therequirements of IFRS.
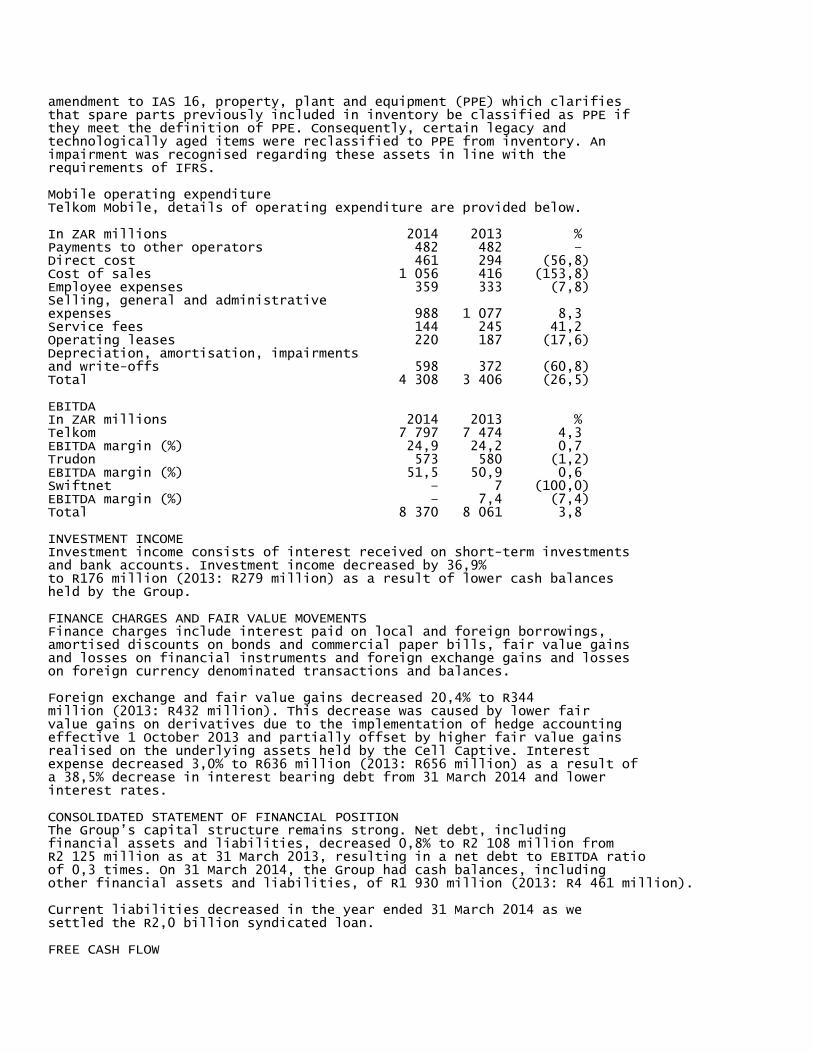
Mobile operating expenditureTelkom Mobile, details of operating expenditure are provided below.
In ZAR millions 2014 2013 %Payments to other operators 482 482 –Direct cost 461 294 (56,8)Cost of sales 1 056 416 (153,8)Employee expenses 359 333 (7,8)Selling, general and administrativeexpenses 988 1 077 8,3Service fees 144 245 41,2Operating leases 220 187 (17,6)Depreciation, amortisation, impairmentsand write-offs 598 372 (60,8)Total 4 308 3 406 (26,5)
EBITDAIn ZAR millions 2014 2013 %Telkom 7 797 7 474 4,3EBITDA margin (%) 24,9 24,2 0,7Trudon 573 580 (1,2)EBITDA margin (%) 51,5 50,9 0,6Swiftnet – 7 (100,0)EBITDA margin (%) – 7,4 (7,4)Total 8 370 8 061 3,8
INVESTMENT INCOMEInvestment income consists of interest received on short-term investmentsand bank accounts. Investment income decreased by 36,9%to R176 million (2013: R279 million) as a result of lower cash balancesheld by the Group.
FINANCE CHARGES AND FAIR VALUE MOVEMENTSFinance charges include interest paid on local and foreign borrowings,amortised discounts on bonds and commercial paper bills, fair value gainsand losses on financial instruments and foreign exchange gains and losseson foreign currency denominated transactions and balances.
Foreign exchange and fair value gains decreased 20,4% to R344million (2013: R432 million). This decrease was caused by lower fairvalue gains on derivatives due to the implementation of hedge accountingeffective 1 October 2013 and partially offset by higher fair value gainsrealised on the underlying assets held by the Cell Captive. Interestexpense decreased 3,0% to R636 million (2013: R656 million) as a result ofa 38,5% decrease in interest bearing debt from 31 March 2014 and lowerinterest rates.
CONSOLIDATED STATEMENT OF FINANCIAL POSITIONThe Group’s capital structure remains strong. Net debt, includingfinancial assets and liabilities, decreased 0,8% to R2 108 million fromR2 125 million as at 31 March 2013, resulting in a net debt to EBITDA ratioof 0,3 times. On 31 March 2014, the Group had cash balances, includingother financial assets and liabilities, of R1 930 million (2013: R4 461 million).
Current liabilities decreased in the year ended 31 March 2014 as wesettled the R2,0 billion syndicated loan.
FREE CASH FLOW
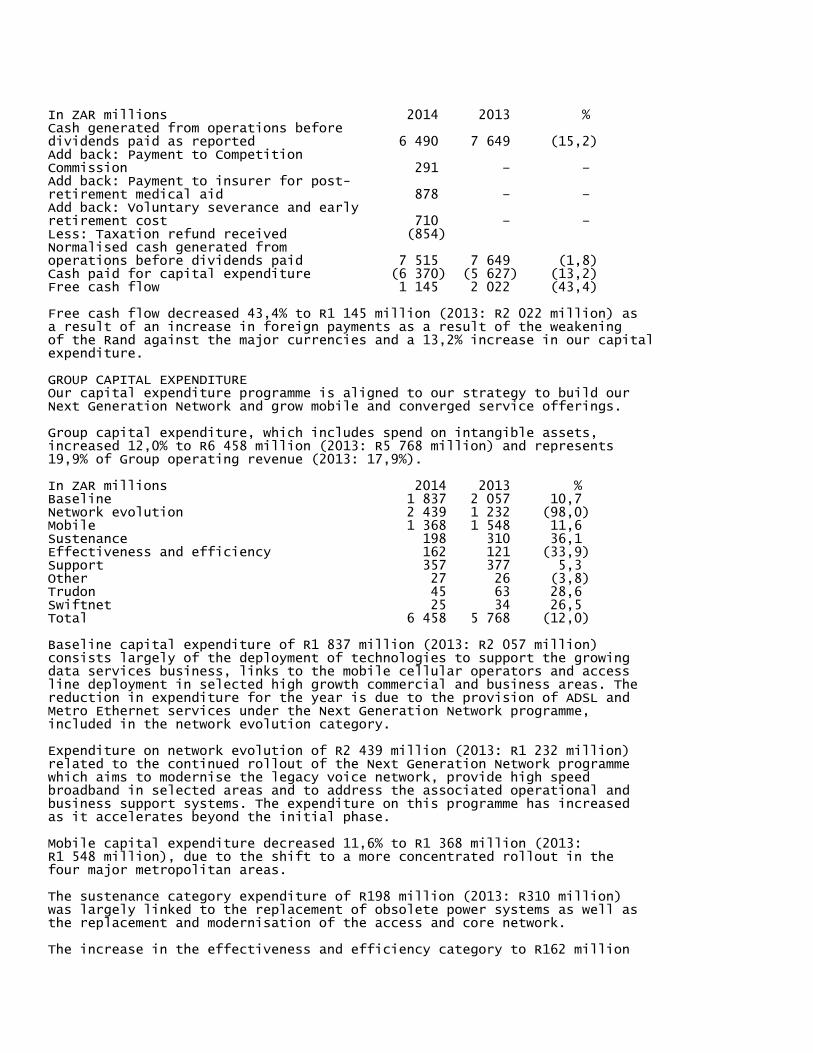
In ZAR millions 2014 2013 %Cash generated from operations beforedividends paid as reported 6 490 7 649 (15,2)Add back: Payment to CompetitionCommission 291 – –Add back: Payment to insurer for post-retirement medical aid 878 – –Add back: Voluntary severance and earlyretirement cost 710 – –Less: Taxation refund received (854)Normalised cash generated fromoperations before dividends paid 7 515 7 649 (1,8)Cash paid for capital expenditure (6 370) (5 627) (13,2)Free cash flow 1 145 2 022 (43,4)
Free cash flow decreased 43,4% to R1 145 million (2013: R2 022 million) asa result of an increase in foreign payments as a result of the weakeningof the Rand against the major currencies and a 13,2% increase in our capitalexpenditure.
GROUP CAPITAL EXPENDITUREOur capital expenditure programme is aligned to our strategy to build ourNext Generation Network and grow mobile and converged service offerings.
Group capital expenditure, which includes spend on intangible assets,increased 12,0% to R6 458 million (2013: R5 768 million) and represents19,9% of Group operating revenue (2013: 17,9%).
In ZAR millions 2014 2013 %Baseline 1 837 2 057 10,7Network evolution 2 439 1 232 (98,0)Mobile 1 368 1 548 11,6Sustenance 198 310 36,1Effectiveness and efficiency 162 121 (33,9)Support 357 377 5,3Other 27 26 (3,8)Trudon 45 63 28,6Swiftnet 25 34 26,5Total 6 458 5 768 (12,0)
Baseline capital expenditure of R1 837 million (2013: R2 057 million)consists largely of the deployment of technologies to support the growingdata services business, links to the mobile cellular operators and accessline deployment in selected high growth commercial and business areas. Thereduction in expenditure for the year is due to the provision of ADSL andMetro Ethernet services under the Next Generation Network programme,included in the network evolution category.
Expenditure on network evolution of R2 439 million (2013: R1 232 million)related to the continued rollout of the Next Generation Network programmewhich aims to modernise the legacy voice network, provide high speedbroadband in selected areas and to address the associated operational andbusiness support systems. The expenditure on this programme has increasedas it accelerates beyond the initial phase.
Mobile capital expenditure decreased 11,6% to R1 368 million (2013:R1 548 million), due to the shift to a more concentrated rollout in thefour major metropolitan areas.
The sustenance category expenditure of R198 million (2013: R310 million)was largely linked to the replacement of obsolete power systems as well asthe replacement and modernisation of the access and core network.
The increase in the effectiveness and efficiency category to R162 million
(2013: R121 million) was as a result of the movement of staff from leasedbuildings to owned buildings and various IT efficiency projects.
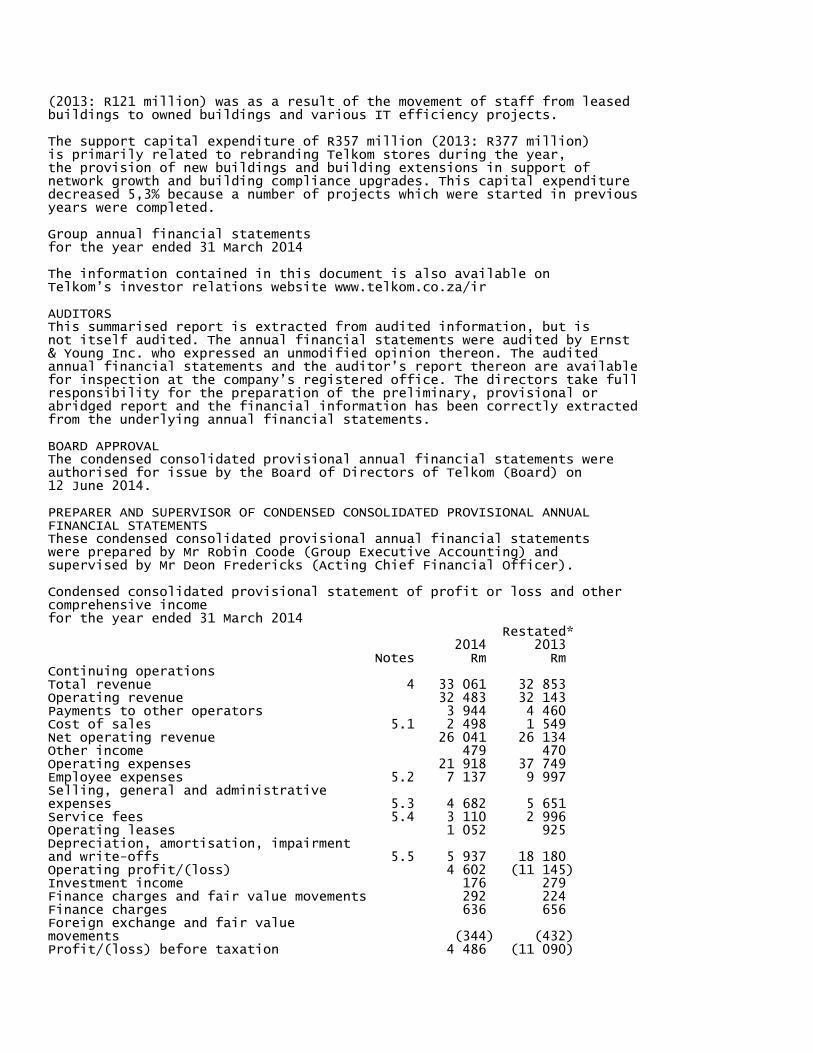
The support capital expenditure of R357 million (2013: R377 million)is primarily related to rebranding Telkom stores during the year,the provision of new buildings and building extensions in support ofnetwork growth and building compliance upgrades. This capital expendituredecreased 5,3% because a number of projects which were started in previousyears were completed.
Group annual financial statementsfor the year ended 31 March 2014
The information contained in this document is also available onTelkom’s investor relations website www.telkom.co.za/ir
AUDITORSThis summarised report is extracted from audited information, but isnot itself audited. The annual financial statements were audited by Ernst& Young Inc. who expressed an unmodified opinion thereon. The auditedannual financial statements and the auditor’s report thereon are availablefor inspection at the company’s registered office. The directors take fullresponsibility for the preparation of the preliminary, provisional orabridged report and the financial information has been correctly extractedfrom the underlying annual financial statements.
BOARD APPROVALThe condensed consolidated provisional annual financial statements wereauthorised for issue by the Board of Directors of Telkom (Board) on12 June 2014.
PREPARER AND SUPERVISOR OF CONDENSED CONSOLIDATED PROVISIONAL ANNUALFINANCIAL STATEMENTSThese condensed consolidated provisional annual financial statementswere prepared by Mr Robin Coode (Group Executive Accounting) andsupervised by Mr Deon Fredericks (Acting Chief Financial Officer).
Condensed consolidated provisional statement of profit or loss and othercomprehensive incomefor the year ended 31 March 2014 Restated* 2014 2013 Notes Rm RmContinuing operationsTotal revenue 4 33 061 32 853Operating revenue 32 483 32 143Payments to other operators 3 944 4 460Cost of sales 5.1 2 498 1 549Net operating revenue 26 041 26 134Other income 479 470Operating expenses 21 918 37 749Employee expenses 5.2 7 137 9 997Selling, general and administrativeexpenses 5.3 4 682 5 651Service fees 5.4 3 110 2 996Operating leases 1 052 925Depreciation, amortisation, impairmentand write-offs 5.5 5 937 18 180Operating profit/(loss) 4 602 (11 145)Investment income 176 279Finance charges and fair value movements 292 224Finance charges 636 656Foreign exchange and fair valuemovements (344) (432)Profit/(loss) before taxation 4 486 (11 090)
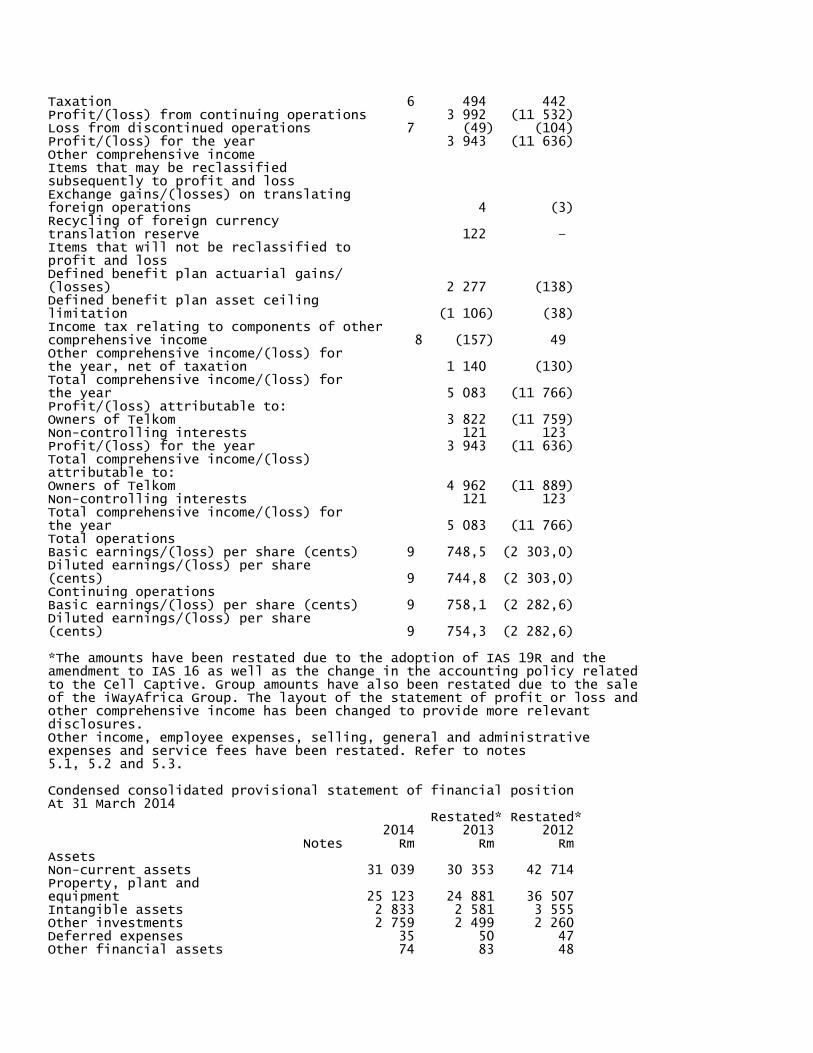
Taxation 6 494 442Profit/(loss) from continuing operations 3 992 (11 532)Loss from discontinued operations 7 (49) (104)Profit/(loss) for the year 3 943 (11 636)Other comprehensive incomeItems that may be reclassifiedsubsequently to profit and lossExchange gains/(losses) on translatingforeign operations 4 (3)Recycling of foreign currencytranslation reserve 122 –Items that will not be reclassified toprofit and lossDefined benefit plan actuarial gains/(losses) 2 277 (138)Defined benefit plan asset ceilinglimitation (1 106) (38)Income tax relating to components of othercomprehensive income 8 (157) 49Other comprehensive income/(loss) forthe year, net of taxation 1 140 (130)Total comprehensive income/(loss) forthe year 5 083 (11 766)Profit/(loss) attributable to:Owners of Telkom 3 822 (11 759)Non-controlling interests 121 123Profit/(loss) for the year 3 943 (11 636)Total comprehensive income/(loss)attributable to:Owners of Telkom 4 962 (11 889)Non-controlling interests 121 123Total comprehensive income/(loss) forthe year 5 083 (11 766)Total operationsBasic earnings/(loss) per share (cents) 9 748,5 (2 303,0)Diluted earnings/(loss) per share(cents) 9 744,8 (2 303,0)Continuing operationsBasic earnings/(loss) per share (cents) 9 758,1 (2 282,6)Diluted earnings/(loss) per share(cents) 9 754,3 (2 282,6)
*The amounts have been restated due to the adoption of IAS 19R and theamendment to IAS 16 as well as the change in the accounting policy relatedto the Cell Captive. Group amounts have also been restated due to the saleof the iWayAfrica Group. The layout of the statement of profit or loss andother comprehensive income has been changed to provide more relevantdisclosures.Other income, employee expenses, selling, general and administrativeexpenses and service fees have been restated. Refer to notes5.1, 5.2 and 5.3.
Condensed consolidated provisional statement of financial positionAt 31 March 2014 Restated* Restated* 2014 2013 2012 Notes Rm Rm RmAssetsNon-current assets 31 039 30 353 42 714Property, plant andequipment 25 123 24 881 36 507Intangible assets 2 833 2 581 3 555Other investments 2 759 2 499 2 260Deferred expenses 35 50 47Other financial assets 74 83 48
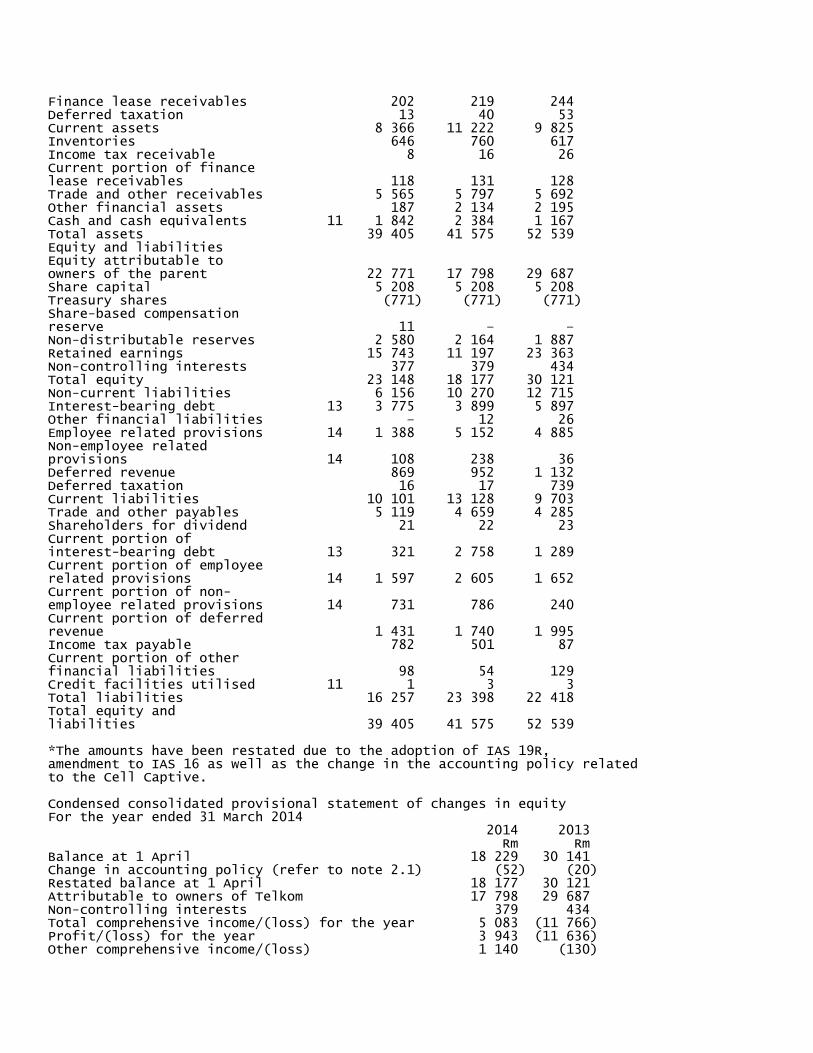
Finance lease receivables 202 219 244Deferred taxation 13 40 53Current assets 8 366 11 222 9 825Inventories 646 760 617Income tax receivable 8 16 26Current portion of financelease receivables 118 131 128Trade and other receivables 5 565 5 797 5 692Other financial assets 187 2 134 2 195Cash and cash equivalents 11 1 842 2 384 1 167Total assets 39 405 41 575 52 539Equity and liabilitiesEquity attributable toowners of the parent 22 771 17 798 29 687Share capital 5 208 5 208 5 208Treasury shares (771) (771) (771)Share-based compensationreserve 11 – –Non-distributable reserves 2 580 2 164 1 887Retained earnings 15 743 11 197 23 363Non-controlling interests 377 379 434Total equity 23 148 18 177 30 121Non-current liabilities 6 156 10 270 12 715Interest-bearing debt 13 3 775 3 899 5 897Other financial liabilities – 12 26Employee related provisions 14 1 388 5 152 4 885Non-employee relatedprovisions 14 108 238 36Deferred revenue 869 952 1 132Deferred taxation 16 17 739Current liabilities 10 101 13 128 9 703Trade and other payables 5 119 4 659 4 285Shareholders for dividend 21 22 23Current portion ofinterest-bearing debt 13 321 2 758 1 289Current portion of employeerelated provisions 14 1 597 2 605 1 652Current portion of non-employee related provisions 14 731 786 240Current portion of deferredrevenue 1 431 1 740 1 995Income tax payable 782 501 87Current portion of otherfinancial liabilities 98 54 129Credit facilities utilised 11 1 3 3Total liabilities 16 257 23 398 22 418Total equity andliabilities 39 405 41 575 52 539
*The amounts have been restated due to the adoption of IAS 19R,amendment to IAS 16 as well as the change in the accounting policy relatedto the Cell Captive.
Condensed consolidated provisional statement of changes in equityFor the year ended 31 March 2014 2014 2013 Rm RmBalance at 1 April 18 229 30 141Change in accounting policy (refer to note 2.1) (52) (20)Restated balance at 1 April 18 177 30 121Attributable to owners of Telkom 17 798 29 687Non-controlling interests 379 434Total comprehensive income/(loss) for the year 5 083 (11 766)Profit/(loss) for the year 3 943 (11 636)Other comprehensive income/(loss) 1 140 (130)
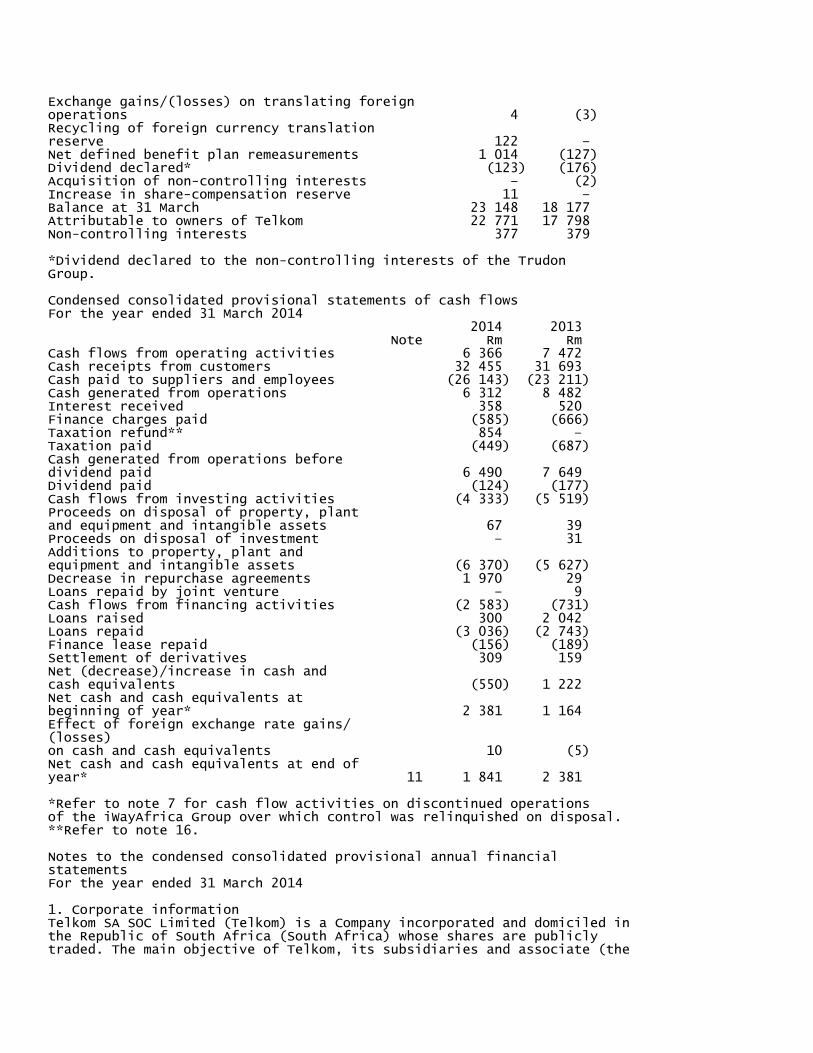
Exchange gains/(losses) on translating foreignoperations 4 (3)Recycling of foreign currency translationreserve 122 –Net defined benefit plan remeasurements 1 014 (127)Dividend declared* (123) (176)Acquisition of non-controlling interests – (2)Increase in share-compensation reserve 11 –Balance at 31 March 23 148 18 177Attributable to owners of Telkom 22 771 17 798Non-controlling interests 377 379
*Dividend declared to the non-controlling interests of the TrudonGroup.
Condensed consolidated provisional statements of cash flowsFor the year ended 31 March 2014 2014 2013 Note Rm RmCash flows from operating activities 6 366 7 472Cash receipts from customers 32 455 31 693Cash paid to suppliers and employees (26 143) (23 211)Cash generated from operations 6 312 8 482Interest received 358 520Finance charges paid (585) (666)Taxation refund** 854 –Taxation paid (449) (687)Cash generated from operations beforedividend paid 6 490 7 649Dividend paid (124) (177)Cash flows from investing activities (4 333) (5 519)Proceeds on disposal of property, plantand equipment and intangible assets 67 39Proceeds on disposal of investment – 31Additions to property, plant andequipment and intangible assets (6 370) (5 627)Decrease in repurchase agreements 1 970 29Loans repaid by joint venture – 9Cash flows from financing activities (2 583) (731)Loans raised 300 2 042Loans repaid (3 036) (2 743)Finance lease repaid (156) (189)Settlement of derivatives 309 159Net (decrease)/increase in cash andcash equivalents (550) 1 222Net cash and cash equivalents atbeginning of year* 2 381 1 164Effect of foreign exchange rate gains/(losses)on cash and cash equivalents 10 (5)Net cash and cash equivalents at end ofyear* 11 1 841 2 381
*Refer to note 7 for cash flow activities on discontinued operationsof the iWayAfrica Group over which control was relinquished on disposal.**Refer to note 16.
Notes to the condensed consolidated provisional annual financialstatementsFor the year ended 31 March 2014
1. Corporate informationTelkom SA SOC Limited (Telkom) is a Company incorporated and domiciled inthe Republic of South Africa (South Africa) whose shares are publiclytraded. The main objective of Telkom, its subsidiaries and associate (the
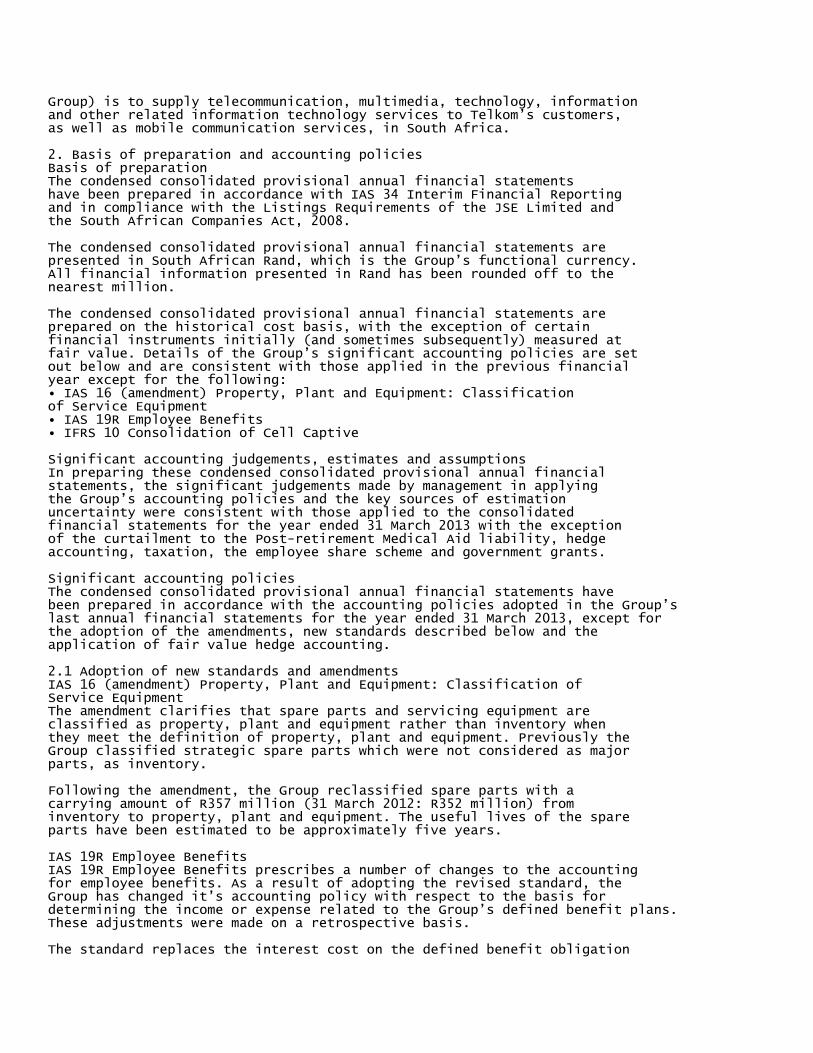
Group) is to supply telecommunication, multimedia, technology, informationand other related information technology services to Telkom’s customers,as well as mobile communication services, in South Africa.
2. Basis of preparation and accounting policiesBasis of preparationThe condensed consolidated provisional annual financial statementshave been prepared in accordance with IAS 34 Interim Financial Reportingand in compliance with the Listings Requirements of the JSE Limited andthe South African Companies Act, 2008.
The condensed consolidated provisional annual financial statements arepresented in South African Rand, which is the Group’s functional currency.All financial information presented in Rand has been rounded off to thenearest million.
The condensed consolidated provisional annual financial statements areprepared on the historical cost basis, with the exception of certainfinancial instruments initially (and sometimes subsequently) measured atfair value. Details of the Group’s significant accounting policies are setout below and are consistent with those applied in the previous financialyear except for the following:• IAS 16 (amendment) Property, Plant and Equipment: Classificationof Service Equipment• IAS 19R Employee Benefits• IFRS 10 Consolidation of Cell Captive
Significant accounting judgements, estimates and assumptionsIn preparing these condensed consolidated provisional annual financialstatements, the significant judgements made by management in applyingthe Group’s accounting policies and the key sources of estimationuncertainty were consistent with those applied to the consolidatedfinancial statements for the year ended 31 March 2013 with the exceptionof the curtailment to the Post-retirement Medical Aid liability, hedgeaccounting, taxation, the employee share scheme and government grants.
Significant accounting policiesThe condensed consolidated provisional annual financial statements havebeen prepared in accordance with the accounting policies adopted in the Group’slast annual financial statements for the year ended 31 March 2013, except forthe adoption of the amendments, new standards described below and theapplication of fair value hedge accounting.
2.1 Adoption of new standards and amendmentsIAS 16 (amendment) Property, Plant and Equipment: Classification ofService EquipmentThe amendment clarifies that spare parts and servicing equipment areclassified as property, plant and equipment rather than inventory whenthey meet the definition of property, plant and equipment. Previously theGroup classified strategic spare parts which were not considered as majorparts, as inventory.
Following the amendment, the Group reclassified spare parts with acarrying amount of R357 million (31 March 2012: R352 million) frominventory to property, plant and equipment. The useful lives of the spareparts have been estimated to be approximately five years.
IAS 19R Employee BenefitsIAS 19R Employee Benefits prescribes a number of changes to the accountingfor employee benefits. As a result of adopting the revised standard, theGroup has changed it’s accounting policy with respect to the basis fordetermining the income or expense related to the Group’s defined benefit plans.These adjustments were made on a retrospective basis.
The standard replaces the interest cost on the defined benefit obligation
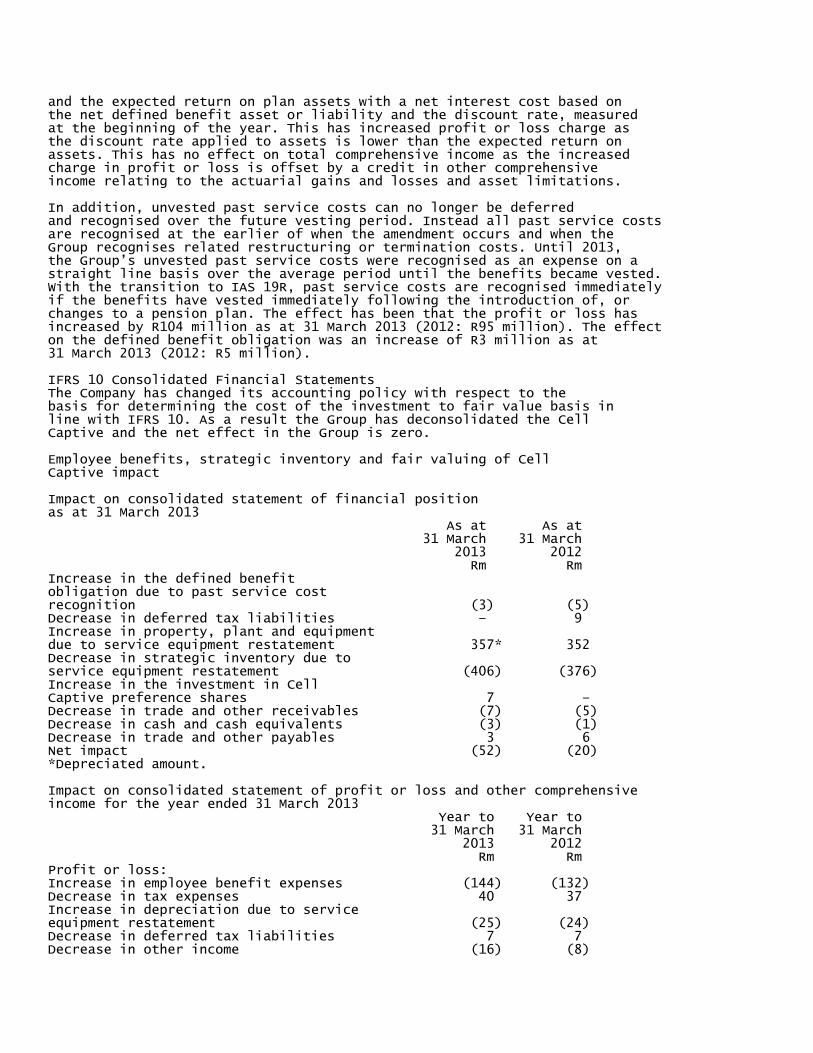
and the expected return on plan assets with a net interest cost based onthe net defined benefit asset or liability and the discount rate, measuredat the beginning of the year. This has increased profit or loss charge asthe discount rate applied to assets is lower than the expected return onassets. This has no effect on total comprehensive income as the increasedcharge in profit or loss is offset by a credit in other comprehensiveincome relating to the actuarial gains and losses and asset limitations.
In addition, unvested past service costs can no longer be deferredand recognised over the future vesting period. Instead all past service costsare recognised at the earlier of when the amendment occurs and when theGroup recognises related restructuring or termination costs. Until 2013,the Group’s unvested past service costs were recognised as an expense on astraight line basis over the average period until the benefits became vested.With the transition to IAS 19R, past service costs are recognised immediatelyif the benefits have vested immediately following the introduction of, orchanges to a pension plan. The effect has been that the profit or loss hasincreased by R104 million as at 31 March 2013 (2012: R95 million). The effecton the defined benefit obligation was an increase of R3 million as at31 March 2013 (2012: R5 million).
IFRS 10 Consolidated Financial StatementsThe Company has changed its accounting policy with respect to thebasis for determining the cost of the investment to fair value basis inline with IFRS 10. As a result the Group has deconsolidated the CellCaptive and the net effect in the Group is zero.
Employee benefits, strategic inventory and fair valuing of CellCaptive impact
Impact on consolidated statement of financial positionas at 31 March 2013 As at As at 31 March 31 March 2013 2012 Rm RmIncrease in the defined benefitobligation due to past service costrecognition (3) (5)Decrease in deferred tax liabilities – 9Increase in property, plant and equipmentdue to service equipment restatement 357* 352Decrease in strategic inventory due toservice equipment restatement (406) (376)Increase in the investment in CellCaptive preference shares 7 –Decrease in trade and other receivables (7) (5)Decrease in cash and cash equivalents (3) (1)Decrease in trade and other payables 3 6Net impact (52) (20)*Depreciated amount.
Impact on consolidated statement of profit or loss and other comprehensiveincome for the year ended 31 March 2013 Year to Year to 31 March 31 March 2013 2012 Rm RmProfit or loss:Increase in employee benefit expenses (144) (132)Decrease in tax expenses 40 37Increase in depreciation due to serviceequipment restatement (25) (24)Decrease in deferred tax liabilities 7 7Decrease in other income (16) (8)
Decrease in service fees 6 3Decrease in investment income (22) (23)Increase in fair value gains 28 28Decrease in taxation 4 –Net decrease in profit for the year (122) (112)Equity holders of the parent (122) (112)Other comprehensive incomeIncrease in remeasurement movement in OCI 146 127Increase in tax effect on remeasurementmovements in OCI (41) (35)Net increase in other comprehensive income 105 92Equity holders of the parent 105 92
There was no material impact on the Group’s consolidated statementof cash flows. The basic and diluted earnings per share moved from a lossof 2 276,2 cents as previously reported to a loss of 2 303,0 cents for theyear ended 31 March 2013. The headline earnings and diluted headlineearnings per share moved from 87,0 cents as previously reported to 60,1cents for the year ended 31 March 2013.
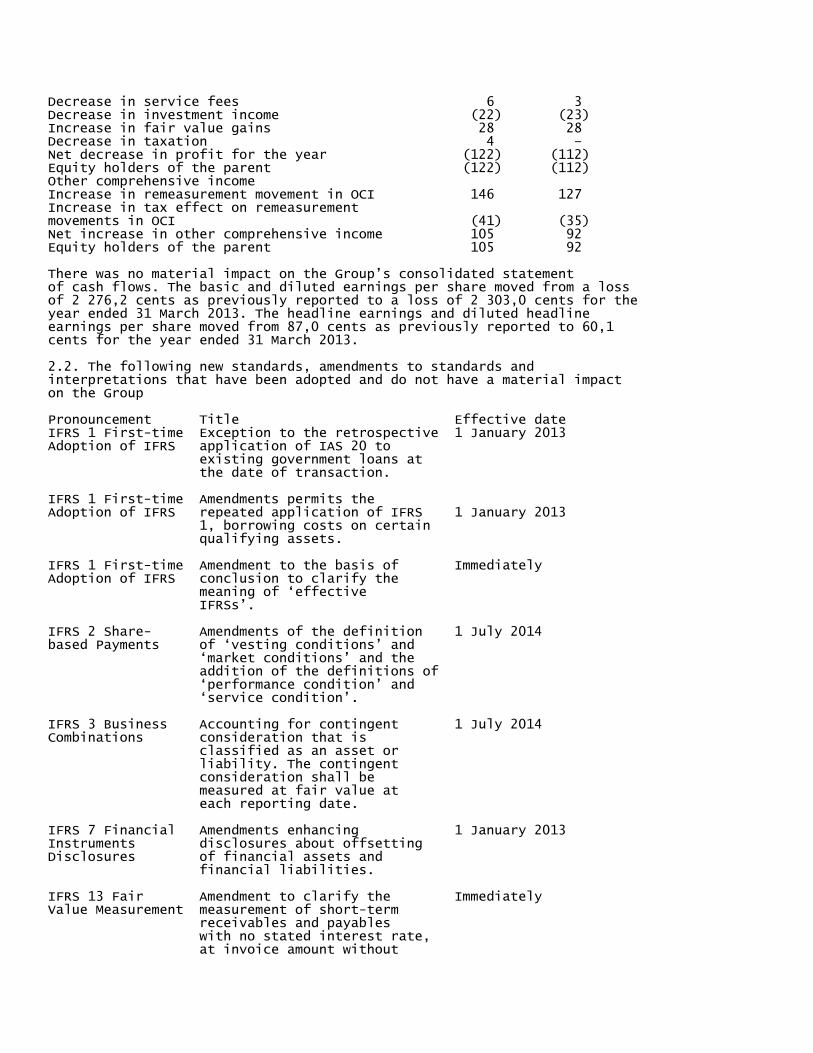
2.2. The following new standards, amendments to standards andinterpretations that have been adopted and do not have a material impacton the Group
Pronouncement Title Effective dateIFRS 1 First-time Exception to the retrospective 1 January 2013Adoption of IFRS application of IAS 20 to existing government loans at the date of transaction.
IFRS 1 First-time Amendments permits theAdoption of IFRS repeated application of IFRS 1 January 2013 1, borrowing costs on certain qualifying assets.
IFRS 1 First-time Amendment to the basis of ImmediatelyAdoption of IFRS conclusion to clarify the meaning of ‘effective IFRSs’.
IFRS 2 Share- Amendments of the definition 1 July 2014based Payments of ‘vesting conditions’ and ‘market conditions’ and the addition of the definitions of ‘performance condition’ and ‘service condition’.
IFRS 3 Business Accounting for contingent 1 July 2014Combinations consideration that is classified as an asset or liability. The contingent consideration shall be measured at fair value at each reporting date.
IFRS 7 Financial Amendments enhancing 1 January 2013Instruments disclosures about offsettingDisclosures of financial assets and financial liabilities.
IFRS 13 Fair Amendment to clarify the ImmediatelyValue Measurement measurement of short-term receivables and payables with no stated interest rate, at invoice amount without
discounting, when the effect of not discounting is immaterial.
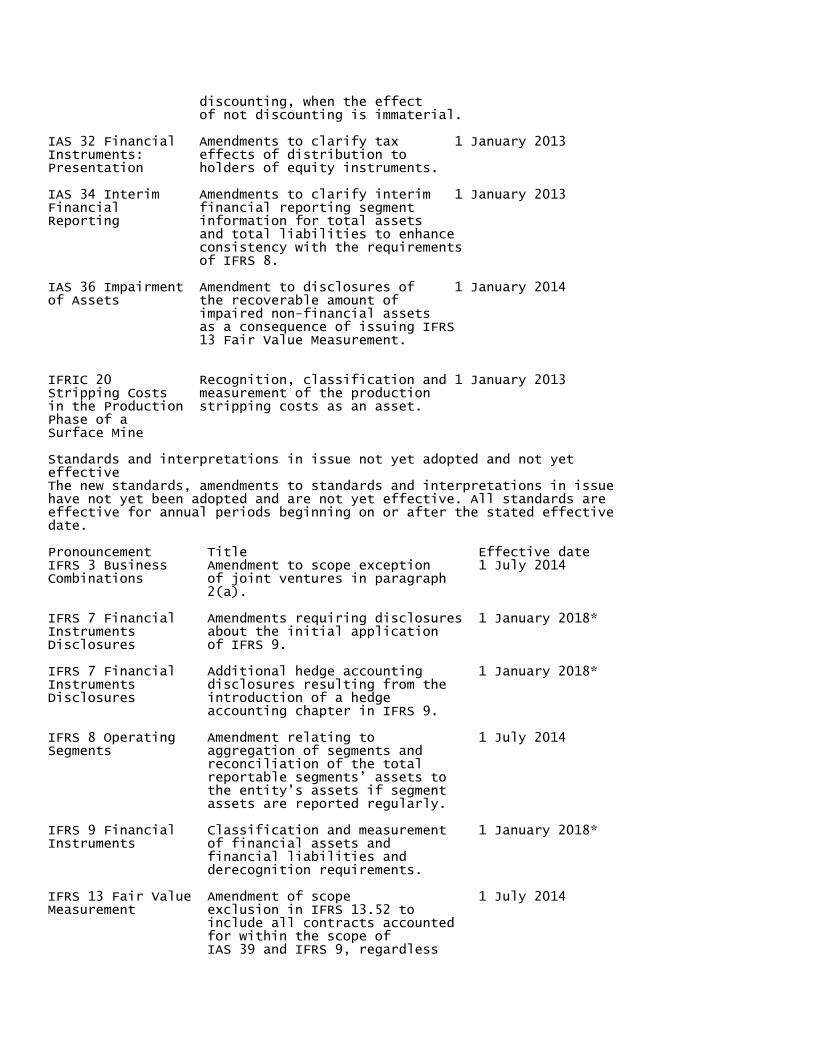
IAS 32 Financial Amendments to clarify tax 1 January 2013Instruments: effects of distribution toPresentation holders of equity instruments.
IAS 34 Interim Amendments to clarify interim 1 January 2013Financial financial reporting segmentReporting information for total assets and total liabilities to enhance consistency with the requirements of IFRS 8.
IAS 36 Impairment Amendment to disclosures of 1 January 2014of Assets the recoverable amount of impaired non-financial assets as a consequence of issuing IFRS 13 Fair Value Measurement.
IFRIC 20 Recognition, classification and 1 January 2013Stripping Costs measurement of the productionin the Production stripping costs as an asset.Phase of aSurface Mine
Standards and interpretations in issue not yet adopted and not yeteffectiveThe new standards, amendments to standards and interpretations in issuehave not yet been adopted and are not yet effective. All standards areeffective for annual periods beginning on or after the stated effectivedate.
Pronouncement Title Effective dateIFRS 3 Business Amendment to scope exception 1 July 2014Combinations of joint ventures in paragraph 2(a).
IFRS 7 Financial Amendments requiring disclosures 1 January 2018*Instruments about the initial applicationDisclosures of IFRS 9.
IFRS 7 Financial Additional hedge accounting 1 January 2018*Instruments disclosures resulting from theDisclosures introduction of a hedge accounting chapter in IFRS 9.
IFRS 8 Operating Amendment relating to 1 July 2014Segments aggregation of segments and reconciliation of the total reportable segments’ assets to the entity’s assets if segment assets are reported regularly.
IFRS 9 Financial Classification and measurement 1 January 2018*Instruments of financial assets and financial liabilities and derecognition requirements.
IFRS 13 Fair Value Amendment of scope 1 July 2014Measurement exclusion in IFRS 13.52 to include all contracts accounted for within the scope of IAS 39 and IFRS 9, regardless
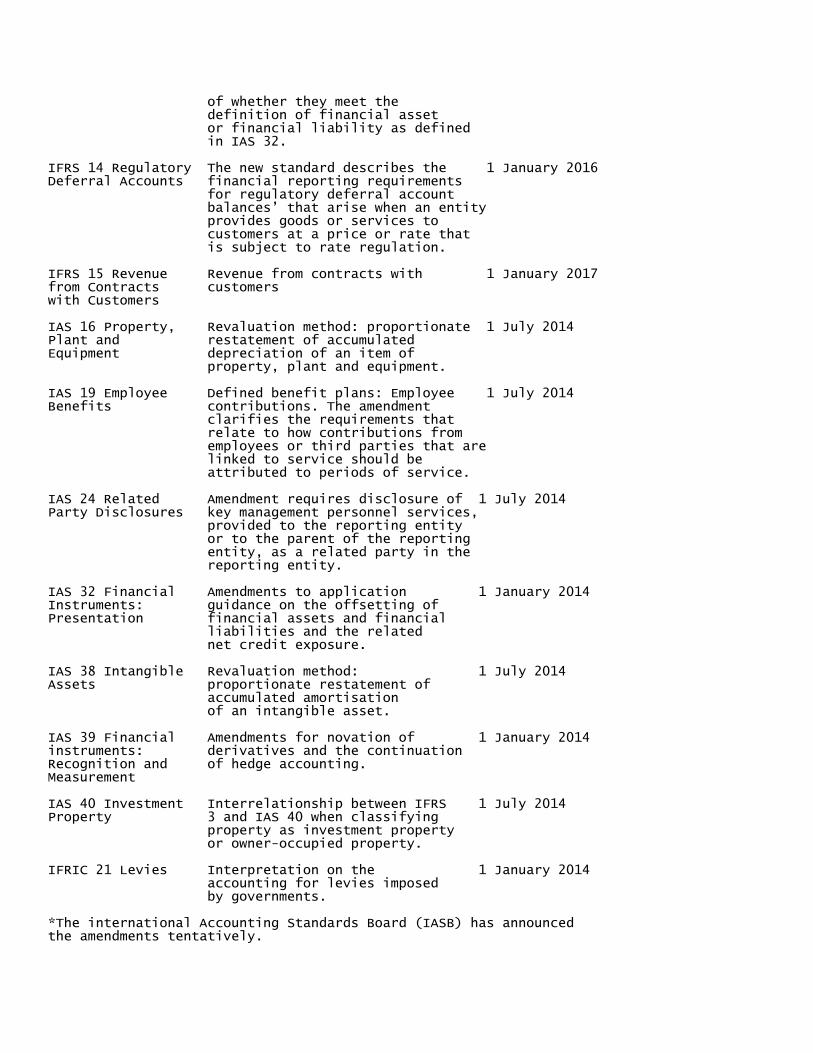
of whether they meet the definition of financial asset or financial liability as defined in IAS 32.
IFRS 14 Regulatory The new standard describes the 1 January 2016Deferral Accounts financial reporting requirements for regulatory deferral account balances’ that arise when an entity provides goods or services to customers at a price or rate that is subject to rate regulation.
IFRS 15 Revenue Revenue from contracts with 1 January 2017from Contracts customerswith Customers
IAS 16 Property, Revaluation method: proportionate 1 July 2014Plant and restatement of accumulatedEquipment depreciation of an item of property, plant and equipment.
IAS 19 Employee Defined benefit plans: Employee 1 July 2014Benefits contributions. The amendment clarifies the requirements that relate to how contributions from employees or third parties that are linked to service should be attributed to periods of service.
IAS 24 Related Amendment requires disclosure of 1 July 2014Party Disclosures key management personnel services, provided to the reporting entity or to the parent of the reporting entity, as a related party in the reporting entity.
IAS 32 Financial Amendments to application 1 January 2014Instruments: guidance on the offsetting ofPresentation financial assets and financial liabilities and the related net credit exposure.
IAS 38 Intangible Revaluation method: 1 July 2014Assets proportionate restatement of accumulated amortisation of an intangible asset.
IAS 39 Financial Amendments for novation of 1 January 2014instruments: derivatives and the continuationRecognition and of hedge accounting.Measurement
IAS 40 Investment Interrelationship between IFRS 1 July 2014Property 3 and IAS 40 when classifying property as investment property or owner-occupied property.
IFRIC 21 Levies Interpretation on the 1 January 2014 accounting for levies imposed by governments.
*The international Accounting Standards Board (IASB) has announcedthe amendments tentatively.
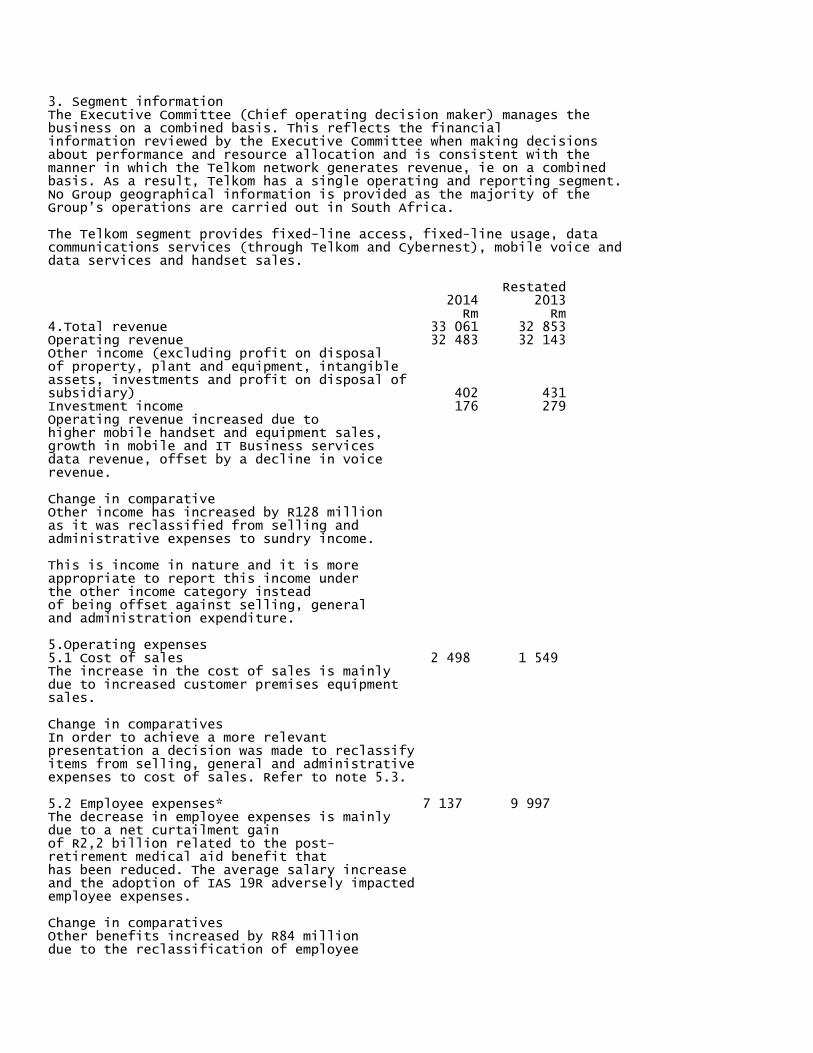
3. Segment informationThe Executive Committee (Chief operating decision maker) manages thebusiness on a combined basis. This reflects the financialinformation reviewed by the Executive Committee when making decisionsabout performance and resource allocation and is consistent with themanner in which the Telkom network generates revenue, ie on a combinedbasis. As a result, Telkom has a single operating and reporting segment.No Group geographical information is provided as the majority of theGroup’s operations are carried out in South Africa.
The Telkom segment provides fixed-line access, fixed-line usage, datacommunications services (through Telkom and Cybernest), mobile voice anddata services and handset sales.
Restated 2014 2013 Rm Rm4.Total revenue 33 061 32 853Operating revenue 32 483 32 143Other income (excluding profit on disposalof property, plant and equipment, intangibleassets, investments and profit on disposal ofsubsidiary) 402 431Investment income 176 279Operating revenue increased due tohigher mobile handset and equipment sales,growth in mobile and IT Business servicesdata revenue, offset by a decline in voicerevenue.
Change in comparativeOther income has increased by R128 millionas it was reclassified from selling andadministrative expenses to sundry income.
This is income in nature and it is moreappropriate to report this income underthe other income category insteadof being offset against selling, generaland administration expenditure.
5.Operating expenses5.1 Cost of sales 2 498 1 549The increase in the cost of sales is mainlydue to increased customer premises equipmentsales.
Change in comparativesIn order to achieve a more relevantpresentation a decision was made to reclassifyitems from selling, general and administrativeexpenses to cost of sales. Refer to note 5.3.
5.2 Employee expenses* 7 137 9 997The decrease in employee expenses is mainlydue to a net curtailment gainof R2,2 billion related to the post-retirement medical aid benefit thathas been reduced. The average salary increaseand the adoption of IAS 19R adversely impactedemployee expenses.
Change in comparativesOther benefits increased by R84 milliondue to the reclassification of employee
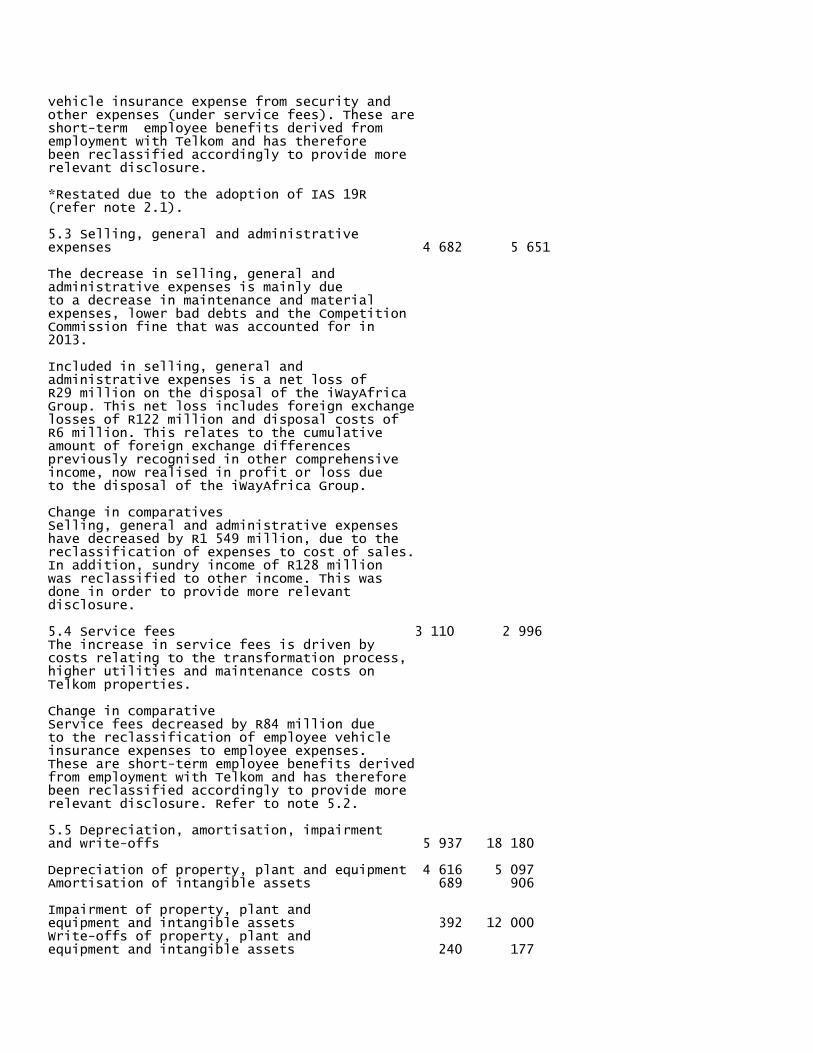
vehicle insurance expense from security andother expenses (under service fees). These areshort-term employee benefits derived fromemployment with Telkom and has thereforebeen reclassified accordingly to provide morerelevant disclosure.
*Restated due to the adoption of IAS 19R(refer note 2.1).
5.3 Selling, general and administrativeexpenses 4 682 5 651
The decrease in selling, general andadministrative expenses is mainly dueto a decrease in maintenance and materialexpenses, lower bad debts and the CompetitionCommission fine that was accounted for in2013.
Included in selling, general andadministrative expenses is a net loss ofR29 million on the disposal of the iWayAfricaGroup. This net loss includes foreign exchangelosses of R122 million and disposal costs ofR6 million. This relates to the cumulativeamount of foreign exchange differencespreviously recognised in other comprehensiveincome, now realised in profit or loss dueto the disposal of the iWayAfrica Group.
Change in comparativesSelling, general and administrative expenseshave decreased by R1 549 million, due to thereclassification of expenses to cost of sales.In addition, sundry income of R128 millionwas reclassified to other income. This wasdone in order to provide more relevantdisclosure.
5.4 Service fees 3 110 2 996The increase in service fees is driven bycosts relating to the transformation process,higher utilities and maintenance costs onTelkom properties.
Change in comparativeService fees decreased by R84 million dueto the reclassification of employee vehicleinsurance expenses to employee expenses.These are short-term employee benefits derivedfrom employment with Telkom and has thereforebeen reclassified accordingly to provide morerelevant disclosure. Refer to note 5.2.
5.5 Depreciation, amortisation, impairmentand write-offs 5 937 18 180
Depreciation of property, plant and equipment 4 616 5 097Amortisation of intangible assets 689 906
Impairment of property, plant andequipment and intangible assets 392 12 000Write-offs of property, plant andequipment and intangible assets 240 177
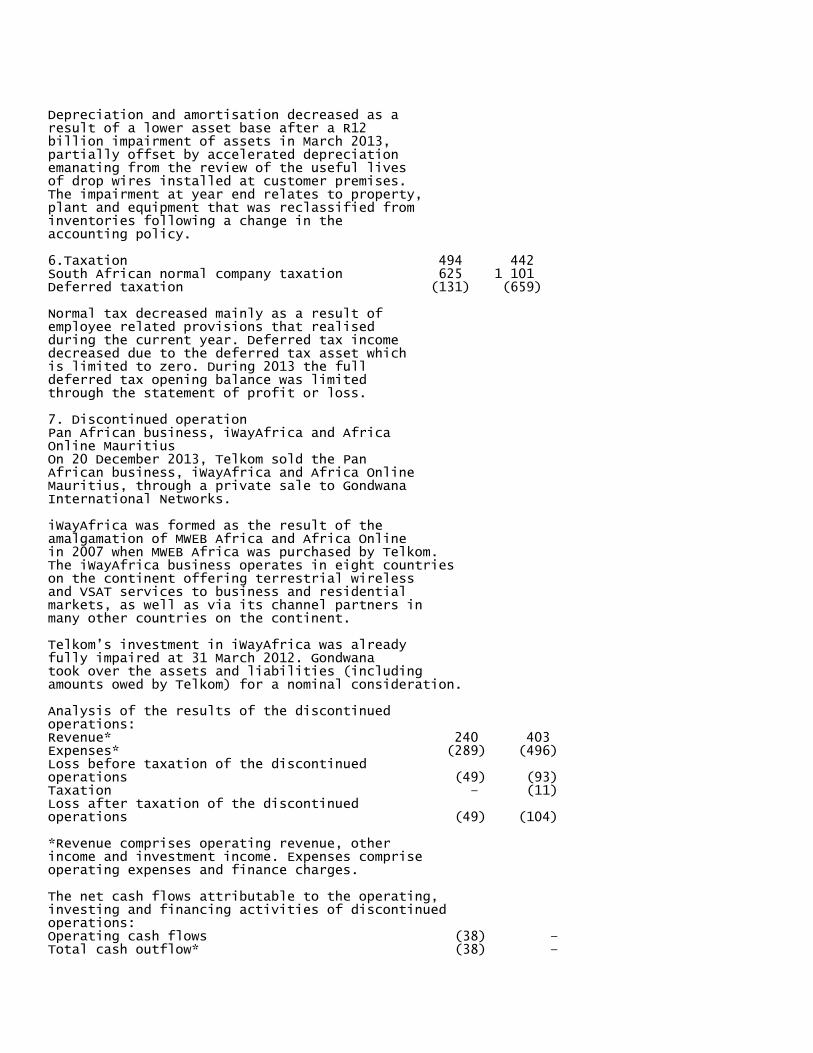
Depreciation and amortisation decreased as aresult of a lower asset base after a R12billion impairment of assets in March 2013,partially offset by accelerated depreciationemanating from the review of the useful livesof drop wires installed at customer premises.The impairment at year end relates to property,plant and equipment that was reclassified frominventories following a change in theaccounting policy.
6.Taxation 494 442South African normal company taxation 625 1 101Deferred taxation (131) (659)
Normal tax decreased mainly as a result ofemployee related provisions that realisedduring the current year. Deferred tax incomedecreased due to the deferred tax asset whichis limited to zero. During 2013 the fulldeferred tax opening balance was limitedthrough the statement of profit or loss.
7. Discontinued operationPan African business, iWayAfrica and AfricaOnline MauritiusOn 20 December 2013, Telkom sold the PanAfrican business, iWayAfrica and Africa OnlineMauritius, through a private sale to GondwanaInternational Networks.
iWayAfrica was formed as the result of theamalgamation of MWEB Africa and Africa Onlinein 2007 when MWEB Africa was purchased by Telkom.The iWayAfrica business operates in eight countrieson the continent offering terrestrial wirelessand VSAT services to business and residentialmarkets, as well as via its channel partners inmany other countries on the continent.
Telkom’s investment in iWayAfrica was alreadyfully impaired at 31 March 2012. Gondwanatook over the assets and liabilities (includingamounts owed by Telkom) for a nominal consideration.
Analysis of the results of the discontinuedoperations:Revenue* 240 403Expenses* (289) (496)Loss before taxation of the discontinuedoperations (49) (93)Taxation – (11)Loss after taxation of the discontinuedoperations (49) (104)
*Revenue comprises operating revenue, otherincome and investment income. Expenses compriseoperating expenses and finance charges.
The net cash flows attributable to the operating,investing and financing activities of discontinuedoperations:Operating cash flows (38) –Total cash outflow* (38) –
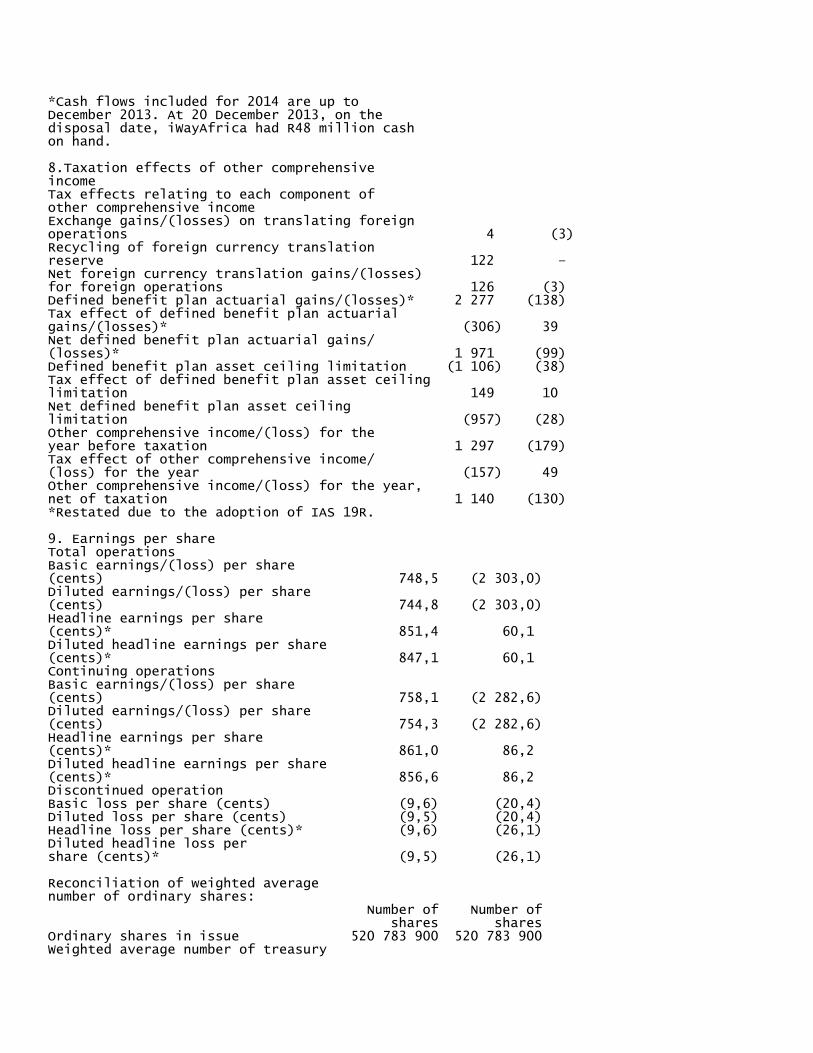
*Cash flows included for 2014 are up toDecember 2013. At 20 December 2013, on thedisposal date, iWayAfrica had R48 million cashon hand.
8.Taxation effects of other comprehensiveincomeTax effects relating to each component ofother comprehensive incomeExchange gains/(losses) on translating foreignoperations 4 (3)Recycling of foreign currency translationreserve 122 –Net foreign currency translation gains/(losses)for foreign operations 126 (3)Defined benefit plan actuarial gains/(losses)* 2 277 (138)Tax effect of defined benefit plan actuarialgains/(losses)* (306) 39Net defined benefit plan actuarial gains/(losses)* 1 971 (99)Defined benefit plan asset ceiling limitation (1 106) (38)Tax effect of defined benefit plan asset ceilinglimitation 149 10Net defined benefit plan asset ceilinglimitation (957) (28)Other comprehensive income/(loss) for theyear before taxation 1 297 (179)Tax effect of other comprehensive income/(loss) for the year (157) 49Other comprehensive income/(loss) for the year,net of taxation 1 140 (130)*Restated due to the adoption of IAS 19R.
9. Earnings per shareTotal operationsBasic earnings/(loss) per share(cents) 748,5 (2 303,0)Diluted earnings/(loss) per share(cents) 744,8 (2 303,0)Headline earnings per share(cents)* 851,4 60,1Diluted headline earnings per share(cents)* 847,1 60,1Continuing operationsBasic earnings/(loss) per share(cents) 758,1 (2 282,6)Diluted earnings/(loss) per share(cents) 754,3 (2 282,6)Headline earnings per share(cents)* 861,0 86,2Diluted headline earnings per share(cents)* 856,6 86,2Discontinued operationBasic loss per share (cents) (9,6) (20,4)Diluted loss per share (cents) (9,5) (20,4)Headline loss per share (cents)* (9,6) (26,1)Diluted headline loss pershare (cents)* (9,5) (26,1)
Reconciliation of weighted averagenumber of ordinary shares: Number of Number of shares sharesOrdinary shares in issue 520 783 900 520 783 900Weighted average number of treasury
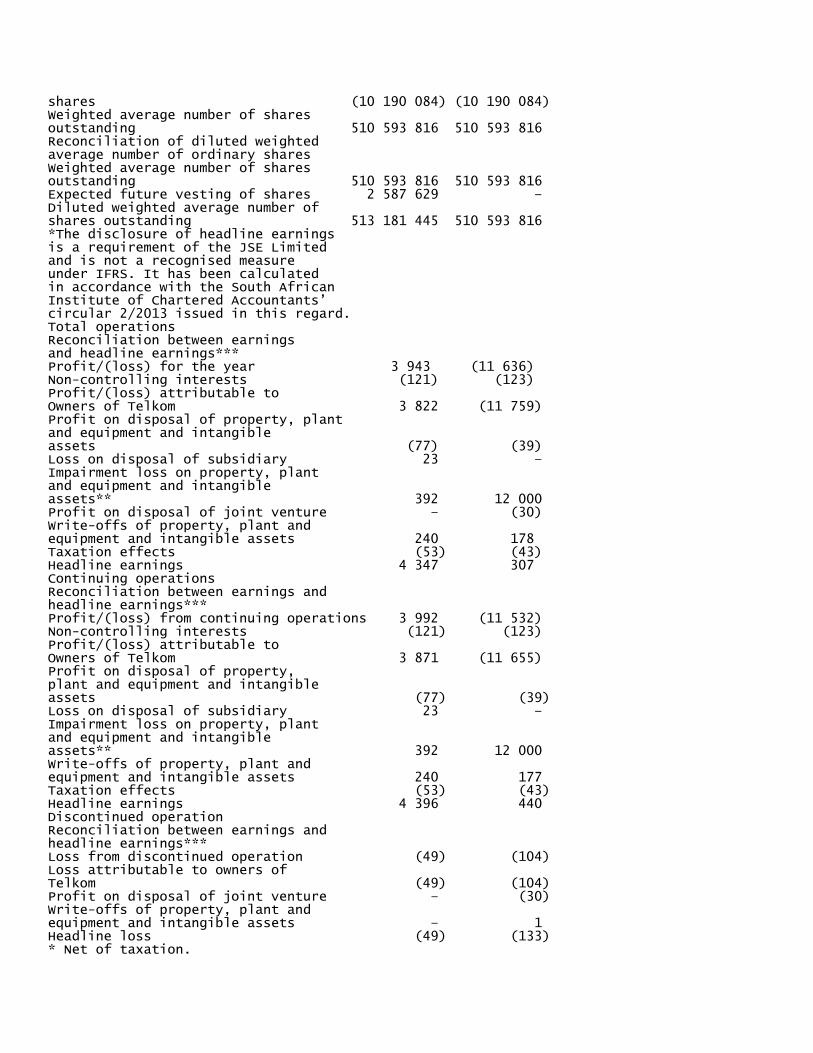
shares (10 190 084) (10 190 084)Weighted average number of sharesoutstanding 510 593 816 510 593 816Reconciliation of diluted weightedaverage number of ordinary sharesWeighted average number of sharesoutstanding 510 593 816 510 593 816Expected future vesting of shares 2 587 629 –Diluted weighted average number ofshares outstanding 513 181 445 510 593 816*The disclosure of headline earningsis a requirement of the JSE Limitedand is not a recognised measureunder IFRS. It has been calculatedin accordance with the South AfricanInstitute of Chartered Accountants’circular 2/2013 issued in this regard.Total operationsReconciliation between earningsand headline earnings***Profit/(loss) for the year 3 943 (11 636)Non-controlling interests (121) (123)Profit/(loss) attributable toOwners of Telkom 3 822 (11 759)Profit on disposal of property, plantand equipment and intangibleassets (77) (39)Loss on disposal of subsidiary 23 –Impairment loss on property, plantand equipment and intangibleassets** 392 12 000Profit on disposal of joint venture – (30)Write-offs of property, plant andequipment and intangible assets 240 178Taxation effects (53) (43)Headline earnings 4 347 307Continuing operationsReconciliation between earnings andheadline earnings***Profit/(loss) from continuing operations 3 992 (11 532)Non-controlling interests (121) (123)Profit/(loss) attributable toOwners of Telkom 3 871 (11 655)Profit on disposal of property,plant and equipment and intangibleassets (77) (39)Loss on disposal of subsidiary 23 –Impairment loss on property, plantand equipment and intangibleassets** 392 12 000Write-offs of property, plant andequipment and intangible assets 240 177Taxation effects (53) (43)Headline earnings 4 396 440Discontinued operationReconciliation between earnings andheadline earnings***Loss from discontinued operation (49) (104)Loss attributable to owners ofTelkom (49) (104)Profit on disposal of joint venture – (30)Write-offs of property, plant andequipment and intangible assets – 1Headline loss (49) (133)* Net of taxation.
**The impairment resulted in deferredtaxation consequences that were notrecognised in thestatement of financial position.***The amounts have been restateddue to the adoption of IAS 19R andthe amendment to IAS 16 as well asthe sale of the iWayAfrica Group.
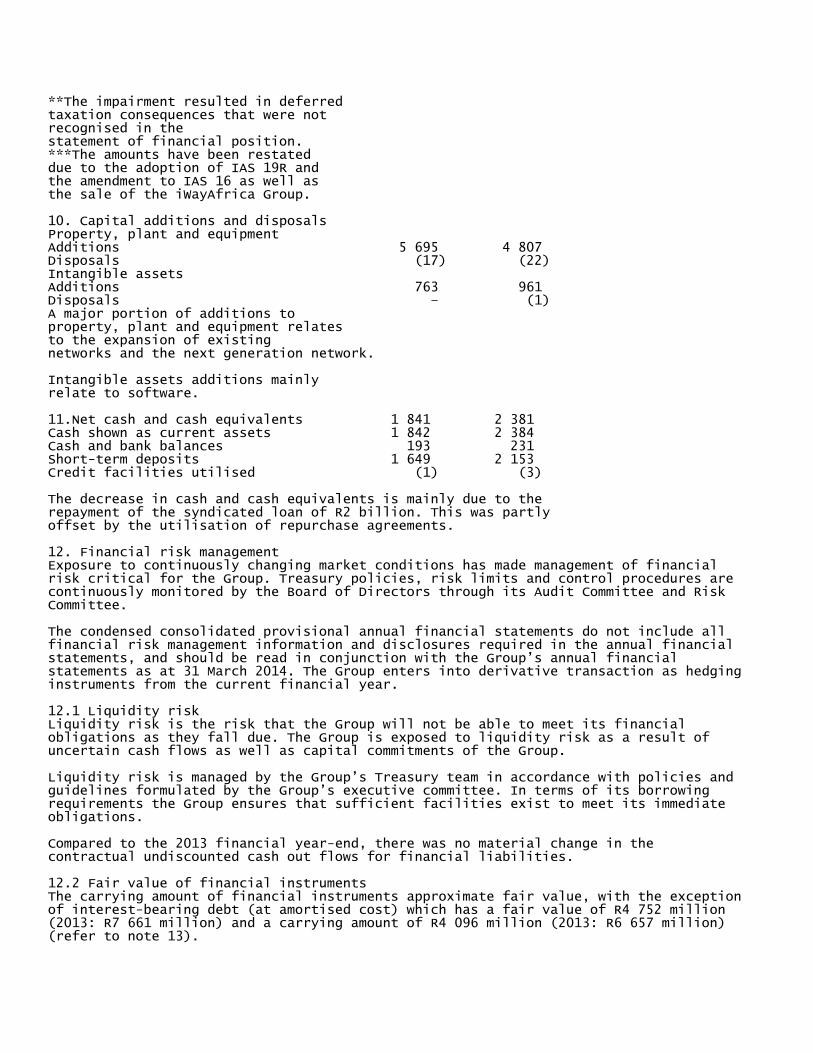
10. Capital additions and disposalsProperty, plant and equipmentAdditions 5 695 4 807Disposals (17) (22)Intangible assetsAdditions 763 961Disposals – (1)A major portion of additions toproperty, plant and equipment relatesto the expansion of existingnetworks and the next generation network.
Intangible assets additions mainlyrelate to software.
11.Net cash and cash equivalents 1 841 2 381Cash shown as current assets 1 842 2 384Cash and bank balances 193 231Short-term deposits 1 649 2 153Credit facilities utilised (1) (3)
The decrease in cash and cash equivalents is mainly due to therepayment of the syndicated loan of R2 billion. This was partlyoffset by the utilisation of repurchase agreements.
12. Financial risk managementExposure to continuously changing market conditions has made management of financialrisk critical for the Group. Treasury policies, risk limits and control procedures arecontinuously monitored by the Board of Directors through its Audit Committee and RiskCommittee.
The condensed consolidated provisional annual financial statements do not include allfinancial risk management information and disclosures required in the annual financialstatements, and should be read in conjunction with the Group’s annual financialstatements as at 31 March 2014. The Group enters into derivative transaction as hedginginstruments from the current financial year.
12.1 Liquidity riskLiquidity risk is the risk that the Group will not be able to meet its financialobligations as they fall due. The Group is exposed to liquidity risk as a result ofuncertain cash flows as well as capital commitments of the Group.
Liquidity risk is managed by the Group’s Treasury team in accordance with policies andguidelines formulated by the Group’s executive committee. In terms of its borrowingrequirements the Group ensures that sufficient facilities exist to meet its immediateobligations.
Compared to the 2013 financial year-end, there was no material change in thecontractual undiscounted cash out flows for financial liabilities.
12.2 Fair value of financial instrumentsThe carrying amount of financial instruments approximate fair value, with the exceptionof interest-bearing debt (at amortised cost) which has a fair value of R4 752 million(2013: R7 661 million) and a carrying amount of R4 096 million (2013: R6 657 million)(refer to note 13).
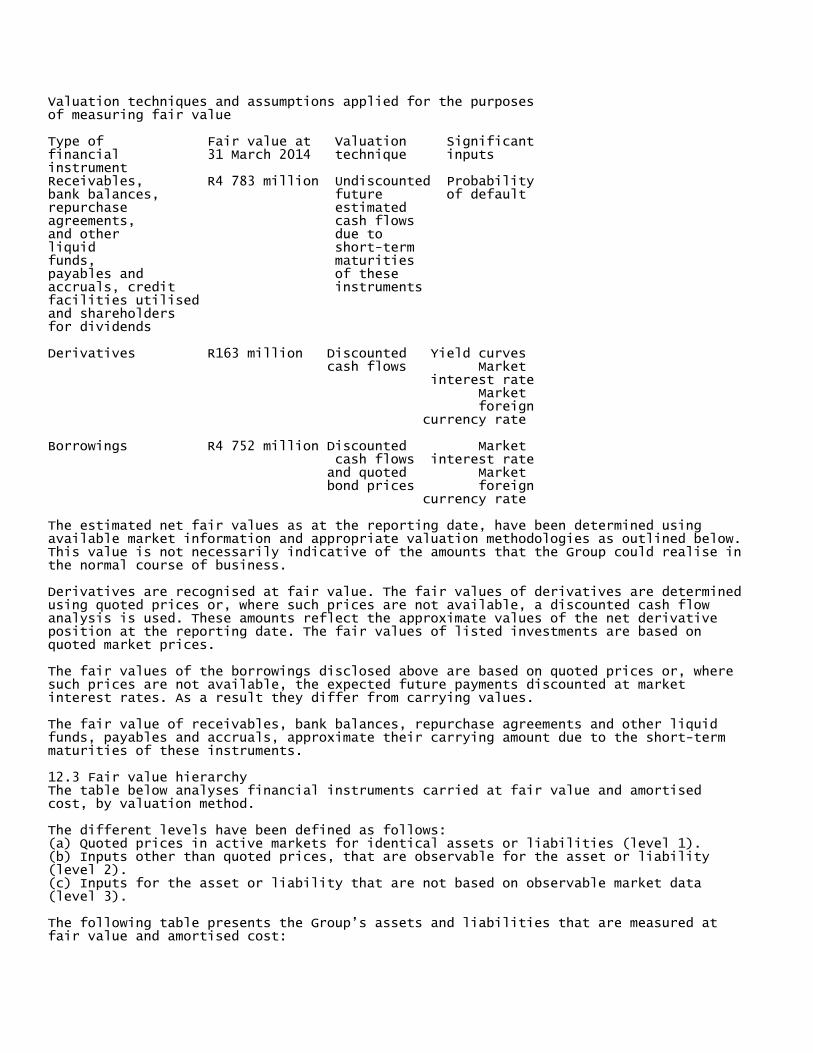
Valuation techniques and assumptions applied for the purposesof measuring fair value
Type of Fair value at Valuation Significantfinancial 31 March 2014 technique inputsinstrumentReceivables, R4 783 million Undiscounted Probabilitybank balances, future of defaultrepurchase estimatedagreements, cash flowsand other due toliquid short-termfunds, maturitiespayables and of theseaccruals, credit instrumentsfacilities utilisedand shareholdersfor dividends
Derivatives R163 million Discounted Yield curves cash flows Market interest rate Market foreign currency rate
Borrowings R4 752 million Discounted Market cash flows interest rate and quoted Market bond prices foreign currency rate
The estimated net fair values as at the reporting date, have been determined usingavailable market information and appropriate valuation methodologies as outlined below.This value is not necessarily indicative of the amounts that the Group could realise inthe normal course of business.
Derivatives are recognised at fair value. The fair values of derivatives are determinedusing quoted prices or, where such prices are not available, a discounted cash flowanalysis is used. These amounts reflect the approximate values of the net derivativeposition at the reporting date. The fair values of listed investments are based onquoted market prices.
The fair values of the borrowings disclosed above are based on quoted prices or, wheresuch prices are not available, the expected future payments discounted at marketinterest rates. As a result they differ from carrying values.
The fair value of receivables, bank balances, repurchase agreements and other liquidfunds, payables and accruals, approximate their carrying amount due to the short-termmaturities of these instruments.
12.3 Fair value hierarchyThe table below analyses financial instruments carried at fair value and amortisedcost, by valuation method.
The different levels have been defined as follows:(a) Quoted prices in active markets for identical assets or liabilities (level 1).(b) Inputs other than quoted prices, that are observable for the asset or liability(level 2).(c) Inputs for the asset or liability that are not based on observable market data(level 3).
The following table presents the Group’s assets and liabilities that are measured atfair value and amortised cost:
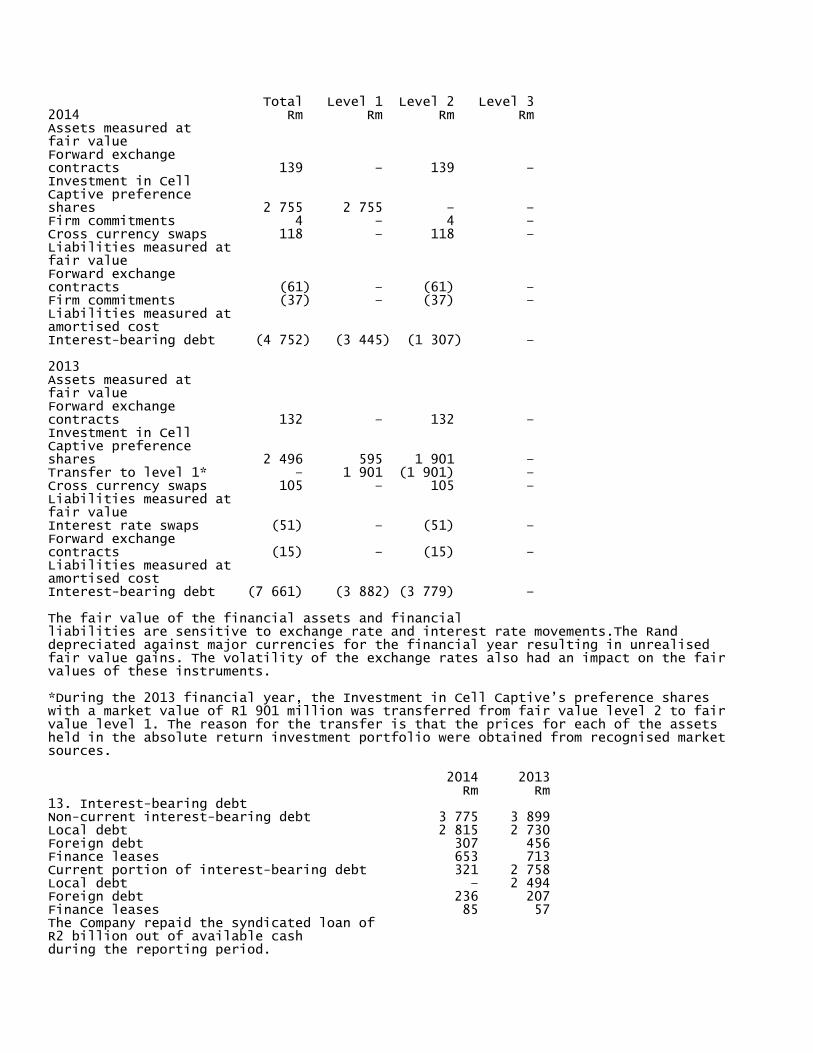
Total Level 1 Level 2 Level 32014 Rm Rm Rm RmAssets measured atfair valueForward exchangecontracts 139 – 139 –Investment in CellCaptive preferenceshares 2 755 2 755 – –Firm commitments 4 – 4 –Cross currency swaps 118 – 118 –Liabilities measured atfair valueForward exchangecontracts (61) – (61) –Firm commitments (37) – (37) –Liabilities measured atamortised costInterest-bearing debt (4 752) (3 445) (1 307) –
2013Assets measured atfair valueForward exchangecontracts 132 – 132 –Investment in CellCaptive preferenceshares 2 496 595 1 901 –Transfer to level 1* – 1 901 (1 901) –Cross currency swaps 105 – 105 –Liabilities measured atfair valueInterest rate swaps (51) – (51) –Forward exchangecontracts (15) – (15) –Liabilities measured atamortised costInterest-bearing debt (7 661) (3 882) (3 779) –
The fair value of the financial assets and financialliabilities are sensitive to exchange rate and interest rate movements.The Randdepreciated against major currencies for the financial year resulting in unrealisedfair value gains. The volatility of the exchange rates also had an impact on the fairvalues of these instruments.
*During the 2013 financial year, the Investment in Cell Captive’s preference shareswith a market value of R1 901 million was transferred from fair value level 2 to fairvalue level 1. The reason for the transfer is that the prices for each of the assetsheld in the absolute return investment portfolio were obtained from recognised marketsources.
2014 2013 Rm Rm13. Interest-bearing debtNon-current interest-bearing debt 3 775 3 899Local debt 2 815 2 730Foreign debt 307 456Finance leases 653 713Current portion of interest-bearing debt 321 2 758Local debt – 2 494Foreign debt 236 207Finance leases 85 57The Company repaid the syndicated loan ofR2 billion out of available cashduring the reporting period.
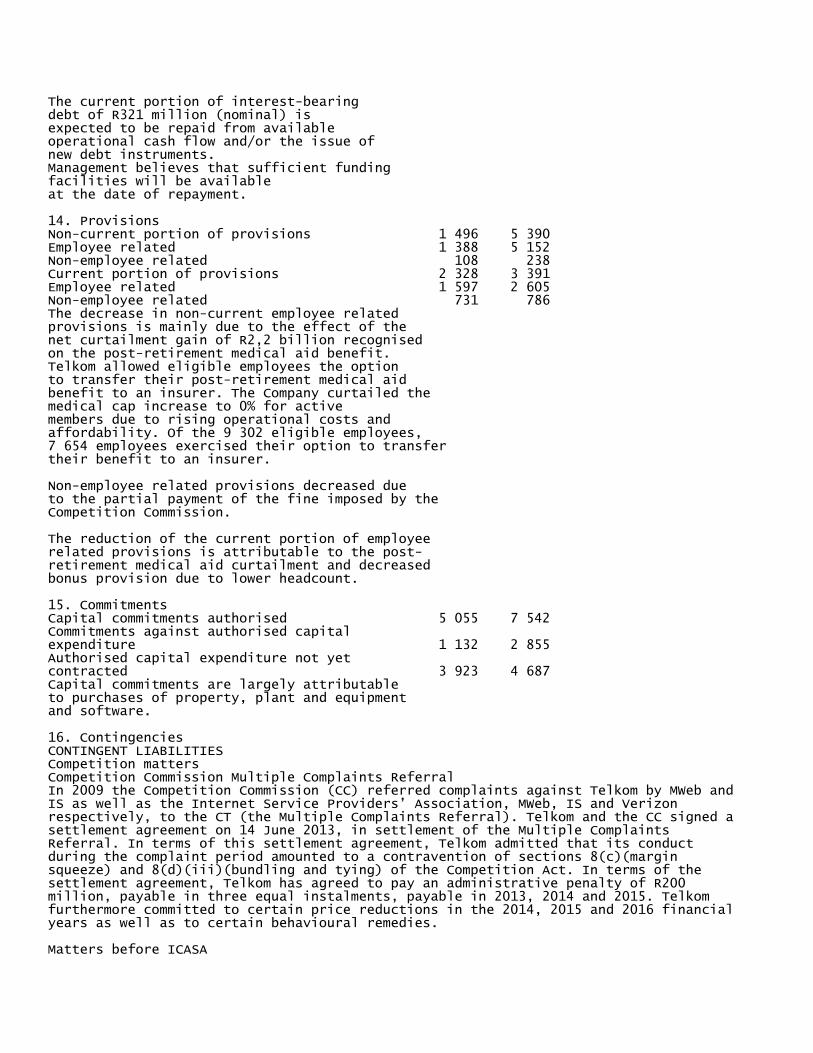
The current portion of interest-bearingdebt of R321 million (nominal) isexpected to be repaid from availableoperational cash flow and/or the issue ofnew debt instruments.Management believes that sufficient fundingfacilities will be availableat the date of repayment.
14. ProvisionsNon-current portion of provisions 1 496 5 390Employee related 1 388 5 152Non-employee related 108 238Current portion of provisions 2 328 3 391Employee related 1 597 2 605Non-employee related 731 786The decrease in non-current employee relatedprovisions is mainly due to the effect of thenet curtailment gain of R2,2 billion recognisedon the post-retirement medical aid benefit.Telkom allowed eligible employees the optionto transfer their post-retirement medical aidbenefit to an insurer. The Company curtailed themedical cap increase to 0% for activemembers due to rising operational costs andaffordability. Of the 9 302 eligible employees,7 654 employees exercised their option to transfertheir benefit to an insurer.
Non-employee related provisions decreased dueto the partial payment of the fine imposed by theCompetition Commission.
The reduction of the current portion of employeerelated provisions is attributable to the post-retirement medical aid curtailment and decreasedbonus provision due to lower headcount.
15. CommitmentsCapital commitments authorised 5 055 7 542Commitments against authorised capitalexpenditure 1 132 2 855Authorised capital expenditure not yetcontracted 3 923 4 687Capital commitments are largely attributableto purchases of property, plant and equipmentand software.
16. ContingenciesCONTINGENT LIABILITIESCompetition mattersCompetition Commission Multiple Complaints ReferralIn 2009 the Competition Commission (CC) referred complaints against Telkom by MWeb andIS as well as the Internet Service Providers’ Association, MWeb, IS and Verizonrespectively, to the CT (the Multiple Complaints Referral). Telkom and the CC signed asettlement agreement on 14 June 2013, in settlement of the Multiple ComplaintsReferral. In terms of this settlement agreement, Telkom admitted that its conductduring the complaint period amounted to a contravention of sections 8(c)(marginsqueeze) and 8(d)(iii)(bundling and tying) of the Competition Act. In terms of thesettlement agreement, Telkom has agreed to pay an administrative penalty of R200million, payable in three equal instalments, payable in 2013, 2014 and 2015. Telkomfurthermore committed to certain price reductions in the 2014, 2015 and 2016 financialyears as well as to certain behavioural remedies.
Matters before ICASA
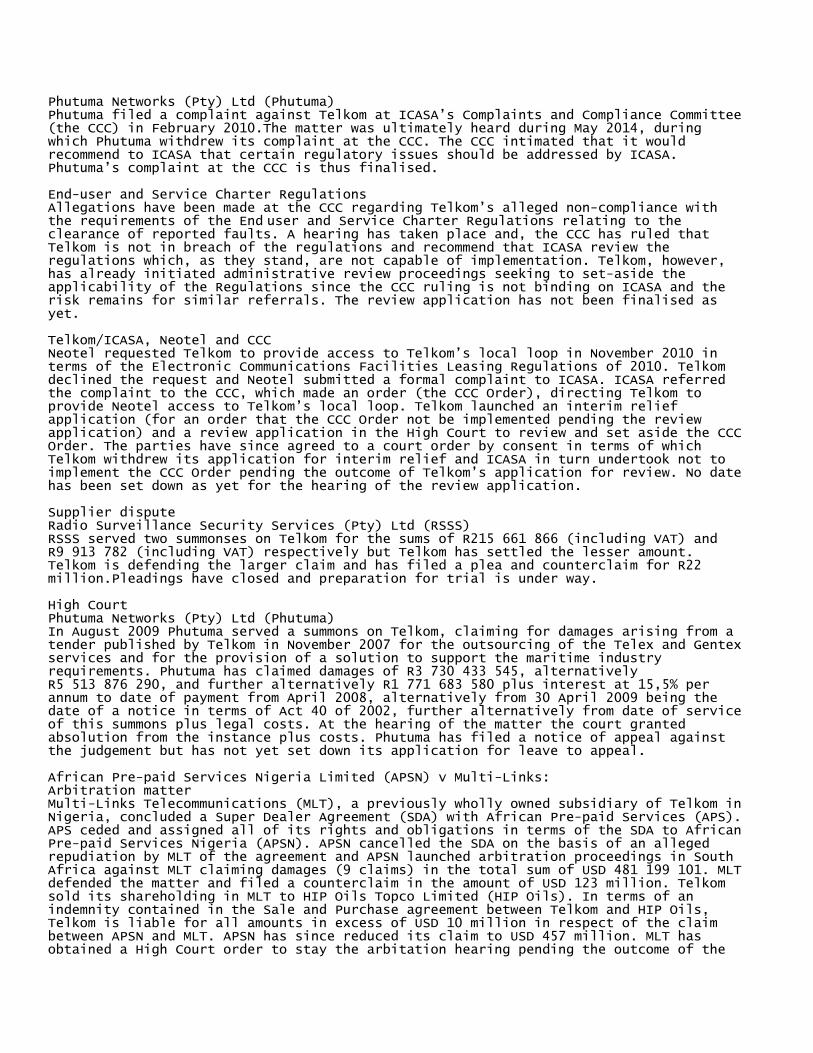
Phutuma Networks (Pty) Ltd (Phutuma)Phutuma filed a complaint against Telkom at ICASA’s Complaints and Compliance Committee(the CCC) in February 2010.The matter was ultimately heard during May 2014, duringwhich Phutuma withdrew its complaint at the CCC. The CCC intimated that it wouldrecommend to ICASA that certain regulatory issues should be addressed by ICASA.Phutuma’s complaint at the CCC is thus finalised.
End-user and Service Charter RegulationsAllegations have been made at the CCC regarding Telkom’s alleged non-compliance with
‑the requirements of the End user and Service Charter Regulations relating to theclearance of reported faults. A hearing has taken place and, the CCC has ruled thatTelkom is not in breach of the regulations and recommend that ICASA review theregulations which, as they stand, are not capable of implementation. Telkom, however,has already initiated administrative review proceedings seeking to set-aside theapplicability of the Regulations since the CCC ruling is not binding on ICASA and therisk remains for similar referrals. The review application has not been finalised asyet.
Telkom/ICASA, Neotel and CCCNeotel requested Telkom to provide access to Telkom’s local loop in November 2010 interms of the Electronic Communications Facilities Leasing Regulations of 2010. Telkomdeclined the request and Neotel submitted a formal complaint to ICASA. ICASA referredthe complaint to the CCC, which made an order (the CCC Order), directing Telkom toprovide Neotel access to Telkom’s local loop. Telkom launched an interim reliefapplication (for an order that the CCC Order not be implemented pending the reviewapplication) and a review application in the High Court to review and set aside the CCCOrder. The parties have since agreed to a court order by consent in terms of whichTelkom withdrew its application for interim relief and ICASA in turn undertook not toimplement the CCC Order pending the outcome of Telkom’s application for review. No datehas been set down as yet for the hearing of the review application.
Supplier disputeRadio Surveillance Security Services (Pty) Ltd (RSSS)RSSS served two summonses on Telkom for the sums of R215 661 866 (including VAT) andR9 913 782 (including VAT) respectively but Telkom has settled the lesser amount.Telkom is defending the larger claim and has filed a plea and counterclaim for R22million.Pleadings have closed and preparation for trial is under way.
High CourtPhutuma Networks (Pty) Ltd (Phutuma)In August 2009 Phutuma served a summons on Telkom, claiming for damages arising from atender published by Telkom in November 2007 for the outsourcing of the Telex and Gentexservices and for the provision of a solution to support the maritime industryrequirements. Phutuma has claimed damages of R3 730 433 545, alternativelyR5 513 876 290, and further alternatively R1 771 683 580 plus interest at 15,5% perannum to date of payment from April 2008, alternatively from 30 April 2009 being thedate of a notice in terms of Act 40 of 2002, further alternatively from date of serviceof this summons plus legal costs. At the hearing of the matter the court grantedabsolution from the instance plus costs. Phutuma has filed a notice of appeal againstthe judgement but has not yet set down its application for leave to appeal.
African Pre-paid Services Nigeria Limited (APSN) v Multi-Links:Arbitration matterMulti-Links Telecommunications (MLT), a previously wholly owned subsidiary of Telkom inNigeria, concluded a Super Dealer Agreement (SDA) with African Pre-paid Services (APS).APS ceded and assigned all of its rights and obligations in terms of the SDA to AfricanPre-paid Services Nigeria (APSN). APSN cancelled the SDA on the basis of an allegedrepudiation by MLT of the agreement and APSN launched arbitration proceedings in SouthAfrica against MLT claiming damages (9 claims) in the total sum of USD 481 199 101. MLTdefended the matter and filed a counterclaim in the amount of USD 123 million. Telkomsold its shareholding in MLT to HIP Oils Topco Limited (HIP Oils). In terms of anindemnity contained in the Sale and Purchase agreement between Telkom and HIP Oils,Telkom is liable for all amounts in excess of USD 10 million in respect of the claimbetween APSN and MLT. APSN has since reduced its claim to USD 457 million. MLT hasobtained a High Court order to stay the arbitation hearing pending the outcome of the
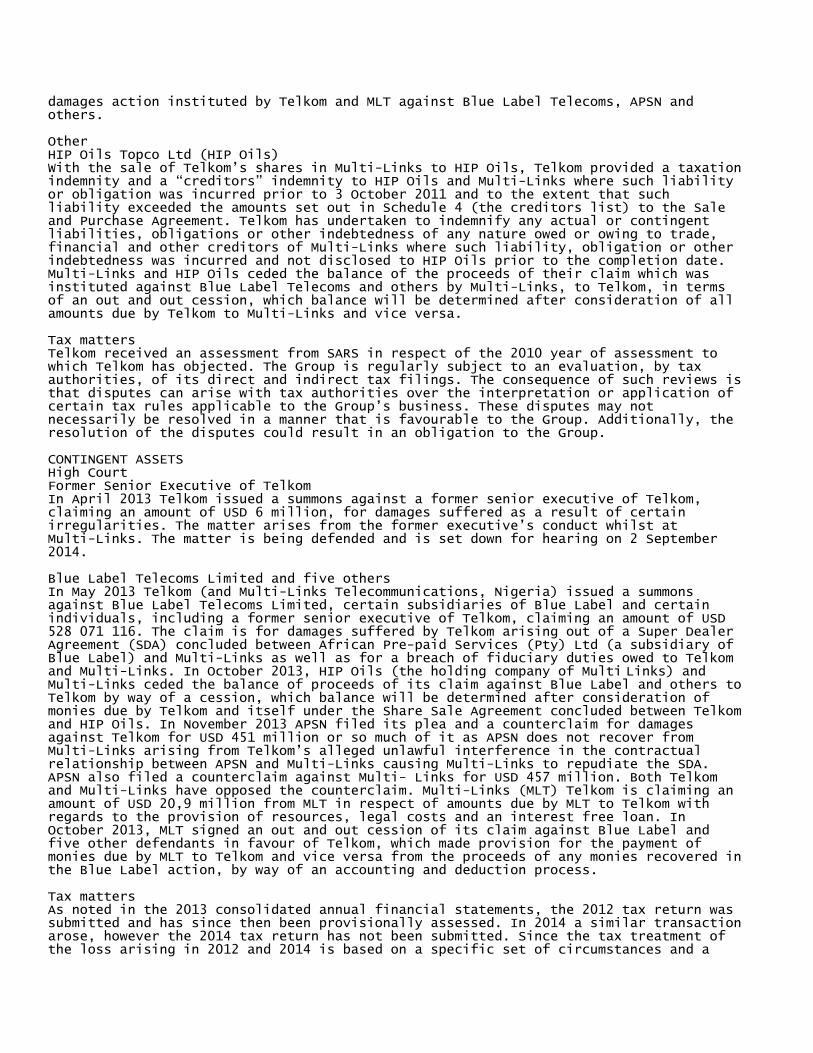
damages action instituted by Telkom and MLT against Blue Label Telecoms, APSN andothers.
OtherHIP Oils Topco Ltd (HIP Oils)With the sale of Telkom’s shares in Multi-Links to HIP Oils, Telkom provided a taxationindemnity and a “creditors” indemnity to HIP Oils and Multi-Links where such liabilityor obligation was incurred prior to 3 October 2011 and to the extent that suchliability exceeded the amounts set out in Schedule 4 (the creditors list) to the Saleand Purchase Agreement. Telkom has undertaken to indemnify any actual or contingentliabilities, obligations or other indebtedness of any nature owed or owing to trade,financial and other creditors of Multi-Links where such liability, obligation or otherindebtedness was incurred and not disclosed to HIP Oils prior to the completion date.Multi-Links and HIP Oils ceded the balance of the proceeds of their claim which wasinstituted against Blue Label Telecoms and others by Multi-Links, to Telkom, in termsof an out and out cession, which balance will be determined after consideration of allamounts due by Telkom to Multi-Links and vice versa.
Tax mattersTelkom received an assessment from SARS in respect of the 2010 year of assessment towhich Telkom has objected. The Group is regularly subject to an evaluation, by taxauthorities, of its direct and indirect tax filings. The consequence of such reviews isthat disputes can arise with tax authorities over the interpretation or application ofcertain tax rules applicable to the Group’s business. These disputes may notnecessarily be resolved in a manner that is favourable to the Group. Additionally, theresolution of the disputes could result in an obligation to the Group.
CONTINGENT ASSETSHigh CourtFormer Senior Executive of TelkomIn April 2013 Telkom issued a summons against a former senior executive of Telkom,claiming an amount of USD 6 million, for damages suffered as a result of certainirregularities. The matter arises from the former executive’s conduct whilst atMulti-Links. The matter is being defended and is set down for hearing on 2 September2014.
Blue Label Telecoms Limited and five othersIn May 2013 Telkom (and Multi-Links Telecommunications, Nigeria) issued a summonsagainst Blue Label Telecoms Limited, certain subsidiaries of Blue Label and certainindividuals, including a former senior executive of Telkom, claiming an amount of USD528 071 116. The claim is for damages suffered by Telkom arising out of a Super DealerAgreement (SDA) concluded between African Pre-paid Services (Pty) Ltd (a subsidiary ofBlue Label) and Multi-Links as well as for a breach of fiduciary duties owed to Telkom
‑and Multi-Links. In October 2013, HIP Oils (the holding company of Multi Links) andMulti-Links ceded the balance of proceeds of its claim against Blue Label and others toTelkom by way of a cession, which balance will be determined after consideration ofmonies due by Telkom and itself under the Share Sale Agreement concluded between Telkomand HIP Oils. In November 2013 APSN filed its plea and a counterclaim for damagesagainst Telkom for USD 451 million or so much of it as APSN does not recover fromMulti-Links arising from Telkom’s alleged unlawful interference in the contractualrelationship between APSN and Multi-Links causing Multi-Links to repudiate the SDA.APSN also filed a counterclaim against Multi- Links for USD 457 million. Both Telkomand Multi-Links have opposed the counterclaim. Multi-Links (MLT) Telkom is claiming anamount of USD 20,9 million from MLT in respect of amounts due by MLT to Telkom withregards to the provision of resources, legal costs and an interest free loan. InOctober 2013, MLT signed an out and out cession of its claim against Blue Label andfive other defendants in favour of Telkom, which made provision for the payment ofmonies due by MLT to Telkom and vice versa from the proceeds of any monies recovered inthe Blue Label action, by way of an accounting and deduction process.
Tax mattersAs noted in the 2013 consolidated annual financial statements, the 2012 tax return wassubmitted and has since then been provisionally assessed. In 2014 a similar transactionarose, however the 2014 tax return has not been submitted. Since the tax treatment ofthe loss arising in 2012 and 2014 is based on a specific set of circumstances and a
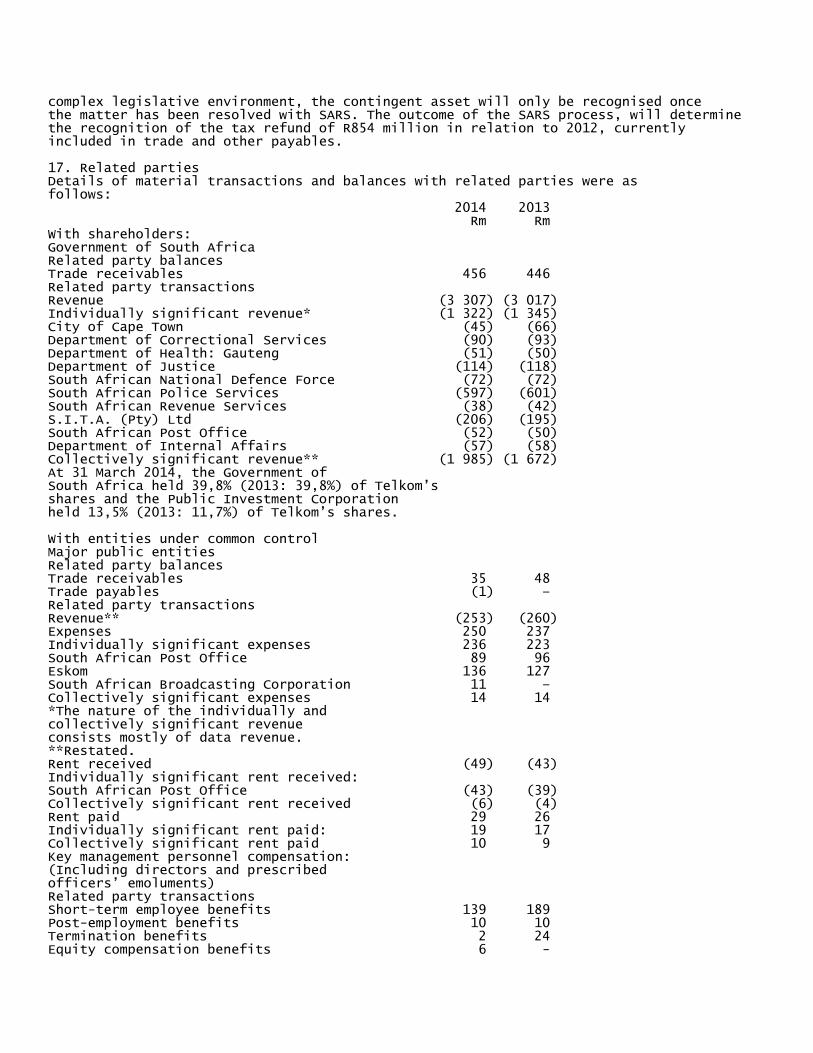
complex legislative environment, the contingent asset will only be recognised oncethe matter has been resolved with SARS. The outcome of the SARS process, will determinethe recognition of the tax refund of R854 million in relation to 2012, currentlyincluded in trade and other payables.
17. Related partiesDetails of material transactions and balances with related parties were asfollows: 2014 2013 Rm RmWith shareholders:Government of South AfricaRelated party balancesTrade receivables 456 446Related party transactionsRevenue (3 307) (3 017)Individually significant revenue* (1 322) (1 345)City of Cape Town (45) (66)Department of Correctional Services (90) (93)Department of Health: Gauteng (51) (50)Department of Justice (114) (118)South African National Defence Force (72) (72)South African Police Services (597) (601)South African Revenue Services (38) (42)S.I.T.A. (Pty) Ltd (206) (195)South African Post Office (52) (50)Department of Internal Affairs (57) (58)Collectively significant revenue** (1 985) (1 672)At 31 March 2014, the Government ofSouth Africa held 39,8% (2013: 39,8%) of Telkom’sshares and the Public Investment Corporationheld 13,5% (2013: 11,7%) of Telkom’s shares.
With entities under common controlMajor public entitiesRelated party balancesTrade receivables 35 48Trade payables (1) –Related party transactionsRevenue** (253) (260)Expenses 250 237Individually significant expenses 236 223South African Post Office 89 96Eskom 136 127South African Broadcasting Corporation 11 –Collectively significant expenses 14 14*The nature of the individually andcollectively significant revenueconsists mostly of data revenue.**Restated.Rent received (49) (43)Individually significant rent received:South African Post Office (43) (39)Collectively significant rent received (6) (4)Rent paid 29 26Individually significant rent paid: 19 17Collectively significant rent paid 10 9Key management personnel compensation:(Including directors and prescribedofficers’ emoluments)Related party transactionsShort-term employee benefits 139 189Post-employment benefits 10 10Termination benefits 2 24Equity compensation benefits 6 -
Financial assistance to Executive DirectorDuring the period under review, the shareholders at an annual general meeting approveda share scheme which inter alia provides for financial assistance to top management topurchase Telkom shares. A loan in the amount of approximately R6 million was paid tothe CFO to purchase Telkom's shares during the current financial year. However, thegranting of the loan was inconsistent with the provisions of the Companies Act, makingthe transaction null and void. The Board acknowledged that it could not ratify thegranting of the loan and was obligated to claim the approximately R6 million back fromthe CFO. The loan was paid back in full by the CFO to Telkom on 16 January 2014.
Terms and conditions of transactions with related partiesOutstanding balances at the year-end are unsecured, interest free and settlement occursin cash. There have been no guarantees provided or received for related partyreceivables or payables.
18. Significant eventsResults of the Telkom annual general meeting regarding directorsre-appointments All Board members were re-elected as per the annual general meetingordinary resolutions with the exception of Mr J Molobela who withdrew his nomination tobe re-elected as director with effect from 27 September 2013. Mr B du Plessis did notstand for re-election for the Board.
Suspension of Chief Financial OfficerShareholders are advised that Mr Jacques Schindehütte, the Chief Financial Officer ofTelkom SA SOC Ltd, (Telkom) has been suspended by the Board of Directors of Telkom (theBoard) effective 24 October 2013, pending the finalisation of a disciplinary process.The suspension follows the findings of an investigation by an independent law firm,commissioned by the Board, following receipt of certain allegations levelled against MrSchindehütte by an anonymous whistleblower. A disciplinary process was institutedagainst Mr Schindehütte, which is still ongoing.
Mr Deon Fredericks has been acting as Chief Financial Officer of Telkom with effectfrom 24 October 2013.
Employee Forfeitable Share Plan (Employee FSP)A new forfeitable share plan was approved at the annual general meeting per specialresolution where no more than 5% of Telkom’s amount of issued shares will be allocatedto employees.
Post-retirement Medical Aid curtailmentTelkom announced during August 2013 that eligible employees have the option to transfertheir post-retirement medical aid benefit to an insurer. The Company curtailed themedical cap increase to 0% as from 1 October 2013 for active members due to revenueremaining under pressure, rising operational costs and affordability. Of the 9 302eligible employees 7 654 employees exercised their option to transfer their benefit toan insurer on 11 October 2013. The approximate net curtailment gain recognised was R2,2billion.
Appointment of Chief Information OfficerTelkom announced on 21 October 2013 that Mr L De Villiers has been appointed as ChiefInformation Officer with effect from 1 November 2013.
Appointment of Chief Marketing OfficerTelkom announced on 15 November 2013 that Mr V Scarcella has been appointed as ChiefMarketing Officer with effect from 1 February 2014.
Appointment of Chief Procurement OfficerTelkom announced on 5 December 2013 that Mr IM Russel has been appointed as ChiefProcurement Officer with effect from 1 February 2014.
Appointment of Chief Technology OfficerTelkom announced on 15 February 2014 that Mr AN Samuels has been appointed as ChiefTechnology Officer with effect from 13 February 2014.
Appointment of Chief Risk OfficerTelkom announced on 1 April 2014 that Adv GJ Rasethaba has been appointed as Chief RiskOfficer with immediate effect.
Fair value hedge accountingThe Group implemented fair value hedge accounting for foreign currency risk hedginginstruments from 1 October 2013 in an attempt to mitigate earnings volatility.
MTN and Telkom radio access network (RAN) assets transactionOn 7 March 2014, Telkom announced it signed a heads of agreement with MTN South Africato take over financial and operational responsibility for the roll-out and operation ofTelkom’s RAN. The parties will conclude reciprocal roaming agreements to enablecustomers of either party to roam on the network of the other party. The telecomsindustry, in both South Africa and globally, are facing an unprecedented shift fromtraditional voice towards data. In order to meet this demand the parties have enteredinto the proposed transaction. Telkom will be able to provide its customers witheffective access to the latest state of the art networks without having to incur thesignificant capital expenditure needed to achieve such national coverage.
As a result of the proposed transaction, the range of services available to customerswill increase, the customer experience will be enhanced and significant scaleefficiencies, beneficial to both parties and their customers, would be realised.
The proposed transaction is subject to conclusion by the parties of various bindingcommercial agreements to give effect to the proposed transaction, and various otherapprovals, including approvals by regulatory authorities as may be required for theimplementation of the proposed transaction.
19. Subsequent eventsRestructuring of the organisationThe Company has been experiencing significant challenges as manifested in the financialunderperformance. The Company continues to experience declining revenues and increasingcosts to serve customers. This makes for an unsustainable financial position.
In response to these challenges Telkom has undertaken a thorough review andinvestigation into all operations and processes which entailed, among others, lookingat issues such as cost drivers and the effectiveness of the organisational structure.By flattening the organisational structure or reducing the number of layers in thestructure, Telkom aims to facilitate speedy decision-making and be as close tocustomers as possible. Telkom aims to manage employee costs down to be competitive indifferent areas of business.
Telkom identified flattening and delayering its structure as a critical action. Telkomhas undertaken a consultation process in line with section 189 and 189(a) of the LabourRelation Act to carry out the proposed delayering.
Acquisition of Business Connexion (BCX)Telkom announced its firm intention to make an offer regarding the possible acquisitionof BCX. The Company has embarked on a strategy to improve performance and restoreprofitability. One of the key considerations of this strategy is to grow beyond itscore business of connectivity by expanding into IT services.
BCX is a leading player in the South African IT services market with strongcapabilities in Managed IT Infrastructure, including Data Centres. This proposedacquisition enables Telkom’s scale expansion into IT services and helps reinforce thecompany’s core connectivity business. Telkom believes that this combination will createa leading ICT company in South Africa with unrivalled capabilities throughout thecountry.
The proposed acquisition is in line with the global trend of IT and Telecomsconvergence that is driving the development of rapidly changing products and servicesand re-shaping the overall ICT and Telecoms business landscape. This convergence trendhas seen many traditional IT companies merge with telecommunications companies and isfundamental to the strategies of trailblasing companies such as Google, Apple andAmazon. This is the beginning of the process and there are a number of key milestones
to attain and work to be done, including approval by the Competition Authorities andthe Regulator.
Additional fundingThe Company has secured a R1 billion loan to extend its debt maturityprofile.
Other mattersThe directors are not aware of any other matter or circumstance since the financialyear ended 31 March 2014 and the date of this report, or otherwise dealt with in thefinancial statements, which significantly affects the financial position of the Groupand the results of its operations.


![Dr. Sauro Succi: Publications in Scienti c Journalssucci/pubjalone.pdf · systems in the modelling of weak plasma turbulence, J. of Comp. Phys.,80,2,(1989). [22] S. Succi and M. Benassi,](https://static.fdocuments.in/doc/165x107/5f965a811defc1141630ba42/dr-sauro-succi-publications-in-scienti-c-journals-succi-systems-in-the-modelling.jpg)