Guidance for Assessments Under Article 8 of the …€¦ · Web viewThe Marine Strategy Framework...
192
GES_16-2016-02 Marine Strategy Framework Directive (MSFD) Common Implementation Strategy 16 th meeting of the Working Group on Good Environmental Status (WG GES) 6 December 2016 DG Environment, Avenue de Beaulieu 5, 1160 Brussels (Room 0/C) Agenda Item: 5a Document: GES_16-2016-02 Title: Draft Art. 8 MSFD assessment guidance Prepared by: ABPmer in consultation with EU-Commission and DG GES lead Date prepared: 25.11.2016 Background WG GES 14 agreed that technical guidance on Art. 8 MSFD assessment should be prepared in close conjunction with the revision of COM Decision 2010/477/EU. WG GES asked DGGES to submit a proposal to MSCG on the scope of the proposed technical guidance and arrangements for its preparation. MSCG 17 noted the proposal (MSCG-17-2015-07 ). It was clarified that neither the work on the update of the Common Understanding process nor the technical guidance can be finalised before a first proposal of the revised Commission Decision and Annex III is presented. WG GES Workshop on 20/21 April 2016 considered a first draft guidance. Based on the discussions, the sections on “Levels of Integration” were revised and extracted from the guidance for presentation and discussion at WG GES 15 on 21 June 2016. WG GES identified a number of issues requiring further technical discussion through workshops (D1 and D6) and the MSFD expert network. Plans to progress the technical work in autumn 2016 have been postponed by the EU Commission to 2017 in order to allow finalising the revision and voting of the Commission Decision and giving more time to the technical discussions. As a result of this approach the attached draft guidance has been updated to reflect the wording of the final draft of COM Dec and for editorial improvement. The issues requiring further development, discussion and technical work are highlighted in grey boxes throughout the guidance. These reflect issues which will be taken forward in 2017 - by DG GES concerning general aspects for a common understanding on Art. 8 assessments addressed in sections 1 and 2 of this guidance; - by ICES and JRC, based on arrangements presented during the WG GES 16 meeting, following up on the Commission Decision. The aim is to agree the guidance at the current state of discussion, hence providing a basis for Member States and Regional Sea Conventions for testing the recommended assessment approaches in relation to the 2018 MSFD reporting under Art. 8 MSFD. Based on the above-mentioned work by DG GES and ICES/JRC, an updated version of the guidance is envisaged in 2018, drawing also on the experiences of Member States and Regional Sea
Transcript of Guidance for Assessments Under Article 8 of the …€¦ · Web viewThe Marine Strategy Framework...

GES_16-2016-02
Marine Strategy Framework Directive (MSFD)
Common Implementation Strategy
16th meeting of the
Working Group on Good Environmental Status (WG GES)6 December 2016
DG Environment, Avenue de Beaulieu 5, 1160 Brussels (Room 0/C)
Agenda Item: 5a
Document: GES_16-2016-02
Title: Draft Art. 8 MSFD assessment guidance
Prepared by: ABPmer in consultation with EU-Commission and DG GES lead
Date prepared: 25.11.2016
Background
WG GES 14 agreed that technical guidance on Art. 8 MSFD assessment should be prepared in close conjunction with the revision of COM Decision 2010/477/EU. WG GES asked DGGES to submit a proposal to MSCG on the scope of the proposed technical guidance and arrangements for its preparation. MSCG 17 noted the proposal (MSCG-17-2015-07). It was clarified that neither the work on the update of the Common Understanding process nor the technical guidance can be finalised before a first proposal of the revised Commission Decision and Annex III is presented.
WG GES Workshop on 20/21 April 2016 considered a first draft guidance. Based on the discussions, the sections on “Levels of Integration” were revised and extracted from the guidance for presentation and discussion at WG GES 15 on 21 June 2016. WG GES identified a number of issues requiring further technical discussion through workshops (D1 and D6) and the MSFD expert network. Plans to progress the technical work in autumn 2016 have been postponed by the EU Commission to 2017 in order to allow finalising the revision and voting of the Commission Decision and giving more time to the technical discussions.
As a result of this approach the attached draft guidance has been updated to reflect the wording of the final draft of COM Dec and for editorial improvement. The issues requiring further development, discussion and technical work are highlighted in grey boxes throughout the guidance. These reflect issues which will be taken forward in 2017
- by DG GES concerning general aspects for a common understanding on Art. 8 assessments addressed in sections 1 and 2 of this guidance;
- by ICES and JRC, based on arrangements presented during the WG GES 16 meeting, following up on the Commission Decision.
The aim is to agree the guidance at the current state of discussion, hence providing a basis for Member States and Regional Sea Conventions for testing the recommended assessment approaches in relation to the 2018 MSFD reporting under Art. 8 MSFD. Based on the above-mentioned work by DG GES and ICES/JRC, an updated version of the guidance is envisaged in 2018, drawing also on the experiences of Member States and Regional Sea Conventions.
The WG GES is invited to:
a. Consider the state of discussion on guidance on integration methods, noting the highlighted issues requiring further discussion.
b. Recommend to MSCG that the attached state-of-play of the guidance is made available to Member States and Regional Seas Convention for testing in relation to Art. 8 MSFD reporting in 2018.

Guidance for Assessments Under Article 8 of the Marine Strategy Framework DirectiveIntegration of assessment results
DG Environment
November 2016

Page intentionally left blank

Guidance for Assessments Under Article 8 of the Marine Strategy Framework DirectiveIntegration of assessment results
November 2016
Guidance for Assessments Under Article 8 of the Marine Strategy Framework Directive DG Environment
Document InformationDocument History and AuthorisationTitle Guidance for Assessments Under Article 8 of the Marine Strategy
Framework DirectiveIntegration of assessment results
Commissioned by DG EnvironmentIssue date November 2016Document ref R.2733Project no R/4211/1Date Version Revision Details25.11.2016 1 Issued for Client Review
Prepared (PM) Approved (QM) Authorised (PD)S.F. Walmsley N.J. Frost S.C. Hull
Suggested CitationWalmsley, S.F., Weiss, A., Claussen, U., Connor, D., (2016) Guidance for Assessments Under Article 8 of the Marine Strategy Framework Directive, Integration of assessment results. A report produced for the European Commission, DG Environment, November 2016.
AcknowledgementsInputs to the development of this document are gratefully acknowledged from: the Drafting Group on Good Environmental Status; and from the Member State workshop on integration methods held on 20-21 April 2016 in Brussels. In particular thanks go to those that provided suggested edits to the text: for eutrophication S. Malcolm, V. Fleming-Lehtinen, [add others]; for contaminants R. Moxon, L. Miossec, T. Porsbring, L. Enserink, K. Parmentier, V. Tornero; for habitats, C. Vina-Herbon, N. Haubner, L. Guerin, J. Krause; and for species: A. Rindorf, I. Mitchell.
ABPmer, November 2016, R.2733 | i
NoticeABP Marine Environmental Research Ltd ("ABPmer") has prepared this report in accordance with the client’s instructions, for the client’s sole purpose and use. No third party may rely upon this document without the prior and express written agreement of ABPmer. ABPmer does not accept liability to any person other than the client. If the client discloses this report to a third party, it shall make them aware that ABPmer shall not be liable to them in relation to this report. The client shall indemnify ABPmer in the event that ABPmer suffers any loss or damage as a result of the client’s failure to comply with this requirement.
Sections of this report may rely on information supplied by or drawn from third party sources. Unless otherwise expressly stated in this report, ABPmer has not independently checked or verified such information. ABPmer does not accept liability for any loss or damage suffered by any person, including the client, as a result of any error or inaccuracy in any third party information or for any conclusions drawn by ABPmer which are based on such information.
All content in this report should be considered provisional and should not be relied upon until a final version marked ‘issued for client use’ is issued. All images copyright ABPmer apart from front cover (wave, anemone, bird: www.oceansedgephotography).
ABP Marine Environmental Research LtdQuayside Suite, Medina Chambers, Town Quay, Southampton SO14 2AQ, United KingdomT: +44 (0) 2380 711844 W: http://www.abpmer.co.uk/

Guidance for Assessments Under Article 8 of the Marine Strategy Framework Directive DG Environment
Contents1 Introduction.......................................................................................1
1.1 Purpose and Scope......................................................................................11.2 About this Guidance....................................................................................21.3 Policy Context.............................................................................................31.4 Links Between Article 8 and Articles 9, 10, 11 and 13.................................31.5 Overview of Article 8 MSFD Assessment Components.................................31.6 Terminology................................................................................................4
2 Over-Arching Principles and Approaches...........................................52.1 Approach to Assessments...........................................................................52.2 Main Elements for Assessment....................................................................82.3 Geographic Scale of Assessment...............................................................112.4 Regional Assessments...............................................................................12
2.4.1 Helsinki Convention/HELCOM....................................................................................122.4.2 OSPAR Convention/OSPAR Commission....................................................................132.4.3 Barcelona Convention/UNEP-MAP..............................................................................132.4.4 Bucharest Convention/Black Sea Commission..........................................................13
2.5 Relationship between Regional and National Assessments.......................143 Pressure-Related Descriptor Assessments......................................15
3.1 Descriptor 2: Non-Indigenous Species.......................................................163.1.1 Assessment Flow.......................................................................................................163.1.2 Levels and Methods of Integration............................................................................183.1.3 Visualising Assessment Results.................................................................................19
3.2 Descriptor 3: Commercially Exploited Fish and Shellfish...........................223.2.1 Assessment Flow.......................................................................................................223.2.2 Levels and Methods of Integration............................................................................253.2.3 Visualising Assessment Results for Descriptor 3.......................................................26
3.3 Descriptor 5: Eutrophication......................................................................293.3.1 Assessment Flow.......................................................................................................303.3.2 Levels and Methods of Integration............................................................................323.3.3 Visualising Assessment Results.................................................................................34
3.4 Descriptor 6: Sea-floor Integrity (Part 1: Physical Loss and Disturbance)..............................................................................................363.4.1 Assessment flow.......................................................................................................373.4.2 Levels and Methods of Integration............................................................................383.4.3 Visualising Assessment Results for Descriptor 6.......................................................41
3.5 Descriptor 7: Hydrographical Changes......................................................433.5.1 Assessment Flow.......................................................................................................433.5.2 Levels and Methods of Integration............................................................................453.5.3 Visualising Assessment Results for Descriptor 7.......................................................46
3.6 Descriptor 8: Contaminants.......................................................................483.6.1 Assessment Flow.......................................................................................................493.6.2 Levels and Methods of Integration............................................................................533.6.3 Visualising Assessment results for Descriptor 8........................................................55
3.7 Descriptor 9: Contaminants in Seafood.....................................................583.7.1 Assessment Flow.......................................................................................................583.7.2 Levels and Methods of Integration............................................................................603.7.3 Visualising Assessment Results for Descriptor 9.......................................................61
3.8 Descriptor 10: Marine Litter......................................................................633.8.1 Assessment Flow.......................................................................................................633.8.2 Levels and Methods of Integration............................................................................653.8.3 Visualising Assessment Results for Descriptor 10.....................................................67
3.9 Descriptor 11: Energy, Including Underwater Noise..................................693.9.1 Assessment Flow.......................................................................................................693.9.2 Levels and Methods of Integration............................................................................713.9.3 Visualising Assessment Results for Descriptor 11.....................................................72
4 State-Related (Biodiversity) Descriptor Assessments......................754.1 Species (Descriptor 1) – Overview.............................................................75
4.1.1 Assessment Flow.......................................................................................................76
ABPmer, November 2016, R.2733 | ii

Guidance for Assessments Under Article 8 of the Marine Strategy Framework Directive DG Environment
4.1.2 Selecting Species to Assess......................................................................................774.1.3 Integration Sequence – Spatial Scales......................................................................784.1.4 Integration Levels and Methods................................................................................79
4.2 Birds..........................................................................................................814.2.1 Assessment Flow.......................................................................................................814.2.2 Levels and Methods of Integration............................................................................834.2.3 Visualising Assessment Results for Birds..................................................................85
4.3 Mammals...................................................................................................874.3.1 Assessment Flow.......................................................................................................874.3.2 Levels and Methods of Integration............................................................................894.3.3 Visualising Assessment Results for Mammals...........................................................92
4.4 Reptiles.....................................................................................................934.4.1 Assessment Flow.......................................................................................................934.4.2 Levels and Methods of Integration............................................................................934.4.3 Visualising Assessment Results for Reptiles..............................................................95
4.5 Fish...........................................................................................................964.5.1 Assessment Flow.......................................................................................................964.5.2 Levels and Methods of Integration............................................................................994.5.3 Visualising Assessment Results for Fish..................................................................101
4.6 Cephalopods...........................................................................................1024.6.1 Assessment Flow.....................................................................................................1024.6.2 Levels and Methods of Integration..........................................................................1034.6.3 Visualising Assessment Results for Cephalopods....................................................104
4.7 Pelagic Habitats (Descriptor 1)................................................................1054.7.1 Assessment Flow.....................................................................................................1054.7.2 Levels and Methods of Integration..........................................................................1074.7.3 Visualising Assessment Results for Pelagic Habitats...............................................110
4.8 Benthic Habitats (Descriptors 1 and 6)....................................................1124.8.1 Assessment Flow.....................................................................................................1134.8.2 Levels and Methods of Integration..........................................................................1174.8.3 Visualising Assessment Results for Benthic Habitats..............................................119
4.9 Ecosystems, Including Food Webs (Descriptors 1 and 4).........................1234.9.1 Assessment Flow.....................................................................................................1244.9.2 Levels and Methods of Integration..........................................................................1254.9.3 Visualising Assessment Results for Ecosystems Including Food Webs....................127
5 References.....................................................................................1286 Abbreviations.................................................................................130A Mapping of RSC Indicators Against Revised Commission
Decision.............................................................................................1B Lists of Criteria Elements, Threshold Values and Integration
Rules..................................................................................................1
AppendicesA Mapping of RSC Indicators Against Revised Commission
Decision...........................................................................................A1B Lists of Criteria Elements, Threshold Values and Integration
Rules................................................................................................B1
ABPmer, November 2016, R.2733 | iii

Guidance for Assessments Under Article 8 of the Marine Strategy Framework Directive DG Environment
TablesTable 1. Criteria for assessment of non-indigenous species (Descriptor 2).............16Table 2. Initial outline and illustrative example for presenting the assessment
outputs for D2C2.......................................................................................20Table 3. Initial outline and illustrative example for presenting the assessment
outputs for D2C3 for habitat types............................................................20Table 4. Initial outline and illustrative example for presenting the assessment
outputs for D2C3 for species groups.........................................................20Table 5. Criteria for assessment of commercially exploited fish and shellfish
(Descriptor 3)............................................................................................22Table 6. Initial outline and illustrative example for presenting the assessment
output for Descriptor 3 (population (stock) status) for the region or subregion..................................................................................................27
Table 7. Illustrative example of a simplified assessment output for Descriptor 3................................................................................................................27
Table 8. Criteria for assessment of eutrophication (Descriptor 5)...........................29Table 9 Initial outline and illustrative example for presenting the assessment
output for Descriptor 5, for a single assessment area...............................34Table 10. Criteria for assessment of sea-floor integrity (Descriptor 6)......................36Table 11. Initial outline and illustrative example for presenting the assessment
output for D6C1 & D6C2, for a single assessment area.............................41Table 12. Initial outline and illustrative example for presenting the assessment
output for D6C3, for a single assessment area..........................................42Table 13. Criteria for assessment of hydrographical changes (Descriptor 7)............43Table 14 Initial outline and illustrative example for presenting the assessment
output for Descriptor 7, for a single assessment area...............................47Table 15. Criteria for assessment of contaminants (Descriptor 8)............................48Table 16. Initial outline and illustrative example for presenting the assessment
output for Descriptor 8, D8C1, for an assessment area.............................56Table 17. Initial outline and illustrative example for presenting the assessment
output for Descriptor 8, D8C2, for an assessment area.............................56Table 18. Criteria for assessment of contaminants in seafood (Descriptor 9)...........58Table 19 Initial outline and illustrative example for presenting the assessment
output for Descriptor 9, for an assessment area.......................................61Table 20. Criteria for assessment of marine litter (Descriptor 10)............................63Table 21. Initial outline and illustrative example for presenting the assessment
output for Descriptor 10, D10C1, D10C2 and D10C3................................67Table 22. Initial outline and illustrative example for presenting the assessment
output for Descriptor 10, D10C3...............................................................68Table 23. Initial outline and illustrative example for presenting the assessment
output for Descriptor 10, D10C4...............................................................68Table 24. Criteria for assessment of energy including underwater noise
(Descriptor 11)..........................................................................................69Table 25. Initial outline and illustrative example for presenting the assessment
outputs for Descriptor 11, D11C1..............................................................73Table 26. Initial outline and illustrative example for presenting the assessment
outputs for Descriptor 11, D11C2..............................................................73Table 27. Ecosystem components and their species groups, for consideration
under the ‘species’ aspects of Descriptor 1...............................................76Table 28. Criteria for assessment of birds (Descriptor 1)..........................................81Table 29 Initial outline and illustrative example for presenting the assessment
output for Descriptor 1 (Birds) for a single species group for the region or subregion...................................................................................85
Table 30. Criteria for assessment of mammals (Descriptor 1)..................................87
ABPmer, November 2016, R.2733 | iv

Guidance for Assessments Under Article 8 of the Marine Strategy Framework Directive DG Environment
Table 31. Habitats Directive status categories and corresponding status for MSFD assessment.....................................................................................91
Table 32. Criteria for assessment of fish (Descriptor 1)............................................96Table 33. Criteria for assessment of cephalopods (Descriptor 1)............................102Table 34. Criteria for assessment of pelagic habitats (Descriptor 1).......................105Table 35. Initial outline and illustrative example for presenting the assessment
output for Descriptor 9, for an assessment area.....................................110Table 36. Criteria for assessment of benthic habitats (D1 and D6).........................112Table 37. Benthic broad habitat types, for consideration under the ‘benthic
habitats’ D1 and D6................................................................................115Table 38. Initial outline and illustrative example for presenting the assessment
output for Descriptors 1 and 6 Benthic Habitats.....................................120Table 39. Illustrative assessment of a broad habitat type (example –
circalittoral sand)....................................................................................120Table 40. Criteria for assessment of ecosystems (Descriptor 4).............................123Table 41. Example of a division of trophic guilds, and the main taxonomic
groups that may contribute to each guild...............................................124Table 42. Initial outline and illustrative example for presenting the assessment
output for Descriptor 4 for the region or subregion, or subdivision.........127
Table A1. Part I: Assessment of predominant pressures and impacts under Article 8(1)(b) MSFD....................................................................................2
Table A2. Part II: Assessment of essential features and characteristics and current environmental status under of marine waters under Article 8(1)(a) MSFD...............................................................................................7
Table B1. Part I: Assessment of predominant pressures and impacts under Article 8(1)(b) MSFD....................................................................................2
Table B2. Part II: Assessment of essential features and characteristics and current environmental status under of marine waters under Article 8(1)(a) MSFD...............................................................................................4
FiguresFigure 1. Integrated scheme for presenting assessment results (adapted from
MSCG-17-2015-06 to the revised COM Dec)................................................9Figure 2. Example of assessment outputs................................................................10Figure 3. Levels and methods of integration for Descriptor 2...................................18Figure 4. Illustrative example of a visual summary of assessment output for
non-indigenous species, based only on D2C1 (Descriptor 2 ‘satellite’).....21Figure 5. Levels and methods of integration for Descriptor 3...................................25Figure 6. Illustrative example of a visual summary of assessment output for
commercially exploited stocks (Descriptor 3 ‘satellite’)............................28Figure 7. Levels and methods of integration for Descriptor 5 (beyond coastal
waters)......................................................................................................32Figure 8. Illustrative example of a visual summary of assessment output for
eutrophication (Descriptor 5 ‘satellite’).....................................................35Figure 9. Levels and methods of integration for Descriptor 6...................................39Figure 10. Levels and methods of integration for Descriptor 7...................................45Figure 11. Illustrative example of a visual summary of assessment output for
hydrographical changes, based on D7C1 (Descriptor 7 ‘satellite’)............47Figure 12. Levels and methods of integration for Descriptor 8...................................53Figure 13. Illustrative example of a visual summary of assessment output for
contaminants, based only on D8C1 and D8C3 (Descriptor 8 ‘satellite’)....57Figure 14. Levels and methods of integration for Descriptor 9...................................60Figure 15. Illustrative example of a visual summary of assessment output for
contaminants in fish and other seafood for human consumption (Descriptor 9 ‘satellite’).............................................................................62
Figure 16. Levels and methods of integration for Descriptor 10.................................66
ABPmer, November 2016, R.2733 | v

Guidance for Assessments Under Article 8 of the Marine Strategy Framework Directive DG Environment
Figure 17. Levels and methods of integration for Descriptor 11.................................71Figure 18. Illustrative example of a visual summary of assessment output for
underwater noise (Descriptor 11 ‘satellite’)..............................................74Figure 19. Levels and methods of integration for species under Descriptor 1............79Figure 20. Levels and methods of integration for birds under Descriptor 1................83Figure 21. Illustrative example of a visual summary of assessment outputs for
Descriptor 1 Birds......................................................................................86Figure 22. Levels and methods of integration for mammals under Descriptor 1........90Figure 23. Levels and methods of integration for reptiles under Descriptor 1............94Figure 24. Levels and methods of integration for fish under Descriptor 1..................99Figure 25. Levels and methods of integration for cephalopods under Descriptor
1..............................................................................................................103Figure 26. Eco-hydrodynamic areas in the Greater North Sea (van Leeuwen et
al., 2015).................................................................................................108Figure 27. Levels and methods of integration for pelagic habitats under
Descriptor 1............................................................................................109Figure 28. Illustrative example of a visual summary of assessment outputs for
Descriptor 1 Pelagic Habitats..................................................................111Figure 29. Illustration of the assessment of a habitat group showing the
aggregation of representative habitats to a broad habitat type (EUNIS level 2)....................................................................................................117
Figure 30. Levels and methods of integration for benthic habitats under Descriptor 1............................................................................................118
Figure 31. Illustrative example of a visual summary of assessment outputs for Descriptor 1 Benthic Habitats..................................................................122
Figure 32. Levels and methods of integration for Descriptor 4.................................126
ABPmer, November 2016, R.2733 | vi

Guidance for Assessments Under Article 8 of the Marine Strategy Framework Directive DG Environment
1 Introduction1.1 Purpose and ScopeThe Marine Strategy Framework Directive (MSFD, 2008/56/EU) requires assessment of the current environmental status of Member States’ marine waters and of the predominant pressures and impacts upon them (Article 81 MSFD). These assessments need to be linked closely to the Member State’s determinations of good environmental status (GES) under Article 9(1) MSFD, so that they indicate whether GES has been achieved or how close they are to achieving GES. The criteria and methodological standards, laid down by the EU Commission in accordance with Article 9(3) and Article 25(3) MSFD, provide the basis for assessing the extent to which GES has been achieved. They therefore provide the basis for both the determinations of GES and the assessment of whether GES has been achieved. In undertaking the assessments, Member States are required to cooperate within each MSFD region or subregion to ensure that the assessments are coherent and coordinated, and endeavour to follow common approaches (Article 5(2) MSFD). This regional coordination is expected to be done through existing institutional cooperation structures, including the Regional Sea Conventions (RSCs) (Article 6 MSFD).
The EU Commission document on cross-cutting issues (‘cross-cutting issues document’, MSCG-17-2015-06) sets out conceptual approaches to a suite of assessments required under Article 8 MSFD, including a concept for an integrated presentation of the extent to which GES is achieved. To operationalise these concepts, the present guidance provides a set of key principles and practical technical approaches for use by Member States and Regional Sea Conventions in developing consistent assessment and status classification systems. The guidance is intended as a manual guiding implementers step-by-step through the assessment process and includes illustrative worked examples.
The guidance is developed in two phases in order to take account of existing timelines that Member States and Regional Sea Conventions are already engaged in, noting that the assessment processes for the 2018 update of the Article 8 MSFD assessments have already started. A phased approach also recognises that the 2018 update of Article 8 MSFD assessments will be a transitional step towards more consistent and regionally coherent future assessments. This is due in part because the Commission Decision 2010/477/EU on criteria and methodological standards for environmental status and the closely linked Annex III MSFD were revised in 20162 and will take time to fully implement, but is also due to there being remaining gaps in assessment tools (cf. development of scientific indicators in support of GES assessment).
The phased approach is as follows:
In the first phase (2016), this guidance document summarises the approaches for integrating assessment results across scientific indicators and the GES Decision criteria for use by Member States and Regional Sea Conventions in the 2018 update of Article 8 MSFD assessment in order to present in a consistent way the overall extent to which good environmental status is being achieved. This guidance addresses Article 8(1)(a) and 8(1)(b), but not Article 8(1)(c).
In the second phase (from 2017 onwards), the guidance will be further developed to address remaining technical questions and to develop technical guidance on the individual assessments of activities, pressures, impacts and status and how they link up in future assessments, building inter alia on the latest experiences of
1 Additionally, an economic and social analysis of the uses of the marine waters and of the cost of degradation of the marine environment is required under Article 8(1)(c) MSFD.
2 The revised GES criteria Decision and MSFD Annex III were approved by Member States on 10 November 2016; there follows a period of scrutiny by the European Parliament and Council before they are formally adopted and published, which is anticipated by spring 2017.
ABPmer, November 2016, R.2733 | 1

Guidance for Assessments Under Article 8 of the Marine Strategy Framework Directive DG Environment
Member States and Regional Sea Conventions gained in the 2018 update of the Article 8 MSFD assessments.
Section 1 ‘Introduction’ will be further developed by DG GES by 2018 as a contribution of Member States to a common understanding of the Article 8 MSFD assessment. For the time being, the subsections exemplify the items to be covered and developed by DG GES.
1.2 About this GuidanceThis guidance has been developed alongside the revision of Commission Decision 2010/477/EU on Criteria and Methodological Standards (revised COM Dec, 2017/XX/XX). It is also informed, where appropriate, by:
the outputs from the technical review process that contributed to the revision of the Commission Decision;
further technical work by ICES on Descriptors 1 and 3; discussions and contributions of the Working Group on Good Environmental Status
(WG GES) Workshop on Article 8 MSFD assessments on 20-21 April 2016; feedback from Member States following the presentation of integration
approaches at WG GES on 21 June 2016; and contributions from the Drafting Group on GES (DG GES).
It is based on the revised Commission Decision agreed by the Regulatory Committee established under Article 25(1) MSFD on 10 November 2016 (CTTE_15-2016-05, draft of 26/10/2016).
The purpose of this guidance is to support Member States, working together in each region or subregion including through the Regional Sea Conventions where appropriate, in the production of compatible outputs from assessments so that they:
can contribute to regional and EU-scale compilations of information, presenting the extent to which GES is achieved;
facilitate communication of the environmental status of the marine environment to managers and the public.
It is recognised that the underlying data and methods of the assessments will vary. Member States will be at varying stages in the development of scientific indicators (national, regional and Europe-wide), based on the monitoring data available, and assessment processes within two of the Regional Sea Conventions are well advanced. Therefore it is likely that Member States and the Regional Sea Conventions will have differing abilities to produce assessments against each criterion of the revised Commission Decision for 2018 and, where appropriate, integration of these within Descriptors to indicate the extent to which GES has been achieved.
Any references to specific articles refer to Directive 2008/56/EC unless otherwise specified.
This Guidance document is not legally binding but seeks to improve the coherence of Article 8 assessments across Member States within and across subregions and regions by providing recommended approaches to integration of indicators and criteria, and examples for presenting assessment results. The aim is that assessments are coherent, transparent and repeatable.
Sections on ‘Presenting assessment results’ provide initial outlines and illustrative examples of tabular formats for expressing the outcomes of the assessment, in line with the requirements of the revised COM Dec. However, it is noted that formal reporting requirements will be determined by the Working Group on Data, Information and Knowledge Exchange (WG DIKE) and may differ from the proposals in this Guidance.
ABPmer, November 2016, R.2733 | 2

Guidance for Assessments Under Article 8 of the Marine Strategy Framework Directive DG Environment
Additionally, illustrative examples for a visual summary of the outcomes in line with the integrated scheme for presentation of assessment results (‘pizza-satellite’) are provided.
Text highlighted in grey and placed in boxes summarises outstanding issues. This includes issues where it has not been possible to reach agreement on approaches among Member States, and where possible a recommended interim approach is provided.
Worked examples may be included for some descriptors. These are yet to be developed.
1.3 Policy ContextSection to cover (and may later be combined with section 1.5 if appropriate, to avoid overlaps):
Brief summary of the development of an assessment framework (Article 12 MSFD assessment of 2012 reports, Common Understanding document (WG GES, 2011), Cross-cutting issues paper (European Commission, 2015a), revision of Annex III and the Commission Decision, International Council for the Exploration of the Sea (ICES) and Joint Research Council (JRC) technical work.
Drive for EU and regional consistency.
1.4 Links Between Article 8 and Articles 9, 10, 11 and 13
Section to cover the approach to determining and assessing GES [See MSCG_17-2015-05, p7-8.]:
Art 8 assessment has a direct link with Art 9 descriptors:o Article 8(1)(a) – State descriptors/criteria;o Article 8(1)(b) – Pressures and Impacts descriptors/criteria;
Approach to assessing whether GES has been achieved, based on criteria in the revised Commission Decision and the set of characteristics determined by MS according to Art 9(1);
See also Fig 2 in MSCG_17-2015-06. Article 8 refers to the Annex III characteristics and pressures and impacts. For the
initial assessment in 2012, this framework was adopted by some Member States, and the assessment was used to determine GES. The subsequent implementation cycles of the MSFD require assessment of environmental status, against the determination of GES. For these assessments (2018, 2024 etc.), structuring the assessment according to the GES descriptors and criteria, as laid out in the revised Commission Decision, is appropriate.
1.5 Overview of Article 8 MSFD Assessment Components
Section to cover:
Overview of the individual assessments to be undertaken under Article 8(1)(a) and (b) and Article 9 MSFD and a structured approach on how to bring together different aspects of the initial assessment:
o Assess the distribution and intensity of human activities;o Assess the distribution and intensity of pressures resulting from human
activities;o Assess the impacts of the pressures on the ecosystem elements;
ABPmer, November 2016, R.2733 | 3

Guidance for Assessments Under Article 8 of the Marine Strategy Framework Directive DG Environment
o Assess the status of ecosystem elements; Integrated presentation of assessment results as a tool to communicate the
extent to which GES is being achieved; Assessing change, i.e. in moving towards GES (including the relevance of trend
assessments); Assessing progress towards environmental targets.
1.6 TerminologyThe terms ‘integration’ and ‘aggregation’ are sometimes used interchangeably (e.g. Prins et al., 20143), and clarity is needed on their meaning. The Cross-Cutting Issues document discusses an ‘integrated approach to assessing GES’, and the revised COM Dec refers to the spatial and temporal aggregation of data in relation to assessments. The Drafting Group on Good Environmental Status (DG GES) Common Understanding process defined aggregation as the combination in space and time, and integration as the combination across indicators and criteria.
This guidance uses the following definitions:
Integration: the combining of information from different (scientific) indicators into one higher-level indicator or to criterion-level, or the combining of information from two or more criteria to descriptor level or to an alternative grouping of criteria (e.g. for an ecosystem component, or for a grouping of criteria below descriptor level).
Aggregation: the spatial and/or temporal combining of information on the same scientific indicator (or higher-level indicator, or species group, or criterion etc.).
Spatial scale: the geographical scale at which assessments should be carried out, for example, region or subregion, national waters (i.e. under a country’s jurisdiction), coastal water bodies etc.
Assessment area: an individual, defined area that is used for assessments. These may be defined at different spatial scales as part of a nested approach. For an assessment at a specified spatial scale, some assessment areas may not be relevant and would not need to be assessed.
Integration of indicators and criteria requires that all elements to be integrated are assessed for the same assessment area. Where this is not the case, either aggregation to larger areas, or down-scaling to smaller assessment areas will be necessary.
3 Prins, T.C., Borja, A., Simboura, N., Tsangaris, C., Van der Meulen, M.D., Boon, A.R., Menchaca, I., Gilbert, A.J. (2014). Coherent geographic scales and aggregation rules in assessment and monitoring of Good Environmental Status – analysis and conceptual phase. Towards a Guidance document. Deltares/AZTI/HCMR, report 1207879-000-ZKS-0014 to the European Commission, Delft, 47 pages..
ABPmer, November 2016, R.2733 | 4

Guidance for Assessments Under Article 8 of the Marine Strategy Framework Directive DG Environment
2 Over-Arching Principles and Approaches
This section sets out general principles to provide step-wise guidance on the assessments to be undertaken for Article 8(1)(a) and (b), based on application of the revised COM Dec criteria and methodological standards and Member State determinations of GES under Article 9(1), which lead to a consistent presentation of assessment results across marine regions and Member States.
The assessments under Article 8(1)(a) and (b) should be undertaken in relation to the determinations of GES under Article 9(1) and using the criteria and methodological standards set by the Commission in accordance with Article 9(3) (i.e. the 2017 revised Commission Decision).
This section will be further developed by 2018. Possible topics in addition to those already included are:
Linking indicators with criteria: avoiding assessing a single aspect more than once, e.g. benthic indicators (cumulative impact) and pressure indicators;
How to integrate different geographic scales in the assessment?o Some indicators operate at small assessment scales (e.g. WFD water
bodies) while others operate at larger scales. This may require scaling down and up from an agreed regional assessment area. This means that the same assessment result for a big area (e.g. region) is applied to various small assessment units (e.g. basins). Results for smaller areas may need to be aggregated together, or assessment results could be provided as a percentage of areas achieving good status.
How to deal with gaps in the integration process: In cases where assessment results for individual scientific indicators or criteria (or components thereof) are not available, how should integration across indicators/criteria take place?
How to deal with assessments for which there is a trend-based outcome but a judgement of status for the criterion has not been made?
Any other common problems and solutions identified in sections 3 and 4. Compatible presentations.
2.1 Approach to AssessmentsThe cross-cutting issues document sets out a two-step process for assessments under Article 8(1)(a) and (b):
Step 1: assess the predominant pressures and their impacts on the marine environment (to fulfil Article 8(1)(b) requirements); this can be informed, where appropriate, by a mapping of the uses and activities in the marine environment, and may include other pressures and impacts set out in Annex III;
Step 2: assess the environmental status of marine ecosystems (including species and habitats), informed by the pressure and impact assessments under step 1 (to fulfil Article (8(1)(a) requirements).
These two steps allow for an assessment of the extent to which GES has been achieved, addressing all eleven GES descriptors of MSFD Annex I. The assessments under Article 8(1)(a) and 8(1)(b) should be undertaken in relation to the determinations of GES under Article 9(1) and using the criteria and methodological standards set by the Commission in accordance with Article 9(3).
ABPmer, November 2016, R.2733 | 5

Guidance for Assessments Under Article 8 of the Marine Strategy Framework Directive DG Environment
Given the number of criteria that Member States need to monitor and assess, applying a risk-based approach can help focus efforts on the main anthropogenic pressures affecting their waters and on the associated environmental impacts. A generalised approach to a prioritised implementation of the MSFD is set out in section 3.6 of the Commission’s Cross-Cutting Issues Paper (European Commission, 2015a). This involves inter alia assessing at specified spatial scales:
the distribution and intensity of human activities; the distribution and intensity of pressures resulting from human activities; those aspects of the marine environment which are most likely affected by these
pressures.
The assessments should yield a clear indication of the scale and distribution of the different predominant pressures (using first a mapping of human activities, if appropriate) and how each is affecting the status of the different ecosystem elements to be assessed, leading to clear conclusions on which pressures are most preventing the achievement of GES. The described approach can inform decisions under step 2 and 3 in the assessment as set out in the following assessment flow.
The basic steps in the assessment of each Descriptor under Article 8(1)(a) and 8(1)(b) are described below. This provides the generic approach; specific details for each Descriptor are provided in Sections 3 and 4.
Determine the criteria to address Primary criteria are EU minimum requirements for assessment at
the prescribed scale4. Establish whether such conditions are met, necessitating and/or justifying the use of a secondary criterion. Other secondary criteria may be used in addition to primary criteria.
Establish for each secondary criterion whether it should be applied based on the conditions set out in the revised COM Dec.
Determine the elements for assessment For each criterion selected in step 1, the elements for assessment
should be identified, i.e. the features and pressures under Article 8 and the corresponding characteristics of GES under Article 9(1) (e.g. substances, species, habitats).
In some cases, the Commission Decision specifies the elements to be used, but in a number of cases there is need of a further step:
Where the Commission Decision refers to lists of elements established by existing EU legislation, these elements are set as the EU minimum requirement for assessment at the prescribed scale.
Note: An element can be excluded from the assessment through deselection from the existing list, based on the procedures of the EU legislation under which the list has been established.
Where elements are not determined by existing EU legislation or where regional coordination goes beyond existing EU legislation, the regionally-agreed elements should be applied for assessment.
Note: A regionally agreed element can be excluded from the assessment through deselection from the existing list, based on the agreements under which the list has been established.
Member States may choose to select additional elements for assessment which are specific for assessing GES in their national waters.
4 The revised COM Dec allows for the primary criterion D5C5 to be substituted by the secondary criterion D5C8.
ABPmer, November 2016, R.2733 | 6
Step 1
Step 2

Guidance for Assessments Under Article 8 of the Marine Strategy Framework Directive DG Environment
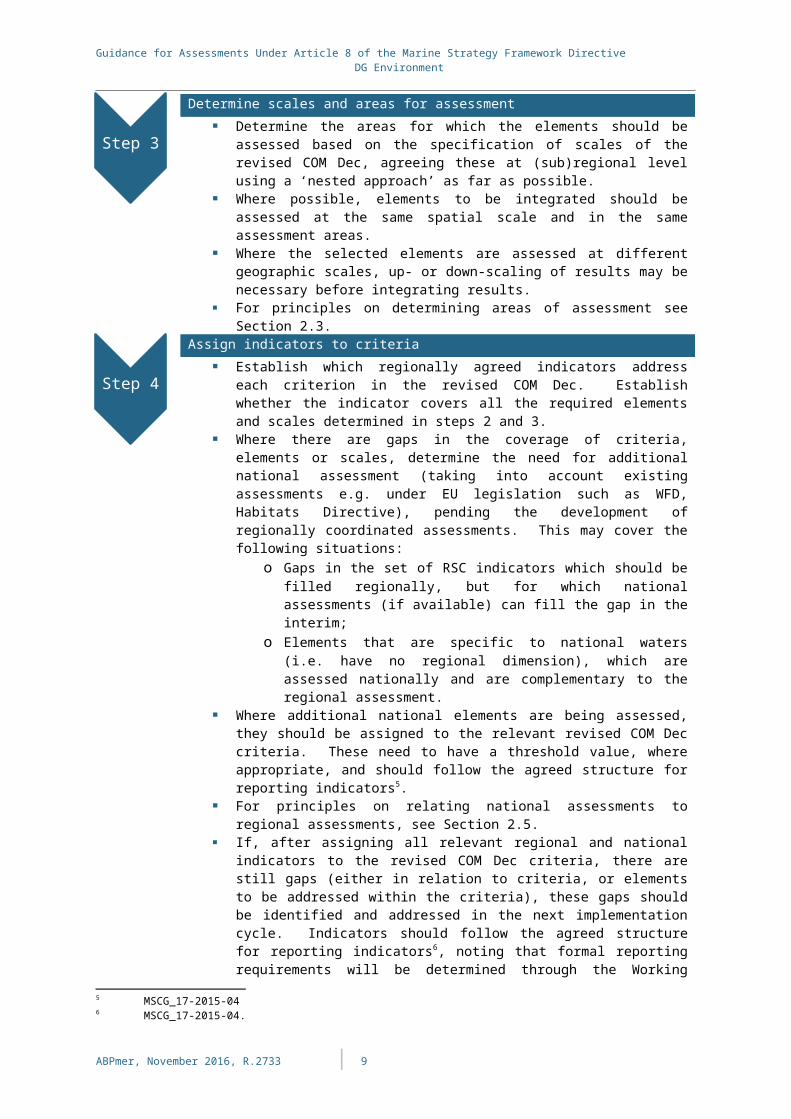
Determine scales and areas for assessment Determine the areas for which the elements should be assessed
based on the specification of scales of the revised COM Dec, agreeing these at (sub)regional level using a ‘nested approach’ as far as possible.
Where possible, elements to be integrated should be assessed at the same spatial scale and in the same assessment areas.
Where the selected elements are assessed at different geographic scales, up- or down-scaling of results may be necessary before integrating results.
For principles on determining areas of assessment see Section 2.3.Assign indicators to criteria
Establish which regionally agreed indicators address each criterion in the revised COM Dec. Establish whether the indicator covers all the required elements and scales determined in steps 2 and 3.
Where there are gaps in the coverage of criteria, elements or scales, determine the need for additional national assessment (taking into account existing assessments e.g. under EU legislation such as WFD, Habitats Directive), pending the development of regionally coordinated assessments. This may cover the following situations:
o Gaps in the set of RSC indicators which should be filled regionally, but for which national assessments (if available) can fill the gap in the interim;
o Elements that are specific to national waters (i.e. have no regional dimension), which are assessed nationally and are complementary to the regional assessment.
Where additional national elements are being assessed, they should be assigned to the relevant revised COM Dec criteria. These need to have a threshold value, where appropriate, and should follow the agreed structure for reporting indicators5.
For principles on relating national assessments to regional assessments, see Section 2.5.
If, after assigning all relevant regional and national indicators to the revised COM Dec criteria, there are still gaps (either in relation to criteria, or elements to be addressed within the criteria), these gaps should be identified and addressed in the next implementation cycle. Indicators should follow the agreed structure for reporting indicators6, noting that formal reporting requirements will be determined through the Working Group on Data, Information and Knowledge Exchange, WG DIKE).
Establish levels and thresholds Threshold values should be established for each element, indicator
or criterion, as appropriate. Depending on the criterion, the revised COM Dec requires Member States to use existing threshold values established under EU legislation and, in the absence of existing EU-values, to establish threshold values at Union level, or through regional or subregional cooperation. When this has not been possible for the 2018 assessments, the revised Commission Decision provides for use of national threshold values, trends and pressure-based proxies.
Assess status The status of each indicator should be determined, for each
relevant assessment area, based on the value of the indicator compared to the levels and thresholds established in step 5.
5 MSCG_17-2015-046 MSCG_17-2015-04.
ABPmer, November 2016, R.2733 | 7
Step 3
Step 4
Step 5

Guidance for Assessments Under Article 8 of the Marine Strategy Framework Directive DG Environment
Integrate indicators and criteria The indicators relating to each criterion should be brought together
to provide a judgement on each criterion, and criteria or assessed elements should be integrated to an appropriate level for an overall judgement on the extent to which good environmental status is achieved in relation to the descriptors.
Note that for some descriptors the integration of information to descriptor level is not envisaged, but integration may stop at criteria level. The level of integration is specified for each descriptor in the respective ‘Level of integration’ sections in Sections 3 and 4, which record the state of discussion in relation to the specified integration rules.
Note that for some descriptors (e.g. D1 Species and D1/D6 Habitats), the selection of elements (species or habitats) to be assessed comes prior to the selection of criteria, since the type of species or habitat (e.g. whether it is covered by the Habitats Directive, whether it is a commercially exploited fish species) determines whether criteria are primary or secondary.
The table in Appendix B provides a simplified overview per criterion of the lists of criteria elements, threshold values and integration rules for which, according to the revised COM Dec, standards exist (status November 2016) and should apply, or for which the revised COM Dec provides for Member States to establish them through Union, regional or subregional cooperation.
Some of the steps above, such as identification of relevant elements and threshold values, have links through to the determination of GES under Article 9.1 MSFD, demonstrating the close relationship between the two aspects of the 2018 updating process.
The Descriptor-specific sections then elaborate on the integration process and methods. More detailed guidance will be required on integration at level 1, for example: the time frame for the data to be used in the assessment (last 6 years, or latest year only); how to calculate whether the threshold has been achieved (average of measurements over the period compared to the threshold, or individual measurements compared to the threshold, with a single exceedance indicating failure). These issues require Descriptor-specific technical guidance and will be taken forward separately.
2.2 Main Elements for AssessmentThe extent to which GES is achieved for a specific geographic area needs to be clearly communicated. This involves the aggregation and integration across the many individual assessments and data sets relating to the eleven descriptors in order to reach conclusions on whether GES has been achieved or not. Aggregation and integration need to take into consideration and be balanced with appropriate details and scales for identifying and implementing any necessary management actions via national Programmes of Measures.
The cross-cutting issues document has set out a conceptual scheme for organising and presenting the assessment relating to pressure/impacts and to the state of ecosystem components with a view to providing a conclusion on the overall state of the marine
ABPmer, November 2016, R.2733 | 8
Step 6
Step 7

Guidance for Assessments Under Article 8 of the Marine Strategy Framework Directive DG Environment
environment (Figure 1). It encompasses the eleven descriptors and shows how these relate to the different aspects of Article 8(1)(a) and 8(1)(b). While GES is only met if all descriptors are in good status, the scheme suggests that integration stops at the level of pressure-related descriptors and at the level of the individual ecosystem components. This approach allows the identification of the main pressures/impacts and the main ecosystem components which are responsible for a specific area failing GES. Integration is not anticipated across descriptors or across biological elements (broad species groups or habitats).
D3
D5
D6
D7
D2 D8
D9
D10
D11
Otherpressures
Assessment of specific pressures and their impacts on ecosystem components (Art. 8.1.b MSFD)
Assessment of ecosystem components (Art. 8.1.a MSFD)
D1 D6
Figure 1. Integrated scheme for presenting assessment results (adapted from MSCG-17-2015-06 to the revised COM Dec)
This Guidance document specifies integration to achieve consistent conclusions on the extent to which GES is achieved for each of the different topics set out in Figure 1. To this end, the guidance describes for each topic:
the envisaged level of integration of indicators, criteria and elements; the flow/sequence of assessment and integration steps; the nodes of integration and the associated integration rules; the assessment outputs for presenting the extent to which GES is achieved.
The Guidance does not address the aggregation of assessments across spatial assessment areas, focussing instead on the integration of indicators (e.g. elements for different criteria) and criteria within an assessment area. A number of research projects have developed options for integration and aggregation of indicators for GES assessments under MSFD, for example:
The Life+ Marmoni project developed a biodiversity tool that is aligned with the existing MSFD descriptor requirements (2010 COM Dec), focusing on descriptor 1 (Biodiversity)7.
The EU 7th framework project DEVOTES has developed a flexible, hierarchical and modular tool for assessment of ‘biodiversity status’, including some additional structures, such as flexible aggregation principles, several weighting principles and confidence assessments8.
7 www.sea.ee/marmoni/index.php 8 www.devotes-project.eu/neat
ABPmer, November 2016, R.2733 | 9

Guidance for Assessments Under Article 8 of the Marine Strategy Framework Directive DG Environment
The integrated scheme (Figure 1) is the top-level assessment output summarising the state of the marine environment at a high level. Comparable outputs should be agreed to be delivered as part of the assessment process in the RSCs. Figure 2 illustrates how a hierarchy of output products could look in order to serve the different national, regional and EU purposes. Additional assessment outputs of individual elements and at different scales are likely to be needed for purposes of the management of pressures in national waters.
Figure 2. Example of assessment outputs
Assessments will typically start with the assessment of a single element (e.g. species, habitat, contaminant) for which there is a dataset for the assessment area in the assessment period. This could, for example include multiple stations and repeated sampling within or across years for a nutrient or contaminant. These will then go through several steps in an assessment process. The sequence of those steps is specific to each descriptor/element and dependent on the scientific indicators used which may act at different levels of integration — some scientific indicators correspond directly to the revised COM Dec criteria, whereas others are one of a number of scientific indicators that contribute to a criterion and therefore require integration to criterion level. The sequence of those steps may include integration across indicators, criteria and elements.
Because the data that will be used for any given assessment may vary considerably between regions and Member States, this guidance does not address the first steps in each assessment process which lead to a ‘scientific indicator’ assessment. Instead it focuses on the later steps of integration across scientific indicators, criteria and elements which lead to conclusions on the overall status of the main components of Figure 1. This aims to ensure consistent application of the revised COM Dec criteria, and the production of assessment outputs (i.e. the extent to which GES has been achieved) that can be presented in a common way across Member States and regions.
The assessment outputs for presenting the extent to which GES is achieved can take different forms depending on the purpose of the presentation and communication. The current draft guidance sets out for each descriptor and ecosystem component the preferred common assessment output for comparing status classification across the EU.
ABPmer, November 2016, R.2733 | 10

Guidance for Assessments Under Article 8 of the Marine Strategy Framework Directive DG Environment
Additional assessment outputs still need to be discussed and agreed depending on communication purposes. These options include:
To provide detail on transferring the assessment outputs into the integrated scheme for presenting assessment results (Figure 1) which provides a concise communication of the status of GES in relation to all descriptors and ecosystem components at the relevant geographic scales.
To provide detail on the assessment results which are relevant for management. Need and options are specific for the descriptor and criteria. In general, possible approaches include:
o distinction between elements accessible to management and those that are not (e.g. banned legacy contaminants vs contaminants in use);
o distinction between matrices where this helps address management. To express change in status as improving, stable or deteriorating compared to the
previous reporting period. To express distance to the threshold value / good status in order to provide
insight into the magnitude of the problem and also into progress i.e. changes in status between MSFD cycles. Options are specific for the descriptor and criteria. In general, possible approaches include:
o bar chart presentations of the assessment values against threshold, possibly normalised on a scale 0 – 1; differentiated classification on both sides of the boundary good/not good.
Section on assessment outputs to be revised and further defined in light of experience through RSC cooperation on additional outputs as part of their assessment products. Assessment outputs will depend on national management needs and EU reporting requirements. Reporting needs in turn depend on how the Commission intends to assess implementation and success of MSFD (e.g. linking status assessment with targets and Programmes of Measures) and accordingly to determine the type of, and the level at which, information should be reported under Article 8.
2.3 Geographic Scale of AssessmentGeneral principles:
The Article 8 assessments need to address the whole of a Member State’s marine waters within each marine region or subregion9, although individual assessments may need to cover only a part of this area;
Assessments of the elements can be undertaken at different geographical scales, using appropriate scales for each element (e.g. assessment at the regional or subregional scale, or suitable subdivisions of these). Generic scales for assessment are given in the revised COM Dec. Member States may wish to assess in their waters and later aggregate the results to regional or subregional scale together with other Member States;
In some situations, data are summarised per grid area (e.g. underwater noise), and then reported at a broader level (e.g. percentage of grid cells in an assessment area below the threshold value).
A combination of the element to be assessed and the appropriate scale for its assessment allows for the identification of the specific areas to be used for assessment within each region and subregion; the ‘nested assessment areas’ being used or developed by HELCOM and OSPAR provide schemes for integrated assessments of a region or subregion;
Scales for state-based assessments should be ecologically relevant, reflecting the different characteristics of species, habitats and ecosystems within each region or subregion;
Scales for pressure-based assessments need to be compatible with those used in state-based assessments, to allow for the linkage of assessment of impacts, but
9 The MSFD marine regions and subregions are listed in MSFD Article 4
ABPmer, November 2016, R.2733 | 11
Guidance for Assessments Under Article 8 of the Marine Strategy Framework Directive DG Environment
also consider management needs (as pressures may need to be addressed via programmes of measures);
The outcomes of Article 8 assessments can thus be considered as assessments for a given element in a given area; this lends itself to presentation of the outcomes on maps to help illustrate the extent to which GES has been achieved;
Sections 3 and 4 of this Guidance illustrate the practical application of these principles per descriptor.
2.4 Regional Assessments This section will provide background on the regional assessment processes and indicators:
Individual section for each RSC on their approach; Regional or subregional assessments should be used where they exist,
supplemented by national indicators where required; Regional and subregional assessments can be prepared by Member States (i.e.
cover only their waters within the region/subregion) and do not necessarily need to involve non-EU countries in the region/subregion.
Mapping of RSC indicators into the new structure of the Commission Decision on criteria and methodological standards provided in Appendix A.
2.4.1 Helsinki Convention/HELCOMThe HELCOM Second Holistic Assessment of the Ecosystem Health of the Baltic Sea (HOLAS II) aims to provide an update on the overall state of ecosystem health in the Baltic Sea. The results of the assessment will support reporting under the MSFD by Contracting Parties to the Helsinki Convention that are also EU Member States. HELCOM is anticipating potential changes in requirements for reporting for the 2018 Article 8 MSFD assessment for Member States, and therefore the assessment tools are being developed to give a variety of options for the level at which outputs are provided (e.g. for biodiversity assessment, at the level of biological elements, criteria and descriptors)10.
HELCOM’s regionally-agreed core indicators form the basis for the assessment of environmental status. HOLAS II is developing assessment tools to provide integrated regional-scale assessments. HELCOM has been discussing whether and how to incorporate additional national indicators within the assessment processes, such as by neighbouring countries agreeing on the use of certain indicators for a sub-basin. A first version of the 2nd Holistic Assessment of the Baltic Sea Ecosystem will be prepared by mid-2017 and an updated version by mid-2018.
HELCOM has a history of using integrated assessment tools, having previously developed and is currently updating:
BEAT – Biodiversity assessment tool; HEAT – Eutrophication assessment tool; CHASE – Hazardous substances assessment tool; Baltic Sea Pressure and Impact Indexes.
HELCOM’s core indicators, and their relation to the MSFD descriptors and revised COM Dec criteria, are shown in Appendix A.
2.4.2 OSPAR Convention/OSPAR CommissionThe OSPAR Intermediate Assessment 2017 will present indicator assessments which aim to support Contracting Parties which are also EU Member States in reporting in 2018 under Article 8 MSFD. The assessments will address some of the criteria relating to pressure-based descriptors and to status-based descriptors. An assessment of the
10 HELCOM (2016). Document 1 - Overview of the HOLAS II Biodiversity assessment with timeline. HELCOM BalticBOOST Workshop on the HOLAS II Biodiversity assessment tool. Copenhagen, Denmark, 11-12 February 2016.
ABPmer, November 2016, R.2733 | 12

Guidance for Assessments Under Article 8 of the Marine Strategy Framework Directive DG Environment
distribution and intensity of human activities and associated pressures and impacts is not planned. To date (November 2016) it is not anticipated that OSPAR common indicators are integrated in any form, except for the integrated eutrophication assessment under the OSPAR Common Procedure, to express the extent to which GES is achieved. However, the Intermediate Assessment will aim at summarising indicator assessments per theme, in order to link the assessments with OSPAR strategic objectives and potentially with MSFD descriptors. To date (November 2016), OSPAR work has focused on providing regional-scale assessment products; complementary products with higher resolutions for national waters are under consideration but may deliver only for future and not the 2018 MSFD reporting round. OSPAR’s common indicators, and their relation to the MSFD descriptors and revised COM Dec criteria, are shown in Appendix A.
2.4.3 Barcelona Convention/UNEP-MAPAt the 18th Meeting of the Conference of the Parties of the Barcelona Convention held in 2013, an integrated list of Mediterranean Good Environmental Status and related targets, associated with the 11 Operational Objectives and Indicators were agreed. UNEP-MAP’s Integrated Monitoring and Assessment Programme (Decision IG.22/7) (IMAP) was adopted by the 19th COP of the Barcelona Convention and is the framework for monitoring and assessment in the Mediterranean. This sets out 27 Common and Candidate Indicators which are related to the Ecological Objectives for the region. A Quality Status Report (QSR) is planned for 2017, which will contribute towards MSFD monitoring and reporting requirements on a regional level.
2.4.4 Bucharest Convention/Black Sea CommissionIn the Black Sea Commission (BSC) area, only Bulgaria and Romania are EU Member States with the obligation to implement the MSFD.
The MSFD was adopted shortly before the Black Sea Strategic Action Plan (BS SAP) 2009 was approved. The underlying philosophies of the MSFD and the BS SAP are different but complementary. The BS SAP is based on targeting environmental priority problems for the Black Sea; its management targets do not directly state what the environmental status should be as a result of the activities undertaken under the BS SAP. In the framework of the Final Diagnostic Report 2010 (produced by the BSC Permanent Secretariat (PS) with the financial support of the European Environment Agency (EEA)), a summary of the suitability of Black Sea data (of BSIS and external data sources) for calculation of BSC and EEA indicators and MSFD descriptors was prepared. As a result, some indicators were identified for almost all MSFD descriptors (except Descriptor 10). In 2015, the BSC approved regional reporting indicators, to be reported annually to the Black Sea Commission. The indicators are grouped in six tables, according to the thematic focus of Advisory Groups (e.g. Biodiversity, Land-based pollution etc.). Some of the agreed indicators are also quite relevant for the MSFD implementation process.
The BSC regional reporting indicators can be viewed as an alternative to the regional Black Sea Integrated Monitoring and Assessment Programme (BSIMAP), at least on a preliminary basis, until BSIMAP becomes fully functional (it was approved by the BSC in October 2016). Their adoption is a positive step, as they contribute to the harmonisation of the reporting format across countries and could provide the basis for comparing general environmental trends of the Black Sea marine environment. However, more efforts are needed towards harmonisation of methodological approaches in determining GES by descriptors, criteria and/or indicators at the regional level, in order to better align the MSFD and BS SAP 2009 implementation processes in the future.
As a result, at the present moment, Bulgaria and Romania do not consider that the BSC regional reporting indicators provide an adequate basis for MSFD monitoring and assessment and are therefore progressing with the identification of common indicators under the MSFD. In the scope of regional coordination, Romania and Bulgaria have jointly identified a number of common indicators specifically for MSFD which cover some
ABPmer, November 2016, R.2733 | 13

Guidance for Assessments Under Article 8 of the Marine Strategy Framework Directive DG Environment
aspects of most descriptors. They are working towards providing common assessments for these indicators in a regional roof report for the 2018 assessment, which will be aligned as far as possible with the revised COM Dec.
2.5 Relationship between Regional and National Assessments
Member States are expected to deliver the assessment of the environmental status of the four marine regions through regional cooperation and common regional assessment frameworks. It is recognised that Member States may assess additional aspects at a national level for various reasons:
Regional assessments are not ready but national assessments are available (e.g. under the Habitats Directive or Red Lists) which partly address the issue;
There is no plan for a regional assessment of the element because there is no political agreement;
An element is only of national relevance.
It remains, however, the responsibility of Member States to report to the Commission and this can be a mixture of regional and national information.
This raises a question about how the assessment of additional aspects are taken into account when presenting the overall extent to which good environmental status is being achieved.
Relationship between regional and national assessments
Options for how the assessment of additional national-level indicators could be taken into account include:
the national indicator is incorporated into the assessment for each regional assessment unit. This means e.g. that national indicators are no longer visible and regional assessments become very heterogeneous (i.e. no common assessment basis)
the national indicator is presented separately next to the regional assessment result. This means e.g. the national assessment results are visible. Clear and transparent methods for an overall conclusion on the extent to which GES is achieved are necessary and need to be followed. This is achievable where ‘one-out-all-out’ (OOAO) applies but is difficult where more complex integration rules apply.
For further discussion and development: Options for combining national and regional assessments: there may be several
approaches, according to specific descriptors. To be explored through examples. Whether a generalised approach can be agreed for combining national and
regional assessments or whether this needs a case-by-case decision for each element or criterion.
ABPmer, November 2016, R.2733 | 14

Guidance for Assessments Under Article 8 of the Marine Strategy Framework Directive DG Environment
3 Pressure-Related Descriptor Assessments
This section provides guidance for assessments for each pressure-related descriptor (2, 3, 5, 7, 8, 9, 10 and 11) and relates to Part I of the revised COM Dec. Section 4 provides guidance for assessments of state-related descriptors (1, 4 and 6).
Pressure-related assessments need, wherever possible, to assess impacts in a way which relates directly to the ecosystem state elements being assessed under Article 8(1)(a). This is because the assessments under Article 8(1)(a) of species/species groups, habitats and ecosystems including food webs should reflect the range of pressures and impacts to which they are subject and therefore, wherever possible, draw from the assessments of these pressures and impacts made under Article 8(1)(b). As a result, some of the Article 8(1)(b) outcomes need to be directly useful for the state-based assessments. This relates to:
clearly understanding the state assessment elements (species groups/broad habitat types) and the scales at which they are being assessed that will be informed by the pressure/impact assessments; and
considering the needs for targets and measures – where is the impact, over what spatial extent, is it a big enough issue to lead to a need for targets and measures?
ABPmer, November 2016, R.2733 | 15

Guidance for Assessments Under Article 8 of the Marine Strategy Framework Directive DG Environment
3.1 Descriptor 2: Non-Indigenous SpeciesDescriptor 2: Non-indigenous species introduced by human activities are at levels that do not adversely alter the ecosystems.
The primary and secondary criteria for Descriptor 2, and their relationship to the indicators of 2010/477/EU, are shown in Table 1. There are two aspects to Descriptor 2:
Pressure : D2C1 and D2C2 relate to the level of pressure from non-indigenous species (NIS) in terms of the number of NIS newly-introduced species and the abundance and spatial distribution of existing NIS;
Impacts : D2C3 relates to the adverse effects of non-indigenous species on species groups and broad habitat types.
Table 1. Criteria for assessment of non-indigenous species (Descriptor 2)Primary Criteria Relating to:
Secondary Criteria Relating to:
2010/477/EU Criteria or Indicators
Pressure
D2C1 Newly-introduced NIS –
D2C2 Quantification of established NIS (abundance and spatial distribution)
2.1.1
ImpactD2C3 Adverse effects of NIS on species groups and broad habitat types
2.2.2
Degree of IntegrationD2C1 is used to monitor introductions of non-indigenous species. D2C2 (quantification of abundance and spatial distribution of non-indigenous species) should contribute to the assessment of D2C3. D2C3 (impacts of non-indigenous species) should provide the extent of impact for each relevant species group and broad habitat type, contributing to their assessments under Descriptors 1 and 6. The integration therefore stops at criteria level:
D2C1 (primary) – no integration; D2C2 (secondary) – no integration (contributes to the assessment of D2C3); D2C3 (secondary) – no integration (contributes to the assessment of D1 and D6).
3.1.1 Assessment FlowThe assessment flow for Descriptor 2 is described below.
Determine the criteria to address Criterion D2C1 is the only primary criterion and must be addressed
as an EU minimum requirement. Criteria D2C2 and D2C3 are secondary; D2C2 should be used where
NIS, particularly invasive species, are contributing significantly to adverse effects on particular species groups or broad habitat types; D2C3 would consequently be used to assess the effects of these NIS on those species groups and broad habitat types.
Determine the elements for assessmentThe elements for assessment are distinct for each of the criteria:
D2C1 should cover all non-indigenous species that were not known to be present in the area in the previous assessment period, and
ABPmer, November 2016, R.2733 | 16
Step 1

Guidance for Assessments Under Article 8 of the Marine Strategy Framework Directive DG Environment
were newly introduced via human activity into the wild. If it is not known whether a new arrival is due to human activity or natural dispersal from neighbouring areas, it shall be counted under D2C1;
D2C2: a list of established non-indigenous species, particularly invasive non-indigenous species, should be established by Member States through regional or subregional cooperation. Member States should decide which species to assess under D2C2, bearing in mind the link to D2C3. The list should include relevant species on the list of invasive alien species of Union concern adopted in accordance with Article 4(1) of Regulation (EU) No 1143/2014 and should, in particular, include species considered relevant for assessment under D2C3 (those species selected should have significant effects);
D2C3: species groups and broad habitat types (from those assessed under Descriptors 1 and 6) that are at risk from NIS should be selected by Member States through regional or subregional cooperation.
Determine scales and areas for assessmentThe revised COM Dec indicates the following spatial scales for assessment:
D2C1: Subdivisions of each region or subregion, divided where needed by national boundaries;
D2C2 and D2C3: The same spatial scale as used for the corresponding species group or broad habitat type under Descriptor 1.
Assign indicators to criteria Relevant regional indicators that are available should be identified
and allocated to the revised COM Dec criteria and the relevant species groups or broad habitat types (mapping of RSC indicators against the revised COM Dec criteria is provided in Appendix A).
Any remaining gaps should be identified. Use national assessments (taking into account existing assessments e.g. under EU legislation such as WFD, Habitats Directive), where available, pending the development of regionally coordinated assessments.
Additional national indicators for elements that are specific to national waters, if any, can also be incorporated and allocated to the relevant criteria and assessment areas. These need to have a threshold value, where appropriate, and should follow the agreed structure for reporting indicators (MSCG_17-2015-04), pending guidance on reporting requirements from WG DIKE.
Establish threshold values D2C1: The threshold value for the number of new introductions of
non-indigenous species shall be established by Member States through regional or subregional cooperation. The revised COM Dec specifies that the number of new introductions should be minimised and where possible reduced to zero.
D2C2: No threshold values are required. The criterion contributes to the assessment of D2C3.
D2C3: The threshold values for the proportion of each species group and the extent of change in condition of each broad habitat type that indicates they are adversely altered due to NIS shall be established by Member States through regional or subregional cooperation.
Determine if threshold values are achieved D2C1 and D2C3: The outcome the assessment of each criterion
should be determined, as specified in the revised Commission Decision and based on the values achieved compared to the threshold values established in step 5.
D2C2: Status is not assessed, but the criterion assessment feeds into the assessment of D2C3.
ABPmer, November 2016, R.2733 | 17
Step 2
Step 3
Step 4
Step 5
Step 6

Guidance for Assessments Under Article 8 of the Marine Strategy Framework Directive DG Environment
Integrate indicators and criteria The indicators relating to each criterion should be brought together
as described in Section 3.1.2.
3.1.2 Levels and Methods of IntegrationFigure 3 shows the levels of integration and integration methods for Descriptor 2. The figure is representative of a single assessment area. There is no need to aggregate across spatial areas.
Figure 3. Levels and methods of integration for Descriptor 2
The integration methods of Figure 3 are:
Level 1: measurements of individual elements — for example, introductions of non-indigenous species, abundance and impacts of non-indigenous species (likely to be implemented as part of broader biodiversity monitoring, or through targeted ‘hotspot’ monitoring) — are combined to produce information on specific indicators related to non-indigenous species. This level of integration is not addressed in this Guidance.
ABPmer, November 2016, R.2733 | 18
Step 7

Guidance for Assessments Under Article 8 of the Marine Strategy Framework Directive DG Environment
Level 2: For D2C1 there will be only one indicator for D2C1 (number of newly-introduced NIS) covering the scope of the criterion, i.e. the result for the indicator will be the result for the criterion. Therefore there is no need for an integration method for D2C1. The assessment outputs for D2C2 and D2C3 are for each existing NIS species assessed (D2C2) and for each species group and broad habitat type assessed (D2C3). Therefore there is no need for integration of indicators for D2C2 and D2C3.
Level 3: The extent to which GES is achieved for D2 is determined by D2C1. D2C2 informs D2C3, which in turn informs the assessment of D1 and D6. The three criteria are therefore not integrated for D2.
Outstanding issues for D2The role of, and associated assessment methods for, D2C2 and D2C3 in the assessment of D2 and D1 require further clarification.
Missing indicators
In the event of no indicators or data being available to assess the primary criterion (D2C1), this is a gap in the assessment and should be indicated as ‘not assessed’. This means that no statement on the extent to which GES is achieved can be made for D2. It also means that the Member State needs to take immediate action on monitoring and assessment tools to ensure that at the next update under Article 8 MSFD an assessment of the criterion is undertaken.
3.1.3 Visualising Assessment Results Initial outline of assessment outcomes based on revised COM Dec, with illustrative examples. Subject to modification based on finalising 2018 reporting requirements, which will be determined by WG DIKE.
The assessment output for Descriptor 2 is expressed for each criterion assessed, for each assessment area. For D2C2 and D2C3, results are expressed for each species assessed, and/or each species group or broad habitat type.
D2C1
Number of new introductions of NIS from human activity in the last assessment period (6 years [e.g. 2011–2016]) (to country X’s national waters): 1.
List of species newly introduced:o Species x (Latin name, common name)
D2C2
List of established non-indigenous species:o Mnemiopsis leidyi (sea walnut or warty comb jelly)o Rapana venosa (veined rapa whelk)
Quantification of established non-indigenous species – see Table 2.Table 2. Initial outline and illustrative example for presenting the assessment
outputs for D2C2
ABPmer, November 2016, R.2733 | 19

Guidance for Assessments Under Article 8 of the Marine Strategy Framework Directive DG Environment
Assessment area (subdivision)
Abundance(numbers, biomass or extent)
Spatial distribution
Trends in abundance and/or distribution (increase/ stable/ decrease)
Species: Mnemiopsis leidyie.g. Coastal x tonnes Distribution
mapStable
Shelf x tonnes Distribution map
Decreasing
Open sea x tonnes Distribution map
Stable
Species: Rapana venosae.g. Coastal 1
x Distribution map
Increase
Coastal 2 x Distribution map
Stable
Shelf x Distribution map
Stable
D2C3
Adverse effects of NIS on species groups and habitat types – see Table 3 and Table 4.
Table 3. Initial outline and illustrative example for presenting the assessment outputs for D2C3 for habitat types
Assessment area Broad habitat type
Extent adversely affected by NIS (proportion of species group or spatial extent of broad habitat type in km²)
Trend in adverse effect(increase/ stable/ decrease)
e.g.Coastal
Infralittoral rock and biogenic reef
x km² Increase
Coastal pelagic habitat
x km² Stable
Shelf Circalittoral sand x km² DecreaseCircalittoral mud x km² DecreaseShelf pelagic habitat x km² Stable
Table 4. Initial outline and illustrative example for presenting the assessment outputs for D2C3 for species groups
Assessment area Species group
Extent adversely affected by NIS (proportion of species group)
Trend in adverse effect(increasing/ stable/ decreasing)
e.g.Region or subregion
Grazing birds (e.g.) 1:3 or 25% IncreaseWading birds 0 StablePelagic-feeding birds 1:9 or 10% StableEtc (for relevant species groups)
In addition to the presentation of results by criteria, maps showing distribution may be useful, and a summary can be provided in graphical format (Figure 4) as the ‘satellite’ for Descriptor 2 in the scheme for integrated presentation of assessment results (pizza-satellite scheme).
ABPmer, November 2016, R.2733 | 20
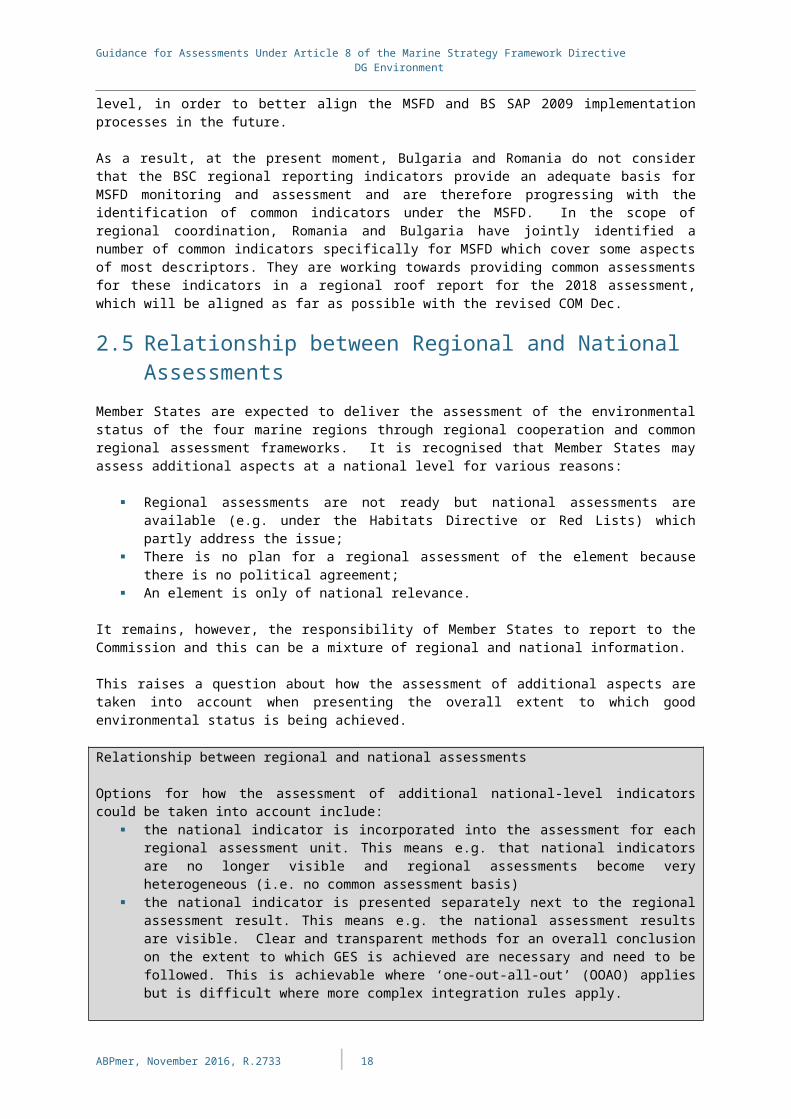
Guidance for Assessments Under Article 8 of the Marine Strategy Framework Directive DG Environment
Good Not good
Figure 4. Illustrative example of a visual summary of assessment output for non-indigenous species, based only on D2C1 (Descriptor 2 ‘satellite’)
ABPmer, November 2016, R.2733 | 21
1 new NIS introduced in assessment period

Guidance for Assessments Under Article 8 of the Marine Strategy Framework Directive DG Environment
3.2 Descriptor 3: Commercially Exploited Fish and Shellfish
Descriptor 3: Populations of all commercially exploited fish and shellfish are within safe biological limits, exhibiting a population age and size distribution that is indicative of a healthy stock.
The criteria for Descriptor 3, and their relationship to the indicators of 2010/477/EU are shown in Table 5. There are two aspects to the criteria under Descriptor 3:
Pressure/Impact : D3C1 relates to the level of fishing pressure (mortality) per commercial fish or shellfish population (stock). Note that the Decision does not provide a criterion for the ‘pressure’ as a whole (i.e. the total catch of all individuals of commercial and non-commercial species in the assessment area). As fisheries data are typically collected per species, they can already be assigned to D3C1 (and D1C1 for incidental by-catch).
Status : D3C2 and D3C3 relate to the state of commercial species. They are state-based criteria but are included under the pressure descriptors (Part I of revised COM Dec) for clarity reasons.
Species should be assessed, where appropriate, at the population level. For commercial fish and shellfish species, the assessments under the CFP should be used, wherever possible, to ensure the same assessments are used for CFP and MSFD purposes. In practice, this means population-level assessments are the CFP ‘stock assessments’11.Table 5. Criteria for assessment of commercially exploited fish and shellfish
(Descriptor 3)Primary Criteria Relating to:
Secondary Criteria Relating to:
2010/477/EU Criteria or Indicators
Impact D3C1 Fishing mortality (F) 3.1
StatusD3C2 Spawning stock biomass (SSB) 3.2D3C3 Age and size distribution 3.3
Degree of IntegrationAll criteria should be within the specified levels or established threshold values. The envisaged degree of integration across criteria is as follows:
Commercially exploited species: D3C1, D3C2 and D3C3 are primary and are integrated for each population (stock).
3.2.1 Assessment FlowThe assessment flow for Descriptor 3 is described below.
Determine the criteria to address All criteria are primary and should be addressed. D3C3 may not be available for use for all populations for the 2018
review of the initial assessment and determination of GES.11 The revised COM Dec uses the terminology ‘populations’ as in the descriptor. Point 3 under
‘Specifications and standardised methods for monitoring and assessment’ of the revised COM Dec clarifies that the term ‘populations’ shall be understood as the term ‘stocks’ within the meaning of Regulation (EU) No 1380/2013’.
ABPmer, November 2016, R.2733 | 22

Guidance for Assessments Under Article 8 of the Marine Strategy Framework Directive DG Environment
Determine the elements for assessment A list of commercially exploited species in each assessment area
should be drawn up by Member States through regional or subregional cooperation. This shall take into account the points in ‘Specifications and standardised methods for monitoring and assessment’ in the revised COM Dec. The purpose of these specifications is to provide a consistent methodology for defining the list in each region, and to result in a list which reflects the most important populations of the region whilst avoiding undue effort on populations that are caught in small quantities (and potentially have limited data). Based on ICES advice, it is recommended that the list should cover a very high proportion of the landings (e.g. at least 90 %) in weight for the previous six-year assessment period in the FAO FishStat database (ICES, 2014a). Previously important species (e.g. European eel) should not be excluded on the basis of minimal catches due to stock status.
Non-indigenous species that are commercially exploited shall be excluded.
Determine scales and areas for assessmentThe revised COM Dec indicates the following spatial scales for assessment:
D3C1, D3C2, D3C3: Populations of each species are assessed at ecologically relevant scales within each region or subregion, as established by appropriate scientific bodies as referred to in Article 26 of Regulation (EU) No 1380/2013, based on specified aggregations of ICES areas and General Fisheries Commission for the Mediterranean (GFCM) geographical sub-areas and Food and Agriculture Organisation (FAO) fishing areas for the Macaronesian biogeographic region, i.e. the stock assessment areas used under CFP.
The assessment for the purposes of the MSFD should be done on the basis of the marine region or subregion, or further subdivision if appropriate, presenting the status of each population (stock) that is present in that region or subregion. If several stocks of a single species are present in an assessment area, each should be presented separately. If the stock assessment areas do not align perfectly with the MSFD regions or subregions, each stock assessment area should be either:
Allocated to one or the other region or subregion (for example, where the majority of the area falls within one region or subregion);
Considered in the assessment of both regions or subregions that it overlaps.
ICES (2016_D312) advised that widely distributed stocks (that fall within several subregions or regions) should be considered in each region or subregion in which they occur, i.e. a single stock assessment is assigned to both/all relevant subregions or regions for the purposes of the D3 assessment.Assign indicators to criteria
The available information on stock assessment and advice provided by ICES, the Scientific, Technical and Economic Committee for
12 Citations to be updated to a,b,c etc. in final version.
ABPmer, November 2016, R.2733 | 23
Step 1
Step 2
Step 3

Guidance for Assessments Under Article 8 of the Marine Strategy Framework Directive DG Environment
Fisheries (STECF), GFCM and International Commission for the Conservation of Atlantic Tunas (ICCAT) should be used.
This should be supplemented by national stock assessment outputs and monitoring where appropriate (i.e. nationally-important species that are not assessed through regional or international mechanisms).
Estimates of fishing mortality (F) relate to D3C1, estimates of spawning stock biomass (SSB) relate to D3C2, and estimates of age and size distribution relate to D3C3.
Where quantitative stock assessments yielding values for F or SSB are not available, other variables or indices may be used (see point 5 of the ‘Specifications and standardised methods for monitoring and assessment’ in the revised COM Dec).
Any remaining gaps should addressed as soon as possible in the next implementation cycle.
Mapping of RSC indicators against the revised COM Dec criteria is provided in Appendix A.
Establish levels and thresholds D3C1: Fishing mortality (or other variable) is at or below levels
which can produce MSY. For stocks managed under a multiannual plan according to Article 9 of Regulation (EU) No 1380/2013, in situations of mixed fisheries, the levels for F shall be in accordance with the relevant multiannual plan. For the Mediterranean and Black Seas, appropriate proxies may be used. Where other variables are used (such as the catch/biomass index), an appropriate method for trend analysis shall be adopted to set the level.
D3C2: Spawning stock biomass (or other biomass-related index) is at or above levels capable of producing MSY. For stocks managed under a multiannual plan according to Article 9 of Regulation (EU) No 1380/2013, in situations of mixed fisheries, the level for SSB shall be in accordance with the relevant multiannual plan. For the Mediterranean and Black Seas, appropriate proxies may be used. Where biomass indices are used (such as catch per unit effort or survey abundance index), an appropriate method for trend analysis shall be adopted to set the level.
D3C3: threshold values should be established by Member States through regional or subregional cooperation for each indicator for each population. ICES are currently (2016/2017) developing advice on this criterion.
Determine if levels and threshold values are achieved The status of each population (stock) for each criterion should be
determined, based on the current values compared to the levels and threshold values established in step 5.
These values should be obtained from the existing stock assessment outputs, and brought together for the MSFD assessment.
Where data are not available to set levels or thresholds and/or to assess against them, the population is ‘not assessed’.
Integrate indicators and criteria The status of each population (stock) should be determined, based
on the integration methods in Section 3.2.2. The number of populations that are ‘not assessed’ must also be
expressed in the outcome.
ABPmer, November 2016, R.2733 | 24
Step 4
Step 5
Step 6
Step 7

Guidance for Assessments Under Article 8 of the Marine Strategy Framework Directive DG Environment
3.2.2 Levels and Methods of IntegrationFigure 5 shows the levels of integration and different integration methods for Descriptor 3. The figure is representative of a single assessment area (region or subregion), for which the outputs of the assessment can be presented. There is no need to aggregate across spatial areas.
Figure 5. Levels and methods of integration for Descriptor 3
The integration methods of Figure 5 are:
Level 1: measurements of individual elements — for example, catches of different species by different Member States, over time, length distribution of catches, length and maturity information from research surveys — are combined through stock assessments and other analyses to produce information on fishing mortality, stock status and age/size distribution (here named ‘indicators’). This level of integration requires detailed technical consideration and is not addressed in these guidelines.
Level 2: The indicators are integrated to each criterion for each stock. The integration method depends on the criterion.
o For D3C1 and D3C2 there is likely to be only one indicator per stock per criterion, therefore the result for the indicator will be the result for the criterion.
o For D3C3, if more than one indicator is used for a stock, there will need to be an integration method. See box below.
Level 3: Criteria are brought together for each stock. The integration method is OOAO. This means that all relevant indicators/criteria must be within threshold values for the stock to be in good status. In the absence of operational indicators and associated results for D3C3, the assessment for D3 in 2018 is likely to be
ABPmer, November 2016, R.2733 | 25

Guidance for Assessments Under Article 8 of the Marine Strategy Framework Directive DG Environment
based on D3C1 and D3C2 only for most stocks, using OOAO. The integration figure therefore shows some stocks with D3C3 information, and one stock without.
Level 4: The overall status of each stock is presented; the stocks are not integrated for Descriptor 3. The number of stocks (populations) that are not assessed is also presented.
Integration methods for D3Integration methods need to take account of the lack of data for criterion D3C3. The integration method for D3C3 (if more than one indicator is used) still needs to be determined in conjunction with finalising and operationalising the assessment tools for D3C3 based on forthcoming ICES advice. Until such an integration method is agreed, this Guidance recommends averaging of normalised values (indicator value divided by the threshold value, where the threshold represents the minimum desirable value and thus values greater than 1 represent the threshold value as being met and an average of greater than 1 represents good status for the criterion). Where the threshold is a maximum permitted value, the inverse should be used (threshold value divided by the indicator value).
Missing indicators
If quantitative stock assessments providing values and levels for F and SSB are not available for a stock, other variables such as the catch/biomass ratio (in place of F) or an abundance index (in place of SSB) may be used. In these cases, an appropriate method for trend analysis can be adopted (e.g. current value compared to long-term average) for assessment purposes (i.e. to set a (target) level).
If no information for a stock is available (neither from quantitative assessments, nor other variables from alternative methods as outlined above), the stock should be reported as ‘not assessed’.
If information on a particular criterion is not available for a stock:
If information for D3C1 is not available, the stock cannot be classified as ‘good status’ (ICES, 2016_D3) and overall status of the stock should be expressed as ‘not assessed’;
If information for D3C2 is not available, the stock cannot be classified as ‘good status’ (ICES, 2016_D3) and status should be expressed as ‘not assessed’;
If information for D3C3 is not available, but information on D3C1 and D3C2 is available, the status of the stock should follow the classification according to D3C1 and D3C2, with D3C3 reported as ‘not assessed’. This is the proposed approach for the 2018 implementation cycle, due to the large number of stocks for which information on D3C3 is not yet available. The recommended approach may differ in subsequent cycles, when further information should be available.
3.2.3 Visualising Assessment Results for Descriptor 3Initial outline of assessment outcomes based on revised COM Dec, with illustrative examples. Subject to modification based on finalising 2018 reporting requirements, which will be determined by WG DIKE.
The assessment output for Descriptor 3 is presented for each region or subregion, per population (stock). The assessment output can be presented as shown in Table 6. The assessment output is presented as the number of assessed stocks meeting (target) levels or threshold values, the number of assessed stocks not achieving the (target) levels or threshold values and the number of stocks not assessed. The same information is presented in an alternative, simplified way in Table 7.
ABPmer, November 2016, R.2733 | 26

Guidance for Assessments Under Article 8 of the Marine Strategy Framework Directive DG Environment
Table 6. Initial outline and illustrative example for presenting the assessment output for Descriptor 3 (population (stock) status) for the region or subregion
Stock F or alternative variable
SSB or alternative variable
Age/size2 Overall status
Target level1
Value Target level
Value Threshold value
Value
Assessed populations3
Stock 14
0.1 0.095 120,000 80,000 0.6 0.4 Not good
Stock 2
0.4 0.6 30,000 45,000 Not set No data
Not good, D3C3 not assessed
Stock 3
0.25 0.2 2,500 3,200 Not set 42 cm Good, D3C3 not assessed
Stock 4
0.1 1.0 4,000 2,000 Not set No data
Not good
Populations not assessedStock 5
0.3 0.25 Not set No data Not set No data
Not assessed
Stock 6
Not set No data Not set No data Not set No data
Not assessed
Stock 7
Not set No data Not set No data Not set No data
Not assessed
Overall status of commercially exploited populations in the assessment area:o Good: 1 out of 4 assessed stocks (25%) (for the 1 stock at GES, D3C3 is not assessed in 2018).o Not good: 3 out of 4 (75%) assessed stocks.
Number of populations not assessed: 3.Notes:
1. F target level may correspond to Fmsy, or alternative proxy such as Fpa, F0.1, or alternative variable such as catch/biomass ratio, according to the stock.
2. Where more than one indicator is used for D3C3 for a population, either the result of each indicator can be shown separately, or the average of the normalised values can be shown.
3. Populations must have information on at least D3C1 and D3C2 to be assessed. For 2018, populations that do not have information or thresholds for D3C3 can be assessed on the basis of D3C1 and D3C2.
4. Populations should be identified with the species name, and the areas that the stock assessment relates to, e.g. Cod in IV, VIId and IIIA; Herring in Subdivisions 22–24.
Table 7. Illustrative example of a simplified assessment output for Descriptor 3Population (stock)
D3C1 D3C2 D3C3 Overall status
Stock 1 Good Not good Not good Not goodStock 2 Not good Good No data Not good, D3C3 not
assessedStock 3 Good Good No data Good, D3C3 not assessedStock 4 Not good Not good No data Not goodStock 5 Good No data No data Not assessedStock 6 No data No data No data Not assessedStock 7 No data No data No data Not assessed
Overall status of commercially exploited populations in the assessment area:o Good: 1 out of 4 assessed stocks (25%) (for the 1 stock at GES, D3C3 is not assessed in 2018).o Not good: 3 out of 4 (75%) assessed stocks.
Number of populations not assessed: 3.
In addition to the presentation of results by criteria and overall for individual populations, a summary can be provided in graphical format (Figure 6) as the ‘satellite’ for Descriptor 3 in the scheme for integrated presentation of assessment results (pizza-satellite scheme).
ABPmer, November 2016, R.2733 | 27

Guidance for Assessments Under Article 8 of the Marine Strategy Framework Directive DG Environment
1
3
3
Good Not good Not assessed
Figure 6. Illustrative example of a visual summary of assessment output for commercially exploited stocks (Descriptor 3 ‘satellite’)
Note: Numbers on the figure show the number of populations (stocks) in each status category
ABPmer, November 2016, R.2733 | 28

Guidance for Assessments Under Article 8 of the Marine Strategy Framework Directive DG Environment
3.3 Descriptor 5: Eutrophication Descriptor 5: Human-induced eutrophication is minimised, especially adverse effects thereof, such as losses in biodiversity, ecosystem degradation, harmful algae blooms and oxygen deficiency in bottom waters.
The primary and secondary criteria for Descriptor 5, and their relationship to the indicators of 2010/477/EU are shown in Table 8. There are three aspects to Descriptor 5:
Pressure : D5C1 relates to the level of the pressure (nutrients) in the marine environment;
Effects : D5C2–8 address the effects of eutrophication in the water column and on the seabed.
Table 8. Criteria for assessment of eutrophication (Descriptor 5)
Primary Criteria* Relating to:
Secondary Criteria* Relating to:
2010/477/EU Criteria or Indicators
Comments
Pressure D5C1 Nutrients in the water column 5.1.1
Impacts
D5C2 Chlorophyll a 5.2.1
D5C3 Harmful algal blooms 5.2.4D5C4 Photic limit 5.2.2
D5C5 Dissolved oxygen in the bottom of the water column
5.3.2May be substituted by D5C8
D5C6 Opportunistic macroalgae of benthic habitats
5.2.3
D5C7 Macrophyte communities of benthic habitats
5.3.1
D5C8 Macrofaunal communities of benthic habitats
-- May substitute D5C5
When setting up the assessment for Descriptor 5 at a regional level, the cause-and-effect relationship should be established. The link between the pressure (enrichment of nutrients in the water column) and its effects on the accelerated growth of phytoplankton and on macrophyte communities, resulting in undesirable disturbance to the balance of organisms present and on water quality, is necessary. Additionally these effects can lead to oxygen depletion in waters near the seabed and consequent adverse effects on macrofauna communities. Identifying the causal relationship can be done at different stages of the preparation for the assessment. For example, it may be shown at the point of choosing the set of indicators/elements used in the assessment (as is done in the HELCOM approach); or may be structured in the assessment tool, at the criteria-level or groupings of criteria. Existing assessment frameworks distinguish between causes (nutrient concentrations), direct effects and indirect effects of nutrient enrichment.
The revised Commission Decision indicates that the effect criteria are related to effects in the water column and/or on the seabed, and thus contribute to the assessments of habitats under Descriptors 1 and 6. Regionally- or subregionally-agreed approaches to
ABPmer, November 2016, R.2733 | 29

Guidance for Assessments Under Article 8 of the Marine Strategy Framework Directive DG Environment
assessment and integration may choose to group the criteria into direct effects and indirect effects as an additional step in the integration.
The revised COM Dec requires Descriptor 5 to be implemented in accordance with assessments under the Water Framework Directive (WFD) (Directive 2000/60/EC) in WFD coastal waters (i.e. the integration follows the WFD methods). It requires Member States to agree at regional or subregional level the use of secondary criteria beyond coastal waters, and to establish threshold values for the criteria. Beyond coastal waters, these need to be consistent with those used in coastal waters under WFD. For integration methods beyond coastal waters, these should be agreed at Union level as far as possible, but at least at regional or subregional level.
Tools for the assessment of eutrophication have been developed by the RSCs and, while they differ in detail, there is evidence that they may produce consistent results in the overall context of how the tools are used to support management decisions.Degree of integrationEach assessed criterion should be within threshold values. The envisaged degree of integration across criteria is as follows:
All criteria used are integrated to a judgement on status for Descriptor 5 on eutrophication;
o For coastal waters, the integration is in accordance with the requirements of the WFD13;
o Beyond coastal waters, the integration should follow the approach in Section 3.3.2.
In addition, results for individual criteria are also presented separately.
3.3.1 Assessment FlowThe assessment flow for Descriptor 5 is described below.
Determine the criteria to addressThe criteria to be addressed differ in coastal waters and beyond coastal waters.
In coastal waters, the criteria that relate to the requirements of the WFD must be applied as primary criteria.
Beyond coastal waters, the primary criteria D5C1, D5C2 and D5C5 must be assessed, although D5C5 may be substituted by D5C8. The primary criteria may be complemented by secondary criteria. Whether to use any of the secondary criteria shall be agreed at regional or subregional level.
Determine the elements for assessmentThe elements for assessment are determined principally by the criteria (see Step 1). In coastal waters, the elements should be applied as under the WFD.
For D5C1, several criteria elements are specified (dissolved inorganic nitrogen (DIN), total nitrogen (TN), dissolved inorganic phosphorus (DIP), total phosphorus (TP)). In coastal waters, these elements shall be used in accordance with WFD requirements. Beyond coastal waters, Member States may decide at regional or subregional level not to use one or several of those elements. As a minimum, nitrogen and phosphorus should be assessed either as total or as dissolved inorganic elements.
13 Guidance documents published in the context of the Common Implementation Strategy for Directive 2000/60/EC may be relevant in this assessment (e.g. ‘No 13 – Overall Approach to the classification of Ecological Status and Ecological Potential’ and ‘No 23 – Eutrophication Assessment in the Context of European Water Policies’.
ABPmer, November 2016, R.2733 | 30
Step 1
Step 2

Guidance for Assessments Under Article 8 of the Marine Strategy Framework Directive DG Environment
Determine assessment scales and areas for assessmentThe revised COM Dec indicates the following spatial scales for assessment:
Coastal waters: the water bodies as used under Directive 2000/60/EC. This will facilitate the reuse of information from WFD;
Beyond coastal waters, subdivisions of the region or subregion, divided where needed by national boundaries. Salinity gradients may be considered when determining the subdivisions.
It is recommended to use the same assessment areas across all criteria (rather than considering different criteria at different scales), although different criteria may be considered within and beyond coastal waters.Assign indicators to criteria
Relevant regional indicators that are available should be identified and allocated to the revised COM Dec criteria and assessment areas (mapping of RSC indicators against the revised COM Dec criteria is provided in Appendix A).
Any remaining gaps should be identified. Use national criteria assessments (taking into account existing assessments e.g. under EU legislation such as WFD), where available, pending the development of regional indicators or criteria.
Additional national indicators for elements that are specific to national waters, if any, can also be incorporated and allocated to the relevant criteria and assessment areas. These need to have a threshold value, where appropriate, and should follow the agreed structure for reporting indicators (MSCG_17-2015-04), pending guidance on reporting requirements from WG DIKE.
Establish threshold values In coastal waters, the threshold values for most criteria are the
values set in accordance with the WFD. For criterion D5C3, Member States shall establish threshold values through regional or subregional cooperation.
Beyond coastal waters, Member States shall establish threshold values through regional or subregional cooperation. The threshold values shall be consistent with those for coastal waters under the WFD.
Determine if threshold values are achieved The status of each element (at indicator level in Figure 7) should
be determined, based on the measured values compared to the threshold values established in step 5.
Integrate indicators and criteriaIndicators should be integrated to criteria, and criteria should be integrated to indicate overall eutrophication status for each assessment area.
For coastal waters: The status of each coastal assessment area should be determined
on the basis of the requirements of the WFD.Beyond coastal waters:
The status of each assessment area should be determined, based on the integration methods in Section 3.3.2. These methods shall be agreed at Union level, taking into account regional or subregional specificities.
ABPmer, November 2016, R.2733 | 31
Step 3
Step 4
Step 5
Step 6
Step 7

Guidance for Assessments Under Article 8 of the Marine Strategy Framework Directive DG Environment
Criteria also need to be integrated to provide information on the extent of impact on the water column and on the seabed, as these are important outputs for the assessments under D1 and D6 in some areas.
3.3.2 Levels and Methods of IntegrationFigure 7 shows levels of integration and integration methods for Descriptor 5 for areas beyond coastal waters (areas in WFD coastal water bodies follow the integration rules under the WFD). The figure is representative of a single assessment area, for which the assessment results can be presented for the Descriptor. There is no need to aggregate across spatial areas.
Figure 7. Levels and methods of integration for Descriptor 5 (beyond coastal waters)
The integration methods of Figure 7 are (for those criteria that are addressed):
Level 1: Measurements of individual elements (for example, the concentration of chlorophyll-a, different forms of nitrogen or phosphorus, at different sample stations, in different time periods) are combined into a single indicator, such as dissolved inorganic nitrogen (DIN), dissolved inorganic phosphorus (DIP) etc. Integration at this level follows established methods under WFD and RSCs; it requires technical consideration and is not addressed in this Guidance.
Level 2: The results for various elements (indicators) are integrated to form a judgement of the status for each criterion. Where there is more than one element or indicator used per criterion, an integration method will be required. The
ABPmer, November 2016, R.2733 | 32

Guidance for Assessments Under Article 8 of the Marine Strategy Framework Directive DG Environment
integration method is to be agreed at Union level, taking into account regional and subregional specificities. See box below.
Level 3: The criteria are integrated to the overall status of D5. The integration method is to be agreed at Union level where possible, but at least at regional or subregional level. Some criteria also provide information on the extent of impact on the water column and on the seabed, which contribute to the assessments under D1 and D6 in some areas (see box below).
In cases where elevated nutrient concentrations do not result in eutrophication effects, status for Descriptor 5 may be considered good, but measures may still be required where the increased nutrient enrichment in these areas contributes to eutrophication problems elsewhere.
Integration methods for D5Integration methods are well advanced. The methods presented at WG GES 15 seem to accommodate both the OSPAR and HELCOM systems. There was however no agreement about a common approach nor about the final integration between criteria (groups).
The revised COM Dec provides for integration methods for Descriptor 5 beyond coastal waters to be agreed at EU level as far as possible, but at least at regional or subregional level. Until such integration methods are agreed, this Guidance recommends the following:
Level 2: To use the currently-agreed regional method (see below). This may use, for example, weighted averaging, scoring or conditional rules, but should avoid expert judgement.
Level 3: To use the currently-agreed regional method (see below).
In using regional approaches, consideration should be given to progressing towards the grouping of criteria in the Decision according to nutrients, water column and seabed, which deviates from existing assessment frameworks. The use of WFD integration methods in coastal areas based on MSFD criteria and linking WFD coastal areas with MSFD offshore water in the assessment may require further technical clarification. Integration rules exist for the three biological quality components phytoplankton, macrophytes and macrozoobenthos. These components do not match the primary criteria. The WFD decision tree does not include methods for integrating chemical parameters (nutrients and oxygen), which are only supporting parameters in WFD assessment — see WFD Guidance No. 23 and latest discussions of nutrient expert group of Ecostat in November 2016, which concluded that such rules still need to be developed.
Outputs contributing to D1 and D6The methodologies for Descriptor 5 criteria to contribute to assessments of pelagic and benthic habitats under Descriptors 1 and 6 need to be developed at Union level. This concerns:
D5C2, D5C3 and D5C4 (when used) contribute to the assessment of pelagic habitats under Descriptor 1, in terms of the distribution and an estimate of the extent of the area that is subject to eutrophication in the water column;
D5C4, D5C5, D5C6, D5C7 and D5C8 (when used) contribute to the assessment of benthic habitats under Descriptors 1 and 6, in terms of the distribution and an estimate of the extent of the area that is subject to eutrophication on the seabed.
Existing assessment frameworks include:
Framework Integration ApproachEutrophicationWFD OOAOHELCOM HEAT:
ABPmer, November 2016, R.2733 | 33

Guidance for Assessments Under Article 8 of the Marine Strategy Framework Directive DG Environment
Levels 2 and 3: Averaging or weighted averaging of indicators of direct effects of nutrient enrichment and those of indirect effects, followed by OOAO between the criteria groups of nutrients, direct effects and indirect effects.
OSPAR Common Procedure:Levels 3: OOAO between criteria (harmonised assessment parameters) and criteria groups (nutrients, direct effects and indirect effects) to form an initial assessment and with the possibility of an appraisal of all relevant information to produce the final assessment result.
UNEP-MAP TRIX.Black Sea BEAST (being tested) – derived from HELCOM approach.
Missing indicatorsIf a primary criterion cannot be assessed due to a lack of data then the resultant eutrophication assessment cannot be assigned a status (i.e. it is ‘not assessed’). It also means that the Member State needs to take immediate action on monitoring and assessment tools to ensure that at the next update under Article 8 MSFD an assessment of the criterion is undertaken. This does not apply where certain aspects have been scoped out on the basis of a risk assessment (e.g. areas of low risk beyond coastal waters).
3.3.3 Visualising Assessment ResultsInitial outline of assessment outcomes based on revised COM Dec, with illustrative examples. Subject to modification based on finalising 2018 reporting requirements, which will be determined by WG DIKE.
For each area assessed, the values achieved for each criterion used should be presented, and an estimate of the extent of national waters and/or the region or subregion over which the threshold values set have been achieved. An example is provided below in Table 9. A map showing the outcome of the assessment spatially is also likely to be a useful communication tool.
Table 9 Initial outline and illustrative example for presenting the assessment output for Descriptor 5, for a single assessment area
Criterion Threshold value Value achieved Threshold achieved?
D5C1DIN: x μmol/l y μmol/l YesTN: x μmol/l y μmol/l YesDIP: x μmol/l y μmol/l NoTP: x μmol/l y μmol/l Yes
D5C2 (Chl-a) x μg/l y μg/l YesD5C3 Not assessed Not assessedD5C4 Not assessed Not assessedD5C5 (O2) x mg/l y mg/l YesD5C6 Not assessed Not assessedD5C7 Not assessed Not assessedD5C8 Not assessed Not assessed
Overall eutrophication status of the assessment area: Good
In addition to the presentation of results by criteria, a summary can be provided in graphical format (Figure 8) as the ‘satellite’ for Descriptor 5 in the scheme for integrated presentation of assessment results (pizza-satellite scheme). This may be illustrated as a single outcome per assessment area (Figure 8(a)), and as the percentage of the region or subregion, or of national waters that is and is not subject to eutrophication (Figure 8(b)).
The format of the outputs to contribute to assessments of pelagic and benthic habitats under Descriptors 1 and 6 are not addressed in detail here, but could include spatial
ABPmer, November 2016, R.2733 | 34

Guidance for Assessments Under Article 8 of the Marine Strategy Framework Directive DG Environment
maps showing the areas where relevant criteria have/have not met the threshold values, which can be further analysed for the assessments of pelagic and benthic habitats.
(a) Single outcome per assessment area (b) Percentage of (sub)region (or national) waters subject to eutrophication
Good Not good
95%
5%
Good Not good
Figure 8. Illustrative example of a visual summary of assessment output for eutrophication (Descriptor 5 ‘satellite’)
ABPmer, November 2016, R.2733 | 35

Guidance for Assessments Under Article 8 of the Marine Strategy Framework Directive DG Environment
3.4 Descriptor 6: Sea-floor Integrity (Part 1: Physical Loss and Disturbance)
Descriptor 6: Sea-floor integrity is at a level that ensures that the structure and functions of the ecosystems are safeguarded and benthic ecosystems, in particular, are not adversely affected.
The criteria linked to Descriptor 6, and their relationship to the indicators of Commission Decision 2010/477/EU are shown in Table 10. These criteria address only the physical disturbance and physical loss (and associated impacts) aspects of assessing seabed habitats or sea-floor integrity. They provide an important component of assessing seabed habitats, due to the relative importance (spatial extent) of these pressures on the seabed across Europe.
See also Benthic Habitats (Descriptors 1 and 6) (Section 4.8) for details of benthic broad habitat types (which are based on EUNIS level 2 types) and how to assess seabed habitats as a whole.
Table 10. Criteria for assessment of sea-floor integrity (Descriptor 6)Primary Criteria Relating to:
Secondary Criteria Relating to:
2010/477/EU Criteria or Indicators
Pressure
D6C1 Physical loss of the seabed (spatial extent and distribution)
–
D6C2 Physical disturbance to the seabed (spatial extent and distribution)
6.1
ImpactD6C3 Spatial extent of adverse effects from physical disturbance on benthic broad habitats
1.66.1.26.2
Physical loss defines a permanent change to the seabed which has lasted or is expected to last for a period of two reporting cycles (12 years) or more. This includes changes in substrate from the natural seabed substrate to an anthropogenic substrate (e.g. made of concrete or metal) or a man-made structure on the coast or offshore (e.g. land claim, artificial island). It is technically possible that such modifications can be reversed and, in some circumstances, anticipated that this will happen over time (e.g. through decommissioning of oil platforms and wind turbines).
Physical disturbance is a change to the seabed which can be restored if the activity causing the disturbance pressure ceases.Degree of IntegrationThe three primary criteria for Descriptor 6 are focussed on assessing the scale of physical disturbance and associated impacts and on physical loss; they are not intended to lead directly to an assessment of status for D6, but to produce outputs for use in the assessment of seabed habitats/sea-floor integrity under the criteria D6C4 and D6C5 (see Section 4.8).
Consequently, D6C1 and D6C2 do not have threshold values, but are used to assess other criteria. D6C1 is used to assess habitat loss per habitat under D6C4 (habitat extent (loss)), and to assess D7C1 (spatial extent and distribution of permanent alteration of hydrographical conditions). D6C2 is used to assess impacts on broad habitat types under
ABPmer, November 2016, R.2733 | 36

Guidance for Assessments Under Article 8 of the Marine Strategy Framework Directive DG Environment
D6C3. D6C3 requires threshold values to define adverse effect per habitat type, and itself contributes to the assessment of D6C5.
Therefore no integration across the criteria is required.
3.4.1 Assessment flowThe assessment flow for Descriptor 6 criteria is described below.
Determine the criteria to addressAll criteria are primary and therefore all must be assessed.
Determine the elements for assessmentThe revised COM Dec specifies the elements for assessment as:
D6C1 and D6C2: the seabed, including intertidal areas; D6C3: benthic broad habitat types (see Descriptor 1 Habitats
(Benthic), Section4.8, or other habitat types, as used under Descriptors 1 and 6.
All benthic broad habitat types should be addressed under D6C3, but if there is no activity in certain areas (including infrastructure changes) that could lead to either pressure, the outcome can be assessed as zero.Determine scales and areas for assessmentThe revised COM Dec indicates the following spatial scales for assessment:
The same assessment scales and areas used for the assessment of the benthic broad benthic habitat types under Descriptors 1 and 6.
Assign indicators to criteria Relevant regional indicators that are available should be
identified and allocated to the revised COM Dec criteria and the relevant benthic broad habitat types (mapping of RSC indicators against the revised COM Dec criteria is provided in Appendix A).
Any remaining gaps should be identified. Use national assessments (taking into account existing assessments e.g. under EU legislation such as WFD, Habitats Directive), where available, pending the development of regionally coordinated assessments.
Additional national indictors for elements that are specific to national waters, if any, can also be incorporated and allocated to the relevant criteria and assessment areas. These need to have a threshold value, where appropriate, and should follow the agreed structure for reporting indicators (MSCG_17-2015-04), pending guidance on reporting requirements from WG DIKE.
Establish threshold values D6C1: No threshold values are required. D6C2: No threshold values are required. D6C3: Threshold values should be established by Member States
through regional or subregional cooperation for the adverse effects by physical disturbance on each habitat type14.
ABPmer, November 2016, R.2733 | 37
Step 1
Step 2
Step 3
Step 4
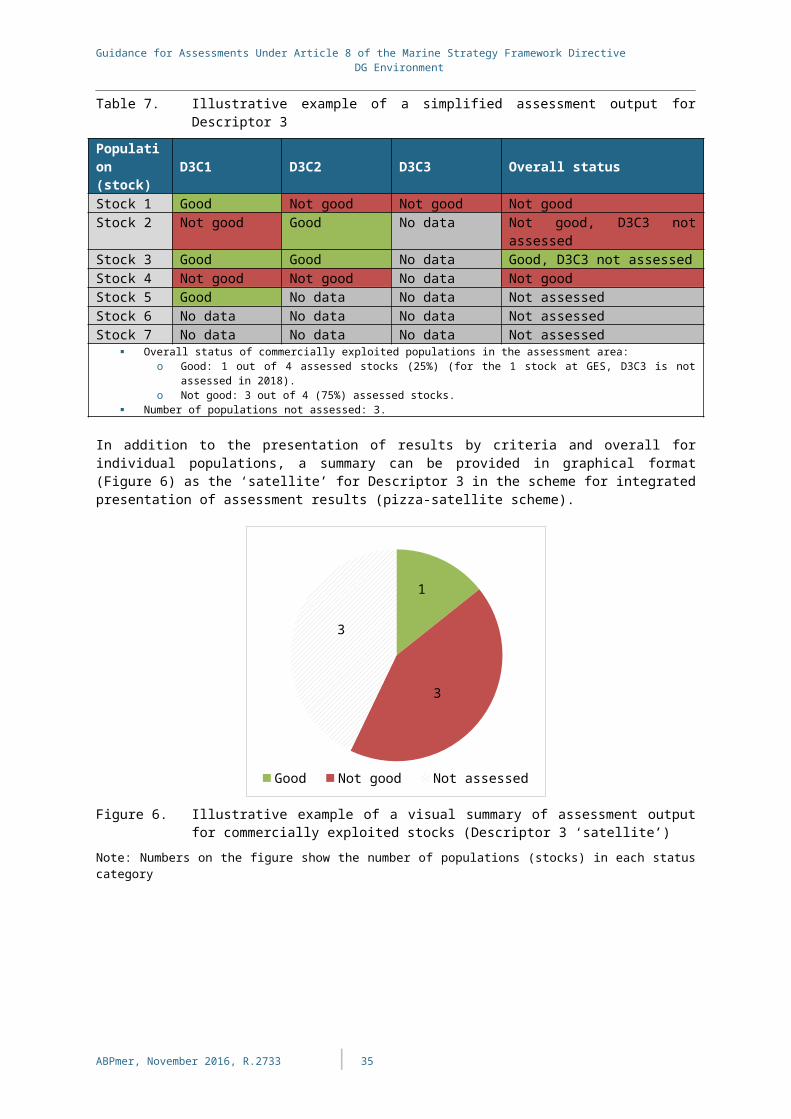
Guidance for Assessments Under Article 8 of the Marine Strategy Framework Directive DG Environment
Determine if threshold values are achieved D6C1: Status is not assessed, but information on the spatial
extent and distribution of physical loss of the natural seabed should be used to assess criterion D6C4 (see Section 4.8) and D7C1 (see Section ).
D6C2: Status is not assessed, but information on the spatial extent and distribution of physical disturbance pressures on the seabed should be used to assess criterion D6C3.
D6C3: Status is not assessed, but the spatial extent of each habitat type that is adversely affected by physical disturbance contributes to the assessment of D6C5 (see Section 4.8).
Integrate indicators and criteria The indicators should be integrated to criteria level, based on the
integration methods in Section 3.4.2
3.4.2 Levels and Methods of IntegrationFigure 9 shows the levels of integration and integration methods for Descriptor 6. The figure is representative of a single assessment area. There is no need to aggregate across spatial areas.
14 These threshold values concern the quality/condition of the subtypes, to enable an assessment of whether there is impact, based on the intensity of the pressure and the habitat's resilience to the pressure. The latter can be assessed via: a) modelling/expert judgement on the 'resistance' of the habitat to the pressure (as one aspect of the 'sensitivity' scoring method in common use for habitat assessments, the other aspect being ‘resilience’ which assess the length of time for the habitat to recover once the pressure is removed); or b) in situ ground-truth sampling to assess the condition of the habitat, via multimetric indices or other appropriate methods (for broad habitat types, the ground-truthing may need to be done on specified representative subtypes e.g. EUNIS level 4 or 5 classes); or c) a combination of approaches a) and b).
ABPmer, November 2016, R.2733 | 38
Step 5
Step 6
Step 7

Guidance for Assessments Under Article 8 of the Marine Strategy Framework Directive DG Environment
Figure 9. Levels and methods of integration for Descriptor 6
The integration methods of Figure 9 are:
Level 1: Measurements of individual elements, for example, extent of the pressures physical loss and physical disturbance and of impacts on benthic broad habitat types or other selected habitat types (in relation to their structure and function, such as species composition and their relative abundance, absence of particularly sensitive or fragile species or species providing a key function). This level of integration is not addressed in this Guidance.
Level 2: The integration approach differs across the criteria:o D6C1: The results for several indicators, where used, are integrated by
combining them as appropriate. This may be through summing areas across different activities, or by combining different spatial data layers for different types of activity that represent physical loss, such as coastal defence works, wind farm installations et al.).
o D6C2: The results for several indicators, where used, are integrated by combining them. This may be through combining several spatial data layers for different types of activity/pressure causing physical disturbance, such as mobile demersal fishing, gravel extraction etc.. Spatial overlaps in different pressures should be accounted for (i.e. not double-counted). This should provide, as an output, the total extent of seabed in the area that is subject to physical disturbance.
o D6C3: The results of the indicators of the spatial extent of each habitat type which is adversely affected by physical disturbance are not integrated; the outputs contribute to the assessment of benthic habitats under Descriptors 1 and 6 (see Section 4.8, Benthic Habitats). In order to determine the spatial extent of a habitat that is adversely affected, the output from D6C2 needs to be combined with a habitat map and any other
ABPmer, November 2016, R.2733 | 39

Guidance for Assessments Under Article 8 of the Marine Strategy Framework Directive DG Environment
indicators used, to determine the extent of adverse effect per habitat type. There may be a need to combine or integrate different ecological indicators for a particular habitat, such as the Ecological Quality Ratio (EQR), species composition etc. This is not addressed in this Guidance.
Level 3: The criteria are not integrated. D6C1 is used to assess D6C4 and D7C1. D6C2 is used to assess D6C3. D6C3 contributes to the assessment of D6C5. The outputs for D6C1 and D6C3 should be directly used in the assessment of benthic habitat types under Descriptors 1 and 6 (see Section 4.7).
Outstanding issues for D6The Member State workshop on the 20–21 April 2016 raised several issues concerning clarification of the approach to assessment of benthic habitats. Many of these have already been addressed in the revised COM Dec, some may require further consideration (e.g. how to take account of the restoration of benthic habitats, inclusion of qualitative assessments in the integration) and if necessary will be taken forward through further technical work.
The following provides the overall approach to assessment of these D6C1–D6C3 criteria, based on discussions at the Article 8 workshop on 20–21 April 2016 and ICES seafloor damage workshop on 31 May – 01 June 2016:
D6C1: the distribution of physical loss pressures is closely associated with the different activities causing the pressure (i.e. infrastructure developments on the coast or offshore, or man-made modifications to the coast or seabed such as land claim or coastal modifications). Mapping the distribution of the relevant activities can be used directly to prepare spatial data sets on the distribution of the physical losses per area. Coastal data should be available from WFD hydromorphology assessments. Offshore data may be available from Marine Spatial Plans, more localised planning consents and EMODnet.
D6C2: the distribution and intensity of physical disturbance pressures is closely associated with the different activities causing the pressure. Mapping the distribution of the relevant activities can be used directly or via modelling (e.g. for VMS data) to prepare spatial data sets on the distribution and intensity of the physical disturbances per area. Where appropriate, the changes in this pressure over time (e.g. annual variation from VMS data) can also be determined.
D6C3: The extent of impact per habitat type is typically assessed as follows:o Maps of the distribution of the benthic broad habitat types are required
(e.g. as available from EMODnet, aggregated to the MSFD benthic broad habitat types which are equated to EUNIS level 2 types – see Table 2 of revised COM Dec). Where ‘other habitat types’ are selected for a finer-scale assessment, maps can also be drawn from EMODnet (e.g. at EUNIS level 4) or from other sources (e.g. for special habitat types).
o These habitat maps are interfaced (intersected) with the pressure maps from D6C2 to determine the extent of each habitat type that is subjected to the pressure (physical disturbance).
o An assessment is made of whether the habitat is impacted by the pressure (and over what extent); see Step 5 of the assessment flow regarding setting threshold values for defining this 'adverse effect'.
ABPmer, November 2016, R.2733 | 40

Guidance for Assessments Under Article 8 of the Marine Strategy Framework Directive DG Environment
Existing assessment frameworks include:
Framework Integration ApproachSeafloor IntegrityHELCOM HELCOM is developing a core indicator to assess the cumulative impact
of activities on the seafloor. Pending the indicator development, a qualitative approach is taken in support of the 2018 reporting round. Additional core indicators are expected to apply to benthic habitats under D1.
OSPAR OSPAR common indicators include a number of indicators related to assessing seabed habitat quality and one indicator assessing the spatial extent of damage from human activities. Five benthic habitat (BH) indicators pertaining to Descriptor 6 are included in the OSPAR list of common indicators within an overall framework for habitat assessment. The method for integration of the indicators requires further work.
UNEP-MAP EcAp indicators: initiated a process to agree on indicators; these are not yet operational.
Black Sea No agreed indicators.Source: ICES, 2015.
Missing indicators
If a primary criterion cannot be assessed due to a lack of data then the Member State needs to take immediate action on monitoring and assessment tools to ensure that at the next update under Article 8 MSFD an assessment of the criterion is undertaken.
3.4.3 Visualising Assessment Results for Descriptor 6Initial outline of assessment outcomes based on revised COM Dec, with illustrative examples. Subject to modification based on finalising 2018 reporting requirements, which will be determined by WG DIKE.
The assessment output for Descriptor 6 (physical loss and disturbance, as part of the assessment of Descriptors 1 and 6 for Benthic Habitats) is presented for the criterion in each assessment area (subdivision of the region or subregion).
D6C1 & D6C2
Spatial maps of the areas of physical loss (for D6C1) and of physical disturbance (for D6C2) will be key outputs for these criteria. However, the outputs can also be summarised in terms of the total area affected by physical loss and physical disturbance, as shown in Table 11.Table 11. Initial outline and illustrative example for presenting the assessment
output for D6C1 & D6C2, for a single assessment areaCriterion Area (km²)*
D6C1: Extent of physical loss to the seabed in assessment area 3.7D6C2: Extent of physical disturbance pressures on the seabed in the assessment area
14.2
D6C3
The assessment output for D6C3 is presented for each benthic broad habitat type, and additional habitat types, in each assessment area (subdivision of the region or subregion), as shown in Table 12. The threshold values to be set for D6C3 relate to the threshold of a condition indicator, at which point the habitat is considered to be ‘adversely affected. As such, the threshold values and values achieved are not shown in the table, as these will vary throughout the assessment area. The assessment will
ABPmer, November 2016, R.2733 | 41

Guidance for Assessments Under Article 8 of the Marine Strategy Framework Directive DG Environment
therefore need to identify the extent of the area of each habitat type for which the indicators do not achieve the threshold values. As for D6C1 and D6C2, a spatial map showing the spatial extent of adverse effects of physical disturbance is also likely to be a key output of the assessment, and a necessary step in deriving the areas of each habitat adversely affected.
Table 12. Initial outline and illustrative example for presenting the assessment output for D6C3, for a single assessment area
Habitat type Area adversely affected (km²)*
Littoral rock and biogenic reef yLittoral sediment yInfralittoral rock and biogenic reef yInfralittoral coarse sediment yInfralittoral mixed sediment yInfralittoral sand ySpecific habitat type x yEtc.* The extent of each habitat type adversely affected may be measured in square kilometres
(km²) or as a proportion (percentage) of the total natural extent of the habitat in the assessment area.
ABPmer, November 2016, R.2733 | 42
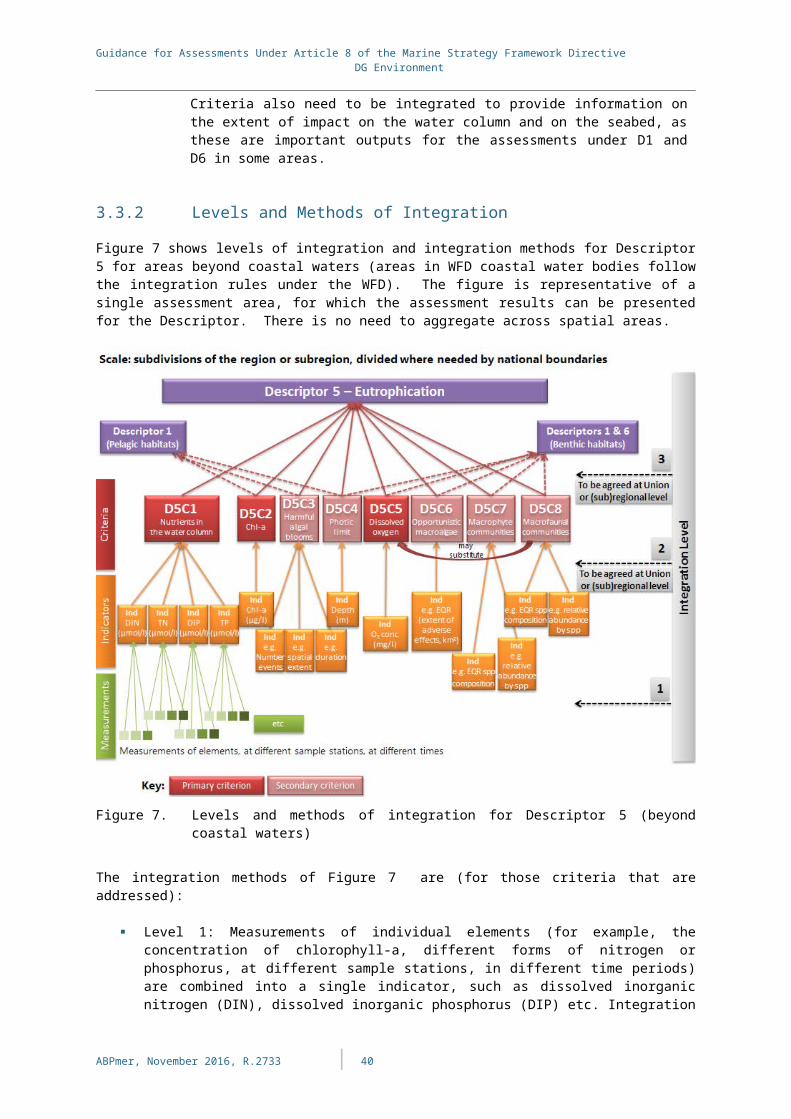
Guidance for Assessments Under Article 8 of the Marine Strategy Framework Directive DG Environment
3.5 Descriptor 7: Hydrographical Changes Descriptor 7: Permanent alteration of hydrographical conditions does not adversely affect marine ecosystems.
The criteria for Descriptor 7, and their relationship to the indicators of 2010/477/EU are shown in Table 13.
Table 13. Criteria for assessment of hydrographical changes (Descriptor 7)Primary Criteria Relating to:
Secondary Criteria Relating to:
2010/477/EU Criteria or Indicators
Pressure / Impact
D7C1 Spatial extent and distribution of permanent alteration of hydrographical conditions
7.2.2
D7C2 Spatial extent of adverse effects on benthic habitats from permanent alteration of hydrographical conditions
7.2.1
Degree of IntegrationThere are two secondary criteria for Descriptor 7, with no integration across the criteria. D7C1 does not have threshold values and informs D7C2. D7C2 requires threshold values for adverse effects of permanent alterations of hydrographical conditions per benthic habitat type and contributes to the assessment of benthic habitats under Descriptors 1 and 6 (D6C5, habitat condition). The envisaged degree of integration is therefore:
D7C1 (secondary) – no integration, informs assessment of D7C2; D7C2 (secondary) – no integration with D7C1; results for individual benthic
habitats (benthic broad habitat types or other habitat types) should be kept separate (no integration to criteria level), and contribute to the assessment of D6C5.
3.5.1 Assessment FlowThe assessment flow for Descriptor 7 is described below.
Determine the criteria to addressCriteria D7C1 and D7C2 are both secondary criteria. They should be addressed in those assessment areas where the habitat types or broad habitat types are at risk of failing to be in good status and permanent alteration of hydrographical conditions is considered to make a significant contribution to this risk.
Permanent alteration of hydrographical conditions includes changes in wave action, currents, salinity and temperature, particularly as a result of physical loss of or modifications to the natural seabed or upstream modifications which affect coastal waters. Hydrographical changes are likely to stem from physical infrastructure assessed under D6C1 or from infrastructure changes upstream (canalisation, etc.). This includes all offshore structures, including those with small footprint on the seabed
ABPmer, November 2016, R.2733 | 43
Step 1

Guidance for Assessments Under Article 8 of the Marine Strategy Framework Directive DG Environment
(anchoring mechanism). Other possible sources of hydrographical changes may be cables and pipelines (if not included in D6C1), but these would only need to be assessed where they are considered to contribute to the risk of habitat types failing to be in good status. The wider ecosystem and climate change issues of temperature, current, storminess and acidification changes are not included in D7 assessments (these parameters are listed in Annex III and can be monitored and brought into any of the assessments if considered relevant).Determine the elements for assessmentThe elements for assessment are:
D7C1: Hydrographical changes to the seabed and water column (including intertidal areas), associated in particular with physical loss of the natural seabed;
D7C2: Benthic broad habitat types or other habitat types (see Descriptors 1 and 6 Habitats (Benthic), Section 4.8).
The habitat types to be addressed under D7C2 are those benthic broad habitat types and other habitat types selected under D1/D6 which are at risk of failing to be in good status and permanent alteration of hydrographical conditions is considered to make a significant contribution to this risk.Determine scales and areas for assessmentThe revised COM Dec indicates the following spatial scales for assessment:
The same assessment scales and areas as used for the benthic broad habitat types under Descriptors 1 and 6.
Assign indicators to criteria Relevant regional indicators should be identified and allocated to
the COM Dec criteria (mapping of RSC indicators against the revised COM Dec criteria is provided in Appendix A).
Any remaining gaps should be identified. Use national assessments (taking into account existing assessments e.g. under EU legislation such as WFD, Habitats Directive), where available, pending the development of regionally coordinated assessments.
Additional national indicators for elements that are specific to national waters, if any, can also be incorporated and allocated to the relevant criteria and assessment areas.
Establish threshold values D7C1: No threshold values are required. D7C2: Threshold values should be established by Member States
through regional or subregional cooperation for the adverse effects of permanent alterations of hydrographical conditions on each habitat type.
Determine if threshold values are achieved D7C1: Status is not assessed, but information on the spatial extent
and distribution of permanent alteration of hydrographical conditions to the seabed and water column, associated in particular with physical loss of the natural seabed (from D6C1), should be used to assess criterion D7C2. The information from D6C1 needs to be complemented only with information on the spatial extent and distribution of permanent alteration of hydrographical conditions from other pressures (e.g. changes in near-field and far-field hydrographical conditions as a result of infrastructure developments such as renewable energy
ABPmer, November 2016, R.2733 | 44
Step 2
Step 3
Step 4
Step 5
Step 6

Guidance for Assessments Under Article 8 of the Marine Strategy Framework Directive DG Environment
installations, oil and gas infrastructure etc.). D7C2: The spatial extent of each benthic habitat type that is
adversely affected by permanent alteration of hydrographical conditions in each assessment area. Status is not assessed, but the information contributes to the assessment of D6C5 (see Section 4.8).
Integrate indicators and criteria The indicators should be integrated to criteria level, based on the
integration methods in Section 3.4.2.
3.5.2 Levels and Methods of IntegrationFigure 10 shows the levels of integration and integration methods for Descriptor 7. The figure is representative of a single assessment area. There is no need to aggregate across spatial areas.
Figure 10. Levels and methods of integration for Descriptor 7
The integration methods of Figure 10 are:
Level 1: Measurements of individual elements (for example, extent of permanent alteration of hydrographical conditions from pressures other than physical loss (for which information is provided by D6C1), and impacts on benthic habitats (in
ABPmer, November 2016, R.2733 | 45
Step 7

Guidance for Assessments Under Article 8 of the Marine Strategy Framework Directive DG Environment
relation to their physical and hydrographical characteristics and associated biological communities), are combined into individual indicators. This level of integration is not addressed in this Guidance.
Level 2: The integration approach differs across the two criteria:o D7C1: The results from several indicators (representing different pressures
— physical loss from D6C1, and other sources of changes to hydrological conditions), where used, are integrated by combining them as appropriate. This may be through combining several spatial data layers for different types of pressure causing hydrographical changes, such as physical loss (from D6C1), and other changes to hydrological conditions if relevant. Spatial overlaps in different pressures should be accounted for (not double-counted). This should provide, as an output, the extent of each habitat type that is subject to changes in hydrological conditions.
o D7C2: The results of the indicators of the spatial extent of each habitat type which is adversely affected by changes to hydrological conditions are not integrated; the outputs contribute to the assessment of benthic habitats under Descriptors 1 and 6 (see Section 4.8, Benthic Habitats).
Level 3: The two criteria represent complementary aspects (spatial extent of hydrographical changes and spatial extent of adverse effects on benthic habitats as a result of those hydrographical changes). The two criteria are not integrated. D7C1 contributes to the assessment of D7C2, which contributes to assessments of benthic habitats under Descriptors 1 and 6 (see Section 4.8).
Missing indicators
If an aspect of Descriptor 7 cannot be assessed due to a lack of data then the Member State needs to take immediate action on monitoring and assessment tools to ensure that at the next update under Article 8 MSFD an assessment is undertaken.
Outstanding issues for Descriptor 7Methodological standards for linking WFD assessments with MSFD assessments (e.g. related to scales of assessment) may require further development.
3.5.3 Visualising Assessment Results for Descriptor 7Initial outline of assessment outcomes based on revised COM Dec, with illustrative examples. Subject to modification based on finalising 2018 reporting requirements, which will be determined by WG DIKE.
The assessment output for Descriptor 7 is presented for each assessment area (as used for the assessment of the benthic broad habitat types) for each criterion assessed, as shown in Table 14.
The assessment output is presented as the extent of hydrographical changes to the seabed (for D7C1) and the extent of each benthic habitat type adversely affected due to permanent alternation of hydrographical conditions (D7C2).
A spatial map of the areas of hydrographical changes to the seabed will be a necessary output for D7C1. This will need to be intersected with a benthic habitat map to determine the areas of individual benthic habitat types that are adversely affected by hydrographical changes, for D7C2.
ABPmer, November 2016, R.2733 | 46

Guidance for Assessments Under Article 8 of the Marine Strategy Framework Directive DG Environment
Table 14 Initial outline and illustrative example for presenting the assessment output for Descriptor 7, for a single assessment area
Criterion / Habitat typeThreshold value (km²)
Area affected (km²)*
D7C1: extent of hydrographical changes to the seabed in assessment area
N/a 12.5
D7C2: extent of habitat types adversely affected by hydrographical changes- Littoral rock and biogenic reef 0.1 0.2- Littoral sediment 2.0 1.6- Infralittoral rock and biogenic reef 0.1 1.3- Infralittoral sand 10.0 8.2- Specific habitat type x 1.0 1.2
* The extent of each habitat type adversely affected may be measured in square kilometres (km²) or as a proportion (percentage) of the total natural extent of the habitat in the assessment area.
An overall assessment for Descriptor 7 is not anticipated. The assessment outputs feed in to the assessment of benthic habitats under Descriptors 1 and 6. However, a summary can be provided as the ‘satellite’ for Descriptor 7 (Figure 11), showing the overall spatial extent of hydrographical changes to the seabed in the assessment area (in the scheme for integrated presentation of assessment results), without a judgement on whether this constitutes ‘good’ or ‘not good’ status.
Figure 11. Illustrative example of a visual summary of assessment output for hydrographical changes, based on D7C1 (Descriptor 7 ‘satellite’)
Note: No judgement on ‘good’ or ‘not good’ status is required.
ABPmer, November 2016, R.2733 | 47
Extent ofhydrographical changes
12.5 km²

Guidance for Assessments Under Article 8 of the Marine Strategy Framework Directive DG Environment
3.6 Descriptor 8: Contaminants Descriptor 8: Concentrations of contaminants are at levels not giving rise to pollution effects.
The primary and secondary criteria, and their relation to the 2010/477/EU indicators, are shown in Table 15. The assessments for D8 address two distinct aspects:
Contaminants and chronic effects :o D8C1 relates to the levels of contaminants in the marine environment,
which risk causing chronic effects on marine organisms; o D8C2 relates to the adverse effects (impacts) of these contaminants on
species populations and biological communities; Significant acute pollution events :
o D8C3 relates to the spatial extent and duration of significant acute pollution events;
o D8C4 relates to adverse effects from these significant acute pollution events on species and habitats.
Table 15. Criteria for assessment of contaminants (Descriptor 8)Primary Criteria Relating to:
Secondary Criteria Relating to:
2010/477/EU Criteria or Indicators
Comments
Chronic pollution
Pressure
D8C1 Contaminant concentrations in the relevant matrix
8.1.1
Impact
D8C2 Effects of contaminants on health of species and condition of habitats
8.2.1
Acute pollution
Pressure
D8C3 Significant acute pollution events
8.2.2 8.2.2 has two aspects (pressure and impact) which are now separated in the revised Decision
Impact
D8C4 Adverse effects of significant pollution events on species and habitats
8.2.2
Degree of IntegrationThe degree of integration across criteria is not yet determined. The revised COM Dec requires outputs separately for each criterion, but also specifies that the use of D8C2 and D8C4 in the overall assessment of GES for Descriptor 8 shall be agreed at regional or subregional level. This includes whether the criteria feed in to the assessment of Descriptor 8 or not, and the possible integration methods to be used.
For D8C1 and D8C2, each assessed criterion should be within threshold values. D8C3 requires the definition of a ‘significant acute pollution event’; when this occurs, D8C4 should be assessed and reported on. There are no threshold values for D8C3 and D8C4.
ABPmer, November 2016, R.2733 | 48

Guidance for Assessments Under Article 8 of the Marine Strategy Framework Directive DG Environment
D8C2 and D8C4 should contribute, where appropriate, to the assessment under Descriptors 1 and 6.
3.6.1 Assessment FlowThe assessment flow for Descriptor 8 is described below.
Determine the criteria to address D8C1 is primary and must be addressed as an EU minimum
requirement, in terms of an assessment of whether levels of the specified contaminants are above or below the set threshold values.
D8C2 is a secondary criterion. Its use in the overall assessment of GES for Descriptor 8 should be agreed at regional or subregional level.
D8C3 is primary and must be addressed. It is used to trigger assessment of D8C4 once there has been a significant acute pollution event.
D8C4 is secondary and should be assessed when D8C3 indicates a significant pollution event has occurred. The definition of ‘significant’ is still to be determined. The use of D8C4 in the overall assessment of GES for Descriptor 8 should be agreed at regional or subregional level.
Existing oil spill surveillance (EMSA) and oil spill monitoring (e.g. OSPAR/Bonn Agreement, HELCOM) provide a means for Member States to detect and monitor acute oil spill pollution events. In the event of a significant acute pollution event, Member States should undertake event monitoring involving the spatial and temporal extent of the polluting element (D8C3) and effects of the pollution on marine species and habitats (D8C4).Determine the elements for assessmentD8C1: The elements for assessment differ between coastal/territorial waters and areas beyond territorial waters, taking into account:
The complementary role of MSFD in coastal waters (Article 3(1)(b) MSFD), i.e. MSFD covers those aspects not already addressed through WFD or other Community legislation;
Agreed procedures (under WFD and in RSCs) for a risk-based approach to selecting and monitoring contaminants for assessment, taking into account transboundary aspects. To exclude any substances from assessments under MSFD, Member States should follow the procedures under WFD and RSCs and provide scientific justification that no such risk of pollution effects exists. The risk should be periodically reviewed.
The geographical scope of WFD and MSFD, which overlaps in coastal waters (1 nm) and territorial waters (12 nm). The WFD requires good ecological status within 1 nm, which includes the status of pollutants (see Annex V WFD), and good chemical status within 12 nm (see Annex X of the WFD and the Priority Substances Directive, 2008/105/EC).
Based on the foregoing considerations, the revised COM Dec defines the elements for assessment for D8C1 as follows:
(1) Within coastal and territorial waters:(a) Contaminants selected in accordance with Directive
2000/60/EC (WFD): Contaminants for which an environmental quality standard
ABPmer, November 2016, R.2733 | 49
Step 1
Step 2
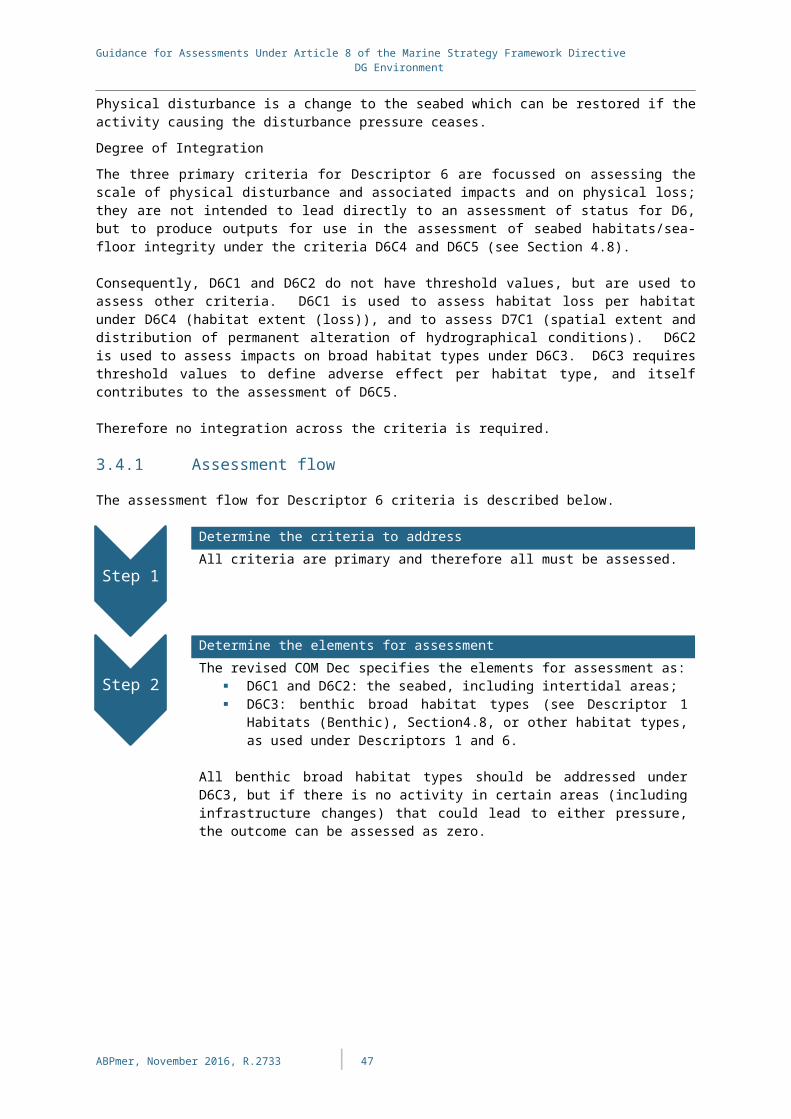
Guidance for Assessments Under Article 8 of the Marine Strategy Framework Directive DG Environment
(EQS) is laid down in part A of Annex I of Directive 2008/105/EC (the Priority Substances Directive) (note that it has been updated by Directive 2013/39/EU; to ensure the correct list and standards, the latest consolidated version of the EQS Directive should be checked);
River Basin Specific Pollutants (RBSPs)15 that have been identified under Annex VIII to Directive 2000/60/EC (WFD) in coastal waters; and
(b) Additional contaminants, if relevant, which may give rise to pollution effects in the marine region or subregion. Member States shall establish the list of additional contaminants through regional or subregional cooperation. Some additional contaminants may already be identified for monitoring by RSCs. Additional contaminants may reflect, for example, offshore pollution and atmospheric deposition of contaminants.
(2) Beyond territorial waters:(a) The contaminants considered under point (1) where they still
may give rise to pollution effects. Contaminants can be removed from the list of those monitored through a risk-based approach.
(b) Additional contaminants, if relevant, which are not already identified above and which may give rise to pollution effects in the region or subregion. The list of additional contaminants should be established through regional or subregional cooperation.
For criteria elements under D8C1, the selection of additional contaminants within and beyond coastal and territorial waters that may give rise to pollution effects shall be based on a risk assessment. For these contaminants, the matrix and threshold values used for the assessment shall be representative of the most sensitive species and exposure pathway, including hazards to human health via exposure through the food chain. The resulting lists of contaminants should be treated individually or as groups, as agreed at Union level.D8C2: Member States should establish a list of species, and relevant tissues to be assessed, and (benthic) habitats, at risk of adverse effects from contaminants, including cumulative and synergistic effects, through regional or subregional cooperation.D8C3: The elements for assessment are significant acute pollution events involving polluting substances, as defined in Art 2(2) of Directive 2005/35/EC of the European Parliament and of the Council, including crude oil and similar compounds. Note that there is not yet an agreed definition of ‘significant’ in this context.D8C4: The species of the species groups assessed under Descriptor 1 (see Section 4.1) and benthic broad habitat types assessed under Descriptors 1 and 6 (see Section 4.8).Determine scales and areas for assessmentThe revised COM Dec indicates the following spatial scales for assessment:
15 River Basin Specific Pollutants are considered as part of ecological status under the WFD. They are substances of national or local concern that are selected by Member States for control at the relevant level (http://ec.europa.eu/environment/water/water-dangersub/). Identified as ‘Pollution by other substances identified as being discharged in significant quantities into the body of water’ under ‘Chemical and physico-chemical elements’ of ecological status in Annex V of the WFD.
ABPmer, November 2016, R.2733 | 50

Guidance for Assessments Under Article 8 of the Marine Strategy Framework Directive DG Environment
D8C1 and D8C2: Within coastal and territorial waters: the water bodies as used
under Directive 2000/60/EC. This will facilitate the reuse of information from WFD. Note that for good ecological status, WFD requires Member States to define water bodies for assessment (i.e. assessment units) within 1 nm16.
Beyond territorial waters: subdivisions of the region or subregion, divided where needed by national boundaries.
D8C3: Region or subregion, divided where needed by national boundaries.
D8C4: The same assessment scales and areas as used for the species groups or benthic broad habitat types under Descriptors 1 and 6.
The scales for assessment take into account the different approaches of Member States to monitoring beyond 1 nm and/or 12 nm, such as offshore monitoring, modelling, or extrapolation of WFD results from within 1 nm and/or 12 nm to larger areas.Assign indicators to criteria
Relevant regional indicators that are available should be identified and allocated to the selected contaminants, biological effects and associated assessment areas. Mapping of RSC indicators against the revised COM Dec criteria is provided in Appendix A.
Any remaining gaps should be identified. Use national assessments (taking into account existing assessments e.g. under EU legislation such as WFD, Habitats Directive), where available, pending the development of regionally coordinated assessments.
Additional national indicators for elements that are specific to national waters, if any, can also be incorporated and allocated to the relevant criteria and assessment areas. These need to have a threshold value, where appropriate, and should follow the agreed structure for reporting indicators (MSCG_17-2015-04), pending guidance on reporting requirements from WG DIKE.
Establish threshold valuesThe threshold values for assessment are:
D8C1:Within coastal and territorial waters:
For contaminants selected in accordance with Directive 2000/60/EC, the values set in accordance with Directive 2000/60/EC, i.e.:
o the environmental quality standards (EQS) for WFD priority substances established by WFD and Directive 2008/105/EC (as amended);
o the national values set by Member States for RBSPs. When a WFD priority substance or RBSP is measured in a matrix for
which no value is set under Directive 2000/60/EC, Member States should set the threshold values for the concentrations in that matrix through regional or subregional cooperation.
For additional contaminants listed through regional or subregional cooperation, threshold values for the concentrations in the specified matrix (water, sediment or biota), which may give rise to pollution effects, shall be established by Member States through regional or subregional cooperation.
16 See Common Implementation Strategy for the Water Framework Directive (2000/60/EC) Guidance Document No 5 Transitional and Coastal Waters, Typology, Reference Conditions and Classification System (page 24). Available online at http://ec.europa.eu/environment/water/water-framework/facts_figures/guidance_docs_en.htm [Accessed 17.05.2016].
ABPmer, November 2016, R.2733 | 51
Step 3
Step 4
Step 5

Guidance for Assessments Under Article 8 of the Marine Strategy Framework Directive DG Environment
Beyond territorial waters: For contaminants selected in accordance with Directive
2000/60/EC and additional contaminants within coastal and territorial waters (point 1 of the criteria elements of the revised COM Dec), the values as applicable those waters;
For additional contaminants listed through regional or subregional cooperation for waters beyond territorial waters (point 2(b) of criteria elements of the revised COM Dec), threshold values for concentrations in the specified matrix (water, sediment or biota), which may give rise to pollution effects, established by Member States through regional or subregional cooperation.
For improved consistency, the matrices used for monitoring under WFD and MSFD should be aligned where appropriate, taking into account the purpose of monitoring.
D8C2: Threshold values for adverse effects (including cumulative and synergistic effects) on the health of species and the condition of habitats (e.g. species composition and their relative abundance at locations of chronic pollution), should be set by Member States through regional or subregional cooperation.
D8C3: No threshold values are required.
D8C4: No threshold values are required.Determine if threshold values are achieved
D8C1: The status of each contaminant in each relevant matrix should be determined, based on its concentration compared to the relevant threshold value established in Step 5.
D8C2: The status of each species or habitat assessed should be determined, based on the selected indicators for adverse effects and their estimated current state compared to the threshold values established in Step 5.
D8C3: No status assessment required, but there is need to quantify the extent and duration of significant pollution events. The occurrence of a significant pollution event (identified from monitoring this criterion) should trigger the assessment of criterion D8C4.
D8C4: No status assessment required. The adverse effects of significant pollution events on the health of species and the condition of habitats should be monitored and, where the cumulative spatial and temporal effects are significant, the outputs should contribute to assessments under Descriptors 1 and 6. This is in the form of the number of each species and/or the extent of each broad habitat type that is adversely affected.
Integrate indicators and criteria The indicators should be integrated, based on the integration
methods in Section 3.6.2.
3.6.2 Levels and Methods of IntegrationFigure 12 shows the levels of integration and integration methods for Descriptor 8. It builds on the assessment of single substances which are combined to indicators of single substances (e.g. individual metals) or groups of substances (e.g. PAHs, PCDBs) per
ABPmer, November 2016, R.2733 | 52
Step 6
Step 7

Guidance for Assessments Under Article 8 of the Marine Strategy Framework Directive DG Environment
matrix or across matrices at the relevant assessment scale. The grouping of substances should be agreed at regional or subregional level so that a consistent approach is used. The figure is representative of a single assessment area, for which the outputs of the assessment can be presented. There is no need to aggregate across spatial areas. Spatial and temporal aggregation within assessment areas should follow WFD CIS Guidance or other appropriate guidance.
Figure 12. Levels and methods of integration for Descriptor 8
The integration methods of Figure 12 are:
Level 1: Measurements of individual elements, i.e. each substance is measured in the relevant matrices (sediment, water, biota) and compared to the matrix-specific threshold value. For the purpose of D8C1 ‘contaminants’ are understood to refer to single substances or to groups of substances. For consistency in reporting, the grouping of substances (which substances and the method for combining them in one group) shall be agreed at Union level17. This concerns the grouping of individual substances to a group of substances, for example, polyaromatic hydrocarbons (PAHs) or polychlorinated biphenyls (PCBs).
Level 2: The integration method differs between the criteria:o D8C1: The results for the various contaminants under D8C1 are not
integrated. They are presented individually and as a proportion of contaminants meeting/failing the threshold values. The persistent, bioaccumulative and toxic substances (PBTs) (listed in Directive 2013/39/EU18) should be presented separately.
17 See point 5 under ‘Specifications and standardised methods for monitoring and assessment’ in the revised COM Dec.
18 Directive 2013/39/EU of the European Parliament and of the Council of 12 August 2013 amending Directives 2000/60/EC and 2008/105/EC as regards priority substances in the field of water policy.
ABPmer, November 2016, R.2733 | 53

Guidance for Assessments Under Article 8 of the Marine Strategy Framework Directive DG Environment
o D8C2: The results for the species and habitat types assessed under D8C2 are presented per species and per habitat type for each parameter. The species- and habitat-specific outputs contribute to the assessment of species and habitats under Descriptors 1 and 6 (see Section 4). The use of the criterion in the overall assessment of GES for Descriptor 8, and any additional output presentation, shall be agreed at regional or subregional level.
o D8C3: The outcome shall be expressed as an estimate of the total spatial extent of significant pollution events and their distribution and total duration for each year. The use of the criterion to assess the extent to which GES is achieved for D8 requires agreement. This could be agreed at regional or subregional level alongside the use of D8C4 in the overall assessment for Descriptor 8.
o D8C4: The results for the species and habitat types assessed under D8C4 are not integrated; the outputs contribute to the assessment of species and habitats under Descriptors 1 and 6 (see Section 4). The use of the criterion in the overall assessment of GES for Descriptor 8 shall be agreed at regional or subregional level.
Level 3: Good environmental status for Descriptor 8 is expressed for each criterion individually. The possible integration of criteria to descriptor level, and whether and how the criteria contribute to the overall Descriptor 8 assessment needs to be agreed at regional or subregional level.
Integration methods and outstanding issues for D8The following open issues remain:
D8C1 :o Grouping of substances (which substances and the method for combining
them in one group) to be agreed at Union level.o Where a Member State or RSC opt for further integration of (groups of)
substances to criterion level, this should take account of WFD methodological standards and the need for consistency, and should be agreed at regional or subregional level.
o For improved consistency, the matrices used for monitoring under WFD and MSFD should be aligned where appropriate, taking into account the purpose of monitoring.
D8C2: The use of the criterion in the overall assessment of GES for Descriptor 8, and any additional output presentation to this end, shall be agreed at regional or subregional level.
D8C3: The use of the criterion in the assessment of GES for Descriptor 8 requires agreement . This could be taken forward alongside the consideration of D8C4 at regional or subregional level. A definition of what constitutes ‘significant’ acute pollution requires agreement at Union level.
D8C4: A definition of what constitutes ‘significant’ cumulative spatial and temporal effects requires agreement. The use of the criterion in the overall assessment of GES for Descriptor 8 requires agreement at Union level.
Until such issues are agreed, this Guidance recommends the following: Level 2: No integration; Level 3: No integration.
Existing assessment frameworks include:
Framework Integration ApproachD8C1 Concentration of ContaminantsWFD OOAO: All priority substances must comply with Environmental
Quality Standards (EQS).HELCOM CHASE: Averaging across substances (sum of substances
ABPmer, November 2016, R.2733 | 54

Guidance for Assessments Under Article 8 of the Marine Strategy Framework Directive DG Environment
Framework Integration Approachmultiplied with root of number of substances), or, for the purpose of assessment of MSFD Good Environmental Status, one out all out between matrices and indicators (substance or group of substance).
OSPAR CEMP: No integration of indicator assessments (substance or group of substances per matrix).
UNEP-MAP No integration of substance assessments.Black Sea No integration of substance assessments.D8C2 Biological effects of contaminantsHELCOM CHASE: Averaging across assessment techniques.OSPAR CEMP: No integration of indicator assessments (individual
assessment techniques).UNEP-MAP Not usedBlack Sea Commission Not used
Missing indicators
If any aspect of a primary criterion cannot be assessed due to a lack of data then the resultant assessment cannot be assigned a status (i.e. it is ‘not assessed’). It also means that the Member State needs to take immediate action on monitoring and assessment tools to ensure that at the next update under Article 8 MSFD an assessment is undertaken.
3.6.3 Visualising Assessment results for Descriptor 8Initial outline of assessment outcomes based on revised COM Dec, with illustrative examples. Subject to modification based on finalising 2018 reporting requirements, which will be determined by WG DIKE.
For each area assessed, the outcomes for each criterion used should be presented. Maps showing the outcomes of the assessments spatially (e.g. for individual contaminants, groups of contaminants, or overall for a criterion) are also likely to be a useful communication tool.
D8C1
The assessment output for D8C1 is presented:
For each contaminant (or group of contaminants) — its concentration, the matrix used (water, sediment or biota), whether the threshold value has been achieved;
Overall, the proportion of contaminants assessed which have achieved the threshold values, including indicating separately the number of ubiquitous, persistent, bioaccumulative and toxic substances (uPBTs), as referred to in Article 8(1)(a) of Directive 2008/105/EC.
An example is provided in Table 16.
ABPmer, November 2016, R.2733 | 55

Guidance for Assessments Under Article 8 of the Marine Strategy Framework Directive DG Environment
Table 16. Initial outline and illustrative example for presenting the assessment output for Descriptor 8, D8C1, for an assessment area
Contaminant or Contaminant group
Matrix Threshold value Concentration
Threshold achieved?
Trend (increase/ stable/ decrease)
Non-uPBTsContaminant 1 Water 8 μg/l 10.5 μg/l No IncreaseContaminant 2 Water 0.1 μg/l 0.07 μg/l Yes StableContaminant 3 Biota 20 μg/kg 15 μg/kg Yes DecreaseEtc.uPBTsContaminant 4 Water Σ = 0.005 μg/l Σ = 0.003 μg/l Yes DecreaseContaminant 4* Sedimen
t100 μg/kg 213 μg/kg No Stable
Contaminant 5 Sediment
4.5 μg/kg 5.3 μg/kg No Stable
Etc. Total number of contaminants within threshold values (excluding uPBTs): 2 out of 3. uPBTs within threshold values: 1 out of 3.
* A single contaminant or group of contaminants may be measured in more than one matrix. In this case, it is counted separately (for each matrix) in the summary.
D8C2
The assessment output for D8C2 is expressed for each species or habitat assessed (see Table 17).
Table 17. Initial outline and illustrative example for presenting the assessment output for Descriptor 8, D8C2, for an assessment area
Species or Habitat type Estimated extent of adverse effectSpecies
- Species 1 500 individuals- Species 2 20% of the population in the assessment area
Habitat types- Littoral rock and biogenic reef 1.5 km²- Littoral sediment 3.9 km²- Etc
D8C3
The assessment output for D8C3 is expressed in terms of the spatial extent, distribution and duration of significant acute pollution events in each year:
Spatial extent: 15 km² Distribution: provide a map or series of maps showing the distribution Duration: 24 days
D8C4
The assessment output for D8C4 is expressed for each species or habitat assessed; a format similar to Table 17 can be used.
Overall assessment of Descriptor 8
The use of criteria D8C2 and D8C4 in the overall assessment of good environmental status for Descriptor 8 shall be agreed at regional or subregional level. It is therefore not
ABPmer, November 2016, R.2733 | 56

Guidance for Assessments Under Article 8 of the Marine Strategy Framework Directive DG Environment
yet clear how the summary should be prepared for the ‘satellite’ for Descriptor 8 in the scheme for integrated presentation of assessment results (pizza-satellite scheme). A proposal is therefore provided in Figure 13, based on the outcome of D8C1 and D8C3.
Good Not good
Figure 13. Illustrative example of a visual summary of assessment output for contaminants, based only on D8C1 and D8C3 (Descriptor 8 ‘satellite’)
ABPmer, November 2016, R.2733 | 57
D8C12/3 contaminants ‘good’1/3 uPBTs ‘good’
D8C315 km²24 days

Guidance for Assessments Under Article 8 of the Marine Strategy Framework Directive DG Environment
3.7 Descriptor 9: Contaminants in SeafoodDescriptor 9: Contaminants in fish and other seafood for human consumption do not exceed levels established by Community legislation or other relevant standards.
The only criterion for Descriptor 9, and its relationship to the indicators of 2010/477/EU is shown in Table 18. Table 18. Criteria for assessment of contaminants in seafood (Descriptor 9)
Primary Criteria Relating to:
Secondary Criteria Relating to:
2010/477/EU Criteria or Indicators
PressureD9C1 Level of contaminants in edible tissues of seafood
9.1.1
Degree of IntegrationThere is only one criterion for Descriptor 9, and therefore no integration among criteria is required.
3.7.1 Assessment FlowThe assessment flow for Descriptor 9 is described below.
Determine the criteria to address D9C1 is primary and must be addressed as an EU minimum
requirement.
Determine the elements for assessmentThe elements for assessment are:
The contaminants (and the relevant species and tissues specified) listed in Regulation (EC) No 1881/2006 (those relevant to fish and seafood);
Member States may decide not to consider contaminants from Regulation (EC) No 1881/2006, where they do not pose a risk in the marine region or subregion (i.e. justified on the basis of a risk assessment);
Member States may assess additional contaminants, a list of which should be established by Member States through regional or subregional cooperation (including the species and relevant tissues in which they are to be monitored).
Only limits for unprocessed seafood should be used (JRC, 2015a), and not limits relating to, for example, PAHs in smoked seafood, since the levels of PAHs may be affected by the smoking process, and unrelated to contaminants in the marine environment.
Where Member States establish a list of contaminants and the species and relevant tissues in which they are to be assessed, in addition to those in Regulation (EC) 1881/2006, the revised COM Dec sets out specifications for the species, which shall:
ABPmer, November 2016, R.2733 | 58
Step 1
Step 2
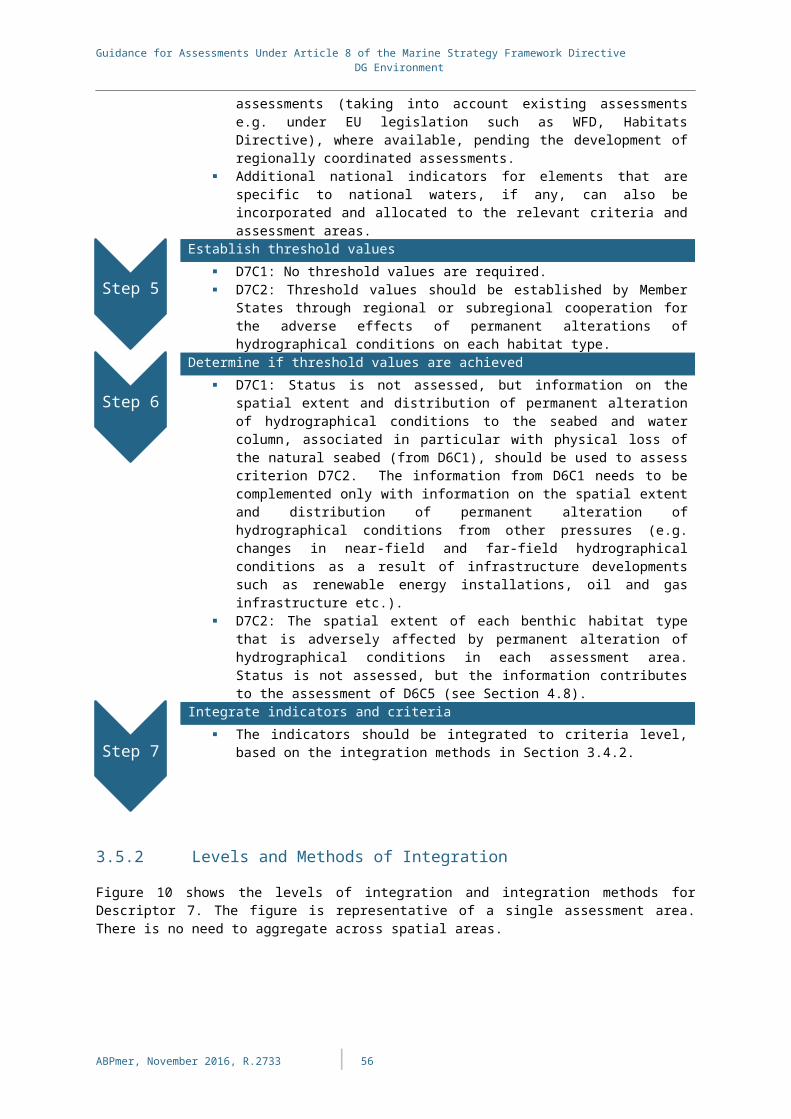
Guidance for Assessments Under Article 8 of the Marine Strategy Framework Directive DG Environment
be relevant to the marine region or subregion concerned; fall under the scope of Regulation (EC) No 1881/2006; and be suitable for the contaminant being assessed; Be among the most consumed in the Member State or the most
caught or harvested for consumption.Determine scales and areas for assessmentThe revised COM Dec indicates the following spatial scales for assessment:
The catch or production areas in accordance with Article 38 of Regulation (EU) No 1379/2013 (common organisation of the markets).
Article 38 of Regulation (EU) No 1379/2013 states the catch or production area is ‘the sub-area or division listed in the FAO fishing areas’. For reference, the relevant sub-areas and divisions can be found at the following links:
North East Atlantic and Baltic Sea (Area 27): www.fao.org/fishery/area/Area27/en
Mediterranean and Black Sea (Area 37): www.fao.org/fishery/area/Area37/en
These are smaller areas than those recommended for the assessment of Descriptor 3. For the purposes of the assessment, these catch or production areas can be aggregated to the level of the region or subregion, as recommended for the assessment under Descriptor 3 (see Step 3 in Section 3.2.1).Assign indicators
Relevant regional indicators that are available should be identified and allocated to the COM Dec criteria (mapping of RSC indicators against the revised COM Dec criteria is provided in Appendix A).
Any remaining gaps should be identified. Use national assessments (taking into account existing assessments e.g. under EU legislation such as Reg (EC) No 1881/2006, where available, pending the development of regionally coordinated assessments.
Additional national indicators for elements that are specific to national waters, if any, should be incorporated into the assessment. These need to have a threshold value, where appropriate, and should follow the agreed structure for reporting indicators (MSCG_17-2015-04), pending guidance on reporting requirements from WG DIKE.
Establish threshold values For contaminants listed in Regulation (EC) No 1881/2006, the
maximum levels for different fish and shellfish species (in specific tissue types);
For additional contaminants, Member States shall establish threshold values (in specific species and tissue types) through regional or subregional cooperation.
Determine if threshold values are achieved The status of each element/contaminant should be determined,
based on the value compared to the thresholds established in step 5.
Integrate indicators The indicators (contaminants) should be integrated to criteria level,
based on the integration methods in Section 3.7.2. As there is only
ABPmer, November 2016, R.2733 | 59
Step 3
Step 4
Step 5
Step 6
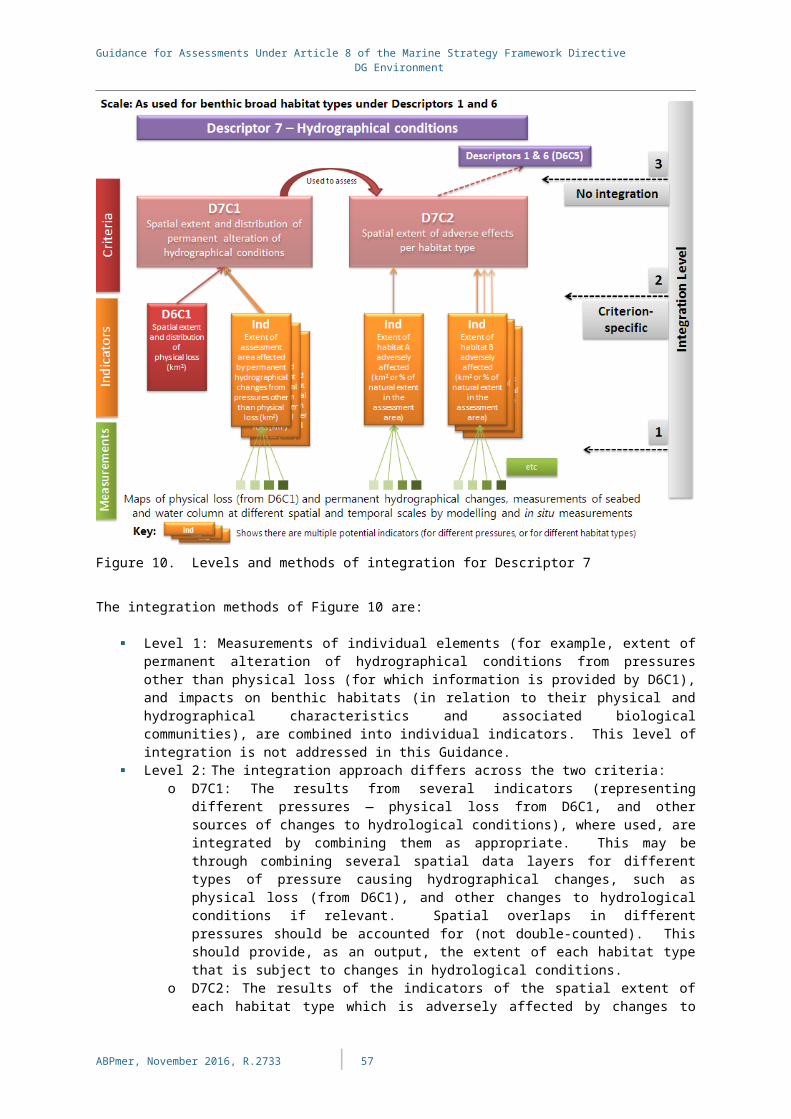
Guidance for Assessments Under Article 8 of the Marine Strategy Framework Directive DG Environment
one criterion, the outcome for the criterion is the same as for the descriptor.
3.7.2 Levels and Methods of IntegrationFigure 14 shows the levels of integration and integration methods for Descriptor 9. The figure is representative of a single assessment area. There is no need to aggregate across spatial areas.
Figure 14. Levels and methods of integration for Descriptor 9
The integration methods of Figure 14 are:
Level 1: Measurements of individual elements i.e. each substance is measured in the relevant matrix (species and tissue) and compared to the matrix-specific threshold value. For example, concentrations of mercury in the muscle tissue of different species of fish, concentrations of dioxins and PCBs in fish liver, are combined to produce information on levels of contaminants in different tissues of different species of fish and shellfish, which can be assessed against the maximum permitted levels under Regulation (EC) No 1881/2006, or levels for additional contaminants and matrices agreed through regional or subregional cooperation. This level of integration is not addressed in this guidance.
ABPmer, November 2016, R.2733 | 60
Step 7
Guidance for Assessments Under Article 8 of the Marine Strategy Framework Directive DG Environment
Level 2: The results for the various contaminants and matrices are not integrated. They are presented individually and as a proportion of contaminants assessed achieving the threshold values (see Section 3.7.3).
Level 3: There is only one criterion therefore the outcome for the criterion represents the outcome for the descriptor and there is no integration.
Missing indicators
If a primary criterion cannot be assessed due to a lack of data then the resultant assessment cannot be assigned a status (i.e. it is ‘not assessed’). It also means that the Member State needs to take immediate action on monitoring and assessment tools to ensure that at the next update under Article 8 MSFD an assessment of the criterion is undertaken.
3.7.3 Visualising Assessment Results for Descriptor 9Initial outline of assessment outcomes based on revised COM Dec, with illustrative examples. Subject to modification based on finalising 2018 reporting requirements, which will be determined by WG DIKE.
The assessment output for Descriptor 9 is expressed for each assessment area for each contaminant, as shown in Table 19. The expression of the number of assessed substances meeting/failing the threshold values provides a means to express distance from GES and change in status/progress.
Table 19 Initial outline and illustrative example for presenting the assessment output for Descriptor 9, for an assessment area
Contaminant
Matrix (species and tissue) in which assessed
Threshold value (standard)
Concen-tration
Threshold achieved?
Mercury Halibut (Hippoglossus hippoglossus), muscle meat
1.0 mg/kg wet weight
0.6 mg/kg wet weight
Yes
Lead Brown crab (Cancer pagurus), muscle meat from appendages and abdomen
0.50 mg/kg wet weight
0.23 mg/kg wet weight
Yes
Lead Mussels (Mytilus edulis), meat 1.5 mg/kg wet weight
1.4 mg/kg wet weight
Yes
Dioxins and dioxin-like PCBs
Herring (Clupea harengus), muscle meat
6.5 pg/g wet weight
7.6 pg/g wet weight
No
Etc. Total number of contaminants/matrices within threshold values: 3 out of 4 (75%).
In addition to the presentation of results by contaminant and species, a summary can be provided in graphical format (Figure 15) as the ‘satellite’ for Descriptor 9 in the scheme for integrated presentation of assessment results (pizza-satellite scheme).
ABPmer, November 2016, R.2733 | 61

Guidance for Assessments Under Article 8 of the Marine Strategy Framework Directive DG Environment
3
1
Good Not good
Figure 15. Illustrative example of a visual summary of assessment output for contaminants in fish and other seafood for human consumption (Descriptor 9 ‘satellite’)
Note: Numbers show the number of contaminant-matrix combinations in good/not good status.
ABPmer, November 2016, R.2733 | 62

Guidance for Assessments Under Article 8 of the Marine Strategy Framework Directive DG Environment
3.8 Descriptor 10: Marine Litter Descriptor 10: Properties and quantities of marine litter do not cause harm to the coastal and marine environment.
The primary and secondary criteria for Descriptor 10, and their relationship to the indicators of 2010/477/EU are shown in Table 20. There are two aspects to Descriptor 10:
Pressure : D10C1 and D10C2 relate to the level of the pressure (litter and micro-litter) in the marine environment (coastline, surface layer of the water column, sea-floor and sea-floor sediment, as appropriate). D10C3 provides an indication of the amount of litter and micro-litter ingested by marine animals;
Impacts on biota : D10C4 address some of the impacts of litter on biota.
Table 20. Criteria for assessment of marine litter (Descriptor 10)
Primary Criteria Relating to:
Secondary Criteria Relating to:
2010/477/EU Criteria or Indicators
Comments
Pressure
D10C1 Litter 10.1.110.1.2
D10C2 Micro-litter 10.1.3
D10C3 Litter ingested 10.2.1
Impacts D10C4 Effects on biota 10.2
Degree of IntegrationThe outcomes are expressed for each of the four criteria separately. Any integration between criteria is to be agreed at Union level.
3.8.1 Assessment FlowThe assessment flow for Descriptor 10 is described below.
Determine the criteria to address D10C1 and D10C2 are primary criteria and must be addressed; D10C3 and D10C4 are secondary criteria.
Determine the elements for assessmentThe revised COM Dec lists elements for assessment. These are:
D10C1: artificial polymer materials, rubber, cloth/textiles, paper/ cardboard, processed/worked wood, metal, glass/ceramics, chemicals, undefined, and food waste19 (Member States may define further sub-categories).
D10C2: micro-litter (particles <5 mm), classified in the categories ‘artificial polymer materials’ and ‘undefined’.
19 These are the ‘Level 1 – Material’ categories from the Master List of categories of litter items from the Joint Research Centre ‘Guidance on Monitoring of marine litter in European seas’ (JRC, 2013). The Master List specifies what is covered under each category, for instance ‘Chemicals’ refers to paraffin, wax, oil and tar.
ABPmer, November 2016, R.2733 | 63
Step 1
Step 2

Guidance for Assessments Under Article 8 of the Marine Strategy Framework Directive DG Environment
D10C3: Litter and micro-litter from the categories ‘artificial polymer materials’ and ‘undefined’, in any species of birds, mammals, reptiles, fish or invertebrates.
D10C4: Species of birds, mammals, reptiles, fish or invertebrates which are at risk from litter.
For D10C1 and D10C2, these must be monitored in the following matrices: D10C1: the coastline must be monitored for litter; the surface layer
of the water column and the seabed are optional D10C2: the surface layer of the water column and the seabed
sediment must be monitored for micro-litter; the coastline is optional.
For D10C3, Member States should establish a list of species to be assessed for this criterion (if the criterion is assessed) through regional or subregional cooperation.
For D10C4, Member States should establish a list of species for assessment (if the criterion is assessed) through regional or subregional cooperation. It should be based on the risk from marine litter (e.g. from entanglement, other types of injury or mortality or health effects). The species may be any species of birds, mammals, reptiles, fish or invertebrates.Determine scales and areas for assessmentThe assessment scales are:
D10C1, D10C2, D10C3: subdivisions of the region or subregion, subdivided where needed by national boundaries.
D10C4: the scales and areas used for the corresponding species groups under Descriptor 1.
Assign indicators Identify the relevant regional indicators that are available and can
contribute to the assessment in relation to the types of litter and matrices, and allocate them to the revised COM Dec criteria. Mapping of RSC indicators against the revised COM Dec criteria is provided in Appendix A.
Any remaining gaps should be identified. Use national assessments (taking into account existing assessments e.g. under EU legislation), where available, pending the development of regionally coordinated assessments.
Additional national indicators for elements that are specific to national waters, if any, can also be incorporated and allocated to the relevant criteria and assessment areas. These need to have a threshold value, where appropriate, and should follow the agreed structure for reporting indicators (MSCG_17-2015-04), pending guidance on reporting requirements from WG DIKE.
Establish threshold valuesThreshold values should be established by Member States:
D10C1 and D10C2: through cooperation at Union level, taking into account regional or subregional specificities;
D10C3 and D10C4: through regional or subregional level.
Determine if threshold values are achieved The status of each element in each matrix should be determined,
based on the value compared to the thresholds established in step 5.
ABPmer, November 2016, R.2733 | 64
Step 3
Step 4
Step 5

Guidance for Assessments Under Article 8 of the Marine Strategy Framework Directive DG Environment
Integrate indicators The indicators should be integrated to criteria level, based on the
integration methods in Section 3.8.2.
3.8.2 Levels and Methods of IntegrationFigure 16 shows the levels of integration and integration methods for Descriptor 10. The figure is representative of a single assessment area (areas may differ across criteria and within criterion D10C4). There is no need to aggregate across spatial areas.
Figure 16. Levels and methods of integration for Descriptor 10
The integration methods of Figure 16 are:
Level 1: Measurements of individual elements — for example, of the quantity of litter of different subcategories in the different matrices in different time periods — are combined into individual indicators. Comparability of this level of integration requires technical consideration and is not addressed in this guidance.
ABPmer, November 2016, R.2733 | 65
Step 6
Step 7

Guidance for Assessments Under Article 8 of the Marine Strategy Framework Directive DG Environment
Level 2: The results for various indicators relating to the criteria D10C1 (litter), D10C2 (micro-litter), D10C3 (ingestion) and D10C4 (effects on biota) are integrated to the criterion level. The integration method varies by criterion:
o D10C1 and D10C2: Assessment methods, indicators and definition of threshold values are to be developed at Union level (by the Technical Group on Marine Litter). See box below.
o D10C3 and D10C4: Use of these criteria in the overall assessment of D10 is to be agreed at Union level. The level of ingestion and adverse effects (lethal and sub-lethal) on species should be kept separate for the individual species, so that they can contribute to assessments under Descriptor 1 if required.
Level 3: The use of the criteria for the assessment of good environmental status for Descriptor 10 still needs to be agreed at Union level. The outputs from D10C3 and D10C4 may also feed into assessments under Descriptor 1 for particular species.
Integration methods for D10The integration methods for Descriptor 10 still need to be determined. The revised COM Dec has provided the scope for the use of criteria in the assessment of Descriptor 10 to be agreed at Union level. In relation to the integration method for D10C1 and D10C2 at level 2, this includes whether the distribution of litter or micro-litter needs to be integrated with the composition of litter or micro-litter, and whether different matrices need to be integrated.
Until such integration methods are agreed, this Guidance recommends the following, in line with the conclusions of the Member State workshop on 20-21 April 2016:
No integration: the outcomes for the different categories of litter or micro-litter, in the different matrices assessed, and the distribution of litter or micro-litter, are presented separately.
Missing indicators
If any aspects of a primary criterion cannot be assessed due to a lack of data then the resultant assessment cannot be assigned a status (i.e. it is ‘not assessed’). It also means that the Member State needs to take immediate action on monitoring and assessment tools to ensure that at the next update under Article 8 MSFD an assessment of all relevant aspects is undertaken.
3.8.3 Visualising Assessment Results for Descriptor 10Initial outline of assessment outcomes based on revised COM Dec, with illustrative examples. Subject to modification based on finalising 2018 reporting requirements, which will be determined by WG DIKE.
Further work is required on graphical presentation of assessment outputs, and on how the different criteria contribute to the overall status of D10 for the ‘satellite’ in the scheme for integrated presentation of assessment results (pizza-satellite scheme).
The assessment output for Descriptor 10 is presented for each criterion assessed, for each assessment area. D10C1 (litter) and D10C2 (micro-litter) are shown together.
D10C1 & D10C2
The assessment outputs can be presented as shown in Table 21, as the quantities of litter per category in each subdivision of the region or subregion (divided where needed by national boundaries). Maps showing the spatial distribution of litter and micro-litter may also be useful for communication purposes.
ABPmer, November 2016, R.2733 | 66
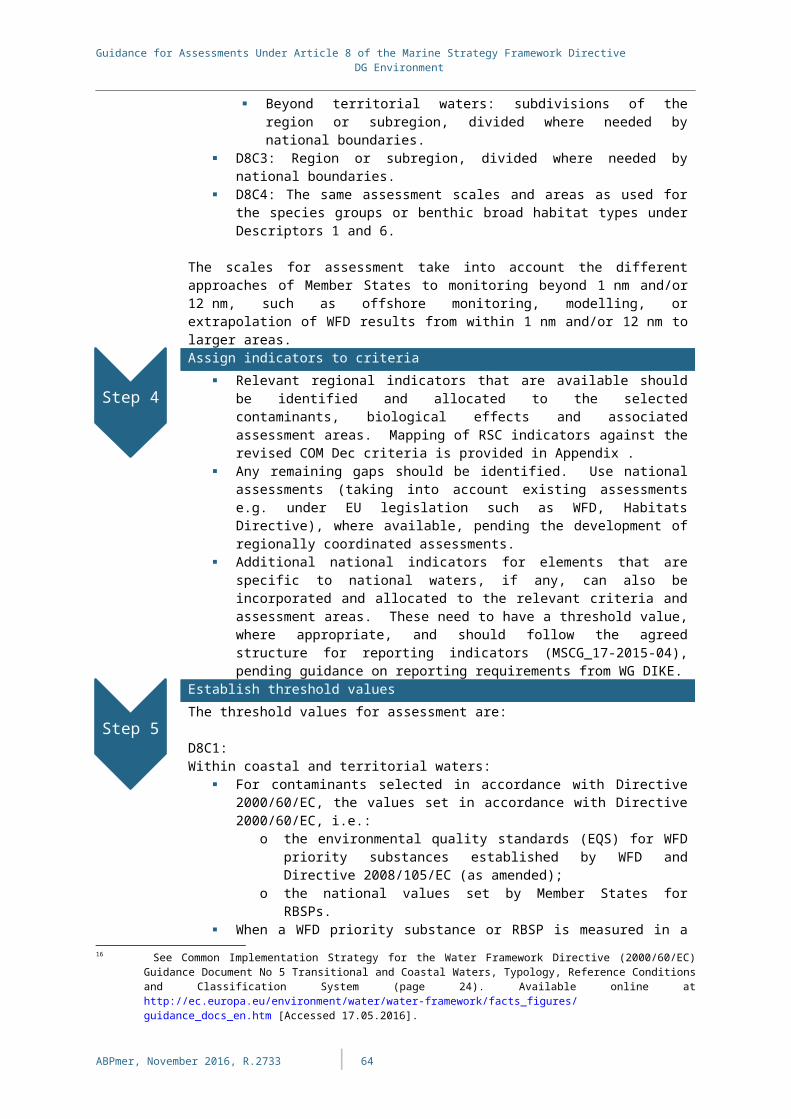
Guidance for Assessments Under Article 8 of the Marine Strategy Framework Directive DG Environment
Table 21. Initial outline and illustrative example for presenting the assessment output for Descriptor 10, D10C1, D10C2 and D10C3
Category Matrix Threshold Amount of litterThreshold achieved
D10C1: Litter (> 5 mm)Artificial polymer materials
Coastline x items per 100 m y items per 100 m No
Rubber Coastline x items per 100 m y items per 100 m NoCloth/textile Coastline x items per 100 m y items per 100 m YesPaper/cardboard
Coastline x items per 100 m y items per 100 m YesProcessed/ worked wood
Coastline x items per 100 m y items per 100 m YesMetal Coastline x items per 100 m y items per 100 m YesGlass/ceramics Coastline x items per 100 m y items per 100 m NoChemicals Coastline x items per 100 m y items per 100 m NoUndefined Coastline x items per 100 m y items per 100 m NoFood waste Coastline x items per 100 m y items per 100 m NoD10C2: Micro-litter (<5 mm)Artificial polymer materials
Seabed sediment
x items per kg sedimentx g per kg sediment
y items per kg sedimenty g per kg sediment
Yes
Other Seabed sediment
x items per kg sedimentx g per kg sediment
y items per kg sedimenty g per kg sediment
Yes
Artificial polymer materials
Surface layer of water column
x items per m²x g per m²
y items per m²y g per m²
Yes
Other Surface layer of water column
x items per m²x g per m²
y items per m²y g per m²
Yes
D10C3
The assessment outputs for D10C3 can be presented as shown in Table 22, as the quantities of litter and micro-litter ingested per species assessed, in each subdivision of the region or subregion (divided where needed by national boundaries). Table 22. Initial outline and illustrative example for presenting the assessment
output for Descriptor 10, D10C3
Species Litter category Threshold Amount of litter Threshold
achievedFulmar Artificial
polymer material >5 mm
x items per individualx g per individual
y items per individualy g per individual
No
Other >5 mm x items per individualx g per individual
y items per individualy g per individual
Yes
Artificial polymer material <5 mm
x items per individualx g per individual
y items per individualy g per individual
Yes
Other <5 mm x items per individual
y items per individual
Yes
ABPmer, November 2016, R.2733 | 67

Guidance for Assessments Under Article 8 of the Marine Strategy Framework Directive DG Environment
x g per individual y g per individualEtc.Note: It may be necessary to further categorise the individuals of the species sampled into size categories (weight or length, as appropriate)
D10C4
The assessment outputs for D10C4 can be presented as shown in Table 23, as the number of individuals affected per species assessed, according to the assessment areas used for the species under Descriptor 1. Table 23. Initial outline and illustrative example for presenting the assessment
output for Descriptor 10, D10C4
Species Type of effect
Number affectedSub-lethal Lethal
Loggerhead turtle (Caretta caretta)
Entanglement 2 5Ingestion No data 3
etc.
ABPmer, November 2016, R.2733 | 68

Guidance for Assessments Under Article 8 of the Marine Strategy Framework Directive DG Environment
3.9 Descriptor 11: Energy, Including Underwater Noise Descriptor 11: Introduction of energy, including underwater noise, is at levels that do not adversely affect the marine environment.
The criteria for Descriptor 11, and their relationship to the indicators of 2010/477/EU are shown in Table 24. The criteria defined so far only address the pressure of underwater noise. Further criteria relating to impacts of underwater noise on biota, and pressure from other forms of energy input (e.g. thermal energy, electromagnetic fields, light) have not yet been defined.
Table 24. Criteria for assessment of energy including underwater noise (Descriptor 11)
Primary Criteria Relating to:
Secondary Criteria Relating to:
2010/477/EU Criteria or Indicators
Pressure
D11C1 Anthropogenic impulsive sound 11.1.1D11C2 Anthropogenic continuous low-frequency sound
11.2.1
Degree of IntegrationCriteria D11C1 and D11C2 should be within threshold values. They are presented separately for the status of Descriptor 11:
D11C1 (primary) – no integration; D11C2 (primary) – no integration.
3.9.1 Assessment FlowThe assessment flow for Descriptor 11 is described below.
Determine the criteria to addressBoth criteria are primary and therefore both must be addressed.
Determine the elements for assessmentThe revised COM Dec provides details of the elements for assessment, for D11C1 and D11C2:
D11C1: impulsive input of anthropogenic sound in water must be assessed, The spatial distribution, temporal extent and levels should be assessed, over the frequency band 10 Hz to 10 kHz. This is described as monopole energy source level in units of dB re 1 µPa2 s or zero to peak monopole source level in units of dB re 1 µPa m. Member States may consider additional specific sources with higher frequency bands if longer-range effects are considered relevant;
D11C2: continuous low-frequency anthropogenic sound in water must be assessed. The spatial distribution, temporal extent and levels should be assessed. This should be as the annual average
ABPmer, November 2016, R.2733 | 69
Step 1
Step 2

Guidance for Assessments Under Article 8 of the Marine Strategy Framework Directive DG Environment
(or other suitable metric agreed at regional or subregional level) of the squared sound pressure in each of two '1/3-octave bands’, one centred at 63 Hz and the other at 125 Hz, expressed as a level in decibels in units of dB re 1 µPa. Member States may agree at regional or subregional level to monitor for additional frequency bands.
Determine scales and areas for assessmentThe revised COM Dec indicates the following spatial scales for assessment:
Region, subregion or subdivision.
In relation to D11C2, the annual average should be calculated at a suitable spatial resolution in relation to the pressure. This means that an appropriate grid size should be used for aggregating data within the region or subregion.Assign indicators
Identify the regional indicators that can contribute to the assessment and allocate them to the revised COM Dec criteria (mapping of RSC indicators against the revised COM Dec criteria is provided in Appendix A).
Any remaining gaps should be identified. Use national assessments (taking into account existing assessments e.g. under EU legislation), where available, pending the development of regionally coordinated assessments.
Additional national indicators for elements that are specific to national waters, if any, can also be incorporated and allocated to the relevant criteria and assessment areas. These need to have a threshold value, where appropriate, and should follow the agreed structure for reporting indicators (MSCG_17-2015-04), pending guidance on reporting requirements from WG DIKE.
Establish threshold valuesThreshold values should be established by Member States through cooperation at Union level, taking into account regional or subregional specificities, for both criteria. It should be noted that thresholds will need to be determined for three aspects for each criterion:
spatial distribution; temporal extent; level.
Determine if threshold values are achieved The status of each indicator should be determined, based on the
value compared to the thresholds established in step 5.
Integrate indicators The indicators should be integrated, based on the integration
methods in Section 3.9.2.
ABPmer, November 2016, R.2733 | 70
Step 3
Step 4
Step 5
Step 6
Step 7

Guidance for Assessments Under Article 8 of the Marine Strategy Framework Directive DG Environment
3.9.2 Levels and Methods of IntegrationFigure 17 shows the levels of integration and integration methods for Descriptor 11. The figure is representative of a single assessment area. There is no need to aggregate across spatial areas.
Figure 17. Levels and methods of integration for Descriptor 11
The integration methods of Figure 17 are:
Level 1: Measurements of individual elements — for example, monopole source levels, observations of continuous low-frequency sound — are combined into individual indicators. Indicators may reflect the parameters identified in the criteria, such as the level, spatial extent (e.g. the area over which levels have been exceeded), and temporal extent (e.g. the number of days in which levels have been exceeded, potentially for specific months). This level of integration requires technical consideration and is not addressed in this guidance.
Level 2: The results for various indicators relating to the criteria D11C1 and D11C2 are integrated to the criterion level. Assessment methods, indicators and definition of threshold values are still being developed for underwater noise, therefore it is not yet possible to define the integration method for this level. See box below.
Level 3: Status for Descriptor 11 is expressed for each criterion individually; with the use of each criterion in the overall assessment of D11 to be agreed at Union level. The outputs from D11C1 and D11C2 may feed in to assessments under Descriptor 1 for particular species.
ABPmer, November 2016, R.2733 | 71

Guidance for Assessments Under Article 8 of the Marine Strategy Framework Directive DG Environment
Integration methods for D11The integration methods for Descriptor 11 still need to be determined. The revised COM Dec has provided the scope for the use of the criteria in the assessment of good environmental status for Descriptor 11 to be agreed at Union level. It is only the integration method for level 2 that requires defining.
Until such integration methods are agreed, this Guidance recommends the following: OOAO: each indicator should meet threshold values for the criterion to be
considered in good status.
Existing assessment frameworks include:
Framework Integration ApproachUnderwater NoiseHELCOM The BIAS project in the Baltic Sea region is developing a common
methodology for measuring acoustic data.OSPAR The impulsive noise indicator (11.1.1) has been accepted as
common indicator for all OSPAR areas. The ambient noise indicator (11.2.1) is a (priority) candidate indicator. An OSPAR working group (ICG Noise), co-working with ICES, has developed a proposal for an impulsive noise registry that would be managed by ICES and is now operational in 2016.
UNEP-MAP Not addressed, but a proposal has been submitted for a basin-wide strategy for monitoring.
Black Sea Not addressed.Source: European Commission, 2015b.
Missing indicators
If a primary criterion cannot be assessed due to a lack of data then the resultant assessment cannot be assigned a status (i.e. it is ‘not assessed’). It also means that the Member State needs to take immediate action on monitoring and assessment tools to ensure that at the next update under Article 8 MSFD an assessment of the criterion is undertaken.
3.9.3 Visualising Assessment Results for Descriptor 11Initial outline of assessment outcomes based on revised COM Dec, with illustrative examples. Subject to modification based on finalising 2018 reporting requirements, which will be determined by WG DIKE.
The assessment output for Descriptor 11 is expressed for each criterion, for each region, subregion or subdivision.
D11C1
The assessment outputs can be presented as shown in Table 25, as the duration of impulsive sound sources throughout the year and spatially within the assessment area. Maps showing the spatial distribution of impulsive sound sources may also be required.
Table 25. Initial outline and illustrative example for presenting the assessment outputs for Descriptor 11, D11C1
Detail Threshold Value achieved Threshold achieved
Spatial distribution 15% of assessment 5% of assessment Yes
ABPmer, November 2016, R.2733 | 72

Guidance for Assessments Under Article 8 of the Marine Strategy Framework Directive DG Environment
area (or in km²) area (or in km²)Distribution in a calendar year: number of days per month (may alternatively be presented quarterly)
- January 10 0 Yes- February 10 0 Yes- March 5 0 Yes- April 5 4 Yes- May 5 29 No- June 10 25 No- July 10 9 Yes- August 10 0 Yes- September 10 0 Yes- October 0 0 Yes- November 0 0 Yes- December 5 0 Yes
D11C2
The assessment output of the annual average of the sound level (or other suitable temporal metric agreed at regional or subregional level), per unit area and its spatial distribution within the assessment area, would be best presented as a map. This can also be summarised in terms of the extent of the assessment area over which the threshold values have been achieved as shown in Table 26.
Maps showing the spatial distribution of impulsive sound sources may also be required.
Table 26. Initial outline and illustrative example for presenting the assessment outputs for Descriptor 11, D11C2
Parameter Value achievedExtent of assessment area over which threshold values have been achieved
75% of assessment area (or in km²)
In addition to the presentation of results by criteria, a summary can be provided in graphical format (Figure 18) as the ‘satellite’ for Descriptor 11 in the scheme for integrated presentation of assessment results (pizza-satellite scheme).
Good Not good Not good
Figure 18. Illustrative example of a visual summary of assessment output for underwater noise (Descriptor 11 ‘satellite’)
ABPmer, November 2016, R.2733 | 73
D11C2
D11C1

Guidance for Assessments Under Article 8 of the Marine Strategy Framework Directive DG Environment
ABPmer, November 2016, R.2733 | 74

Guidance for Assessments Under Article 8 of the Marine Strategy Framework Directive DG Environment
4 State-Related (Biodiversity) Descriptor Assessments
State-related assessments should reflect the impacts upon each state element from all the (main) pressures to which the state elements are subject. They should therefore take into account the outcomes of the relevant pressure-related assessments wherever possible. In some cases this will be specific (e.g. the extent of impact on a habitat type from D2, D5, D7 and D8) whilst in other cases it may provide relevant information. State-based Descriptors (1, 4 and 6) have been combined to assess ecosystem elements in a more integrated manner, by ecosystem component (birds, mammals, fish, benthic habitats etc.). Biodiversity assessments to address the needs of Descriptors 1, 4 and 6 should be made for the related following themes:
Species groups of birds, mammals, reptiles, fish and cephalopods (relating to Descriptor 1) (Section 4.1);
Pelagic habitats (relating to Descriptor 1) (Section Error: Reference source notfound);
Benthic habitats (relating to Descriptors 1 and 6) (Section Error: Reference sourcenot found);
Ecosystems and food webs (addressing Descriptor 4 and wider aspects of Descriptor 1) (Section 4.9).
It is not anticipated that each theme will be integrated further to provide an overall assessment for ‘biodiversity’ — the integration stops at species group level.
4.1 Species (Descriptor 1) – Overview Descriptor 1 (Species): Biological diversity is maintained. The quality and occurrence of habitats and the distribution and abundance of species are in line with prevailing physiographic, geographic and climatic conditions.
There are three aspects to Descriptor 1:
Pressures on the species, which may affect their state: D1C1, and other pressure criteria that may be relevant (e.g. D8C, D8C4, D10C4 and others);
State of species in the marine environment: D1C2, D1C3 and D1C4; State of the supporting habitats for species: D1C5.
Species aspects of biodiversity are considered in relation to five ‘ecosystem components’ and their ‘species groups’ (Table 27). Each species group is to be assessed using a set of representative species, each of which is assessed using one or more criteria. These criteria will be integrated within an individual species, and species will be aggregated to species groups. The details of the integration steps and methods are addressed in the sections for each species ecosystem component (Sections 4.2 to 4.6).
Different criteria under Descriptor 1 are relevant for the various ecosystem components and species, depending on the species type (linked to assessment approaches under Birds Directive, Habitats Directive and, via Descriptor 3, the CFP) and therefore the integration rules are also different. Each ecosystem component is therefore considered separately here. However, the general flow of assessment for species is common to all the species groups, and is presented in Section 4.1.1 below.
ABPmer, November 2016, R.2733 | 75
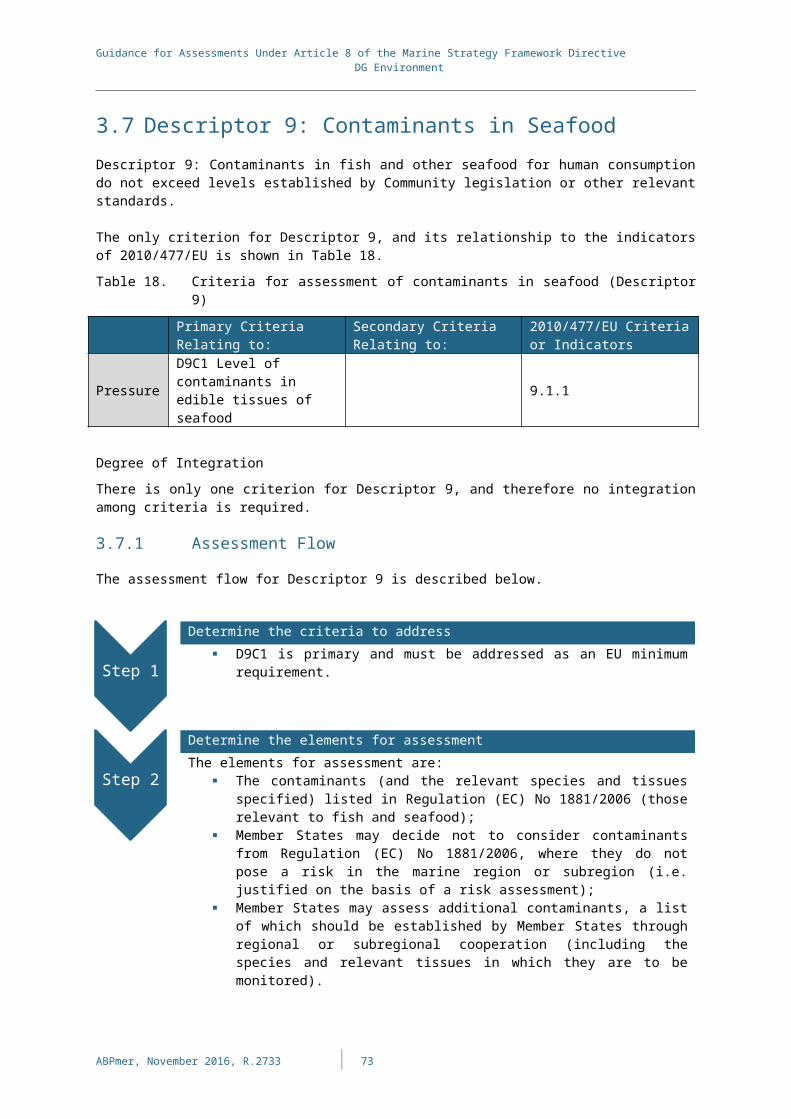
Guidance for Assessments Under Article 8 of the Marine Strategy Framework Directive DG Environment
Table 27. Ecosystem components and their species groups, for consideration under the ‘species’ aspects of Descriptor 1
Ecosystem Component Species Group
Birds
Grazing birdsWading birdsSurface-feeding birdsPelagic-feeding birdsBenthic-feeding birds
MammalsSmall-toothed cetaceansDeep-diving toothed cetaceansBaleen whalesSeals
Reptiles Turtles
Fish20
Coastal fishPelagic shelf fishDemersal shelf fishDeep-sea fish
Cephalopods Coastal/shelf cephalopodsDeep-sea cephalopods
4.1.1 Assessment FlowThe general assessment flow for species ecosystem components is described below. Specific details are provided for birds, mammals, reptiles, fish and cephalopods in separate sections.
Determine the elements for assessment: select speciesFor each species group:
Determine whether the species group is relevant to (occurs in) the region or subregion.
Select species to assess (through regional or subregional coordination). See Section 4.1.2 for details.
Determine the criteria to address Select relevant criteria for each species; D1C1 and D1C2: are primary for all species groups; D1C3, D1C4 and D1C5: whether they are primary or secondary
differs between ecosystem components, and between species depending on the legislation they are listed in. See individual sections for detail.
Determine scales and areas for assessment Appropriate spatial scales differ according to the ecosystem
component, see individual sections for details. Wherever possible use the same scale for all species within a
species group. If species within a species group are assessed at different scales, results may need to be aggregated across spatial areas, or down-scaled to smaller spatial areas, to allow for integration of indicators and criteria on a harmonised spatial scale (see Section 4.1.3).
It is recommended to select as few scales as possible within each region or subregion in order to reduce overall complexity of assessments, whilst still representing appropriate ecological scales for the different species groups.
20 Includes elasmobranchs.
ABPmer, November 2016, R.2733 | 76
Step 1
Step 2
Step 3

Guidance for Assessments Under Article 8 of the Marine Strategy Framework Directive DG Environment
Assign indicators to criteria Draw on assessments carried out under other legislation for the
species selected. Relevant regional indicators that are available should be identified
and allocated to the revised COM Dec criteria for the species (mapping of RSC indicators against the revised COM Dec criteria is provided in Appendix A);
Any remaining gaps should be identified. Use national assessments (taking into account existing assessments e.g. under EU legislation such as Habitats and Birds Directives or Red Lists), where available, pending the development of regionally coordinated assessments.
Additional national indicators for elements that are specific to national waters, if any, can also be incorporated and allocated to the relevant criteria for the species. These need to have a threshold value, where appropriate, and should follow the agreed structure for reporting indicators (MSCG_17-2015-04), pending guidance on reporting requirements from WG DIKE.
Establish threshold values Threshold values for each species assessed should be established
for each relevant criterion (except D1C5). For D1C2, this should take into account natural variation in
population size and the mortality rates derived from D1C1, D8C4 and D10C4 and other relevant pressures.
For species covered by Directive 92/43/EEC (Habitats Directive), threshold values for D1C2 and D1C4 should be consistent with the Favourable Reference population values established by the relevant Member States under that Directive.
For D1C3, this should take account of adverse effects on the health of species derived from D8C2, D8C4 and other relevant pressures.
Determine if threshold values are achieved The status of each relevant criterion for each species should be
determined, based on the value of the indicator compared to the levels and thresholds established in step 5.
Integrate indicators and criteria The overall status of each species should be determined based on
the outcomes for each relevant criterion, according to the integration methods for each ecosystem component. D1C1 contributes to the assessment of D1C2 for each corresponding species;
The overall status of the species group should be determined, based on the outcomes for the representative species, according to the integration methods for each ecosystem component.
4.1.2 Selecting Species to AssessFor Step 1 ‘Determine the elements for assessment: select species’ in the assessment flow, the revised COM Dec sets out a number of ‘scientific criteria (ecological relevance)’ and ‘additional practical criteria’ for selecting representative species for each species group. They are:
Representative of the species group and of ecosystem functioning, being relevant for assessment of state/impacts, such as having a key functional role within the component (e.g. high or specific biodiversity, productivity, trophic link, specific
ABPmer, November 2016, R.2733 | 77
Step 4
Step 5
Step 6
Step 7

Guidance for Assessments Under Article 8 of the Marine Strategy Framework Directive DG Environment
resource or service) or particular life history traits (age and size at breeding, longevity, migratory traits);
Relevant for assessment of a key anthropogenic pressure to which the ecosystem component is exposed, being sensitive to the pressure and exposed to it (vulnerable) in the assessment area;
Present in sufficient numbers or extent in the assessment area to be able to construct a suitable indicator for assessment21;
The set of species selected should cover, as far as possible, the full range of ecological functions of the ecosystem component and the predominant pressures to which the component is subject;
If species of species groups are closely associated to a broad habitat type they may be included within that habitat type for monitoring and assessment purposes; in such cases the species shall not be included in the assessment of the species group.
Additional practical criteria for selecting species (which shall not override the main scientific criteria) are monitoring/technical feasibility, monitoring costs, and existence of an adequate time series of the data.
In practice, many of the species selected are likely to be those already assessed under Birds and Habitats Directives or the CFP, as these often fulfil the scientific criteria above and have established monitoring and assessment processes. However, additional species should be included where appropriate.
For D1C1: The incidental by-catch species (birds, mammals, reptiles and non-commercially exploited species of fish and cephalopods) that should be monitored for levels of mortality should be established through regional or subregional cooperation, taking account of the obligations laid down in Article 25(5) of Regulation (EU) No 1380/2013 and taking into account the list of species in Table 1D of the Annex to Commission Implementing Decision (EU) 2016/1251. Not all species in Table 1D need to be included on the list, and additional species may also be added — the list of species to be assessed under D1C1 should reflect the métiers causing the greatest by-catch problem, and those species most affected, allowing efforts on data collection and assessment to be prioritised. The Scientific, Technical and Economic Committee for Fisheries (STECF) noted that it should be up to the Regional Coordination Groups (RCGs) to identify and prioritise the fishery/species combinations that need to be monitored and sampled for by-catch of non-commercial species including protected, endangered and threatened species (PETS) under the revised Data Collection Framework (DCF) (STECF, 2014). In this process, there should be an adequate involvement of environmental managers as well as conservation-oriented end users (such as HELCOM in the Baltic Sea RCG), to ensure that adequate data are available for assessments under the MSFD. Assessing D1C1 for a species would involve aggregating (summing) by-catch estimates from different métiers to give a mortality level per species. All species that are assessed under D1C1 should be included on the lists of species for the relevant species groups for D1C2–D1C5.
4.1.3 Integration Sequence – Spatial ScalesThe integration methods presented for each ecosystem component are representative of a single assessment area, for which the results of the species group assessments can be presented. It is recommended to use the same spatial scale across all species in a species group. However, where this is not possible, the assessment units should be ecologically relevant for the respective species and indicator. For species which are assessed at different spatial scales, there may be a need to harmonise the spatial scales (i.e. assessment units) of all indicators and species within each ecosystem component. The two options are:
21 Rare or endangered species should not be excluded on this basis, and all mammals and reptiles listed in Annex II to Directive 92/43/EEC must be included.
ABPmer, November 2016, R.2733 | 78

Guidance for Assessments Under Article 8 of the Marine Strategy Framework Directive DG Environment
Aggregate across spatial areas to the region or subregion, then carry out the integration at the regional or subregional scale;
Down-scale indicator assessments to smaller spatial areas, and carry out the integration at the level of the smaller assessment areas.
4.1.4 Integration Levels and MethodsFigure 19 shows the levels of integration and integration methods for species under Descriptor 1 and is representative of a single assessment area. It is shown generically for ‘ecosystem components’ (birds, mammals, reptiles, fish, cephalopods) – the criteria used, and whether criteria are primary or secondary, differ between ecosystem components and between species. The guidance does not address the issue of aggregation across spatial areas, should this be required. Aggregating across spatial areas can be avoided if all species and criteria are assessed at the same spatial scale and in the same assessment areas.
Figure 19. Levels and methods of integration for species under Descriptor 1
The integration methods of Figure 19 are:
Level 1: Measurements of individual parameters — for example abundance of individual species at different times of year (if appropriate) in different locations etc. — are combined into a single indicator for individual species. Integration at this level currently follows rules under development by Regional Sea Conventions, or under the Habitats Directive. Comparability of this level of integration requires technical consideration and is not addressed in this Guidance.
Level 2: Where there is more than one indicator for a particular criterion for a species, the indicators are combined to form a judgement on the status of the
ABPmer, November 2016, R.2733 | 79

Guidance for Assessments Under Article 8 of the Marine Strategy Framework Directive DG Environment
criterion. An integration method will be required, and should be agreed at regional or subregional level. However, in many cases, the ‘indicators’ will be equivalent to the criteria, and no integration will be required.
Level 3: The relevant criteria for each species are integrated to form a judgement on the status of each species. Different species may be represented by different numbers of criteria. The integration method for species covered by Annexes II, IV and V of the Habitats Directive (92/43/EEC) follows the integration method of that Directive, to provide a conclusion on status for the species. For commercially exploited species, the overall status is as assessed under Descriptor 3. For other species, the integration method should be agreed at Union level, taking into account regional or subregional specificities. D1C1 contributes to the assessment of D1C2 for the corresponding species.
Level 4: The results for each species are brought together to assess the species group. The integration method shall be agreed at Union level, taking into account regional or subregional specificities.
Level 5: The revised COM Dec only requires reporting of the status of the species group (not ecosystem component), but integration of species groups using one-out-all-out to express the overall status of the ecosystem component may be helpful for communication of assessment results and is included here for that purpose. The applicability of the one-out-all-out approach at this level is dependent on the integration method agreed upon for level 4.
The integration methods follow the species approach (integrating the various criteria for a single species to determine the status of that species). However, Member States may wish additionally to integrate or aggregate the information in alternative ways (such as aggregating species for a particular criterion) to investigate pressures and/or management responses required, or for reporting against specific targets or indicators at national level.
For D1C1, the levels of mortality are expressed for each species assessed. D1C1 needs to be addressed for those species at risk from incidental by-catch in the region or subregion. The underlying data need to provide details on the levels of mortality from individual fisheries and fishing gear to enable those métiers most contributing to incidental by-catches of each species to be identified.
Outstanding issues for D1 SpeciesThe integration approaches presented are based on the ‘species approach’ (rather than ‘criteria approach’) as required by the revised COM Dec. Some integration methods for particular integration levels and species types are still to be agreed at Union level, taking into account regional or subregional specificities. This may require further technical work which will be taken forward in due course. Where aggregation or down-scaling of assessments is necessary, this is likely to require further testing.
ABPmer, November 2016, R.2733 | 80
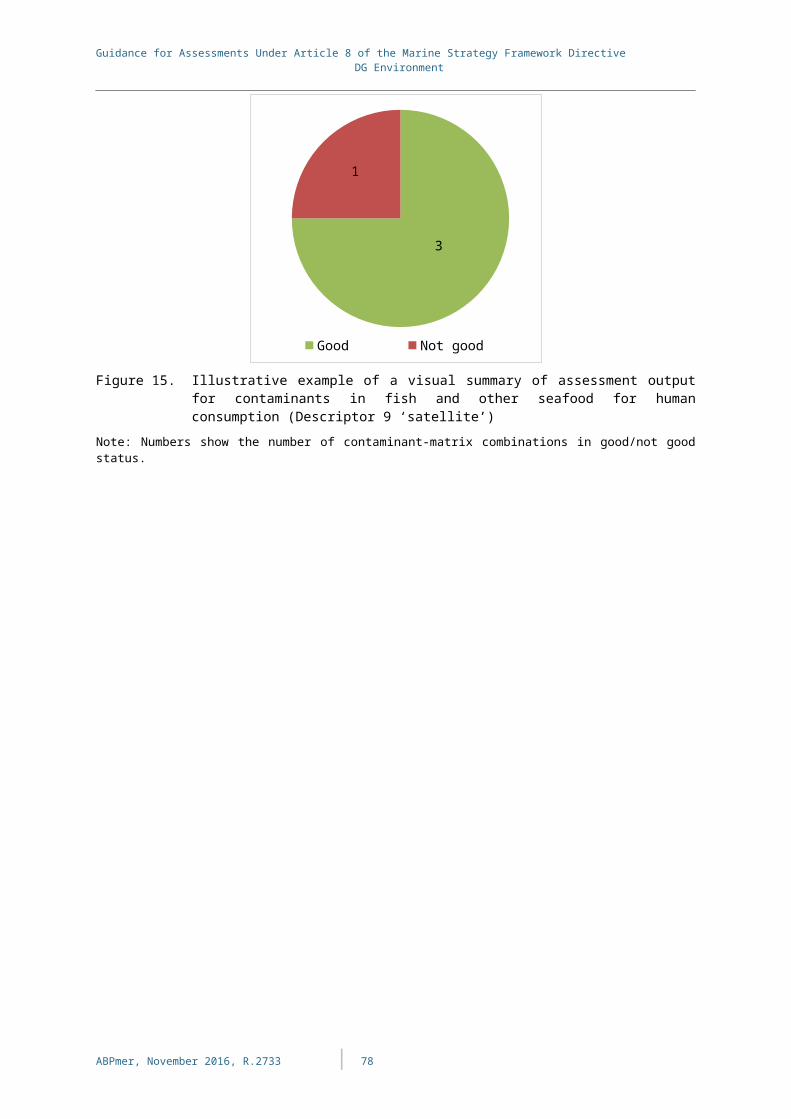
Guidance for Assessments Under Article 8 of the Marine Strategy Framework Directive DG Environment
4.2 BirdsThe primary and secondary criteria for birds for Descriptor 1, and their relationship to the indicators of Decision 2010/477/EU, are shown in Table 28.
Table 28. Criteria for assessment of birds (Descriptor 1)
Primary Criteria Relating to:
Secondary Criteria Relating to:
2010/477/EU Criteria or Indicators
Comments
D1C1 Mortality rate from by-catch
State
D1C2 Population abundance 1.2.1
D1C3 Population demographic characteristics
1.3.1
D1C4 Distributional range and pattern
1.1.11.1.2
Supporting habitat
D1C5 Habitat for the species –
Supporting habitat for species was mentioned in the D1 chapeau text in 2010/477/EU but not specifically included as an indicator
(1) For species of birds which are at risk from incidental by-catch in the region or subregion
Degree of Integration For Descriptor 1, criteria should be integrated within species, before species are integrated to species group. The integration stops at the species group level; species groups are not integrated to ecosystem component.
4.2.1 Assessment FlowThe assessment flow for birds under Descriptor 1 is described below.
Determine the elements for assessment: select speciesMember States should first draw up a list of the bird species that need to be considered for each bird species group, through regional or subregional cooperation. The main scientific criteria for selecting species should be taken into account (see Section 4.1.2). These species may be drawn from:
Directive 2009/147/EC (the Birds Directive); Regional Sea Conventions; Other sources.
In relation to D1C1, Member States should draw up a list of the bird species at risk from incidental by-catch in the region or subregion, through regional or subregional coordination. This should take into account the species in Table 1D of the Annex to Commission
ABPmer, November 2016, R.2733 | 81
Step 1
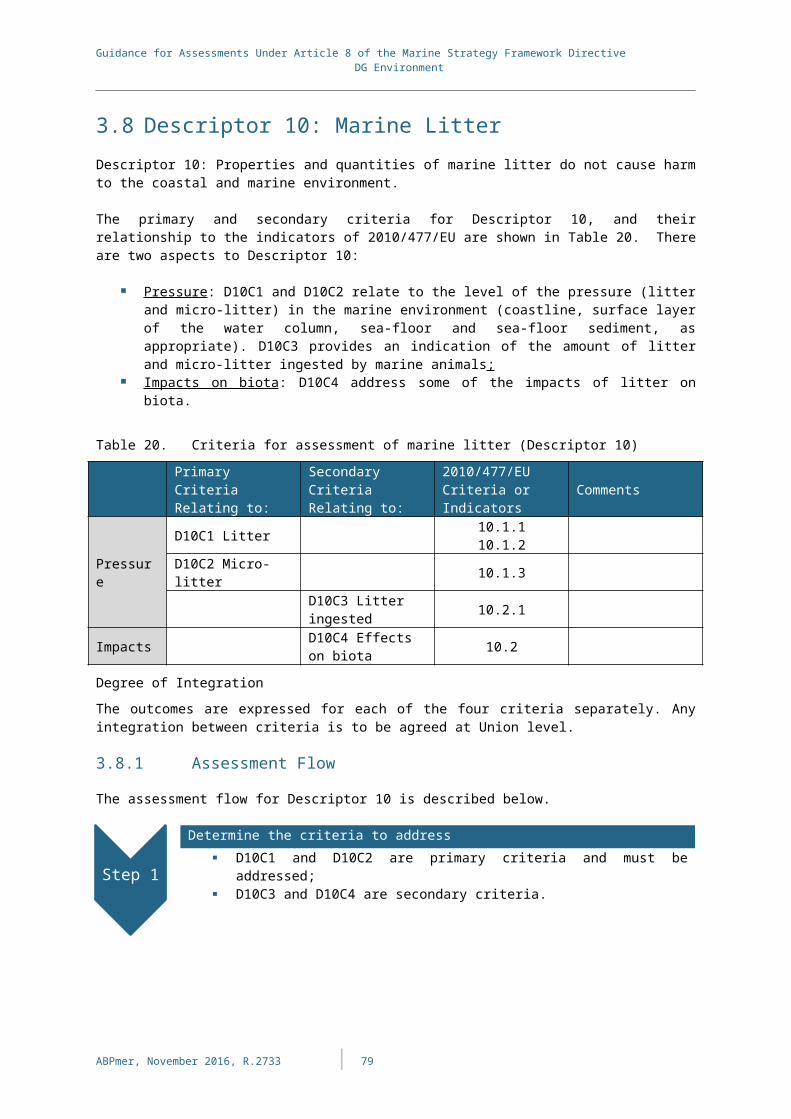
Guidance for Assessments Under Article 8 of the Marine Strategy Framework Directive DG Environment
implementing Decision (EU) 2016/1251, and can include other additional species, but does not need to include all the species. For the species on that list, D1C1 is a primary criterion. It contributes to the setting of threshold values for abundance under D1C2, and also contributes to the assessment of the corresponding species under D1C2 (for example, if D1C1 mortality exceeds the threshold value, this may influence the assessment of abundance of the species under D1C2).Determine the criteria to addressFor bird species, the criteria are as follows:
D1C1: Primary for bird species for which there is a significant problem of incidental by-catch in the region or subregion;
D1C2: Primary; D1C3: Secondary; D1C4: Secondary; D1C5: Secondary.
Determine scales and areas for assessmentMember States should determine the appropriate ecologically-relevant scales of assessment and assessment areas for each bird species group. The following are provided in the revised COM Dec:
Baltic Sea – region or subdivisions; North-East Atlantic Ocean – subregion; Mediterranean Sea – subregion; Black Sea – region or subdivisions.
Assign indicators Relevant regional indicators that are available should be identified
and allocated to the relevant species and criteria (mapping of RSC indicators against the revised COM Dec criteria is provided in Appendix A).
Assessments carried out under the Birds Directive should be used for those species, taking account of the different scales used.
Any remaining gaps should be identified. Use national assessments (taking into account existing assessments e.g. under EU legislation such as the Birds Directive), where available, pending the development of regionally coordinated assessments.
Additional national indicators for elements that are specific to national waters, if any, can also be incorporated and allocated to the relevant species and criteria. These need to have a threshold value, where appropriate, and should follow the agreed structure for reporting indicators (MSCG_17-2015-04), pending guidance on reporting requirements from WG DIKE.
Information from the Birds Directives can be used directly in the assessments:
D1C2 corresponds to ‘population size’ under the Birds Directive; D1C4 corresponds to ‘breeding distribution map and range’ under
the Birds Directive.Establish threshold valuesWhere required, threshold values should be established by Member States through regional or subregional cooperation:
D1C1: Threshold values required; D1C2: Threshold values should take account of variation in natural
population size and the mortality rates derived from D1C1, D8C4 and D10C4 and other relevant pressures.
D1C3: Threshold values should take account of adverse effects on their health derived from D8C2, D8C4 and other relevant pressures.
D1C4: Threshold values required.
ABPmer, November 2016, R.2733 | 82
Step 2
Step 3
Step 4
Step 5

Guidance for Assessments Under Article 8 of the Marine Strategy Framework Directive DG Environment
D1C5: No threshold values.Determine if threshold values are achieved
The status of each relevant criterion for each species should be determined, based on the value of the indicator or criterion compared to the thresholds established in step 5. D1C1 contributes to the assessment of D1C2 for the species.
Integrate indicators and criteria The indicators should be integrated to criteria (if there is more than
one indicator for a criterion), and the individual criteria should be integrated to determine the overall status for an individual species;
The overall status of the species group should be determined, based on the outcomes for the representative species;
Integration methods are described in Section 4.2.2.
4.2.2 Levels and Methods of IntegrationFigure 20 shows the levels of integration and integration methods for birds under Descriptor 1. The figure is representative of a single assessment area.
Figure 20. Levels and methods of integration for birds under Descriptor 1Notes: * D1C1 is primary for species identified as being at risk from incidental by-catch in the region or subregion, (i.e. also included on the list of species for D1C1). Criteria from other pressure descriptors may also be taken into account when setting threshold values for D1C2 (e.g. C8C4, D10C4).
The integration methods of Figure 20 are:
ABPmer, November 2016, R.2733 | 83
Step 6
Step 7

Guidance for Assessments Under Article 8 of the Marine Strategy Framework Directive DG Environment
Level 1: Measurements of individual parameters — for example of seabird breeding success, abundance of individual species at different times of year in different locations etc. — are combined into a single indicator, such as ‘breeding status of marine birds’. Integration at this level currently follows rules under development by the RSCs. Comparability of this level of integration requires technical consideration and is not addressed in this Guidance.
Level 2: Where there is more than one indicator for a particular criterion for a species, the indicators are combined to form a judgement on the status of the criterion. The integration method is not yet defined (see box below). However, in many cases, the ‘indicators’ will be equivalent to the criteria, and no integration will be required.
Level 3: The relevant criteria for each species are integrated to form a judgement on the status of each species. D1C1 contributes to the assessment of D1C2 for the corresponding species. Different species may be represented by different numbers of criteria. The integration method should be agreed at Union level, taking into account regional or subregional specificities. See box below.
Level 4: The results for each species are brought together to the species group. The integration method shall be agreed at Union level, taking into account regional or subregional specificities. See box below.
Level 5: The revised COM Dec only requires reporting of the status of each species group (not the overall ecosystem component), but integration of species groups using OOAO to express the overall status of the birds ecosystem component may be helpful for communication of assessment results and is included here for that purpose. The applicability of the OOAO approach at this level is dependent on the integration method agreed upon for level 4.
Integration methods for D1 BirdsThe integration methods for Descriptor 1 (Birds) still need to be determined, and the revised COM Dec has provided the scope for this to be taken forward and agreed at Union level, taking into account regional or subregional specificities. For the North-East-Atlantic and the Baltic Sea this can be further developed with the help of expert recommendation from the Joint OSPAR/HELCOM/ICES Expert Group on Seabirds (JWGBIRD).
Until such an integration method is agreed, this Guidance recommends the following: Level 2: OOAO, (weighted) averaging or expert judgement; Level 3: All criteria used should be within threshold values; Level 4: To use the currently-agreed regional method (if available), or a
conditional rule, based on a specific number or proportion of species in a species group achieving good status. For example, if x of y species are in good status, the species group is considered to be in good status. The value of x would be defined by Member States. Safeguards may be needed (e.g. a conditional rule) to ensure that a species group is not assessed as ‘good’ status if some species are in a critical state.
Missing indicators
If a primary criterion cannot be assessed for a species due to a lack of data then the resultant assessment of that species cannot be assigned a status (i.e. it is ‘not assessed’). It also means that the Member State needs to take immediate action on monitoring and assessment tools to ensure that at the next update under Article 8 MSFD an assessment is undertaken.
4.2.3 Visualising Assessment Results for BirdsInitial outline of assessment outcomes based on revised COM Dec, with illustrative examples. Subject to modification based on finalising 2018 reporting requirements, which will be determined by WG DIKE.
ABPmer, November 2016, R.2733 | 84

Guidance for Assessments Under Article 8 of the Marine Strategy Framework Directive DG Environment
The assessment output for Descriptor 1 component ‘Birds’ is presented for the region or subdivisions or subregion:
By criterion for each species; The overall status of each species; The overall status of the species group.
The assessment output can be presented as shown in Table 29 (shown for a single species group).
In addition to the presentation of results by criteria, overall for individual species, and overall for the species group, a summary can be provided in graphical format (Figure21(a)) for the individual species groups of the Birds ecosystem component.
In addition, if desired, the overall status of the ecosystem component can be presented, for the purposes of communication of assessment results, as the ‘pizza slice’ for the Birds ecosystem component in the scheme for integrated presentation of assessment results (pizza-satellite scheme) (Figure 21(b)).
Table 29 Initial outline and illustrative example for presenting the assessment output for Descriptor 1 (Birds) for a single species group for the region or subregion
Species
D1C1 D1C2 D2C3 D1C4 D1C5
Ove
rall
stat
us
Thre
shol
d
Valu
e
Tren
d
Thre
shol
d
Valu
e
Tren
d
Thre
shol
d
Valu
e
Tren
d
Thre
shol
d
Valu
e
Tren
d
Thre
shol
d
Valu
e
Tren
d
Species 1
n/a n/a n/a 20,000 18,790 Stable n/a
n/a n/a n/a n/a n/a n/a n/a n/a Not good
Species 2
500 350 Stable 11,500 14,251 Stable n/a
n/a n/a n/a n/a n/a n/a n/a n/a Good
Species 3
1500
2059
Increase
8,000 5,554 Decrease
n/a
n/a n/a n/a n/a n/a n/a n/a n/a Not good
Species 4
n/a n/a n/a 220,000
231,911
Increase
n/a
n/a n/a 1,800 2,000 Decrease
n/a n/a n/a Good
Species 5
n/a n/a n/a 280,000
294,373
N/A n/a
n/a n/a n/a n/a n/a n/a n/a n/a Good
etc.N/A = Not Assessed
Overall status of species group: Good (method for determining status of the species group is to be agreed at Union level, taking into account regional or subregional specificities)
ABPmer, November 2016, R.2733 | 85
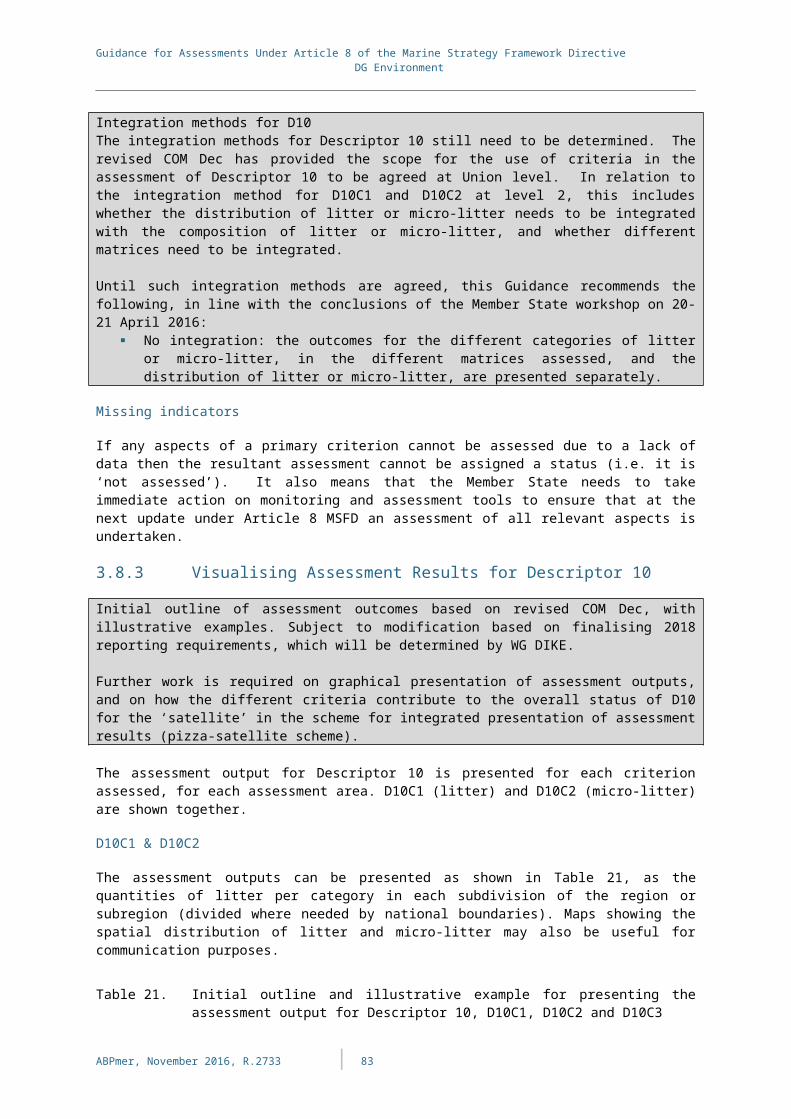
Guidance for Assessments Under Article 8 of the Marine Strategy Framework Directive DG Environment
(a) By species group (b) For the ecosystem component
Graz-ing birds(4/7)
Wad-ing birds(3/3)Surface-feeding
birds(3/4)
Pelagic-
feeding
birds(2/5)
Benthic-
feeding
birds(4/5)
Birds
Mammals
Reptiles
Fish
Cephalo-pods
Pelagic habitats
Benthic habitats
Figure 21. Illustrative example of a visual summary of assessment outputs for Descriptor 1 Birds
Note: Numbers in brackets in (a) show the number of species in good status, compared to the total number of species in the species group. In this example, if 75% of species in a species group are in good status then the species group is in good status.
ABPmer, November 2016, R.2733 | 86
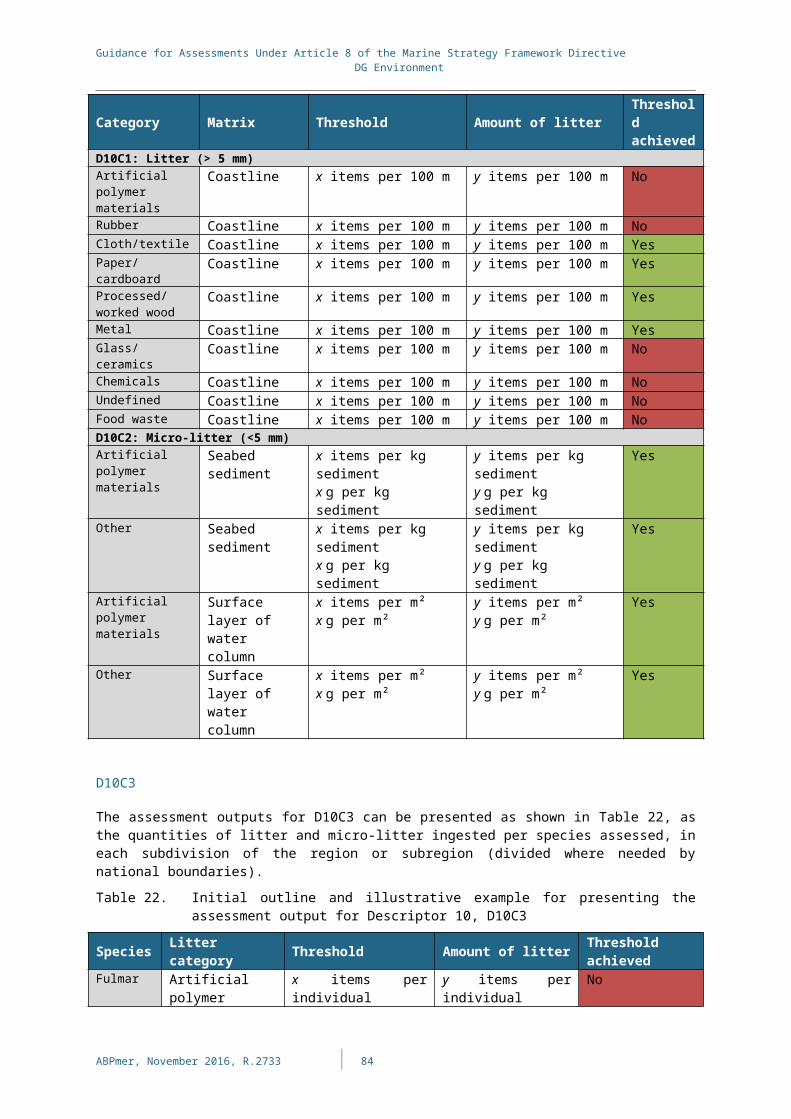
Guidance for Assessments Under Article 8 of the Marine Strategy Framework Directive DG Environment
4.3 MammalsAll marine mammal species in European waters are listed in Annex II, IV or V of Directive 92/43/EEC, therefore the primary and secondary criteria for mammals under Descriptor 1 are shown in Table 30. Table 30. Criteria for assessment of mammals (Descriptor 1)
Primary Criteria Relating to:
Secondary Criteria Relating to:
2010/477/EU Criteria or Indicators
Comments
D1C1 Mortality rate from by-catch (1)
State
D1C2 Population abundance
1.2.1
D1C3 Population demographic characteristics
1.3.1
D1C1 Distributional range and pattern
1.1.11.1.2
Supporting habitat
D1C5 Habitat for the species –
Supporting habitat for species was mentioned in the D1 chapeau text in 2010/477/EU but not specifically included as an indicator
(1) For species of mammals which are at risk from incidental by-catch in the region or subregion
Degree of IntegrationFor Descriptor 1, criteria should be integrated within species, before species are integrated to species group. The integration stops at the species group level; species groups are not integrated to ecosystem component.
4.3.1 Assessment FlowThe assessment flow for mammals under D1 is described below.
Determine elements for assessment: Select speciesMember States should first draw up a list of the mammal species that need to be considered for each mammal species group, through regional or subregional cooperation. The main scientific criteria for selecting species should be taken into account (see Section 4.1.2). These species may be drawn from:
Directive 92/43/EEC (Habitats Directive) (note: even though all species are listed, Member States need to decide which of these to assess for MSFD purposes to represent each of the mammal species groups. All species listed in Annex II must be included (where relevant) — grey seal, Monk seal, harbour seal, bottlenose dolphin and harbour porpoise);
Regional Sea Conventions; Other sources, such as the Agreement on Conservation of Small
Cetaceans in the Baltic, North East Atlantic, Irish and North Seas
ABPmer, November 2016, R.2733 | 87
Step 1

Guidance for Assessments Under Article 8 of the Marine Strategy Framework Directive DG Environment
(ASCOBANS) and Red Lists.
In relation to D1C1, Member States should draw up a list of the mammal species at risk from incidental by-catch in the region or subregion, through regional or subregional coordination. This should take into account the species in Table 1D of the Annex to Commission implementing Decision (EU) 2016/1251, and can include other additional species, but does not need to include all the species. For the species on that list, D1C1 is a primary criterion. It contributes to the setting of threshold values for abundance under D1C2, and also contributes to the assessment of the corresponding species under D1C2 (for example, if D1C1 mortality exceeds the threshold value, this may influence the assessment of abundance of the species under D1C2).Determine criteria to addressAll mammals are covered by Annexes II, IV or V to Directive 92/43/EEC, therefore, the criteria are as follows:
D1C1: Primary for mammal species for which there is a significant problem of incidental by-catch in the region or subregion;
D1C2: Primary; D1C3: Primary; D1C4: Primary;
D1C5: Primary.Determine scales and areas for assessmentMember States should determine the appropriate ecologically-relevant scales of assessment and assessment areas for each mammal species group. The following are provided in the revised COM Dec:
Baltic Sea:o For small-toothed cetaceans: Region or subdivisions;o For seals: Region or subdivisions;
North-East Atlantic Ocean:o For deep-diving toothed cetaceans and baleen whales:
Region;o For small-toothed cetaceans: Subregion;o For seals: Subregion;
Mediterranean Sea:o For deep-diving toothed cetaceans and baleen whales:
Region;o For small-toothed cetaceans: Subregion;o For seals: Subregion;
Black Sea:o For deep-diving toothed cetaceans and baleen whales:
Region;o For small-toothed cetaceans: region or subdivisions.
Assign indicators Relevant regional indicators that are available should be identified
and allocated to the relevant species and criteria (mapping of RSC indicators against the revised COM Dec criteria is provided in Appendix A).
Assessments carried out under the Habitats Directive should be used, taking account of the different assessment scales:o D1C2 and D1C3 equate to ‘population’ under the Habitats
Directive;o D1C4 equates to ‘range’ under the Habitats Directive;o D1C5 equates to ‘habitat for the species’ under the Habitats
Directive. Any remaining gaps should be identified. Use national
assessments where available, pending the development of
ABPmer, November 2016, R.2733 | 88
Step 2
Step 3
Step 4

Guidance for Assessments Under Article 8 of the Marine Strategy Framework Directive DG Environment
regionally coordinated assessments. Additional national indicators for elements that are specific to
national waters, if any, can also be incorporated and allocated to the relevant species and criteria. These need to have a threshold value, and should follow the agreed structure for reporting indicators (MSCG_17-2015-04), pending guidance on reporting requirements from WG DIKE.
Establish threshold valuesWhere required, threshold values should be established by Member States through regional or subregional cooperation:
D1C1: Threshold values required; D1C2: Threshold values should be consistent with the Favourable
Reference Population values. They should take account of variation in natural population size and the mortality rates derived from D1C1, D8C4 and D10C4 and other relevant pressures.
D1C3: Threshold values should take account of adverse effects on their health derived from D8C2, D8C4 and other relevant pressures.
D1C4: Threshold values should be consistent with the Favourable Reference Range values.
D1C5: No threshold values.Determine if threshold values are achieved
The overall status for each species should be derived using the method provided under the Habitats Directive. D1C1 may contribute to the assessment of D1C2 for the species.
Integrate species The overall status of the species group should be determined,
based on the outcomes for the representative species; Integration methods are described in Section 4.2.2.
4.3.2 Levels and Methods of IntegrationFigure 22 shows the levels of integration and integration methods for mammals under Descriptor 1. The figure is representative of a single assessment area.
ABPmer, November 2016, R.2733 | 89
Step 5
Step 6
Step 7

Guidance for Assessments Under Article 8 of the Marine Strategy Framework Directive DG Environment
Figure 22. Levels and methods of integration for mammals under Descriptor 1Notes: * D1C1 is primary for species identified as being at risk from incidental by-catch in the region or subregion, (i.e. also included on the list of species for D1C1). Criteria from other pressure descriptors may also be taken into account when setting threshold values for D1C2 (e.g. C8C4, D10C4).
The integration methods of Figure 22 are:
Level 1: Measurements of individual parameters — for example of distributional range, pup production, abundance of individual species at different times of year in different locations etc. — are combined into a single indicator, such as ‘abundance of grey seals at breeding and haul-out sites, respectively’. This level of integration is not addressed in these guidelines.
Level 2: Where there is more than one indicator for a species for a particular criterion (e.g. habitat extent and habitat quality), the indicators are combined to form a judgement of the status for each criterion. The integration method is as applied under the Habitats Directive.
Level 3: The relevant criteria for each species are integrated to form a judgement on the status for each species (different species may be represented by different numbers of criteria). The integration method is that used under the Habitats Directive (OOAO, and there must be information on at least two parameters (criteria) to provide a judgement of Favourable Conservation Status for a species), such that the species’ status is the same as that under the Habitats Directive (see Table 31). D1C1 contributes to the assessment of D1C2 for the corresponding species.
Level 4: The results for each species are brought together to the species group. The integration method shall be agreed at Union level, taking into account regional or subregional specificities. See box below.
ABPmer, November 2016, R.2733 | 90

Guidance for Assessments Under Article 8 of the Marine Strategy Framework Directive DG Environment
Level 5: The revised COM Dec only requires reporting of the status of the species group (not ecosystem component), but integration of species groups using OOAO to express the overall status of the mammals ecosystem component may be helpful for communication of assessment results and is included here for that purpose. The applicability of the OOAO approach at this level is dependent on the integration method agreed upon for level 4.
Where regional indicators group species together for a single criterion, the outcomes for the individual species can be incorporated into the assessment for a species level assessment. The regional indicators focused on a single criterion may reveal additional information which is useful for management purposes (e.g. many species are failing to achieve good status due to persistent breeding failures or due to habitat loss or deterioration).
Table 31. Habitats Directive status categories and corresponding status for MSFD assessment
Habitats Directive Status Corresponding Status for MSFD Assessment
Trends for MSFD Assessment
(FV) - Favourable Good(U1) - Inadequate Not good(U1-) - Inadequate and deteriorating Not good Deteriorating(U1+) - Inadequate but improving Not good Improving(U2) - Bad Not good(U2-) - Bad and deteriorating Not good Deteriorating(U2+) - Bad but improving Not good Improving(XX) - Unknown Not known
Integration methods for D1 MammalsThe integration method for Descriptor 1 (Mammals) at level 4 still needs to be determined, and the revised COM Dec has provided the scope for this to be taken forward and agreed at Union level, taking into account regional or subregional specificities.
Until such an integration method is agreed, this Guidance recommends the following: Level 4: All species assessed should be at good status for the species group to be
at good status.
Existing assessment frameworks include:
Framework Integration Approach (level 3) Integration Approach (level 4)MammalsHabitats Directive
Integration of criteria within species, using OOAO. There must be information on at least two parameters to provide a judgement on favourable conservation status for a species.
N/a
Missing indicators
If a primary criterion cannot be assessed for a species due to a lack of data then the resultant assessment of that criterion for the species cannot be assigned a status (i.e. it is ‘not assessed’). Under the Habitats Directive, a judgement of status can be provided for a species if there is information on at least two parameters (criteria), therefore a judgement of status for the species may be possible if information on only one criterion is missing. However, it also means that the Member State needs to take immediate action
ABPmer, November 2016, R.2733 | 91

Guidance for Assessments Under Article 8 of the Marine Strategy Framework Directive DG Environment
on monitoring and assessment tools to ensure that at the next update under Article 8 MSFD an assessment of the criterion is undertaken.
4.3.3 Visualising Assessment Results for MammalsA similar approach to birds can be used, using the relevant criteria for mammals, and appropriate integration approaches. Subject to modification based on finalising 2018 reporting requirements, which will be determined by WG DIKE.
ABPmer, November 2016, R.2733 | 92

Guidance for Assessments Under Article 8 of the Marine Strategy Framework Directive DG Environment
4.4 ReptilesAll marine reptile species are listed in Annex II, IV or V of Directive 92/43/EEC, therefore the primary and secondary criteria for reptiles under Descriptor 1 are the same as for mammals and are shown in Table 30.Degree of IntegrationFor Descriptor 1, criteria should be integrated within species, before species are integrated to species group. There is only one species group for reptiles (turtles).
4.4.1 Assessment FlowThe assessment flow is the same as for mammals. For ‘Step 3 – Determine scales and areas for assessment’, Member States should determine the appropriate scale of assessment and assessment areas for the marine reptile species group. The following are provided in the revised COM Dec22:
Baltic Sea – region or subdivisions; North-East Atlantic Ocean – subregion; Mediterranean Sea – subregion.
4.4.2 Levels and Methods of IntegrationFigure 23 shows the levels of integration and integration methods for reptiles under Descriptor 1. The figure is representative of a single assessment area.
The integration methods of Figure 23 are:
Level 1: Measurements of individual parameters — for example of distributional range, abundance of individual species at different times of year in different locations etc. — are combined into a single indicator. This level of integration is not addressed in these guidelines.
Level 2: Where there is more than one indicator for a species for a particular criterion (e.g. habitat extent and habitat quality), the indicators are combined to form a judgement for each criterion. The integration method as specified in the revised COM Dec is OOAO.
Level 3: The relevant criteria for each species are integrated to form a judgement of the status for each species (different species may be represented by different numbers of criteria). The integration method is that used under the Habitats Directive (OOAO, and there must be information on at least two parameters (criteria) to provide a judgement of Favourable Conservation Status for a species), such that the species’ status is the same as that under the Habitats Directive (see Table 31).
Level 4: The results for each species are brought together to the species group. The integration method shall be agreed at Union level, taking into account regional or subregional specificities. See box below.
Level 5: There is no integration across species groups to the ecosystem component.
22 There are no reptiles in the Black Sea.
ABPmer, November 2016, R.2733 | 93

Guidance for Assessments Under Article 8 of the Marine Strategy Framework Directive DG Environment
Figure 23. Levels and methods of integration for reptiles under Descriptor 1Notes: * D1C1 is primary for species identified as being at risk from incidental by-catch in the region or subregion, (i.e. also included on the list of species for D1C1). Criteria from other pressure descriptors may also be taken into account when setting threshold values for D1C2 (e.g. C8C4, D10C4).
Integration methods for D1 ReptilesThe integration method for Descriptor 1 (Reptiles) at level 4 still needs to be determined, and the revised COM Dec has provided the scope for this to be taken forward and agreed at Union level, taking into account regional or subregional specificities.
Until such an integration method is agreed, this Guidance recommends the following: Level 4: All species should be at good status for the species group to be at good
status.
Missing indicators
If a primary criterion cannot be assessed for a species due to a lack of data then the resultant assessment of that criterion for the species cannot be assigned a status (i.e. it is ‘not assessed’). Under the Habitats Directive, a judgement of status can be provided for a species if there is information on at least two parameters (criteria), therefore a judgement of status for the species may be possible if information on only one criterion is missing. However, it also means that the Member State needs to take immediate action on monitoring and assessment tools to ensure that at the next update under Article 8 MSFD an assessment of the criterion is undertaken.
4.4.3 Visualising Assessment Results for ReptilesA similar approach to birds can be used, using the relevant criteria for reptiles, and
ABPmer, November 2016, R.2733 | 94

Guidance for Assessments Under Article 8 of the Marine Strategy Framework Directive DG Environment
appropriate integration approaches. Subject to modification based on finalising 2018 reporting requirements, which will be determined by WG DIKE.
ABPmer, November 2016, R.2733 | 95

Guidance for Assessments Under Article 8 of the Marine Strategy Framework Directive DG Environment
4.5 FishThe primary and secondary criteria for fish under Descriptor 1 depend on whether the species is listed in Annex II, IV or V of Directive 92/43/EEC, or is a commercially exploited species that is also assessed under Descriptor 3 (Table 32).Table 32. Criteria for assessment of fish (Descriptor 1)
Primary Criteria Relating to:
Secondary Criteria Relating to:
2010/477/EU Criteria or Indicators
Comments
D1C1 Mortality rate from by-catch (1)
State
D1C2 Population abundance (2) 1.2.1D1C3 Population demographic characteristics (2)
D1C3 Population demographic characteristics (3)
1.3.1
D1C4 Distributional range and pattern (4)
D1C4 Distributional range and pattern (5)
1.1.11.1.2
Supporting habitat
D1C5 Habitat for the species (4)
D1C5 Habitat for the species (5) –
Supporting habitat for species was mentioned in the D1 chapeau text in 2010/477/EU but not specifically included as an indicator
(1) For species of non-commercially exploited fish which are at risk from incidental by-catch in the region or subregion.
(2) For commercially exploited fish species. D3C2 is used for D1D2 and D3C3 is used for D1C3.(3) For non-commercially exploited fish species.(4) For fish species listed in Annex II, IV or V to Directive 92/43/EEC.(5) For fish species not listed in Annex II, IV or V to Directive 92/43/EEC.
Criterion D1C3 is either primary or secondary, depending on whether the fish species is commercially exploited or not. Criteria D1C4 and D1C5 are either primary or secondary, depending on whether the fish species is covered by Annexes II, IV or V to Directive 92/43/EEC (see Step 2 in Section 4.2.1).Degree of Integration For Descriptor 1, criteria should be integrated within species, before species are integrated to species group. The integration stops at the species group level; species groups are not integrated to ecosystem component.
4.5.1 Assessment FlowThe assessment flow for fish under Descriptor 1 is described below.
Determine the elements for assessment: select speciesMember States should first draw up a list of the fish species that need to be considered for each fish species group, through regional or subregional cooperation. The main scientific criteria for selecting species should be taken into account (see Section 4.1.2). These species may be drawn
ABPmer, November 2016, R.2733 | 96

Guidance for Assessments Under Article 8 of the Marine Strategy Framework Directive DG Environment
from: Directive 92/43/EEC (Habitats Directive); The Common Fisheries Policy (Regulation (EU) No 1380/2013); Regional Sea Conventions; Other sources such as Red Lists.
Several fish species groups include commercially exploited species, therefore it is expected that Descriptor 3 species will be included in the species lists for Descriptor 1 Fish assessments.
In relation to D1C1, Member States should draw up a list of the fish species at risk from incidental by-catch in the region or subregion, through regional or subregional coordination. This should take into account the species in Table 1D of the Annex to Commission Implementing Decision (EU) 2016/1251, and can include other additional species, but does not need to include all the species. For the species on that list, D1C1 is a primary criterion. It contributes to the setting of threshold values for abundance under D1C2, and also contributes to the assessment of the corresponding species under D1C2 (for example, if D1C1 mortality exceeds the threshold value, this may influence the assessment of abundance of the species under D1C2).Determine the criteria to addressFor fish species, the criteria are as follows:
D1C1: Primary for fish species for which there is a significant problem of incidental by-catch in the region or subregion;
D1C2: Primary; D1C3: Primary for commercially exploited species (assessed under
Descriptor 3), otherwise secondary; D1C4: Primary for fish species covered by Annexes II, IV or V to the
Habitats Directive, otherwise secondary; D1C5: Primary for fish species covered by Annexes II, IV or V to the
Habitats Directive, otherwise secondary.Determine scales and areas for assessmentMember States should determine the appropriate ecologically-relevant scales of assessment and assessment areas for each fish species group. The following are provided in the revised COM Dec:
Baltic Sea:o Coastal fish: Subdivision of region;o Pelagic shelf fish and demersal shelf fish: Region or
subdivisions;o Deep-sea fish: Region;
North-East Atlantic Ocean:o Coastal fish: Subdivision of subregion;o Pelagic shelf fish and demersal shelf fish: Subregion;o Deep-sea fish: Region;
Mediterranean Sea:o Coastal fish: Subdivision of subregion;o Pelagic shelf fish and demersal shelf fish: Subregion;o Deep-sea fish: Region
Black Sea:o Coastal fish: Subdivision of region;o Pelagic shelf fish and demersal shelf fish: Region or
subdivisions;o Deep-sea fish: Region;
Populations of commercially exploited species should be assessed at the same scales as under Descriptor 3 (ecologically-relevant scales for each population (stock) with the overall assessment presented for each region
ABPmer, November 2016, R.2733 | 97
Step 1
Step 2
Step 3

Guidance for Assessments Under Article 8 of the Marine Strategy Framework Directive DG Environment
or subregion for those populations that occur within it. The outcome for each population should be incorporated into the Descriptor 1 (Fish) assessment in the appropriate species group.Assign indicators
Relevant regional indicators that are available should be identified and allocated to the relevant species and criteria (mapping of RSC indicators against the revised COM Dec criteria is provided in Appendix A).
Criteria assessments carried out for commercially exploited species under Descriptor 3 should be used for those species:
o D3C2 ‘spawning stock biomass’ should be used for D1C2 ‘abundance’;
o D3C3 ‘age/size structure’ should be used for D1C3 ‘population demographic characteristics’.
Assessments carried out under the Habitats Directive should be used for those species:
o ‘population’ should be used for D1C2 and D1C3;o ‘range’ should be used for D1C4;o ‘habitat for the species’ should be used for D1C5.
Any remaining gaps should be identified. Use national assessments where available, pending the development of regionally coordinated assessments.
Additional national indicators for elements that are specific to national waters, if any, can also be incorporated and allocated to the relevant species and criteria. These need to have a threshold value, and should follow the agreed structure for reporting indicators (MSCG_17-2015-04), pending guidance on reporting requirements from WG DIKE .
Establish threshold valuesWhere required, threshold values should be established by Member States through regional or subregional cooperation:
D1C1: Threshold values required; D1C2: Threshold values required. They should take account of
variation in natural population size and the mortality rates derived from D1C1, D8C4 and D10C4 and other relevant pressures. For commercially exploited species, they should be the values under Descriptor 3. For species covered by the Habitats Directive, they should be consistent with the Favourable Reference Population values.
D1C3: Threshold values should take account of adverse effects on their health derived from D8C2, D8C4 and other relevant pressures. For commercially exploited species, they should be the values under Descriptor 3.
D1C4: Threshold values should be consistent with the Favourable Reference Range values.
D1C5: No threshold values.Determine if threshold values are achieved
The status of each relevant criterion for each species (or population/stock for commercially exploited species) should be determined, based on the value of the indicator or criterion compared to the thresholds established in step 5. D1C1 contributes to the assessment of D1C2 for the corresponding species.
For commercially exploited species, the population status should be as assessed under Descriptor 3.
Integrate indicators, criteria and species The indicators should be integrated to criteria (if there is more than
ABPmer, November 2016, R.2733 | 98
Step 4
Step 5
Step 6
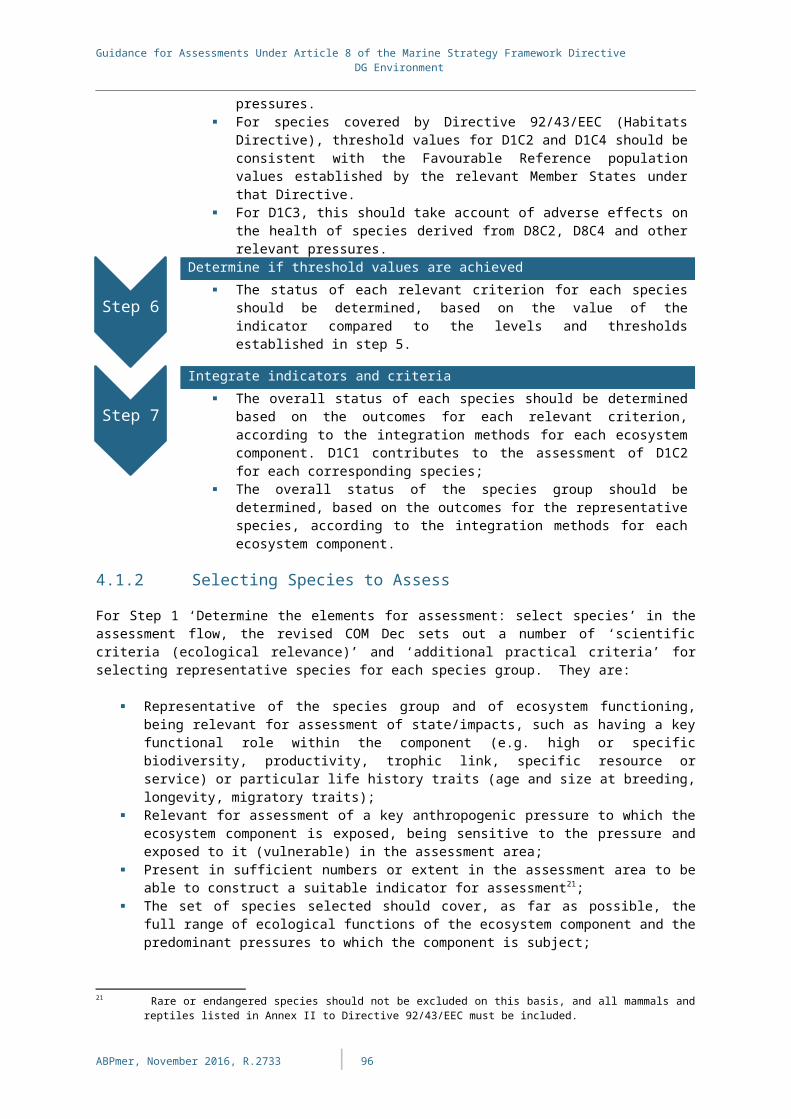
Guidance for Assessments Under Article 8 of the Marine Strategy Framework Directive DG Environment
one indicator for a criterion), and the individual criteria should be integrated to determine the overall status for an individual species;
The overall status of the species group should be determined, based on the outcomes for the representative species;
Integration methods are described in Section 4.5.2.
4.5.2 Levels and Methods of IntegrationFigure 24 shows the levels of integration and integration methods for fish under Descriptor 1. The figure is representative of a single assessment area.
Figure 24. Levels and methods of integration for fish under Descriptor 1Notes: * D1C1 is primary for species identified as being at risk from incidental by-catch in the region or subregion, (i.e. also included on the list of species for D1C1). Criteria from other pressure descriptors may also be taken into account when setting threshold values for D1C2 (e.g. C8C4, D10C4). Where by-catch information for commercially exploited species is taken into account in stock assessments which are used to assess D3C2 (and hence D1C2), it is not necessary to consider this information again.
The integration methods of Figure 24 are:
Level 1: Measurements of individual parameters — for example of distributional range, spawning stock biomass, length distribution etc. — are combined into a single indicator. This level of integration is not addressed in this Guidance.
Level 2: Where there is more than one indicator for a particular criterion for a species, the indicators are combined to form a judgement on the status of the criterion. The integration method is not yet defined (see box below). However, in
ABPmer, November 2016, R.2733 | 99
Step 7

Guidance for Assessments Under Article 8 of the Marine Strategy Framework Directive DG Environment
many cases, the ‘indicators’ will be equivalent to the criteria, and no integration will be required.
Level 3: The relevant criteria for each species are integrated to form a judgement on the status for each species. D1C1 contributes to the assessment of D1C2 for the corresponding species. Different species may be represented by different numbers of criteria. The integration method depends on the species type (whether under the Habitats Directive or not, or commercially exploited). For Habitats Directive species, the method is that used under the Habitats Directive (OOAO, and there must be information on at least two parameters (criteria) to provide a judgement of Favourable Conservation Status for a species) (see Table31). For commercially exploited species, the status from the assessment under D3 should be used. For other species, the integration method shall be agreed at Union level, taking into account regional or subregional specificities (see box below).
Level 4: The results for each species are brought together to the species group. The integration method shall be agreed at Union level, taking into account regional or subregional specificities. See box below.
Level 5: The revised COM Dec only requires reporting of the status of the species group (not ecosystem component), but integration of species groups using OOAO to express the overall status of the fish ecosystem component may be helpful for communication of assessment results and is included here for that purpose. The applicability of the OOAO approach at this level is dependent on the integration method agreed upon for level 4.
Integration methods for D1 FishThe integration methods for Descriptor 1 (Fish) still need to be determined for species that are not covered by the Habitats Directive or commercially exploited, and the revised COM Dec has provided the scope for this to be taken forward and agreed at Union level, taking into account regional or subregional specificities.
Until such an integration method is agreed, this Guidance recommends the following: Level 3: For non-commercially exploited species that are not covered by the
Habitats Directive: OOAO across the criteria used. In many cases this is likely to be only one criterion (D1C2) therefore the outcome for the criterion would be the outcome for the species.
Level 4: Use the currently-agreed regional method (if available), or a conditional rule, based on a specific number or proportion of species in a species group achieving good status. For example, if x of y species are in good status, the species group is considered to be in good status. The value of x would be defined by Member States. Safeguards may be needed (e.g. a conditional rule) to ensure that a species group is not assessed as ‘good’ status if some species are in a critical state.
Missing indicators
If a primary criterion cannot be assessed for a species due to a lack of data then the resultant assessment of the criterion for that species cannot be assigned a status (i.e. it is ‘not assessed’). For Habitats Directive species, a judgement of status can be provided for a species if there is information on at least two parameters (criteria), therefore a judgement of status for the species may be possible if information on only one criterion is missing. It also means that the Member State needs to take immediate action on monitoring and assessment tools to ensure that at the next update under Article 8 MSFD an assessment of the criterion is undertaken.
4.5.3 Visualising Assessment Results for FishA similar approach to birds can be used, using the relevant criteria for fish, and appropriate integration approaches. Subject to modification based on finalising 2018 reporting requirements, which will be determined by WG DIKE.
ABPmer, November 2016, R.2733 | 100
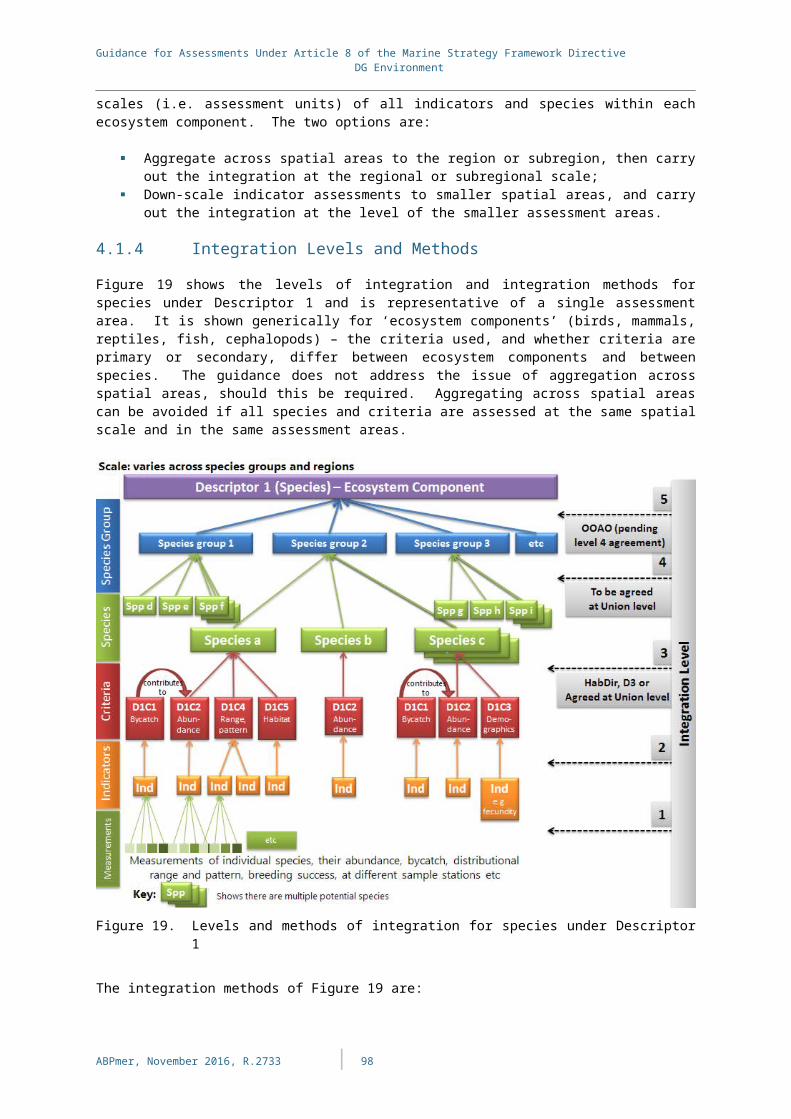
Guidance for Assessments Under Article 8 of the Marine Strategy Framework Directive DG Environment
ABPmer, November 2016, R.2733 | 101

Guidance for Assessments Under Article 8 of the Marine Strategy Framework Directive DG Environment
4.6 CephalopodsNo cephalopod species are listed in Directive 92/43/EEC, therefore the primary and secondary criteria depend on whether the species is commercially exploited and therefore also assessed under Descriptor 3 (Table 33).Table 33. Criteria for assessment of cephalopods (Descriptor 1)
Primary Criteria Relating to:
Secondary Criteria Relating to:
2010/477/EU Criteria or Indicators
Comments
D1C1 Mortality rate from by-catch (1)
State
D1C2 Population abundance (2) 1.2.1D1C3 Population demographic characteristics (2)
D1C3 Population demographic characteristics (3)
1.3.1
D1C1 Distributional range and pattern
1.1.11.1.2
Supporting habitat
D1C5 Habitat for the species –
Supporting habitat for species was mentioned in the D1 chapeau text in 2010/477/EU but not specifically included as an indicator
(1) For species of non-commercially exploited cephalopods which are at risk from incidental by-catch in the region or subregion.
(2) Commercially exploited cephalopod species(3) Non-commercially exploited cephalopod species
Degree of Integration For Descriptor 1, criteria should be integrated within species, before species are integrated to species group. The integration stops at the species group level; species groups are not integrated to ecosystem component.
4.6.1 Assessment FlowThe assessment flow is the same as for fish, noting that:
No cephalopod species are listed in Table 1D of the Annex to Commission Implementing Decision (EU) 2016/1251;
No cephalopod species are covered by the Habitats Directive. For ‘Step 3 – Determine scales and areas for assessment’, Member States should
determine the appropriate scale of assessment and assessment areas for the cephalopod species group. The following are provided in the revised COM Dec23:o Baltic Sea – region or subdivisions;
o North-East Atlantic Ocean – subregions; o Mediterranean Sea – subregions.
23 There are no cephalopods in the Black Sea.
ABPmer, November 2016, R.2733 | 102

Guidance for Assessments Under Article 8 of the Marine Strategy Framework Directive DG Environment
4.6.2 Levels and Methods of IntegrationFigure 25 shows the levels of integration and integration methods for cephalopods under Descriptor 1. The figure is representative of a single assessment area.
Figure 25. Levels and methods of integration for cephalopods under Descriptor 1Notes: * D1C1 is primary for species identified as being at risk from incidental by-catch in the region or subregion, (i.e. also included on the list of species for D1C1). Criteria from other pressure descriptors may also be taken into account when setting threshold values for D1C2 (e.g. C8C4, D10C4). Where by-catch information for commercially exploited species is taken into account in stock assessments which are used to assess D3C2 (and hence D1C2), it is not necessary to consider this information again.
The integration methods of Figure 25 are:
Level 1: Measurements of individual parameters — for example of distributional range, abundance etc. — are combined into a single indicator. This level of integration is not addressed in this Guidance.
Level 2: Where there is more than one indicator for a particular criterion for a species, the indicators are combined to form a judgement on the status of the criterion. The integration method is not yet defined (see box below). However, in many cases, the ‘indicators’ will be equivalent to the criteria, and no integration will be required.
Level 3: The relevant criteria for each species are integrated to form a judgement on the status for each species. D1C1 contributes to the assessment of D1C2 for the corresponding species. Different species may be represented by different numbers of criteria. The integration method depends on whether the species is commercially exploited (for which the D3 assessment should be used) or not. The
ABPmer, November 2016, R.2733 | 103

Guidance for Assessments Under Article 8 of the Marine Strategy Framework Directive DG Environment
integration method shall be agreed at Union level, taking into account regional or subregional specificities (see box below).
Level 4: The results for each species are brought together to the species group. The integration method shall be agreed at Union level, taking into account regional or subregional specificities. See box below.
Level 5: The revised COM Dec only requires reporting of the status of the species group (not ecosystem component), but integration of species groups using OOAO to express the overall status of the cephalopods ecosystem component may be helpful for communication of assessment results and is included here for that purpose. The applicability of the OOAO approach at this level is dependent on the integration method agreed upon for level 4.
Integration methods for D1 CephalopodsThe integration methods for Descriptor 1 (Cephalopods) still need to be determined, and the revised COM Dec has provided the scope for this to be taken forward and agreed at Union level, taking into account regional or subregional specificities.
Until such an integration method is agreed, this Guidance recommends the following: Level 3: For non-commercially exploited species: OOAO across the criteria used.
In many cases this is likely to be only one criterion (D1C2) therefore the outcome for the criterion would be the outcome for the species.
Level 4: Use the currently-agreed regional method (if available), or a conditional rule, based on a specific number or proportion of species in a species group achieving good status. For example, if x of y species are in good status, the species group is considered to be in good status. The value of x would be defined by Member States. Safeguards may be needed (e.g. a conditional rule) to ensure that a species group is not assessed as ‘good’ status if some species are in a critical state.
Missing indicators
If a primary criterion cannot be assessed for a species due to a lack of data then the resultant assessment cannot be assigned a status (i.e. it is ‘not assessed’). It also means that the Member State needs to take immediate action on monitoring and assessment tools to ensure that at the next update under Article 8 MSFD an assessment of the criterion is undertaken.
4.6.3 Visualising Assessment Results for CephalopodsA similar approach to birds can be used, using the relevant criteria for cephalopods, and appropriate integration approaches. Subject to modification based on finalising 2018 reporting requirements, which will be determined by WG DIKE.
ABPmer, November 2016, R.2733 | 104

Guidance for Assessments Under Article 8 of the Marine Strategy Framework Directive DG Environment
4.7 Pelagic Habitats (Descriptor 1) Habitat aspects of biodiversity are considered in relation to two ‘ecosystem components’ (pelagic and benthic habitats) and their ‘broad habitat types’. Different criteria are relevant for the two ecosystem components, and therefore the integration rules are also different. Benthic habitats components are distinguished and explained separately in Section 4.8.
For pelagic habitats, there is one descriptor:
Descriptor 1 (Pelagic habitats): Biological diversity is maintained. The quality and occurrence of habitats [and the distribution and abundance of species] are in line with prevailing physiographic, geographic and climatic conditions.
The criterion for pelagic habitats, and its relation to the 2010/477/EU indicators, is shown in Table 34.
Table 34. Criteria for assessment of pelagic habitats (Descriptor 1)
Primary Criteria Relating to:
Secondary Criteria Relating to:
2010/477/EU Criteria or Indicators
Comments
D1C6 Habitat condition (spatial extent of adverse effects)
1.6.11.6.21.6.3
Level of Integration For pelagic habitats, the final level of integration is the criterion D1C6. Because there is only one criterion, the outcome will be the same as for the Descriptor.
4.7.1 Assessment FlowThe assessment flow for Descriptor 1 (Pelagic Habitats) is described below.
Determine the criteria to addressThere is only one criterion, which is primary, and therefore must be addressed.
Determine the elements for assessment: select habitatsAccording to the revised COM Dec, the elements to be assessed for pelagic habitats are:
Pelagic broad habitat types (specified as the criteria elements to be assessed in the revised COM Dec):o Variable salinity24
o Coastalo Shelfo Oceanic/beyond shelf
Additional habitat types (selected by Member States through 24 Retained for situations where estuarine plumes extend beyond waters designated as Transitional
Waters under Directive 2000/60/EC.
ABPmer, November 2016, R.2733 | 105
Step 1
Step 2

Guidance for Assessments Under Article 8 of the Marine Strategy Framework Directive DG Environment
regional or subregional cooperation, according to the criteria laid down in ‘specifications for the selection of species and habitats’ in the revised COM Dec) (see ‘Selection of habitat types’ in Section 4.8 (Benthic Habitats)). It is recommended to use a suitable habitat typology such as ecohydrodynamic types (Figure 27).
Determine scales and areas for assessmentThe revised COM Dec indicates the following spatial scales for assessment:
Subdivision of the region or subregion as used for assessments of benthic broad habitat types, reflecting biogeographic changes in species composition of the habitat.
Assign indicators Relevant regional indicators that are available should be identified
and allocated, to the relevant criteria and assessment areas (mapping of RSC indicators against the revised COM Dec criteria is provided in Appendix A).
Any remaining gaps should be identified. Use national assessments (taking into account existing assessments e.g. under EU legislation such as WFD), where available, pending the development of regionally coordinated assessments.
Additional national indicators for elements that are specific to national waters, if any, can also be incorporated and allocated to the relevant criteria and assessment areas. These need to have a threshold value, where appropriate, and should follow the agreed structure for reporting indicators (MSCG_17-2015-04), pending guidance on reporting requirements from WG DIKE.
Establish threshold valuesMember States should establish threshold values through regional or subregional cooperation, for the following:
The condition of each habitat type, ensuring compatibility with values set under Descriptors 2, 5 and 8.
Determine if threshold values are achieved The condition of each pelagic broad habitat type should be
determined in each assessment area, based on the value of the indicator compared to the thresholds established in step 5.
The assessment should provide an estimate of extent (in km²) of each habitat type that is adversely affected in the assessment area, and as a proportion (percentage) of the total extent of the habitat type. Note that habitat extent in km² is used instead of volume to simplify assessments by avoiding the need to take into account the depth of the water column.
For expressing the extent to which good environmental status has been achieved, this should be an estimate of the extent and proportion of each habitat type that has achieved the threshold value set.
This should take into account assessments of the adverse effects from pressures, including under D2C3, D5C2, D5C3, D5C4, D7C1, D8C2 and D8C4.
Integrate indicators If there is more than one indicator for the condition of each habitat
type, the indicators should be integrated to criterion level for the pelagic broad habitat type;
Integration methods are described in Section 4.7.2.
ABPmer, November 2016, R.2733 | 106
Step 3
Step 4
Step 5
Step 6
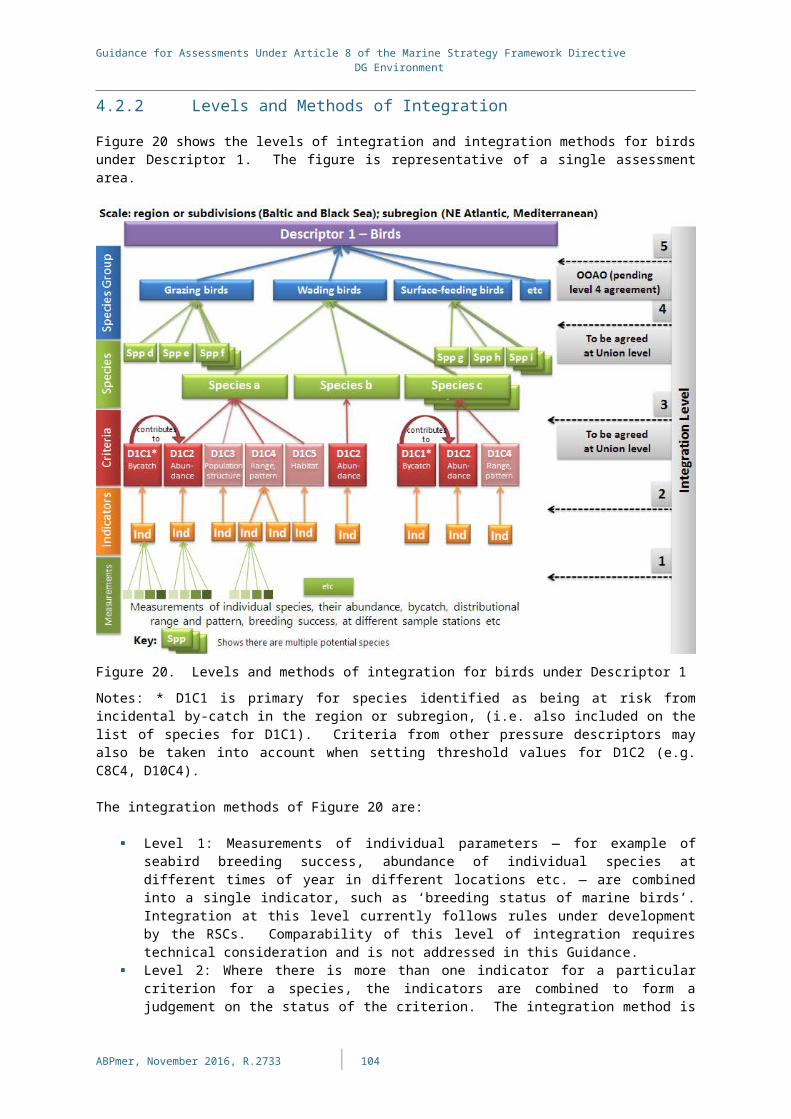
Guidance for Assessments Under Article 8 of the Marine Strategy Framework Directive DG Environment
4.7.2 Levels and Methods of Integration The assessment of pelagic habitats under Descriptor 1 should focus on the assessment of plankton communities in the water column. The assessment of the extent (volume) of pelagic habitats affected by anthropogenic pressures is practically challenging and not feasible for the assessment process. Therefore it is recommended to assess pelagic habitats with the help of indicators describing community structure and productivity of the plankton community in the water column. Other relevant ecosystem components, e.g. fish, for the pelagic habitats are assessed under other criteria under Descriptors 1, 3 and 4.
The abiotic structure of the pelagic habitats is integrated in the assessment of the plankton communities. Species and size composition as well as abundance and distribution of plankton communities depend mostly on water temperature, nutrient availability and water clarity. Anthropogenic pressures affect the plankton community in a cumulative way and a differentiation of effects from single pressures may not be possible in this assessment, but the assessments of the adverse effects from pressures including under D2C3, D5C2, D5C3, D5C4, D7C1, D8C2 and D8C4 should be taken into account in the assessments of pelagic habitats under D1C6.
Habitat sub-types can be defined by eco-hydrodynamic areas (see van Leeuwen et al. 2015 for the North Sea, Figure 26). The eco-hydrodynamic regions are defined according to the degree of stratification and the influence of freshwater.
ABPmer, November 2016, R.2733 | 107
Step 7

Guidance for Assessments Under Article 8 of the Marine Strategy Framework Directive DG Environment
Figure 26. Eco-hydrodynamic areas in the Greater North Sea (van Leeuwen et al., 2015)
Figure 27 shows the levels of integration and integration methods for pelagic habitats under Descriptor 1. The figure is representative of a single assessment area.
ABPmer, November 2016, R.2733 | 108

Guidance for Assessments Under Article 8 of the Marine Strategy Framework Directive DG Environment
Figure 27. Levels and methods of integration for pelagic habitats under Descriptor 1
The integration of the indicators might not be possible quantitatively, since not all indicators describing the plankton communities will have indicator thresholds. Pressures affecting the pelagic habitats should be considered in the assessment of pelagic habitat. But since the pressure/state link in pelagic systems is not well defined, except for fishing mortality, the integration of pressure-based assessments (criteria D2C3, D5C2, D5C3, D5C4, D7C1, D8C2 and D8C4) should be done qualitatively, rather than quantitatively. The assessment of the pressure/impact criteria could be used to either strengthen or weaken the assessment of function within D1C6.
The integration methods of Figure 27 are:
Level 1: Measurements of individual parameters — for example continuous plankton recorder (CPR) or stationary data samples. These are combined into indicators of biotic and abiotic structure and function (e.g. species composition and their relative abundance, absence of particularly sensitive or fragile species or species providing a key function, size structure of species, productivity). This level of integration requires technical consideration and is not addressed in this guidance.
Level 2: The integration method is not yet defined. See box below. Level 3: There is only one criterion (D1C6) for pelagic habitats, therefore no
integration is required. Level 4: The broad habitat types under D1 (pelagic habitats) are not integrated.
ABPmer, November 2016, R.2733 | 109

Guidance for Assessments Under Article 8 of the Marine Strategy Framework Directive DG Environment
Integration methods for D1 Pelagic HabitatsThe integration methods for Descriptor 1 (Pelagic Habitats) require further discussion to reach a proposal.Until such an integration method is agreed, this Guidance recommends the following:
Level 2: The individual indicators are combined to criterion level using averaging (of normalised values) (integration method proposed by the workshop break-out group).
Further consideration of the presentation of assessment outputs is required.
Missing indicators
If the primary criterion cannot be assessed for a broad habitat type due to a lack of data then the resultant assessment cannot be assigned a status (i.e. it is ‘not assessed’). It also means that the Member State needs to take immediate action on monitoring and assessment tools to ensure that at the next update under Article 8 MSFD an assessment of the criterion is undertaken.
4.7.3 Visualising Assessment Results for Pelagic HabitatsInitial outline of assessment outcomes based on revised COM Dec, with illustrative examples. Subject to modification based on finalising 2018 reporting requirements, which will be determined by WG DIKE.
The assessment output for Descriptor 1 Pelagic Habitats is expressed for each pelagic broad habitat type in each area (subdivision of region or subregion, as used for assessments of benthic broad habitat types), as shown in Table 35. If several different measures of ‘condition’ are used, an overall consideration of the condition of the habitat type will be necessary.
Table 35. Initial outline and illustrative example for presenting the assessment output for Descriptor 9, for an assessment area
Broad habitat type
Habitat condition parameter
Threshold value
Value achieved
Threshold achieved?
Extent that has achieved threshold values
Variable salinity
Not present
Coastal Species composition (diversity)
x y Yes 168 km² (75%)
Size structure x y YesAMBI (composite indicator)
x y No
Shelf Species composition (diversity)
x y Yes 425 km² (100%)
Size structure x y YesAMBI (composite indicator)
x y Yes
Oceanic/ beyond shelf
Present but not assessed
Not assessed
Not assessed
Pelagic broad habitat types present in the assessment area that were not assessed: Oceanic/beyond shelf.
ABPmer, November 2016, R.2733 | 110
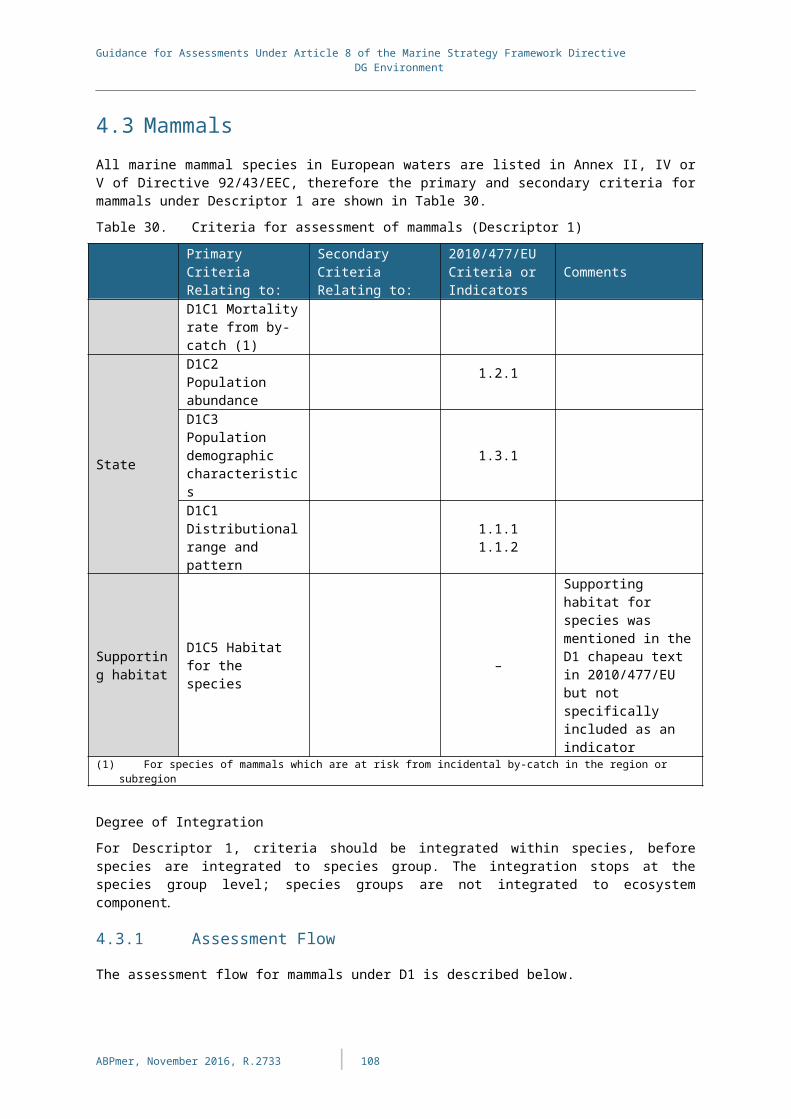
Guidance for Assessments Under Article 8 of the Marine Strategy Framework Directive DG Environment
In addition to the presentation of results by pelagic broad habitat type, a summary can be provided in graphical format (Figure 28(a)) for the overall extent of pelagic habitats achieving threshold values in the assessment area.
In addition, if desired, the overall status of the ecosystem component can be presented, for the purposes of communication of assessment results, as the ‘pizza slice’ for the Pelagic Habitats ecosystem component in the scheme for integrated presentation of assessment results (pizza-satellite scheme) (Figure 28(b)).
(a) Showing extent achieving threshold values
(b) For the ecosystem component
Good Not good Not assessed
Birds
Mammals
Reptiles
Fish
Cephalo-pods
Pelagic habitats
Benthic habitats
Figure 28. Illustrative example of a visual summary of assessment outputs for Descriptor 1 Pelagic Habitats
ABPmer, November 2016, R.2733 | 111

Guidance for Assessments Under Article 8 of the Marine Strategy Framework Directive DG Environment
4.8 Benthic Habitats (Descriptors 1 and 6) There are two Descriptors directly addressing the state of benthic habitats:
Descriptor 1 (Habitats): Biological diversity is maintained. The quality and occurrence of habitats [and the distribution and abundance of species] are in line with prevailing physiographic, geographic and climatic conditions.
Descriptor 6: Sea-floor integrity is at a level that ensures that the structure and functions of the ecosystems are safeguarded and benthic ecosystems, in particular, are not adversely affected.
The requirements for both descriptors are addressed through a single set of assessments on broad habitat types (and on other habitat types if selected, for example from Habitats Directive or international agreements such as RSCs). The assessments of the physical loss and physical disturbance pressures under criteria D6C1–D6C3 (see Section Error:Reference source not found) are to be used, together with outcomes of assessments for other pressure-based Descriptors (D2, D5, D7, D8). The criteria for assessing benthic habitats, and their relation to the 2010/477/EU indicators, are shown in Table 36. Table 36. Criteria for assessment of benthic habitats (D1 and D6)
Primary Criteria Relating to:
Secondary Criteria Relating to:
2010/477/EU Criteria or Indicators
Comments
D1D6C4 Habitat extent (loss)
(1.4.1, 1.4.2)1.5.16.1.1
Biogenic habitat types (6.1.1) now included within broad habitat types
D6C5 Habitat condition
1.6.1, 1.6.2, 1.6.36.1.2
6.2.1, 6.2.2, 6.2.3, 6.2.4
Aspects relating to the condition of the benthic community (6.2) are considered under D6C5.
There are two main aspects to the assessment of benthic habitats:
Extent of habitat (D6C4): assessed as the extent of habitat loss and expressed as a proportion of the overall extent;
Condition of the habitat (D6C5): assessed as the extent of the remaining habitat (i.e. after any habitat loss) which is in a good condition (biotic and abiotic structure, and function) (or, conversely, the extent of habitat that is in a poor condition).
The assessments are undertaken per habitat type in a given assessment area, leading to an assessment per habitat type based on an integration of the two criteria.
Criteria D6C4 and D6C5 correspond to the ‘range/area covered by habitat type within range’ and ‘specific structure and functions’ criteria of the Habitats Directive (Directive 92/43/EEC), and information on these can be taken directly from the reporting for that Directive where it relates to habitat types selected for MSFD assessments.
The state of benthic habitats may be adversely affected by several pressures, depending on the different activities and associated pressures in each region or subregion. Consequently the assessments of impacts from the relevant pressures should be taken into account in the assessments of benthic habitats. The most relevant criteria are as follows:
ABPmer, November 2016, R.2733 | 112

Guidance for Assessments Under Article 8 of the Marine Strategy Framework Directive DG Environment
In relation to assessment the extent of the habitat (loss) (D6C4):o D6C1 (extent of loss);
In relation to assessing the condition of the habitat (D6C5):o D2C3 (adverse effects from non-indigenous species); o D5C4, D5C5, D5C6, D5C7, D5C8 (adverse effects from nutrient
enrichment);o D6C3 (adverse effects from physical disturbance);o D7C2 (adverse effects from hydrographical changes);o D8C2, D8C4 (adverse effects from chronic and acute contamination);o Also potentially relevant: D1C5 (habitats for species of birds, mammals,
reptiles, fish or cephalopods) and D3C2, D3C3 (state of benthic commercially exploited species).
Degree of Integration For benthic habitats, in relation to physical loss and disturbance pressures, the final level of integration is the criteria level (D6C1, D6C2 and D6C3) (Figure 30).
4.8.1 Assessment FlowThe assessment flow for D1/D6 benthic habitats, incorporating criteria on physical pressures, is described below.
Determine the criteria to addressAll criteria are primary criteria and therefore all must be addressed.
Determine the elements for assessment: Select habitatsAccording to the revised COM Dec, the elements to be assessed for benthic habitats are:
Broad habitat types (specified as the criteria elements to be assessed in the revised COM Dec, see Table 37); note that for the purposes of assessing the condition of broad habitat types (D6C5), particularly when using ground-truth sampling techniques, representative subtypes should be selected, according to the set of characteristics given in the revised COM Dec (see section ’Selection of habitat types’ below for selection criteria);
Additional habitat types, which may include habitat types listed under the Habitats Directive or Regional Sea Conventions, may also be selected, for example in cases where the Member State considers the broad habitat types are not sufficiently detailed for their MSFD implementation needs. Where 'additional habitat types' are selected, it is recommended that these also be used as the representative subtypes needed for assessment of the broad habitat types, as this will minimise monitoring and assessment efforts.
These are described in more detail below.Determine scales and areas for assessmentThe revised COM Dec indicates the following spatial scales for assessment:
Subdivision of the region or subregion, reflecting biogeographic changes in species composition of the broad habitat type, i.e. each region or subregion is divided into a set of subdivisions which
ABPmer, November 2016, R.2733 | 113
Step 1
Step 2

Guidance for Assessments Under Article 8 of the Marine Strategy Framework Directive DG Environment
reflect the main water masses that influence biogeographic (species composition) changes in habitats (this will typically be temperature and salinity driven changes in the sub(region) and lead to a small number of subdivisions only). A single set of subdivisions of each region or subregion should be used for the assessment of all habitat types (i.e. the scale of assessment is the same for every habitat type, and the individual habitat types are considered within each subdivision/assessment area).
Assign indicators Relevant regional indicators that are available should be identified
and allocated, to the relevant criteria and assessment areas (mapping of RSC indicators against the revised COM Dec criteria is provided in Appendix A).
Assessments carried out under the Habitats Directive should be used for those habitats, taking account of the different assessment scales.
Any remaining gaps should be identified. Use national assessments (taking into account existing assessments e.g. under EU legislation such as Habitats Directive), where available, pending the development of regionally coordinated assessments.
Additional national indicators for elements that are specific to national waters, if any, can also be incorporated and allocated to the relevant criteria and assessment areas. These need to have a threshold value, where appropriate, and should follow the agreed structure for reporting indicators (MSCG_17-2015-04), pending guidance on reporting requirements from WG DIKE.
Establish threshold valuesMember States should establish maximum allowable extents and threshold values through cooperation at Union level, taking into account regional or subregional specificities, for the following:
D6C4: The maximum allowable extent of habitat loss as a proportion of the total natural extent of the habitat type in the assessment area.
D6C5: Threshold values for adverse effects on the condition of each habitat type, ensuring compatibility with values set under Descriptors 2, 5, 6, 7 and 8. This is likely to be set as an acceptable deviation from reference condition, probably in the form of an EQR (as under the WFD).
D6C5: The maximum allowable extent of adverse effects as a proportion of the total natural extent of the habitat type in the assessment area. A common value across all habitat types is desirable (as per Habitats Directive and IUCN assessment methods), but there may be justifiable scientific rationales to deviate from this in specific cases.
Determine if threshold values are achieved D6C4: The status of each benthic broad habitat type should be
determined in each assessment area, based on the extent of loss compared to the maximum allowable extent values established in step 5. This should be expressed as an estimate of the proportion and extent of loss per habitat type and whether this is within.
D6C5: The condition of each benthic broad habitat type should be determined in each assessment area, based on the values of indicators compared to the thresholds established in step 5. This should be expressed as an estimate of the proportion and extent of adverse effects (including the extent lost from D6C4) per habitat type, and whether this is within the maximum allowable extent value.
The overall status of each habitat type in the assessment area
ABPmer, November 2016, R.2733 | 114
Step 3
Step 4
Step 5
Step 6

Guidance for Assessments Under Article 8 of the Marine Strategy Framework Directive DG Environment
should be determined, using a method to be agreed at Union level based on the extent lost and the extent of adverse effects.
This should take into account assessments of the adverse effects from pressures, including under D2C3, D3C1, D3C2, D3C3, D5C4, D5C5, D5C6, D5C7, D5C8, D7C2, D8C2 and D8C4.
A list of the broad benthic habitats in the assessment area that were not assessed should also be provided.
Integrate indicators and criteria Integration methods are described in Section 4.7.2.
Benthic habitat types
Broad habitat types25: The assessment of benthic habitats and seafloor integrity is to be carried out for the 22 ‘broad habitat types’, listed in Table 37, if they occur within the region or subregion, and selected other habitat types from Habitats Directive or international agreements such as RSCs. The broad habitat types are defined on the basis of EUNIS level 2 habitat types, although some level 2 categories are aggregated to provide a resolution of habitat types more suited to MSFD scales of assessment and management of predominant pressures (e.g. combining rock and biogenic reef categories, combining littoral sediment, bathyal sediment and abyssal sediment and rock categories).
Table 37. Benthic broad habitat types, for consideration under the ‘benthic habitats’ D1 and D6
Ecosystem Component Broad Habitat TypeBenthic habitats Littoral rock and biogenic reef
Littoral sedimentInfralittoral rock and biogenic reefInfralittoral coarse sedimentInfralittoral mixed sedimentInfralittoral sandInfralittoral mudCircalittoral rock and biogenic reefCircalittoral coarse sedimentCircalittoral mixed sedimentCircalittoral sandCircalittoral mudOffshore circalittoral rock and biogenic reefOffshore circalittoral coarse sedimentOffshore circalittoral mixed sedimentOffshore circalittoral sandOffshore circalittoral mudUpper bathyal rock and biogenic reefUpper bathyal sedimentLower bathyal rock and biogenic reefLower bathyal sedimentAbyssal
Note: Relevant EUNIS habitat codes (version 2016) are provided in the revised COM Dec.Note: in the 2016 version of EUNIS, supralittoral rock habitats (splash zone) are included under the littoral zone. This means that the littoral rock and biogenic reef broad habitat type of the revised
25 Previously ‘predominant’ habitats in MSFD Annex III.
ABPmer, November 2016, R.2733 | 115
Step 7
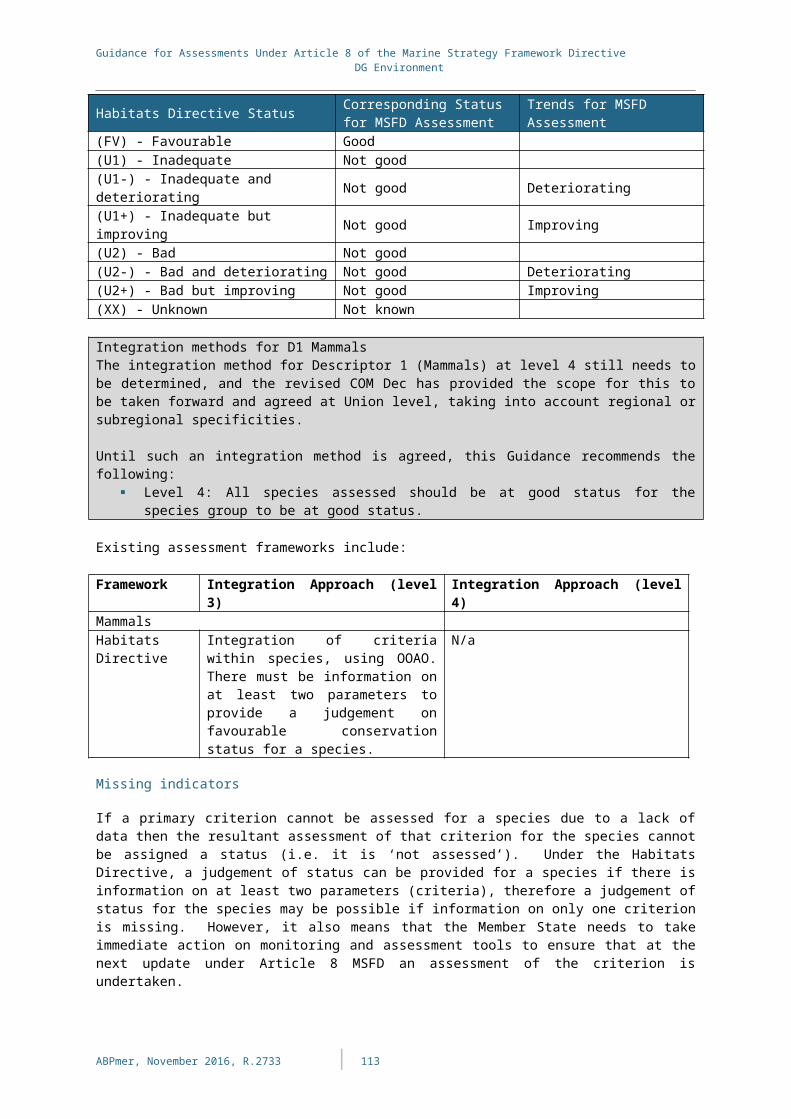
Guidance for Assessments Under Article 8 of the Marine Strategy Framework Directive DG Environment
Ecosystem Component Broad Habitat TypeCOM Decision has a broader definition compared with the littoral rock predominant habitat type in CSWP (2011).
The assessment of broad habitat types can be undertaken with reference to a selection of representative subhabitat types for each broad habitat type; this is particularly relevant where broad-scale mapping or modelling of pressures needs to be validated with ground-truth data (e.g. from grab or video samples). Such sampling is used to assess the biological characteristics (condition) of the seabed and needs to compare impacted sites with unimpacted sites; it is typically necessary to do this using finer-scale habitat types (e.g. EUNIS level 4 or 5 classes).
Representative habitats (of a broad habitat type), shall be defined by Member States at regional or subregional level, and may include habitat types assessed under Directive 92/43/EEC or international agreements (‘special habitats’ – see below). The Member State Workshop on the development of the Article 8 Guidance recommended that the representative habitats should be defined on the basis of EUNIS level 4–5.
Other habitats, including ‘special habitats: Member States may, in addition to the assessment of broad habitat types, select other habitat types for assessment; this may be particularly relevant in cases where the broad habitat types do not provide sufficient discrimination for the assessment and management of their waters.
These other habitat types can include special habitats26 which are habitats listed for protection under other directives, i.e. the Habitats Directive or by Regional Sea Conventions or other international agreements.
Special habitats may also be representative of a broad habitat type, if they match the scientific selection criteria. The specific characteristics and properties of this habitat (e.g. sensitivity, proportion, etc.) should then be carefully taken into account for its representativeness.
Selection of habitat types
The revised COM Dec sets out a number of ‘main scientific criteria (ecological relevance)’ for the selection of representative habitats to be assessed under the broad habitat types:
Representative of the broad habitat type and of ecosystem functioning, being relevant for assessment of state/impacts, such as having a key functional role within the component (e.g. high or specific biodiversity, productivity, trophic link, specific resource or service);
Relevant for assessment of a key anthropogenic pressure to which the broad habitat type is exposed, being sensitive to the pressure and exposed to it (vulnerable) in the assessment area (the Member State Workshop noted that since it is difficult to identify a key anthropogenic pressure for most of the pelagic ecosystem components, this scientific criterion is of lower priority for pelagic habitats);
Present in sufficient extent in the assessment area to be able to construct a suitable indicator for assessment. This does not exclude rare or endangered habitats; any habitat types can be assessed;
The set of habitats selected should cover, as far as possible, the full range of ecological functions of the broad habitat type and the predominant pressures to which the component is subject;
If species of species groups are closely associated to a broad habitat type they may be included within that habitat type for monitoring and assessment purposes; in such cases the species shall not be included in the assessment of the species group.
26 Previously ‘special habitats’ in MSFD Annex III.
ABPmer, November 2016, R.2733 | 116

Guidance for Assessments Under Article 8 of the Marine Strategy Framework Directive DG Environment
Figure 29. Illustration of the assessment of a habitat group showing the aggregation of representative habitats to a broad habitat type (EUNIS level 2).
Notes: Broad habitat typ: example used is circalittoral (formerly ‘shelf’) sand. Representative habitats = circles H1, H2, H3 and H4. HD = H1 listed habitat from Habitats Directive. OSP = H2 listed habitat from OSPAR (Regional Sea Convention). H3 and H4 = not listed but representative EUNIS level 4 or 5 habitats for MSFD. H0 = habitat (EUNIS level 4/5) of this broad habitat type, but not selected as representative, according to selection criteria. Further work is needed to detail the aggregation process (method and rules) (work in progress in RSCs).
Source: JRC D1 workshop Sept. 2015.
4.8.2 Levels and Methods of IntegrationFigure 30 shows the levels of integration and integration methods for benthic habitats addressing Descriptor 1 and Descriptor 6. It represents the assessment of the extent and condition of each broad habitat type, combining indicators to represent the cumulative area lost or damaged of each broad habitat type, which are then expressed as a proportion of the total extent of the broad habitat type within the assessment area. The figure is representative of a single assessment area, for which the status should be presented for each broad habitat type. There is no need to aggregate across spatial areas.
ABPmer, November 2016, R.2733 | 117

Guidance for Assessments Under Article 8 of the Marine Strategy Framework Directive DG Environment
Figure 30. Levels and methods of integration for benthic habitats under Descriptor 1
The assessment of benthic habitats should be based, as far as possible, on outputs of assessments for the relevant pressure-based descriptors, expressed as the extent of impact per pressure. The level 1 and 2 integration rules below relate primarily to these other assessments. The integration methods are (see also box below):
Level 1: Measurements of individual parameters — for example seabed grab or video samples, acoustic surveys etc. These are combined into indicators and maps (often based on modelled data) of habitat types and extent. This level of integration requires technical consideration and is not addressed in this guidance.
Level 2: The individual indicators (of habitat extent, extent of adverse effects from different pressures etc.), for a broad habitat type in an assessment area, are combined to provide the extent of adverse effects for each relevant pressure (these are outputs from the assessment of the pressure-based descriptors: D6C3 (extent of adverse effects from physical disturbance) and from other relevant pressure descriptors (e.g. extent of adverse effects from nutrient enrichment or hydrographical changes). Where representative subtypes of the broad habitat type are assessed, they may be used to inform/validate the assessments of the other pressure-based criteria (e.g. D6C3), but could also be used directly for D6C5.
ABPmer, November 2016, R.2733 | 118

Guidance for Assessments Under Article 8 of the Marine Strategy Framework Directive DG Environment
Level 3: o For criterion D6C4, the output from D6C1 (total extent of physical loss in
assessment area) is interfaced with the extent of the broad habitat type in the assessment area to derive the extent of loss for the habitat as a proportion (%) of the total habitat area.
o For criterion D6C5, the total extent of adverse effects on the broad habitat type from the relevant impact criteria (e.g. D6C3, D7C2) are brought together, for example by overlaying impact maps on the habitat map. This impact extent is then related to the overall extent of the broad habitat to estimate the proportion (%) of the habitat area which is considered to be in good or poor condition. In some cases it may be appropriate to simply sum the areas affected by the pressures, but where there are cumulative or synergistic effects, or overlapping pressures, other approaches may be required.
Level 4: The results for each criterion are brought together for each broad habitat type. A conditional rule is used, where both criteria must be within the levels set for the extent of habitat which may be lost and adversely affected; the sum of the area lost and area adversely affected must not exceed the threshold for the area adversely affected, i.e. area lost should be taken into account in the area adversely affected, as loss is considered the most severe (irreversible) form of adverse effect.
Level 5: The broad habitat types under D1/D6 (benthic habitats) are not integrated.
Assessments of other habitat types, e.g. special habitats, should follow the same overall process, except they will not have supporting subtypes to inform their assessment.
Outstanding issues and Integration methods for D1 Benthic HabitatsThe integration methods for Descriptor 1 (Benthic Habitats) proposed above are in line with the revised COM Dec. However, the Member States Workshop break-out group on habitats concluded that detailed approaches to integration and links between the different elements required further development, and further work was required to propose integration methods, for example:
- There was neither consensus nor agreed method to integrate cumulative pressures’ effects on the state of habitats, in particular considering the overlapping (extent) of pressures and possible synergistic or antagonist effects (intensities) on damages to the state.
- The main physical pressure actually assessed is abrasion by bottom-trawling fisheries, but the method (and relevance) to integrate all physical pressure sub-types still needs to be further developed.
Further work on Benthic Habitats assessments and integration approaches may be taken forward in due course.
Missing indicators
If a primary criterion cannot be assessed for a broad habitat type due to a lack of data then the resultant assessment cannot be assigned a status (i.e. it is ‘not assessed’). It also means that the Member State needs to take immediate action on monitoring and assessment tools to ensure that at the next update under Article 8 MSFD an assessment of the criterion is undertaken.
4.8.3 Visualising Assessment Results for Benthic HabitatsInitial outline of assessment outcomes based on revised COM Dec, with illustrative examples. Subject to modification based on finalising 2018 reporting requirements, which will be determined by WG DIKE.
ABPmer, November 2016, R.2733 | 119

Guidance for Assessments Under Article 8 of the Marine Strategy Framework Directive DG Environment
A spatial map of the areas of loss and of adverse effects on the seabed will be outputs for D6C1 and D6C3, that will feed in to D6C4 and D6C5. For D6C3, this will have already been intersected with a benthic habitat map to determine the areas of individual benthic habitat types that are adversely affected. The map of areas lost will also need to be intersected with a map of natural benthic habitat types (or the benthic habitat types that were lost would need to be otherwise identified), to determine the area of each benthic habitat type that is lost.
The outcomes are presented for each broad benthic habitat type or additional habitat type, in each assessment area (subdivision of the region or subregion), as shown in Table38.
The group on benthic habitats at the WG GES workshop on 20–21 April 2016 produced an example assessment for a single benthic habitat type, which illustrates the integration of D6C1, D6C2 and D6C3 with other pressure criteria (e.g. Descriptor 2, 5 and 7) (Table 39).
Table 38. Initial outline and illustrative example for presenting the assessment output for Descriptors 1 and 6 Benthic Habitats
Habitat typeD6C4 D6C5
Overall status
Threshold value
Value achieved
Threshold value
Value achieved
Littoral rock and biogenic reef
x y x y Good
Littoral sediment x y x y GoodInfralittoral rock and biogenic reef
x y x y Not good
Infralittoral coarse sediment
x y x y Good
Infralittoral mixed sediment x y x y GoodInfralittoral sand x y x y GoodSpecific habitat type x x y x y Not goodEtcNote: Threshold values for D6C4 and D6C5 are expressed as a proportion of the natural extent of the habitat type in the assessment area. Values achieved for D6C5 and D6C5 are expressed as a proportion, and also as the extent in km².
Table 39. Illustrative assessment of a broad habitat type (example – circalittoral sand)
State criterio
n
Art.9GES
Decision
criterion
extent threshold value
Pressures ImpactArt.8
Assess-ment
values
Criterion assessm
entOverall
Broa
d ha
bita
t ty
pe:
Habitat extent
<[10]% loss in extent
compared with
reference condition
PhysicalChange of sea-floor substrate (infrastructure) (D6C1)
Habitat loss (D6C4) 5% GES
Below GES(55%
impacted or lost)Habitat
condition (D6C5)
Sustainable use =
resilience/ resistance to
pressure frequency
and intensity
<[30]% adversely affected
compared with
reference condition
Physical Disturbance to sea-floor (D6C2)
Habitat damage (D6C3)
45%Below GES
(50%+ impacted)
(D6C5)Biological
Removal of species (commercial, non-commercial)
Physical Extraction of
ABPmer, November 2016, R.2733 | 120

Guidance for Assessments Under Article 8 of the Marine Strategy Framework Directive DG Environment
State criterio
n
Art.9GES
Decision
criterion
extent threshold value
Pressures ImpactArt.8
Assess-ment
values
Criterion assessm
entOverall
circ
alit
tora
l san
d
(including any
habitat loss)
sea-floor and subsoil minerals (e.g. sand, gravel, rock, oil, gas)
Hydrological
Water movement changes (from infrastructure)
Habitat structure changes, community changes (D7C2)
5%
Chemicals and other pollutants
Nutrient enrichment (N, P, organic matter)
Oxygen depletion, community changes (D5C5, D5C8)
0%
Biological
Introduction or spread of non-indigenous species
Community alteration (D2C3)
Not assessed
Note: Assessment results for a specified assessment scale and area (e.g. a subdivision of a subregion), showing the assessment criteria and threshold values for each (illustrative values given). Each criterion is assessed using scientific indicators (e.g. defined at regional or subregional level) which provide data on the extent of impact for each particular pressure. The overall assessment per criterion is the cumulative impact against the threshold value; the overall assessment of the broad habitat type requires both criteria to be within the values set. Other pressure criteria may also be relevant for the assessment (e.g. D2C3, D3C3, D5C4, D5C6, D5C7, D8C2 and D8C4).
In addition to the presentation of results by benthic broad habitat type, a summary can be provided in graphical format (Figure 31(a)) showing the overall extent of benthic habitats achieving good status, the area adversely affected, and the area lost in the assessment area. For the purposes of assessment and more detailed information for management, information per habitat type is also likely to be necessary. This is not illustrated here.
In addition, if desired, the overall status of the ecosystem component can be presented, for the purposes of communication of assessment results, as the ‘pizza slice’ for the Benthic Habitats ecosystem component in the scheme for integrated presentation of assessment results (pizza-satellite scheme) (Figure 31(b)).
ABPmer, November 2016, R.2733 | 121

Guidance for Assessments Under Article 8 of the Marine Strategy Framework Directive DG Environment
(a) Showing overall extent of benthic habitats in good condition, area adversely affected, and area lost
(b) For the ecosystem component
Good Area adversely affected Area lost
Birds
Mammals
Reptiles
Fish
Cephalo-pods
Pelagic habitats
Benthic habitats
Figure 31. Illustrative example of a visual summary of assessment outputs for Descriptor 1 Benthic Habitats
ABPmer, November 2016, R.2733 | 122

Guidance for Assessments Under Article 8 of the Marine Strategy Framework Directive DG Environment
4.9 Ecosystems, Including Food Webs (Descriptors 1 and 4)
Descriptor 4: All elements of the marine food webs, to the extent that they are known, occur at normal abundance and diversity and levels capable of ensuring the long-term abundance of the species and the retention of their full reproductive capacity.
The primary and secondary criteria for Descriptor 4, and their relationship to the indicators of 2010/477/EU, are shown in Table 40.
Table 40. Criteria for assessment of ecosystems (Descriptor 4)
Primary Criteria Relating to:
Secondary Criteria Relating to:
2010/477/EU Criteria or Indicators
Comments
State (biological)
D4C1 Diversity 1.7.1
1.7.1 (composition and relative proportions of ecosystem components) may relate to D4C1 (species composition and their relative abundance within trophic guilds)
D4C2 Abundance 4.3.1D4C3 Size distribution 4.2.1
State (functional)
D4C4 Productivity 4.1.1
Functional aspects of the state of marine food webs in terms of their productivity (European Commission, 2016)
Note: The revised criteria for Descriptor 4 and the trophic guild approach expand the Descriptor from its previous focus on fish, to cover wider ecosystem aspects such as phytoplankton, benthos and non-fish top predators.
Descriptor 4 addresses functional aspects of ecosystems whereas Descriptor 1 addresses the group’s ‘position’ within ecosystem structure. It addresses ecosystem aspects through food webs by dividing the structure and function of food webs into compartments which share common features, i.e. ‘trophic guilds’ (ICES, 2014b). Trophic guilds can refer to important prey groups (defined by who eats them) as well as predators (a group that eats the same thing) (ICES, 2015). Examples of trophic guilds include fish benthivores, fish planktivores, filter-feeding benthos, or omnivorous zooplankton (see Table 41 showing indicative trophic guilds and their composition).
ABPmer, November 2016, R.2733 | 123

Guidance for Assessments Under Article 8 of the Marine Strategy Framework Directive DG Environment
Table 41. Example of a division of trophic guilds, and the main taxonomic groups that may contribute to each guild
Guild/ Taxonomic Group Phyto-plankton
Zoo-plankton Benthos
Nekton Excl. Warm-Blooded
Seabirds Marine Mammals
Primary producers XSecondary producers XFilter-feeders XDeposit-feeders XPlanktivores X X X XSub-apex pelagic predators X X XSub-apex demersal predators X X X XApex predators X X XNote: X denotes where the taxonomic groups contribute significantly to each guild. Nekton includes bony fish, elasmobranchs and squids, amongst others. In shallower waters, macrophytes may also be important primary producers in addition to phytoplankton.
Source: ICES, 2014b.
Level of Integration For Descriptor 4, threshold values should be set, but the criteria are not expected to provide a judgement on status; rather, they are to be used for ‘surveillance’ to monitor changes in the food web, rather than responding tightly to manageable pressures (ICES, 2014b). As such, where values do not fall within the threshold values, the revised COM Dec states that this should trigger the need for further research and investigation to understand the causes of the failure.
4.9.1 Assessment FlowThe assessment flow for D4 is described below.
Determine the criteria to address D4C1 and D4C2 are primary and therefore must be addressed; D4C3 and D4C4 are secondary. D4C4 can be used to support
D4C2, where necessary.
Determine the elements for assessmentThe revised COM Dec provides details of the elements for assessment:
Trophic guilds — a list of those to be assessed should be established by Member States through regional or subregional cooperation. The list of trophic guilds from ICES can be considered (see Table 41);
A minimum of three trophic guilds should be considered; Two of the three shall be non-fish trophic guilds; At least one shall be a primary producer trophic guild; Preferably, the trophic guilds should represent at least the top,
middle and bottom of the food chain.Determine scales and areas for assessmentThe revised COM Dec indicates the following spatial scales for assessment:
Baltic Sea – region; North-East Atlantic Ocean – subregion; Mediterranean Sea – subregion;
ABPmer, November 2016, R.2733 | 124
Step 1
Step 2

Guidance for Assessments Under Article 8 of the Marine Strategy Framework Directive DG Environment
Black Sea – region.
Subdivisions may be used where appropriate.
Assign indicators Relevant regional indicators that are available should be identified
and allocated, to the relevant criteria and assessment areas (mapping of RSC indicators against the revised COM Dec criteria is provided in Appendix A).
Any remaining gaps should be identified. Use national assessments (taking into account existing assessments e.g. under EU legislation such as WFD, Habitats and Birds Directives), where available, pending the development of regionally coordinated assessments.
Additional national indicators for elements that are specific to national waters, if any, can also be incorporated and allocated to the relevant criteria and assessment areas. These need to have a threshold value, where appropriate, and should follow the agreed structure for reporting indicators (MSCG_17-2015-04), pending guidance on reporting requirements from WG DIKE.
Establish threshold valuesThreshold values should be established by Member States for each criterion through regional or subregional cooperation.
Determine if threshold values are achieved The status of each indicator should be determined, based on the
value compared to the thresholds established in step 5.
Integrate indicator The indicators should be integrated to criteria level, based on the
integration methods in Section 4.9.2.
4.9.2 Levels and Methods of IntegrationFigure 32 shows the levels of integration and integration methods for Descriptor 4. The figure is representative of a single assessment area.
ABPmer, November 2016, R.2733 | 125
Step 3
Step 4
Step 5
Step 6
Step 7

Guidance for Assessments Under Article 8 of the Marine Strategy Framework Directive DG Environment
Figure 32. Levels and methods of integration for Descriptor 4
The integration methods of Figure 32 are:
Level 1: Measurements of individual parameters — for example abundance of trophic guilds at different times of year in different locations etc. — are combined into single indicators. This level of integration requires technical consideration and is not addressed in the guidance.
Level 2: o D4C2: This criterion addresses the balance of total guild abundance across
the trophic guilds and therefore requires indicators of abundance of each trophic guild to be integrated to criterion level.
o D4C1, D4C3, D4C4: Where there is more than one indicator for a trophic guild for a particular criterion, the indicators are combined to form a judgement on the status of each criterion. The integration method should be agreed at regional level. However, in practice, it is likely that in many cases there will be only one indicator for a criterion for each trophic guild, therefore no integration would be required.
Level 3: The relevant criteria for each trophic guild are not integrated to the trophic guild. Different trophic guilds may be represented by different numbers of criteria.
Level 4: The results are expressed for each trophic guild individually, and the results for D4C2 are expressed separately; there is no integration to descriptor level. Any deviations from threshold values should trigger the need for further research and investigation to understand the causes for the failure.
ABPmer, November 2016, R.2733 | 126

Guidance for Assessments Under Article 8 of the Marine Strategy Framework Directive DG Environment
Integration methods for D4The integration methods for Descriptor 4 require further discussion to reach a proposal.
Until such an integration method is agreed, this Guidance recommends the following: Level 2:
o D4C2: OOAO.o D4C1, D4C3, D4C4: If there is more than one indicator per criterion,
integration method to be regionally-agreed. Averaging of normalised values would be an appropriate method to combine related indicators for a particular criterion.
Missing indicators
If a primary criterion cannot be assessed due to a lack of data then the resultant assessment cannot be assigned a status (i.e. it is ‘not assessed’). It also means that the Member State needs to take immediate action on monitoring and assessment tools to ensure that at the next update under Article 8 MSFD an assessment of the criterion is undertaken.
4.9.3 Visualising Assessment Results for Ecosystems Including Food WebsInitial outline of assessment outcomes based on revised COM Dec, with illustrative examples. Subject to modification based on finalising 2018 reporting requirements, which will be determined by WG DIKE.
Further work is required on graphical presentation of assessment outputs, and on how the different criteria contribute to the overall status of D4 for the ‘satellite’ in the scheme for integrated presentation of assessment results (pizza-satellite scheme).
The assessment output for Descriptor 4 is presented for the region or subregion, or subdivisions where appropriate:
For each assessed criterion for each trophic guild; For D4C2
The assessment output can be presented as shown in Table 42.
Table 42. Initial outline and illustrative example for presenting the assessment output for Descriptor 4 for the region or subregion, or subdivision
Trophic guild Criterion and parameter
Threshold value
Value achieved
Threshold achieved
All D4C2 x y YesTrophic guild 1 C4C1, diversity x y YesTrophic guild 1 D4C3, size
distributionx y Yes
Trophic guild 1 D4C4, productivity x y NoTrophic guild 2 C4C1, diversity x y YesTrophic guild 3 C4C1, diversity x y Yes
ABPmer, November 2016, R.2733 | 127

Guidance for Assessments Under Article 8 of the Marine Strategy Framework Directive DG Environment
5 ReferencesBSC (2016). Black Sea Integrated Monitoring and Assessment Program (BSIMAP) for years 2017–2022.
BS SAP (2009). Black Sea Strategic Action Plan. Black Sea Commission.
CSWP (2011). Commission Staff Working Paper. Relationship between the initial assessment of marine waters and the criteria for good environmental status. Brussels, 14.10.2011. SEC(2011) 1255 final. Available online: http://ec.europa.eu/environment/marine/pdf/SEC_2011_1255_F_DTS.pdf. Accessed 16 November 2016.
European Commission (2015a). Review of the GES Decision 2010/477/EU and MSFD Annex III – Cross-cutting issues (version 5). Document MSCG_17-2015-06 for the 17 th
Meeting of the Marine Strategy Coordination Group (MSCG), 5th November 2015.
European Commission (2015b). Possible Approach to amend Decision 2010/477/EC. Descriptor 11: Energy, including underwater noise.
European Commission (2016). Main aims of a revised Decision and Annex III for the Marine Strategy Framework Directive. 14 January 2016. Supporting document to the draft revised Commission Decision and draft revision for Annex III.
HELCOM (2016). Draft comparison of HELCOM core indicators against new criteria proposed in the draft EU Commission Decision on GES criteria (ver 14.11.2016).
ICES (2014a). EU request on draft recommendations for the assessment of MSFD Descriptor 3. Special request, Advice March 2014. Section 1.6.2.1.
ICES (2014b). Report of the Workshop to review the 2010 Commission Decision on criteria and methodological standards on good environmental status (GES) of marine waters; Descriptor 4 Foodwebs, 26–27 August 2014, ICES Headquarters, Denmark. ICES CM 2014\ACOM:60. 23 pp. Available online at http://www.ices.dk/sites/pub/Publication%20Reports/Expert%20Group%20Report/acom/2014/WKGMSFDD4/WKGMSFDD4%20Final%20Report%202014.pdf. Accessed 2 April 2016.
ICES (2015). ICES Special Request Advice. Section 1.6.2.1 EU request on revisions to Marine Strategy Framework Directive manuals for Descriptors 3, 4 and 6. Published 20 March 2015. Available online at http://www.ices.dk/sites/pub/Publication%20Reports/Advice/2015/Special_Requests/EU_Revisions_to_MSFD_manuals_for_Descriptors_346.pdf. Accessed 2 April 2016.
ICES, in prep. Workshop on guidance on the practical methodology for delivering an MSFD GES assessment on D3 for an MSFD region/subregion (WKGESFish).
ICES (2016_D3). ICES Special Request Advice Northeast Atlantic Ecoregion. 1.6.2.1 EU request to provide guidance on the practical methodology for delivering an MSFD GES assessment on D3 for an MSFD region/subregion. Published 13 May 2016. Copenhagen: International Council for the Exploration of the Sea. 4 pages.
JRC (2013). Guidance on Monitoring of Marine Litter in European Seas’. ISBN 978-92-79-32709-4. Luxembourg: Publications Office of the European Union. 124 pages. Available online at http://publications.jrc.ec.europa.eu/repository/bitstream/JRC83985/lb-na-26113-en-n.pdf. Accessed 27 October 2016.
ABPmer, November 2016, R.2733 | 128

Guidance for Assessments Under Article 8 of the Marine Strategy Framework Directive DG Environment
JRC (2015a). Review of Commission Decision 2010/477/EU concerning MSFD criteria for assessing good environmental status, Descriptor 9, contaminants in fish and other seafood for human consumption do not exceed levels established by Community legislation or other relevant standards. Document version 8.0: ComDecRev_D9_V8, 30 April 2015). Ispra: European Commission Joint Research Centre, Institute for Environment and Sustainability, Water Resources Unit. 23 pages.
OSPAR (2016). Common and candidate indicators.
STECF (2014). DCF Revision - part 4 (STECF-14-07). Scientific, Technical and Economic Committee for Fisheries (STECF) Publications Office of the European Union, Luxembourg, EUR 26612 EN, JRC 89788, 77 pp. Available online at https://stecf.jrc.ec.europa.eu/documents/43805/674708/2014-04_STECF+14-07+-+Review+of+DCF+part+4_JRC89788.pdf. Accessed 8 April 2016.
UNEP-MAP (2016). UNEP(DEPI)/MED IG.22/28 (EXCERPT - Decision IG.22/07) Decision IG.22/7 - Integrated Monitoring and Assessment Programme of the Mediterranean Sea and Coast and Related Assessment Criteria. Available online at https://wedocs.unep.org/rest/bitstreams/8385/retrieve. Accessed 23 November 2016.
van Leeuwen, S., Tett, P., Mills, D., van der Molen, J. (2015). Stratified and nonstratified areas in the North Sea: Long-term variability and biological and policy implications. Journal of Geophysical Research: Oceans 120(7): 4670–4686, doi: 10.1002/2014JC010485. Available online at http://onlinelibrary.wiley.com/doi/10.1002/2014JC010485/epdf. Accessed 21 May 2016.
WG GES (2011). Common Understanding of (Initial) Assessment, Determination of Good Environmental Status (GES) and Establishment of Environmental Targets (Articles 8, 9 and 10 MFSD).
ABPmer, November 2016, R.2733 | 129

Guidance for Assessments Under Article 8 of the Marine Strategy Framework Directive DG Environment
6 AbbreviationsABPmer ABP Marine Environmental Research LtdASCOBANS Agreement on Conservation of Small Cetaceans in the Baltic, North East
Atlantic, Irish and North SeasBSC Black Sea CommissionBSC PS BSC Permanent SecretariatBS SAP Black Sea Strategic Action PlanBSIMAP Black Sea Integrated Monitoring and Assessment ProgrammeCFP Common Fisheries PolicyDCF Data Collection FrameworkDG GES Drafting Group on Good Environmental Status DIN Dissolved inorganic nitrogenDIP Dissolved inorganic phosphorus EEA European Environment AgencyEQR Ecological Quality RatioEQS Environmental Quality StandardsEU European UnionFAO Food and Agriculture Organisation of the United NationsGES Good Environmental StatusGFCM General Fisheries Commission for the MediterraneanHELCOM Baltic Marine Environment Protection Commission – Helsinki CommissionICCAT International Commission for the Conservation of Atlantic TunasICES International Council for the Exploration of the SeaInd IndicatorIUCN International Union for the Conservation of NatureJRC Joint Research Council JWGBIRD Joint OSPAR/HELCOM/ICES Expert Group on SeabirdsMSCG Marine Strategy Coordination GroupMSFD Marine Strategy Framework DirectiveOOAO One-out-all-outOSPAR Oslo-Paris ConventionPAHs Polyaromatic hydrocarbonPBTs Persistent, bioaccumulative and toxic substances PCBs Polychlorinated biphenylsPETS Protected, endangered and threatened speciesRBSPs River Basin Specific PollutantsRCG Regional Coordination GroupRSC Regional Sea ConventionTN Total nitrogen TP Total phosphorus UNEP-MAP United Nations Environment Programme – Mediterranean Action PlanSpp. SpeciesSTECF Scientific, Technical and Economic Committee for FisheriesWFD Water Framework DirectiveWG GES Working Group on Good Environmental StatusWG DIKE Working Group on Data, Information and Knowledge Exchange
Cardinal points/directions are used unless otherwise stated.SI units are used unless otherwise stated.
ABPmer, November 2016, R.2733 | 130

Appendices

Guidance for Assessments Under Article 8 of the Marine Strategy Framework Directive DG Environment
A Mapping of RSC Indicators Against Revised Commission Decision
The following tables summarise the regional indicators relevant to each of the criteria in the revised Commission Decision, split into Part I and Part II as in the Decision. It is based on the information available as of 22 November 2016. Indicators may be subject to revision. If an indicator is allocated to a criterion, this does not imply that all aspects of the criterion are adequately covered by the indicator. Some indicators may require disaggregation or further modification to align to the revised COM Dec criteria.
ABPmer, November 2016, R.2733 | A1
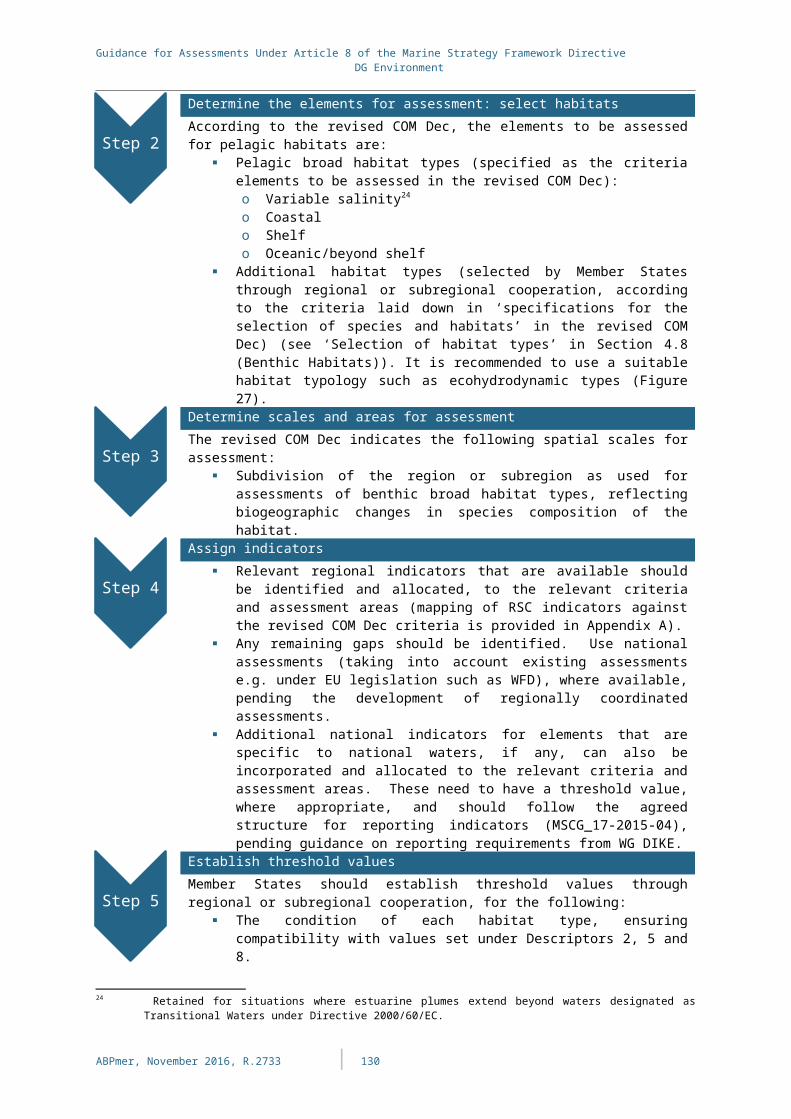
Guidance for Assessments Under Article 8 of the Marine Strategy Framework Directive DG Environment
Table A43. Part I: Assessment of predominant pressures and impacts under Article 8(1)(b) MSFDCriteria
HELCOM1 OSPAR2 UNEP-MAP3 BSC4
D2
D2C1 Trends in arrival of new non-indigenous species
Rate of new introductions of NIS (II, III, IV)
Number of new introduced non-indigenous species (for each 6 years)
D2C2 Trends in abundance of non-indigenous species5
Non-native/invasive mammal presence on island seabird colonies (CI, NP) (OSPAR identifies this under D1 Birds)
Trends in abundance, temporal occurrence, and spatial distribution of non-indigenous species, particularly invasive, non-indigenous species, notably in risk areas (in relation to the main vectors and pathways of spreading of such species in the water column and seabed, as appropriate) (Common Indicator 6)
Gelatinous macrozooplankton biomass and abundance (relating to NIS Mnemiopsis leidyi and Beroe ovata)
Mnemiopsis leidyi biomass
D2C3 Ecosystem impacts of particularly invasive species
Ratio between non-indigenous invasive species and native species in some well-studied taxonomic groups
D3C1 ICES – Fmsy Brill ICES – Fmsy Cod (2 stocks) ICES – Fmsy Dab ICES – Fmsy Flounder (4 stocks) ICES – Fmsy Herring (5 stocks) ICES – Fmsy Plaice ICES – Fmsy Salmon (2 stocks) ICES – Fmsy Sole ICES – Fmsy Sprat ICES – Fmsy Sea trout ICES – Fmsy Turbot ICES – Fmsy Eel
Fishing mortality (Common Indicator 9)
Catch per unit of effort (CPUE) or Landing per unit of effort (LPUE) as a proxy (Common Indicator 11)
Fishing mortality Number and name of stocks
below biological safety limits (BSL)
D3C2 ICES – SSB Brill ICES – SSB Cod (2 stocks) ICES – SSB Dab ICES – SSB Flounder (4 stocks) ICES – SSB Herring (5 stocks) ICES – SSB Plaice ICES – SSB Salmon (2 stocks) ICES – SSB Sole ICES – SSB Sprat ICES – SSB Sea trout ICES – SSB Turbot ICES – SSB Eel
Spawning stock biomass (Common Indicator 7)
Stock assessment: total biomass Stock assessment: spawning
biomass Catches per unit of effort (CPUE)
on surveys Number and name of stocks
below biological safety limits (BSL)
D3C3
ABPmer, November 2016, R.2733 | A2

Guidance for Assessments Under Article 8 of the Marine Strategy Framework Directive DG Environment
Criteria
HELCOM1 OSPAR2 UNEP-MAP3 BSC4
D5C1 Dissolved Inorganic Nitrogen (DIN)
Dissolved Inorganic Phosphorus (DIP)
Total Nitrogen Total Phosphorus
Winter nutrient concentrations (II, III, IV)
Concentration of key nutrients in water column (Common Indicator 13)
Nutrient ratios (silica, nitrogen and phosphorus) where appropriate*
TRIX eutrophication index (combines nutrients, chlorophyll and oxygen)*
BEAST (Black Sea Eutrophication Assessment Tool): Core set indicators grouped as causes - inorganic nitrogen, inorganic phosphorus (phosphates)
Inorganic N, P, Si in the surface layer, end of winter-spring *
Ninorganic /Pinorganic in surface layerD5C2 Chlorophyll-a concentrations Chlorophyll concentration (II, III,
IV) Chlorophyll-a concentration in
water column (Common Indicator 14)
BEAST (Black Sea Eutrophication Assessment Tool): Core set indicators grouped as causes - direct effects - chlorophyll a
Chlorophyll-a (seasonal trends for the last 3 years)
D5C3 Cyanobacterial surface accumulation
Species shift/indicator species: Nuisance species Phaeocystis (II)
Biomass of Noctiluca (%)
D5C4 Water clarity (Secchi depth) Water transparency, where relevant
Water transparency, where relevant
D5C5 Oxygen debt Shallow water bottom oxygen
debt
Oxygen (II, III, IV) Dissolved oxygen near the bottom, i.e. changes due to increased organic matter decomposition, and size of the area concerned
Oxygen saturation level at critical depth: in bottom layer in coastal waters (up to 50 m depth) in late summer
Oxygen saturation level at critical depth: for deep water column sigma-T equals to 15,4-15,5 in late summer
BEAST (Black Sea Eutrophication Assessment Tool): Core set indicators grouped as causes - indirect effects - bottom oxygen (where available), Secchi.*
D5C6D5C7 WFD indicators on macrophytes Macrophytobenthos (EEIc)D5C8 WFD indicators on macrofauna
collated in EUTRO-OPER State of the soft-sediment
macrofauna community (BQI)
Macrozoobenthos (M-AMBI)
D6 D6C1 Baltic Sea Pressure Index – 'loss of seabed'
Area of habitat loss (CI, NP)
D6C2 Baltic Sea Pressure Index – 'physical disturbance to seabed’
Physical damage of predominant and special habitats (II, III, IV)
D6C3 Cumulative impact on benthic biotopes (under development, not available for HOLAS II); in the
ABPmer, November 2016, R.2733 | A3

Guidance for Assessments Under Article 8 of the Marine Strategy Framework Directive DG Environment
Criteria
HELCOM1 OSPAR2 UNEP-MAP3 BSC4
interim: qualitative description from Baltic Sea Impact Index
D7
D7C1 Qualitative description from Baltic Sea Impact Index
Extent of area affected – physical (CI, NP)
Length of coastline subject to physical disturbance due to the influence of man-made structures (Common Indicator 16)
Land use change (CI 25) Impact on the circulation caused
by the presence of structuresD7C2 Qualitative description from
Baltic Sea Impact Index Spatial extent of habitats
affected (CI, NP) Changes in habitat functions (CI,
NP)
Location and extent of the habitats impacted directly by hydrographic alterations (Common Indicator 15)
D8C1 WFD national chemical status assessments (coastal and territorial waters only)
WFD national ecological status assessments (coastal waters only)
Contaminant concentrations in biota and sediment: Hexabromocyclododecane
(HBCDD) Metals (Cd, Pb, Hg) Polybrominated biphenyl ethers
(PBDE) Polychlorinated biphenyls (PCB)
and dioxins and furans Polyaromatic hydrocarbons (PAH)
and their metabolites (also relevant to D8C2)
TBT and imposex (also relevant to D8C2)
Perfluorooctane sulphonate (PFOS)
Radioactive substances
Metal (Hg, Cd, Pb) concentrations in biota (II, III, IV)
Metal (Hg, Cd, Pb) concentrations in sediment (II, III, IV)
PCB concentrations in biota (II, III, IV)
PCB concentrations in sediments (II, III, IV)
PAHs concentrations in biota (II, III, IV)
PAHs concentrations in sediments (II, III, IV)
Organotin concentrations in biota (CI, NP)
Organotin concentrations in sediments (II, III, IV)
PBDE concentrations in biota (II, III, IV)
PBDE concentrations in sediments (II, III, IV)
HCB (hexachlorobenzene) concentrations in biota (CI, NP)
HCB (hexachlorobenzene) concentrations in sediment
HCBD (hexachlorobutadiene) concentrations in biota (CI, NP)
HCBD (hexachlorobutadiene) concentrations in sediments (CI, NP)
Concentration of key harmful contaminants measured in the relevant matrix (related to biota, sediment, seawater) (Common Indicator 17)
Standards for priority substances have been proposed for common use in the Black Sea
D8C2 TBT and imposex White-tailed eagle productivity
Imposex/intersex (II, III, IV) Externally visible fish diseases
Level of pollution effects of key contaminants where a cause and
ABPmer, November 2016, R.2733 | A4

Guidance for Assessments Under Article 8 of the Marine Strategy Framework Directive DG Environment
Criteria
HELCOM1 OSPAR2 UNEP-MAP3 BSC4
(coastal and territorial waters only)
Reproductive disorders: malformed eelpout and amphipod embryos (FI&SE supplementary indicator)
(CI, NP) Lysosomal stability (LMS) (CI, NP) Bile metabolites (of PAHs) (CI,
NP) Micronuclei (MN) (CI, NP) EROD (CI, NP)
effect relationship has been established (Common Indicator 18)
D8C3 Operational oil-spills from ships Oiled birds (CI) Occurrence, origin (where possible), extent of acute pollution events (e.g. slicks from oil, oil products and hazardous substances), and their impact on biota affected by this pollution (Common Indicator 19)
Number, volume, location and causes of accidental pollution/spills (from ships)
Number, volume and location of illegal pollution/spills (from ships)
D8C4
D9
D9C1 Actual levels of contaminants that have been detected and number of contaminants which have exceeded maximum regulatory levels in commonly consumed seafood (Common Indicator 20)
Percentage of intestinal enterococci concentration measurements within established standards (Common Indicator 21)
D10 D10C1 Beach litter Litter on the seafloor
Beach litter (II, III, IV) Litter on the sea floor (II, III, IV)
Trends in the amount of litter washed ashore and/or deposited on coastlines (Common Indicator 22)
Trends in the amount of litter in the water column including microplastics and on the seafloor Common Indicator 23)
D10C2 Microplastics (CI, NP) Trends in the amount of litter in the water column including microplastics and on the seafloor (Common Indicator 23)
D10C3 Fulmar litter ingestion (impact and floating litter) (II)
Trends in the amount of litter ingested by or entangling marine organisms focusing on selected mammals, marine birds, and marine turtles (CI 24)
D10C4 Trends in the amount of litter
ABPmer, November 2016, R.2733 | A5

Guidance for Assessments Under Article 8 of the Marine Strategy Framework Directive DG Environment
Criteria
HELCOM1 OSPAR2 UNEP-MAP3 BSC4
ingested by or entangling marine organisms focusing on selected mammals, marine birds, and marine turtles (CI 24)
D11
D11C1 Distribution in time and space of loud low- and mid-frequency impulsive sounds
Impulsive noise (II, III, IV) Proportion of days and geographical distribution where loud, low, and mid-frequency impulsive sounds exceed levels that are likely to entail significant impact on marine animals (CI 26)
D11C2 Continuous low frequency anthropogenic sound
Ambient noise (CI, NP) Levels of continuous low frequency sounds with the use of models as appropriate (CI 27)
* Indicator may require disaggregation, or includes elements that are not specified in the COM Dec criteria elements, and therefore might require further modification .
1 Core and pre-core indicators, under consideration for inclusion in HOLAS II included. Indicators in italics are not yet (regionally) operation and development is ongoing with the aim to use in HOLAS II. Candidate indicators are not included.
2 OSPAR regions for which the indicator will be operational for the Interim Assessment 2017 are indicated in brackets. Indicators in italics are candidate indicators, not prioritised indicators or indicators without an assessment value.
3 UNEP-MAP indicators without a common indicator or CI number have been added from an EEA compilation of RSC indicators.4 BSC indicators are those for annual reporting to the Black Sea Commission. They have been allocated to the revised COM Dec criteria as closely as possible. It should
be noted that Bulgaria and Romania have concerns over the applicability of BSC indicators and thresholds to MSFD objectives and are therefore working on separate common agreed indicators on a bilateral level.
5 HELCOM identifies this indicator as relevant to D2C1, however D2C1 specifically relates to the number of new introductions whereas the HELCOM indicator relates to trends in abundance and therefore is more relevant to D2C2
CI Candidate indicatorNP Not prioritised
Sources: HELCOM, 2016; OSPAR, 2016; UNEP-MAP, 2016; BSC, 2016.
ABPmer, November 2016, R.2733 | A6

Guidance for Assessments Under Article 8 of the Marine Strategy Framework Directive DG Environment
Table A44. Part II: Assessment of essential features and characteristics and current environmental status under of marine waters under Article 8(1)(a) MSFDCriteria HELCOM1 OSPAR2 UNEP-MAP BSC3
D1Birds
D1C1 Number of drowned mammals and waterbirds in fishing gear
Marine bird bycatch (CI, NP) Bycatch of vulnerable and non-target species (Common Indicator 12)
D1C2 Abundance of waterbirds in the breeding season (grazing, wading, surface-feeding, pelagic-feeding and benthic-feeding bird species groups)
Abundance of waterbirds in the wintering season (grazing, wading, surface-feeding, pelagic-feeding and benthic-feeding bird species groups)
Marine bird abundance (II, III, IV, case study for I)
Population abundance of selected species (related to marine mammals, seabirds, marine reptiles) (Common Indicator 4)
D1C3 Breeding status of marine birds (II, III, IV, case study for I)
Breeding success of kittiwake (CI, NP)
Reproductive success of marine birds in relation to food availability (CI, NP) (OSPAR identifies this against D4)
Population demographic characteristics (body size or age class structure, sex ratio, fecundity rates, survival/mortality rates related to marine mammals, seabirds, marine reptiles) (Common Indicator 5)
D1C4 Distribution marine birds (CI, NP)*
Species distributional range (related to marine mammals, seabirds, marine reptiles) (Common Indicator 3)
D1C5D1
MammalsD1C1 Number of drowned
mammals and waterbirds in fishing gear
Marine mammal bycatch (II) Bycatch of vulnerable and non-target species (Common Indicator 12)
By-catches: cetaceans
D1C2 Population trends and abundance of seals
Seal abundance and distribution (II)*
Cetacean abundance and distribution (II, III, IV)*
Population abundance of selected species (related to marine mammals, seabirds, marine reptiles) (Common Indicator 4)
D1C3 Nutritional status of seals Reproductive status of
seals
Grey seal pup production (II, III) Population demographic characteristics (body size or age class structure, sex ratio, fecundity rates, survival/mortality rates related to marine mammals, seabirds, marine reptiles) (Common Indicator 5)
ABPmer, November 2016, R.2733 | A7

Guidance for Assessments Under Article 8 of the Marine Strategy Framework Directive DG Environment
Criteria HELCOM1 OSPAR2 UNEP-MAP BSC3
D1C4 Distribution of Baltic seals Seal abundance and distribution (II)*
Cetacean abundance and distribution (II, III, IV)*
Species distributional range (related to marine mammals, seabirds, marine reptiles) (Common Indicator 3)
D1C5
D1Reptiles
D1C1 N/a Bycatch of vulnerable and non-target species (Common Indicator 12)
N/a
D1C2 N/a Population abundance of selected species (related to marine mammals, seabirds, marine reptiles) (Common Indicator 4)
N/a
D1C3 N/a Population demographic characteristics (body size or age class structure, sex ratio, fecundity rates, survival/mortality rates related to marine mammals, seabirds, marine reptiles) (Common Indicator 5)
N/a
D1C4 N/a Species distributional range (related to marine mammals, seabirds, marine reptiles) (Common Indicator 3)
N/a
D1C5 N/a N/a
D1Fish
D1C1 By-catch rates of Chondrichthyes (CI, NP)
Bycatch of vulnerable and non-target species (Common Indicator 12)
By-catches: vulnerable species (sturgeons etc)
D1C2 Abundance of key coastal fish species
Abundance of coastal fish key functional groups
Abundance of seatrout spawners and parr
Abundance of salmon spawners and smolt
See also D3C2
Fish abundance (II, III)* Conservation status of
elasmobranch and demersal bony-fish species (IUCN) (CI, NP)
D1C3 Primary or secondary
See D3C3 Mean maximum length of demersal fish and elasmobranchs (CI, case study for II, III, IV)*
Proportion of mature fish (CI, NP)*
D1C4 Primary or secondary
Distributional range (CI, NP)* Fish distributional pattern (CI,
NP)*
ABPmer, November 2016, R.2733 | A8
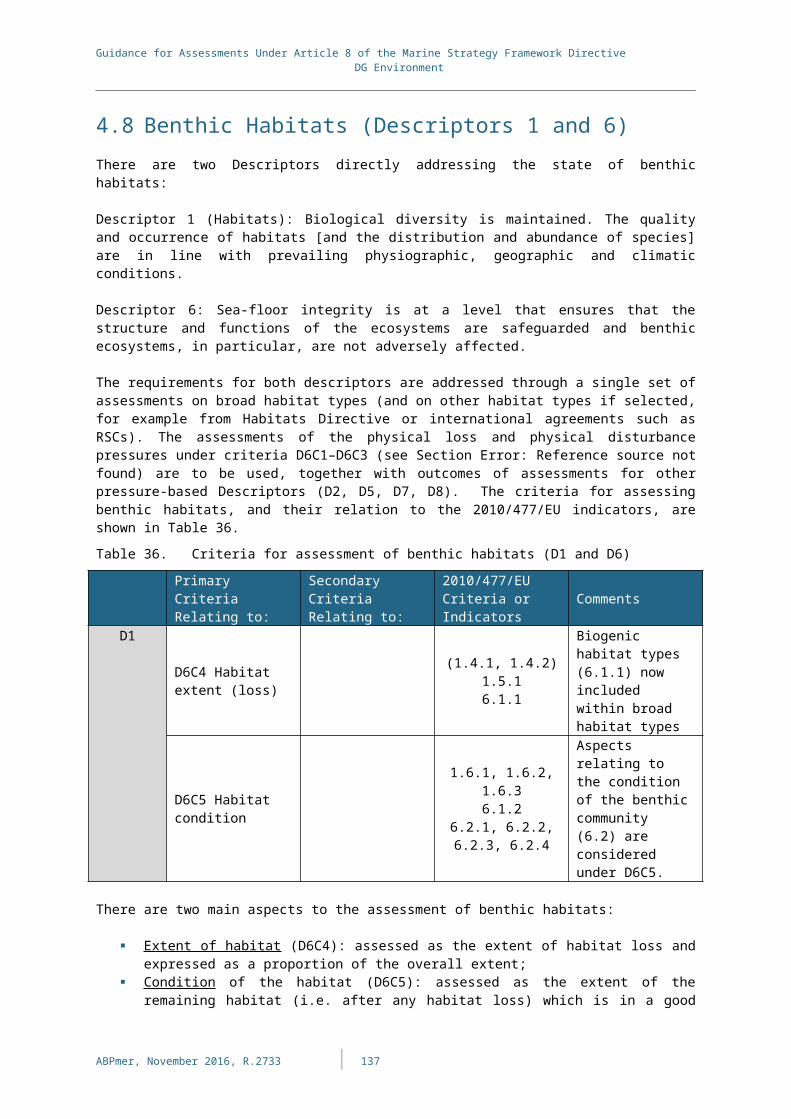
Guidance for Assessments Under Article 8 of the Marine Strategy Framework Directive DG Environment
Criteria HELCOM1 OSPAR2 UNEP-MAP BSC3
D1C5 Primary or secondary
D1Cephalopods
D1C1 N/aD1C2 N/aD1C3 Primaryor secondary
N/a
D1C4 N/aD1C5 N/a
D1Pelagic habitats
D1C6 Zooplankton mean size and total stock
Seasonal succession of functional phytoplankton groups
Diatom-Dinoflagellate index Phytoplankton community
composition as a foodweb indicator
Changes of plankton functional types (life form) index Ratio (II, III, IV)
Plankton biomass and/or abundance (II, III, IV)
Changes in biodiversity index(s) (III)
Phytoplankton biomass (seasonal trends for the last 3 years) (CBD indicator)
Phytoplankton abundance (seasonal trends for the last 3 years)
Max concentration of blooming species
Diatoms/Dinoflagellates biomass ratio (only for spring)
H-Shannon 95 (biomass)
Mesozooplankton biomass (for 3 years)
Mesozooplankton H-Shannon (biomass, abundance)
Gelatinous macrozooplankton biomass and abundance
D1&6Benthic habitats
D6C4 Cumulative impact on benthic biotopes (under development; not available for HOLAS II). In the interim: qualitative description from Baltic Sea Impact Index
Habitat distributional range to also consider habitat extent as a relevant attribute (Common Indicator 1)*
D6C5 Condition of benthic habitats
Typical species composition (CI, NP)
Condition of benthic habitat defining communities. (Multi-metric indices) (II, III, IV)
Size-frequency distribution of bivalve or other sensitive/indicator species (CI, NP)
Condition of the habitat’s typical species and communities (Common Indicator 2)
ABPmer, November 2016, R.2733 | A9
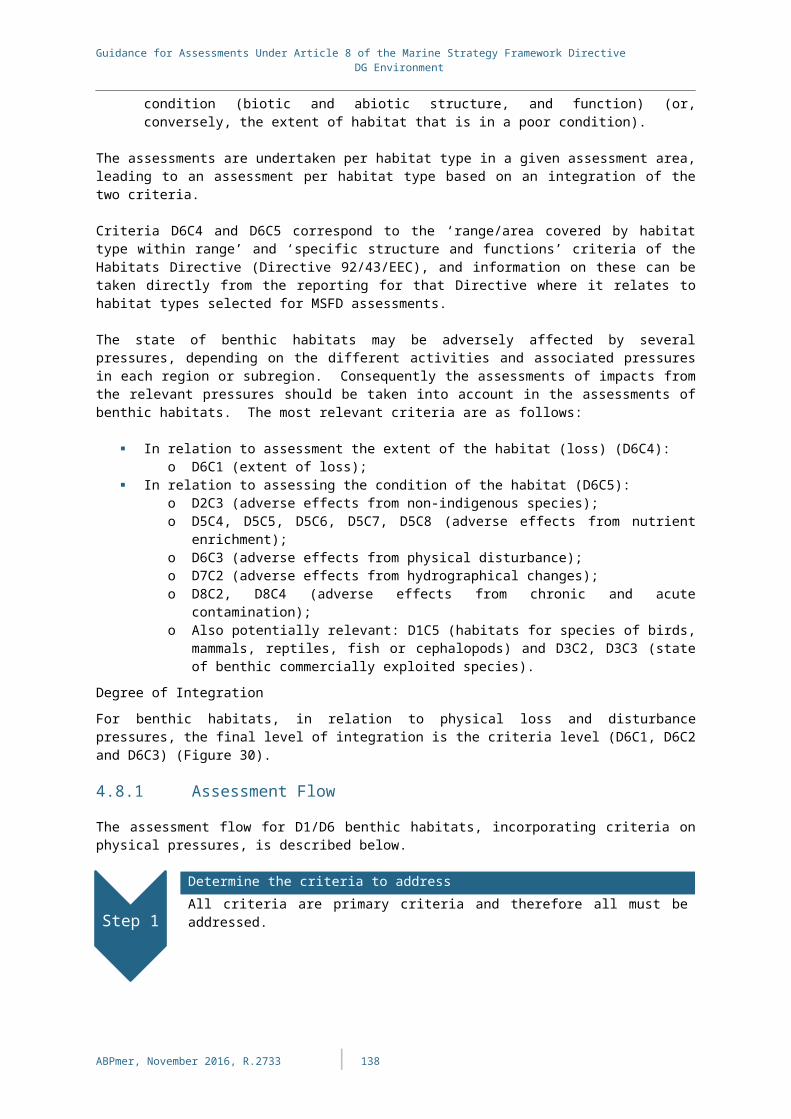
Guidance for Assessments Under Article 8 of the Marine Strategy Framework Directive DG Environment
Criteria HELCOM1 OSPAR2 UNEP-MAP BSC3
D4
D4C1Diversity
NB linkage of HELCOM core indicators with D4 criteria has not yet been discussed in the HELCOM expert community. Status of the soft-bottom
macrozoobenthos (BQI) Phytoplankton community
composition as a foodweb indicator
OSPAR EcoQO proportion of large fish (LFI) (II, III)
Biomass, species composition and spatial distribution of zooplankton (CI, NP)
Ecological Network Analysis diversity (CI, NP)
H-Shannon 95 (biomass) (phytoplankton)
Mesozooplankton H-Shannon (biomass, abundance)
D4C2Balance of abundance between guilds
NB linkage of HELCOM core indicators with D4 criteria has not yet been discussed in the HELCOM expert community.
Changes in average trophic level of marine predators (cf MTI) (IV)
Biomass trophic spectrum (CI, NP)
D4C3Size distribution
NB linkage of HELCOM core indicators with D4 criteria has not yet been discussed in the HELCOM expert community. Proportion of large fish in
the offshore community Zooplankton mean size and
total stock
Size composition in fish communities (LFI) (II, III, IV)
D4C4Productivity
Population trends and abundance of seals
Abundance of key coastal fish species
Abundance of coastal fish key functional groups
Abundance of seatrout spawners and parr
Abundance of salmon spawners and smolt
Abundance of waterbirds in the breeding season
Abundance of waterbirds in the wintering season
Biomass, species composition and spatial distribution of zooplankton (CI, NP)
Fish biomass and abundance of dietary functional groups (CI, NP)
Reproductive success of marine birds in relation to food availability (CI, NP)
Production of phytoplankton (case studies for regions II, III, IV)
Phytoplankton abundance (seasonal trends for the last 3 years)
Diatoms/Dinoflagellates biomass ratio (only for spring)
Mesozooplankton biomass (for 3 years)
Gellatinous macrozooplankton biomass and abundance
Those in italics have been added from an EEA compilation of RSC indicators and may be subject to revision.* Indicator may require disaggregation, or includes elements that are not specified in the COM Dec criteria elements, and therefore might require further modification .
1 Core and pre-core indicators, under consideration for inclusion in HOLAS II included. Indicators in italics are not yet (regionally) operational and development is ongoing with the aim to use in HOLAS II. Candidate indicators are not included.
2 OSPAR regions for which the indicator will be operational for the Interim Assessment 2017 are indicated in brackets. Indicators in italics are candidate indicators, not prioritised indicators or indicators without an assessment value.
3 BSC indicators are those for annual reporting to the Black Sea Commission. They have been allocated to the revised COM Dec criteria as closely as possible. It should be noted that Bulgaria and Romania have concerns over the applicability of BSC indicators and thresholds to MSFD objectives and are therefore working on separate common agreed indicators on a bilateral level.
CI Candidate indicatorNP Not prioritised
ABPmer, November 2016, R.2733 | A10

Guidance for Assessments Under Article 8 of the Marine Strategy Framework Directive DG Environment
Sources: HELCOM, 2016; OSPAR, 2016; UNEP-MAP, 2016; BSC, 2016.
ABPmer, November 2016, R.2733 | A11

Guidance for Assessments Under Article 8 of the Marine Strategy Framework Directive DG Environment
B Lists of Criteria Elements, Threshold Values and Integration Rules
The following tables summarise the requirements for establishing criteria elements, threshold values and criteria integration rules under the revised Commission Decision, split into Part I and Part II as in the Decision. Primary criteria are shown in bold; secondary criteria are shown in normal font.
ABPmer, November 2016, R.2733 | B1

Guidance for Assessments Under Article 8 of the Marine Strategy Framework Directive DG Environment
Table B0. Part I: Assessment of predominant pressures and impacts under Article 8(1)(b) MSFDCriteria List of elements Threshold values Criteria integration rules
D2
D2C1 Primary Defined in Decision Establish: (sub)region Used to assess D2D2C2 Secondary
Establish: (sub)region None Contributes to D2C3
D2C3 Secondary
Establish: (sub)region Establish: (sub)region Contributes to D1 Species,D1 Pelagic habitats andD1 & D6 Benthic habitats
D3
D3C1 Establish: (sub)region Existing: consult scientific bodies in accordance with Reg (EU) No 1380/2013
Establish: Union level
D3C2 Establish: (sub)region Existing: consult scientific bodies in accordance with Reg (EU) No 1380/2013
Establish: Union level
D3C3 Establish: (sub)region Establish: (sub)region in accordance withReg (EU) No 1380/2013
Establish: Union level
D5
D5C1 Establish: (sub)region Coastal waters:Existing: Directive 2000/60/ECBeyond coastal waters:Establish: (sub)region consistent withDirective 2000/60/EC
Coastal waters: in accordance with Directive 2000/60/ECBeyond coastal waters:Establish: where possible at Union level,but at least at regional or subregional level
D5C2 Defined in Decision See D5C1 See D5C1Contributes to D1 Pelagic habitats
D5C3 Defined in Decision Establish: (sub)region See D5C1Contributes to D1 Pelagic habitats
D5C4 Defined in Decision See D5C1 See D5C1Contributes to D1 Pelagic habitats andD1 & D6 Benthic habitats
D5C5 Defined in Decision See D5C1 See D5C1Contributes to D1 & D6 Benthic habitats
D5C6 Defined in Decision See D5C1 See D5C1Contributes to D1 & D6 Benthic habitats
D5C7 Defined in Decision See D5C1 See D5C1Contributes to D1 & D6 Benthic habitats
D5C8 Defined in Decision See D5C1 See D5C1Contributes to D1 & D6 Benthic habitats
D6D6C1 Defined in Decision None Used to assess D6C4 and D7C1D6C2 Defined in Decision None Used to assess D6C3D6C3 As used for benthic habitats under D1 & D6
(see Part II)Establish: (sub)region Contributes to D6C5
D7D7C1 Defined in Decision None Used to assess D7C2D7C2 As used for benthic habitats under D1 & D6
(see Part II)Establish: (sub)region Contributes to D6C5
D8 D8C1 Coastal and territorial waters:As used in WFD (EQS and RBSPs)Additional contaminants: establish (sub)regionBeyond territorial waters:
As defined under WFD, or if no value is set, then establish: (sub)region
Contributes to D8
ABPmer, November 2016, R.2733 | B2

Guidance for Assessments Under Article 8 of the Marine Strategy Framework Directive DG Environment
Criteria List of elements Threshold values Criteria integration rulesAs for coastal waters if appropriate;Additional contaminants, establish: (sub)region
D8C2 Establish: (sub)region Establish: (sub)region Use in D8 assessment, establish: (sub)regionContributes to D1 Species and D1 & D6 Benthic habitats
D8C3 Defined in Decision (‘significant’ still requires definition)
None Contributes to D8Triggers assessment of D8C4
D8C4 As used for species groups under D1 and benthic habitats under D1 & D6 (see Part II)
None Establish: (sub)region
D9D9C1 As listed in Reg (EC) No 1881/2006.
Additional contaminants,establish: (sub)region
As defined in Reg (EC) 1881/2006Additional contaminants, establish: (sub)region
None
D10
D10C1 Defined in Decision (Member States may define further subcategories)
Establish: Union level, taking into account (sub)regional specificities
Establish: Union level
D10C2 Defined in Decision Establish: Union level, taking into account (sub)regional specificities
Establish: Union level
D10C3 Establish: (sub)region Establish: (sub)region Establish: Union levelContributes to D1 Species
D10C4 Establish: (sub)region Establish: (sub)region Establish: Union levelContributes to D1 Species
D11D11C1 Defined in Decision Establish: Union level, taking into account
(sub)regional specificitiesEstablish: Union levelContributes to D1 Species
D11C2 Defined in Decision Establish: Union level, taking into account (sub)regional specificities
Establish: Union levelContributes to D1 Species
ABPmer, November 2016, R.2733 | B3
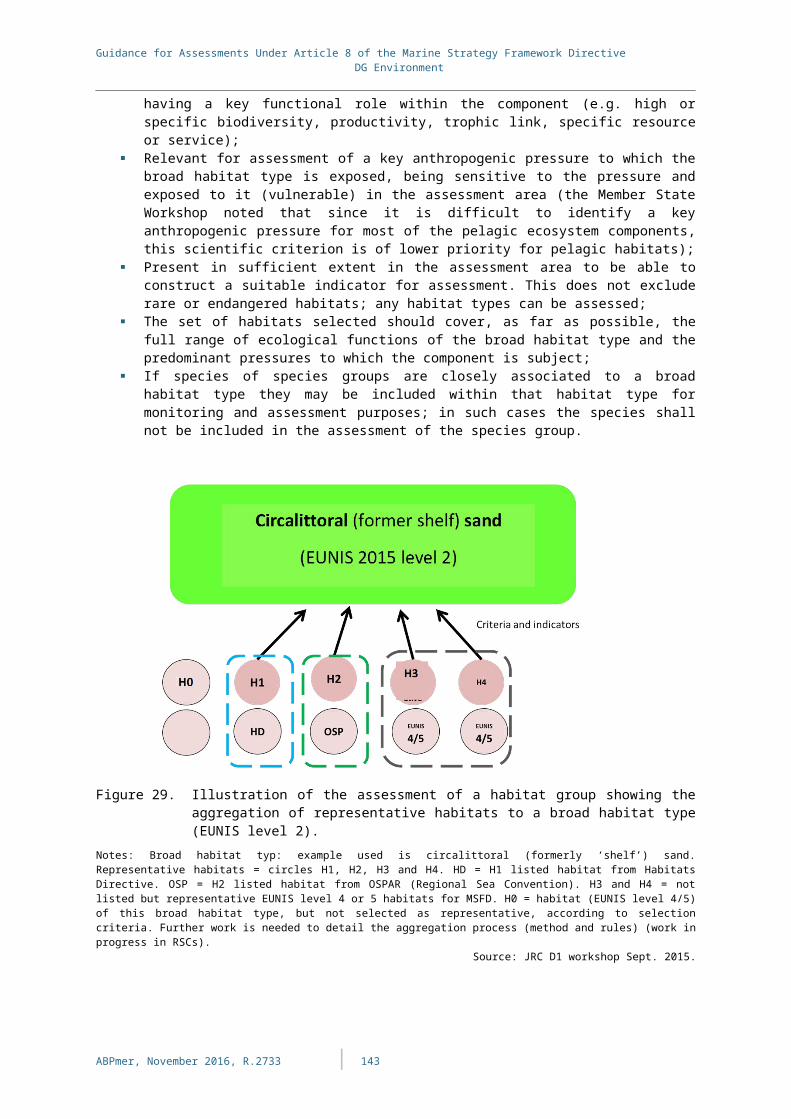
Guidance for Assessments Under Article 8 of the Marine Strategy Framework Directive DG Environment
Table B1. Part II: Assessment of essential features and characteristics and current environmental status under of marine waters under Article 8(1)(a) MSFDCriteria List of elements Threshold values Criteria integration rules
D1Birds
D1C1 Establish: (sub)region Establish: (sub)region Contributes to D1C2D1C2 Establish: (sub)region Establish: (sub)region Establish: Union level, taking into account
(sub)regional specificities (for species’ status, and for species group status)
D1C3 Establish: (sub)regionD1C4 Establish: (sub)regionD1C5 None
D1 Mammals
D1C1 Primary or secondary
Establish: (sub)region Establish: (sub)region Contributes to D1C2
D1C2 Establish: (sub)region Establish: (sub)regionConsistent with Directive 92/43/EEC
Species status: the method provided under Directive 92/43/EECSpecies group status:Establish: Union level, taking into account (sub)regional specificities
D1C3 Establish: (sub)regionD1C4 Establish: (sub)region
Consistent with Directive 92/43/EEC
D1C5 None
D1Reptiles
D1C1 Primary or secondary
Establish: (sub)region Establish: (sub)region Contributes to D1C2
D1C2 Establish: (sub)region Establish: (sub)regionConsistent with Directive 92/43/EEC
Species status: the method provided under Directive 92/43/EECSpecies group status:Establish: Union level, taking into account (sub)regional specificities
D1C3 Establish: (sub)regionD1C4 Establish: (sub)region
Consistent with Directive 92/43/EEC
D1C5 None
D1Fish
D1C1 Primary or secondary
Establish: (sub)region Establish: (sub)region Contributes to D1C2
D1C2 Establish: (sub)region Establish: (sub)regionConsistent with Directive 92/43/EEC where appropriate
Species status:For species under Directive 92/43/EEC: the method provided under that DirectiveFor commercially exploited species status: as assessed under Descriptor 3Other species: establish: Union level, taking into account (sub)regional specificitiesSpecies group status:Establish: Union level, taking into account (sub)regional specificities
D1C3 Primary or secondary
Establish: (sub)region
D1C4 Primary or secondary
Establish: (sub)regionConsistent with Directive 92/43/EEC where appropriate
D1C5 Primary or secondary
None
D1Cephalopods
D1C1 Primary or secondary
Establish: (sub)region Establish: (sub)region Contributes to D1C2
D1C2 Establish: (sub)region Establish: (sub)region Species status:For commercially exploited species status: as assessed under Descriptor 3Other species: establish: Union level, taking into account (sub)regional specificitiesSpecies group status:
D1C3 Primary or secondary
Establish: (sub)region
D1C4 Establish: (sub)regionD1C5 None
ABPmer, November 2016, R.2733 | B4

Guidance for Assessments Under Article 8 of the Marine Strategy Framework Directive DG Environment
Criteria List of elements Threshold values Criteria integration rulesEstablish: Union level, taking into account (sub)regional specificities
D1Pelagic habitats
D1C6 Defined in DecisionAdditional habitat types, establish: (sub)region
Establish: (sub)region To level of broad habitat type
D1&6 Benthic habitats
D6C4 Defined in DecisionOther habitat types. Establish: (sub)region
Establish: Union level, taking into account (sub)regional specificities
Status of the habitat typeestablish: Union level
D6C5 Establish: Union level, taking into account (sub)regional specificities (for adverse effects on condition, and for the maximum allowable extent of adverse effects)
D4D4C1 Establish: (sub)region Establish: (sub)region NoneD4C2 Establish: (sub)region NoneD4C3 Establish: (sub)region NoneD4C4 Establish: (sub)region None
ABPmer, November 2016, R.2733 | B5